water quality trading plan n - wisconsin dnr
TRANSCRIPT
J:\6236 - Norway Comp Alts\9.0 Reports\9.4 Memos\Title Page_WQT Plan.docx
WATER QUALITY TRADING PLAN TOWN OF NORWAY SANITARY DISTRICT NO.1
FEBRUARY 2020
Prepared by:
Applied Technologies, Inc. 13400 Bishops Lane, Suite 270
Brookfield, WI 53005 (262) 784-7690
PN6236
J:\6236 - Norway Comp Alts\9.0 Reports\9.4 Memos\Norway Water Quality Trading Plan.docx
TABLE OF CONTENTS
Section 1 – Executive Summary ..................................................................................................... 1
Section 2 – Water Quality Trading Plan ......................................................................................... 2
Appendix
1
SECTION 1 EXECUTIVE SUMMARY
The Town of Norway Sanitary District No. 1 (District) owns and operates a wastewater treatment
plant (WWTP) with an interim total phosphorus (TP) effluent limit of 1.0 mg/L. The Water Quality
Based Effluent Limits (WQBELs) for TP will decrease to 0.075 mg/L, expected to begin in 2022.
The District submitted a Final Compliance Alternatives Plan (CAP) to the Wisconsin Department
of Natural Resources (WDNR) in July 2019. The Final CAP documented the District’s continued
efforts to reduce phosphorus loadings in its effluent, evaluated compliance alternatives, and
identified the actions that will be implemented to meet the final phosphorus WQBELs.
Operational improvements and minor facility modifications alone would not enable the District to
meet the new ultra-low effluent limits. Based on the Final CAP, it was recommended that the
District achieve compliance using chemical phosphorus removal to reduce most of the effluent
phosphorus load, and water quality trading (WQT) for the remaining required reductions.
A Water Quality Trade agreement was reached on September 27, 2019. Lindsey Drought plans to
plant annual small grain cover crops on 114 acres, which will reduce phosphorus loadings to the
watershed by 102 pounds per year. The District applied to register this nonpoint-to-point source
trade. The District will provide a cost-share payment for Ms. Drought to plant annual small grain
cover crops. In exchange, the District will receive the Water Quality Trading credits generated by
this best management practice (BMP).
Based on a downstream trade ratio of 2.4, the District will be able to apply approximately 43
pounds per year toward meeting its annual WQBEL requirements. In the submitted Final CAP, it
was estimated that the District would need to apply approximately 36 pounds to its permit per year
under current conditions. This was based on an average effluent concentration and limit of 0.087
and 0.075 mg/L, respectively. The average of 0.087 mg/L was rounded to the same number of
significant figures as the limit of 0.075 mg/L. Therefore, the 43 pounds per year gained through
this WQT agreement is expected to be more than sufficient to enable the District to meet its
WQBEL requirements, as this provides a margin of safety of 19% (43 / 36 = 119%).
2
SECTION 2 WATER QUALITY TRADING PLAN
The Town of Norway Sanitary District No. 1 (District) owns and operates a wastewater treatment
plant (WWTP) with an interim total phosphorus (TP) effluent limit of 1.0 mg/L. The Water Quality
Based Effluent Limits (WQBELs) for TP will decrease to 0.075 mg/L, expected to begin in 2022.
The District has removed phosphorus via chemical addition for many years. In August 2017, the
District initiated a full-scale pilot study of polyaluminum chloride (PAC) addition for chemical
phosphorus removal (CPR). PAC is commonly used in the water treatment industry and is
available from several suppliers within the wastewater treatment industry.
The addition of PAC led to an average effluent phosphorus concentration of 0.087 mg/L. This
ultra-low level is not low enough to consistently meet the six-month effluent phosphorus limit of
0.075 mg/L. Consequently, operational improvements and minor facility modifications alone
would not enable the District to meet the new ultra-low effluent limits. Therefore, other
compliance alternatives are necessary.
WATER QUALITY TRADING
Water quality trading (WQT) allows point source dischargers to purchase pollutant credits from point source or non-point source dischargers and apply them toward meeting regulatory requirements.
Land Conservation Department
As part of the compliance alternatives plan, the Racine County Land Conservation Department (LCD) was contacted to discuss potential collaboration and involvement in projects for either WQT or adaptive management (AM). The LCD did not present any opportunities within the District’s HUC-12 watershed.
Number of Water Quality Trading Credits Required
To achieve phosphorus compliance via WQT, the District would need to apply 36 and 58 lb/year of phosphorus credits toward its permit at current and design flows, respectively. At the current
3
PAC pilot effluent concentration of 0.087 mg/L and flow of 1.01 MGD, the effluent phosphorus load from the District is approximately 267 lb/year. At design year flows of 1.6 MGD, this effluent load would grow to approximately 424 lb/year. By comparison, the ultra-low 0.075 mg/L phosphorus WQBEL will translate to wasteload allocations of approximately 231 and 366 lb/year under current and design flows, respectively.
To achieve compliance via WQT, the District would need to apply credits of approximately 36 and 58 lb/year under current and design years, respectively. As detailed previously, there is one MS4 located within the District’s HUC-12 watershed. Therefore, potential point source phosphorus credit generators could be available, but nonpoint sources would be a more likely option to provide the necessary phosphorus credits.
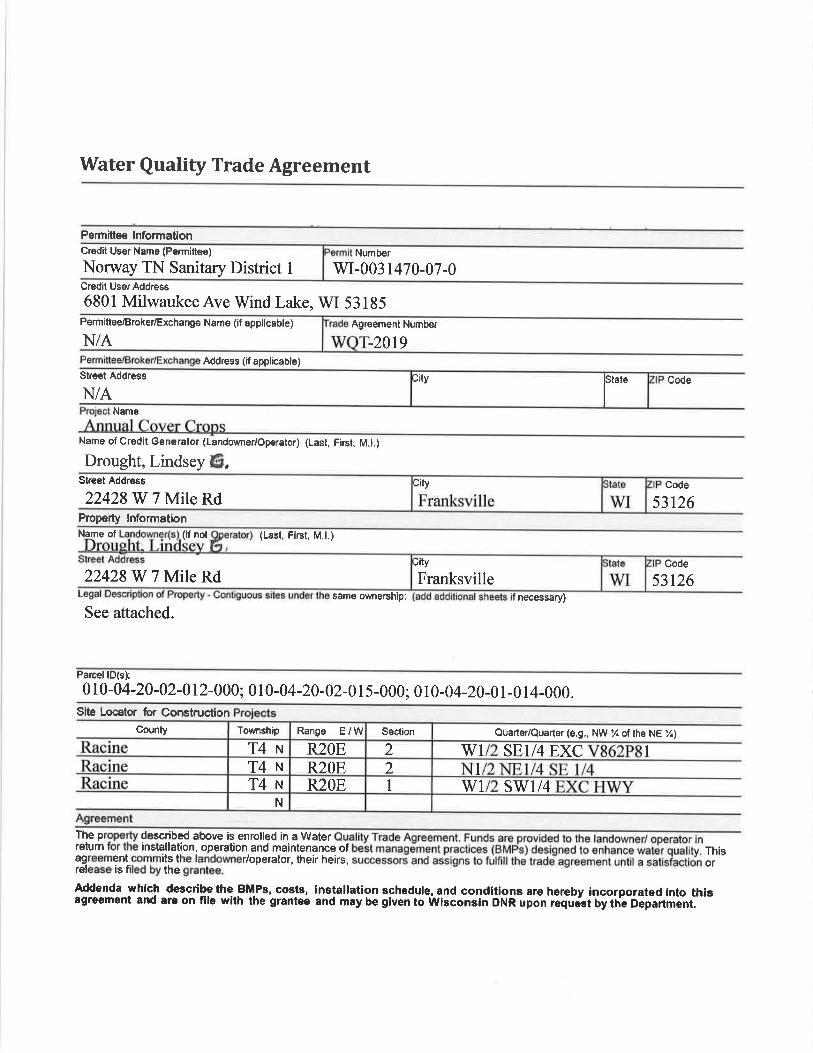
Water Quality Trade Agreement
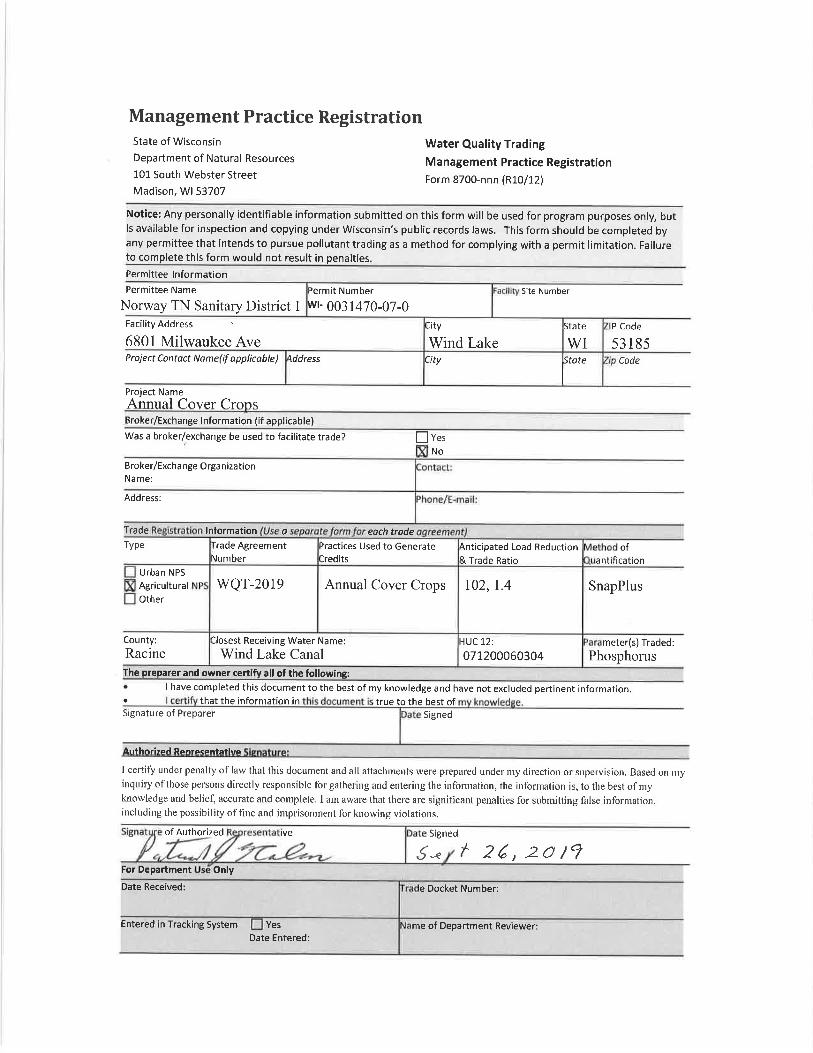
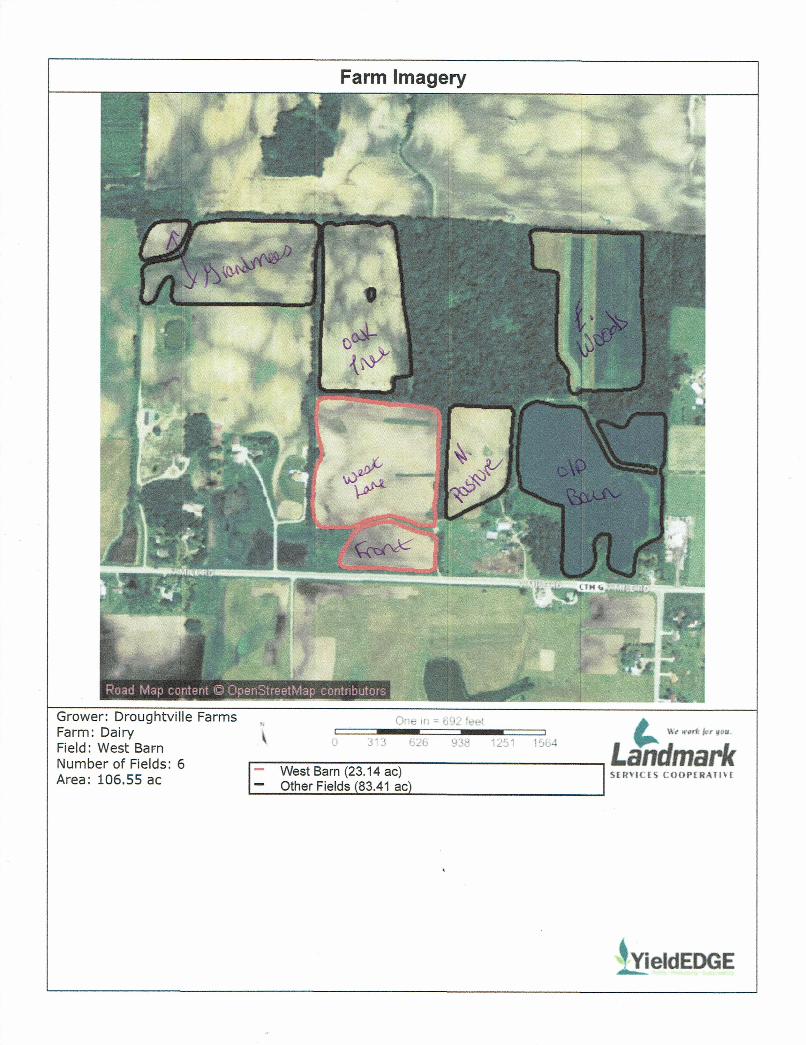
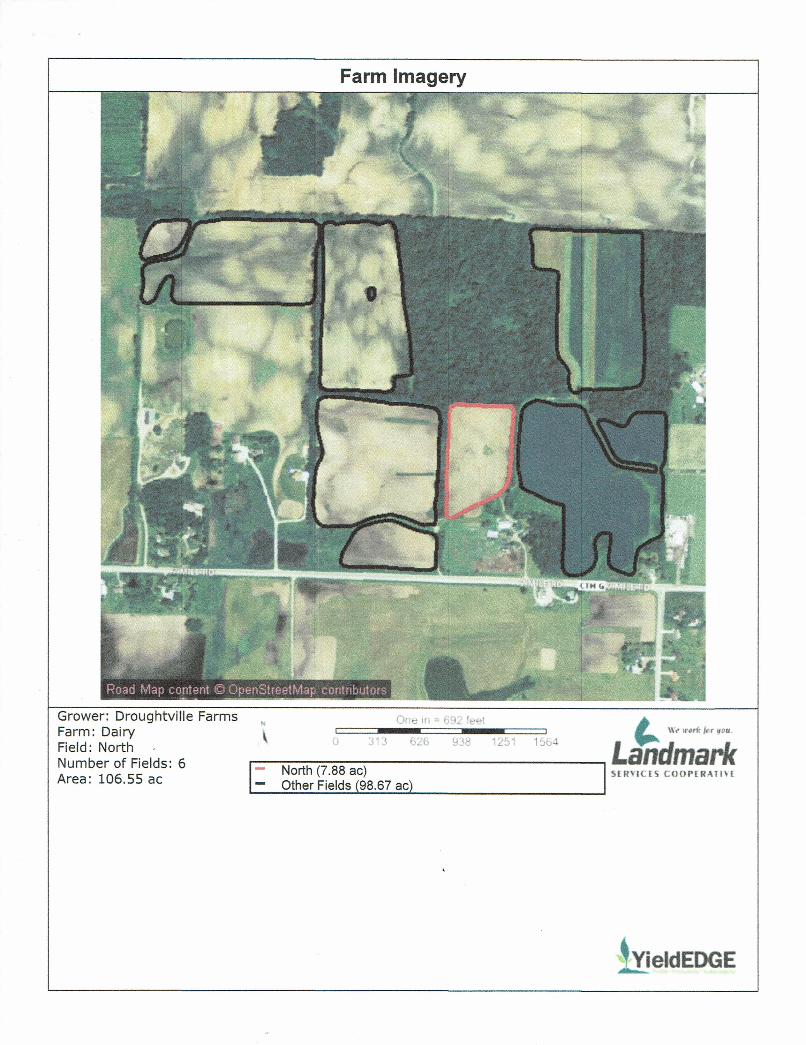
As shown in the Appendix, a Water Quality Trade agreement was reached on September 27, 2019.
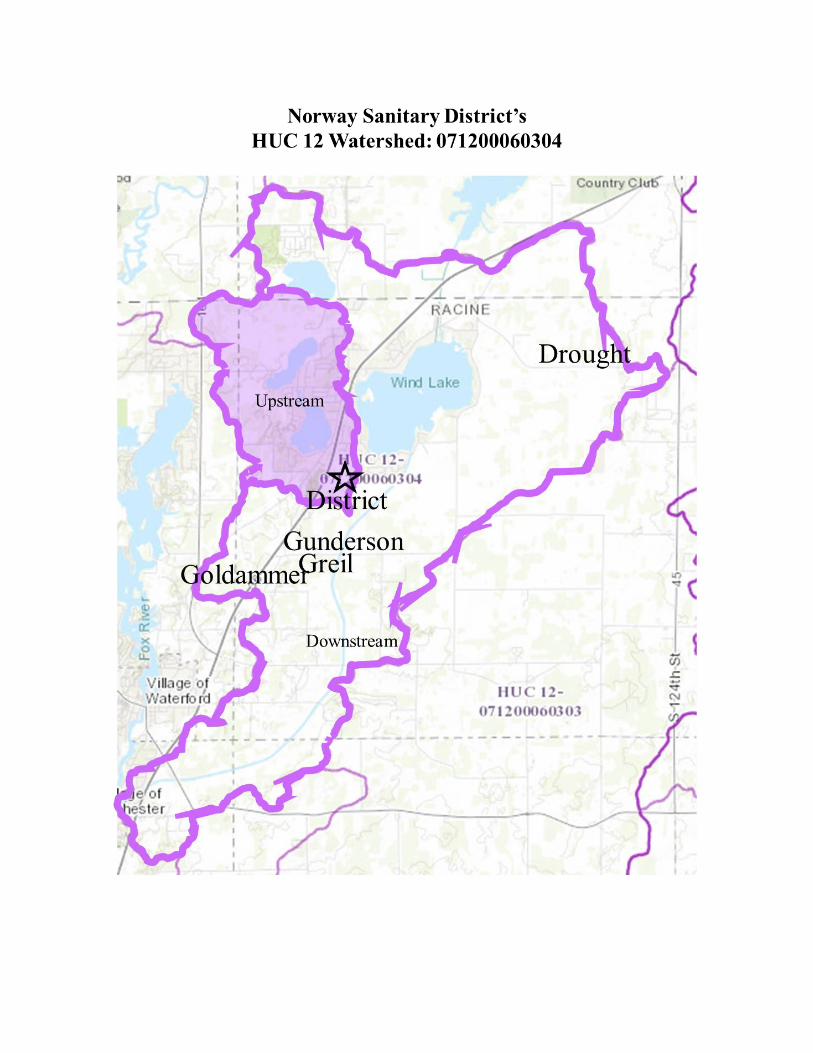
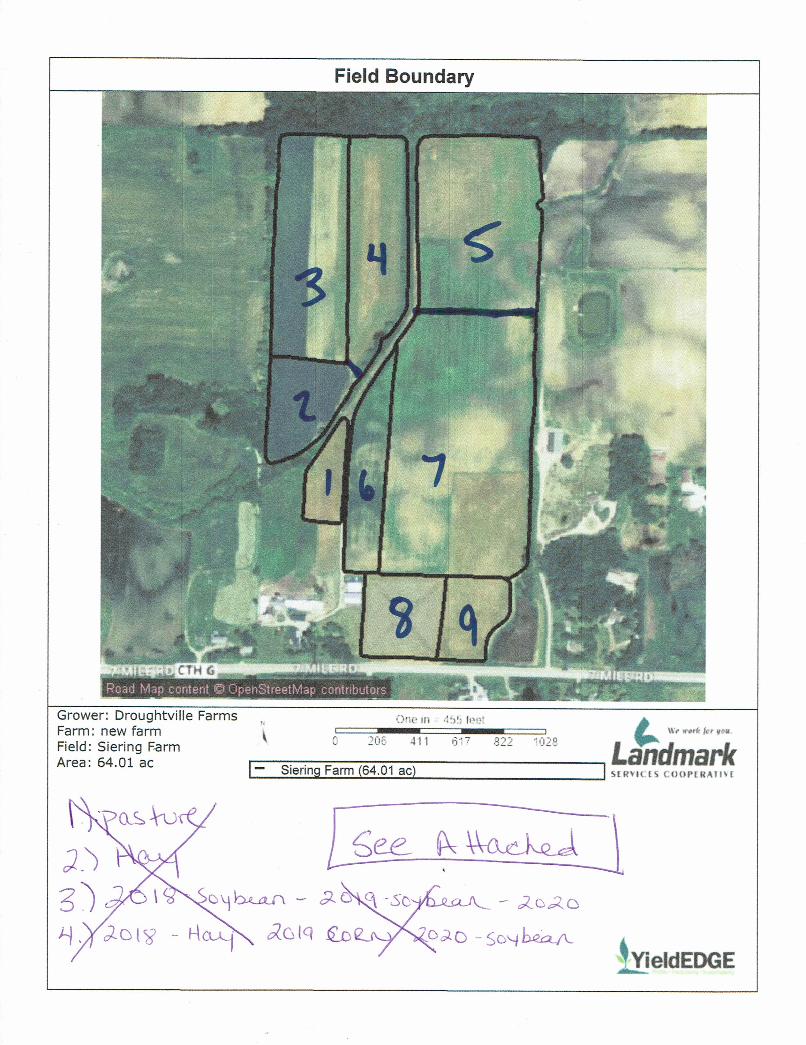
Lindsey Drought produces cash crops1 (corn, soybeans, wheat) in the northeast corner of same
HUC-12 as the District. Ms. Drought was interested in planting annual small grain cover crops to
support her cash crop production, but she had not planted cover crops previously. Based on
SnapPlus modeling, phosphorus loadings to the watershed would be reduced by 102 pounds per
year if cover crops would be planted on Ms. Drought’s 114 acres.
Therefore, the District applied to register this nonpoint-to-point source trade. An agreement was
reached for the District to provide a cost-share payment for Ms. Drought to plant annual small
grain cover crops. In exchange, the District will receive the Water Quality Trading credits
generated by this best management practice (BMP).
Ms. Drought first planted this BMP in Fall 2019, and she plans to maintain winter cover crops
through at least Spring 2025. The BMP will continue to be operated and maintained in accordance
with standards from the NRCS. The District or its representatives will conduct site inspections and
track the BMP with photographs and annual reports on file. The credits will be available starting
on January 1 of each year following establishment of Fall plantings. A Nutrient Management Plan
(NMP) is expected to be in effect by Fall 2020, more than a year before the first credits will be
1 Ms. Drought also grows hay on Fields 1, 2, 6, and 8, but no cover crops will be planted on these fields.
4
applied to the permit in 2022. This NMP will include SnapPlus information through Crop Year
2024.
Based on a downstream trade ratio of 2.4, the District will be able to apply approximately 43
pounds per year toward meeting its annual WQBEL requirements. These 43 pounds per year can
be applied during any month because this is a nonpoint-to-point source trade.
In the submitted Final Compliance Alternatives Plan, it was estimated that the District would need
to apply approximately 36 pounds to its permit per year under current conditions. This was based
on an average effluent concentration and limit of 0.087 and 0.075 mg/L, respectively. The average
of 0.087 mg/L was rounded to the same number of significant figures as the limit of 0.075 mg/L.
Therefore, the 43 pounds per year gained through this WQT agreement will be more than sufficient
to enable the District to meet its WQBEL requirements, as this provides a margin of safety of 19%
(43 / 36 = 119%).
In the future, Ms. Drought has indicated that she will consider implementing additional BMPs such
as grassed waterways and conservation tillage to improve the trade ratio from 2.4 to 1.4 lb credit
generated/ lb credit received. If these or similar BMPs are pursued, the practices will be registered
in the year they are first adopted, and WQT agreements will be revised or developed prior to the
District’s need to apply any new credits.

APPENDIX

BEST MANAGEMENT PRACTICE REGISTRATION
Management Practice RegistrationState of Wisconsin
Department of Natural Resources
101 South Webster Street
Madison, Wl 53707
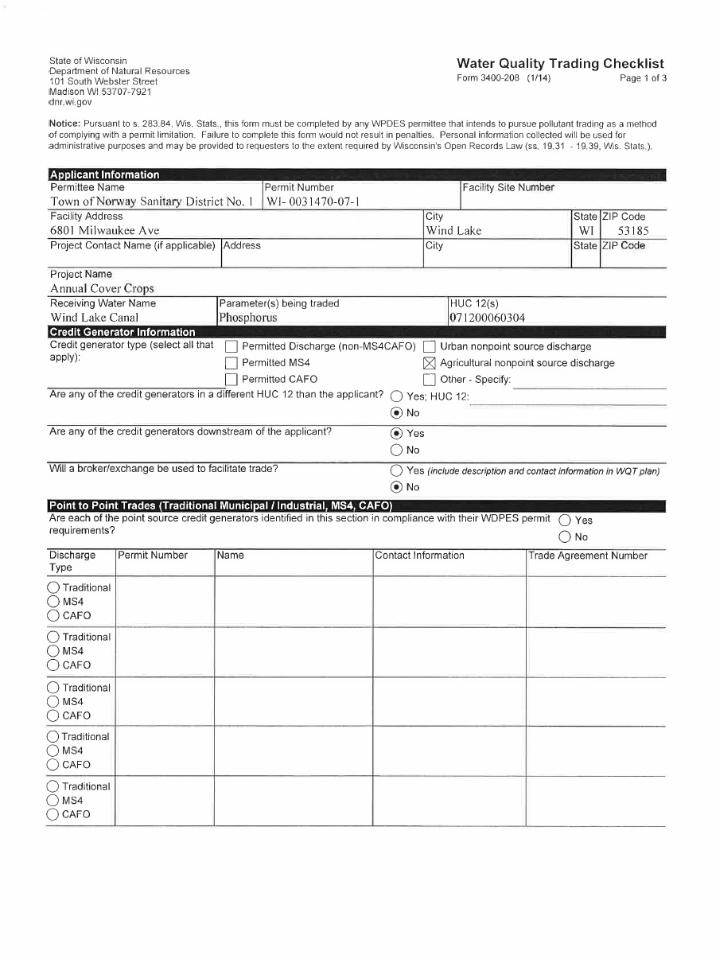
Water Quality Trading
Management Practice RegistrationForm 8700-nnn (Rl1h2l
Notice: Any personally identifiable information submitted on this form will be used for program purposes only, butis available for inspection and copying under Wisconsin's public records laws. This form should be completed byany permittee that intends to pursue pollutant trading as a method for complying with a permit limitation. Failureto complete this form would not result in penalties
Permittee lnformationPermittee Name
Norway TN Sanitary District 1
Facility Address
6801 Milwaukee AveP roj e ct Contact No m e ( if a p p lica b le )
Site Number
P Code
53185Code
Project NameAnnual Cover Cron S
Permit Numberwt 0031470-07-0
lstate
lwr:ity
Wind Lake
l''* |''*4ddress
Broker/Exchange lnformation (if applicable)
Was a broker/exchange be used to facilitate trade?
Broker/Excha nge Orga nizationName:
Address:
Trade lnformation oType
Urban NPS
Agricultural
Other
County:
Racine
! vesNo
each trade
ofantification
SnapPlus
meter(s) Traded:
Phosphorus
lrade AgreementNumber
)ractices Used to Generate:redits
\nticipated Load ReductionI Trade Ratio
wQT-2019 Annual Cover Crops r02,1.4
llosest Receiving Water Name:
Wind Lake CanalIUC 12:
071200060304The oreoarer and owner certifo all of the followine:
a
I have completed this document to the best of my knowledge and have not excluded pertinent information.that the information in true to the best of
Signature of Preparer Signed
Arrthorized RenrocFnialivo
I celtify under penalty of law that this document and all attaclrrnents were prepared under my dirrcction or supervision. Based on rnyinquiry ofthose persons directly responsible for gatheling and entering the information, the infornration is, to the best ofrnyknowledge and belief, accurate and complete. I am aware that there are significant penalties for submitting false information,including the possibility of fine and imprisonment lor knowing violations.
of Authorized tve Signed
S* t 26, z0/?For Department Only
Date Received: e Docket Number:
YesEntered in Tracking System
Date Entered:me of Department Reviewer:
WATER QUALITY TRADING AGREEMENT
Water Quality Trade Agreement
Permittee lnformationCrsdit User Namo (Permittee) Number
Norway TN Sanitary District I wr-0031470-07-0Crdit UssrAddrgss
6801 MilwaukeeAve Wind Lake, WI 53185Parmittee/BDker/Exchange Name (if applicable)
N/AAddress (if applicable)
Slreet Addr6s
N/AMme
Agreement Number
20t9
Codelity
lstate
Name of Gredit Generator (Landowner/Oparstor) (Last, Fkst, M.l.)
Drought, Lindsey E,Street Address
22428W7MileRdProperty lnformationName ol (if not
22428W7MileRd
See attached.
(Lasl, First, M.l.)
Code
53126
Code
53126Same Or,rdership: necessary)
City btate
lwr
btate
lwr:ity
Franksville
Pa.cel lD(E):
0 t0 -04-20-02-0 12-000 ; 0 I 0-04 -20 -02-0 I s-000 ; 0 I 0-04-20-0 I -0 I 4-000.Site Locator for Construction
Tormship Range E/W Section
T4 tt R2OE 2 wl SEl/4 EXCT4N R2OE 2T4 tt R2OE I
N
Cannty Quarter/Ouartsr (€.9., NW % of the NE %)
I
w1 sw1/4I
The propertyretum for the
described above is enrolled in a Waterinstrallation, operation and maintenance of This
agreement commits the landowner/operator, their heirs,releasE is filed by th€ grantee.
or
Addenda which deocribe lhe Btrl-Ps, cost$, inetallation schedule, and conditione are hereby incorporated into thisagreement end sre on file wlth the gr€ntee and may be glven to liUlsconsln oHn upon rtqurisi iii-tib O"il"rt'iilntl'"
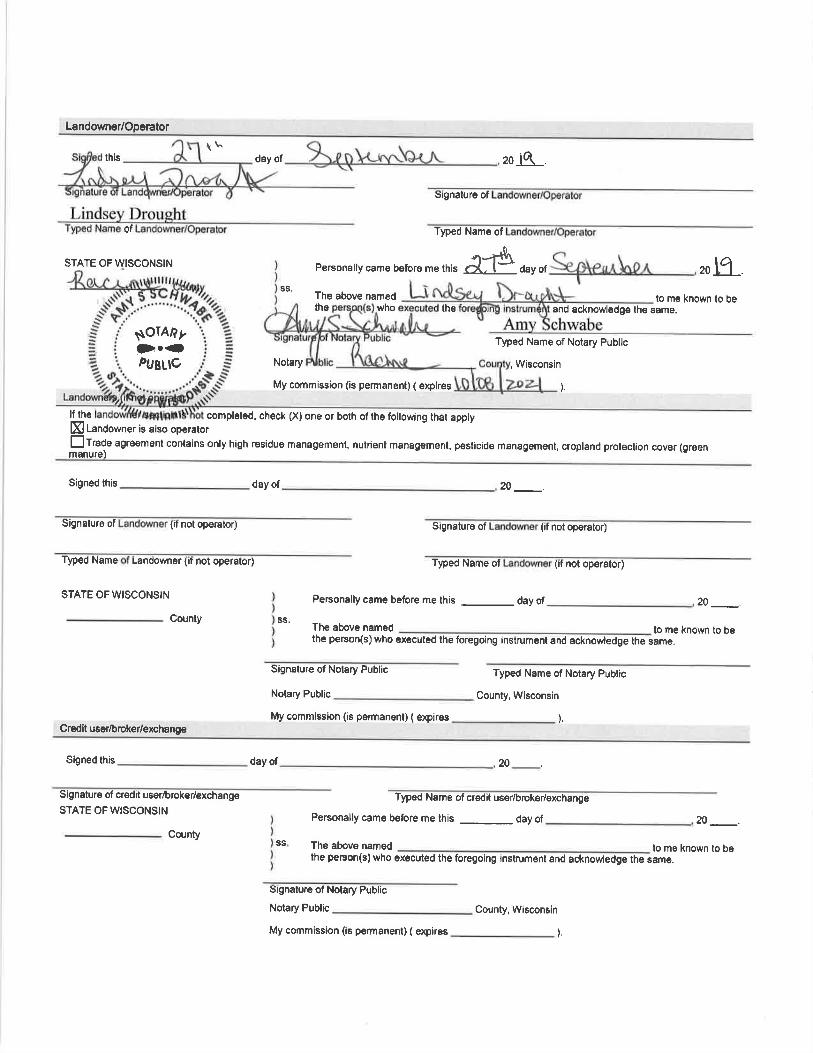
LandownerlOperator
\\^this
of
STATE OF WTSCONSIN
day of 20 iq. .
signature of
Tlped Name of
ds zolq .Personally came before me this
ss' The above namedths who the
Notary
My commission (is permanent) ( expires
day of
to me known to be
\\oIA/?2rloePUeIrc
and acknowledge lhe same.
Typed Name of Notary Public
, Wisconsin
).
lf the completed, check (X) one or both of the tollowing that applyXlLandowner is also op€ralor
!traUe egreomont contains only high residue managemBnt, nutrient manegement, pesticide managem€nl, cropland protoclion cover (gr6snmanure)
Signed this day of 20 _.
Signaturs of (f not operetor) Signature of (if not operator)
Typed Name Landowner (f not operator) Tlped Name ot (f not operator)
STATE OFWISCONSIN Personally came before me this _ day of _ 20 _.Carnty
The above namedthe person(s) who executed the foregoing instrument and acknowledge the same.
Signature of Nolary Public Typed Name of Notary Public
County, WisconsinNotary Publh _My commi$eion (is permenent) ( expires
gs.
).Credit user&roker/exchange
Signed this day of 20 _.
Typed Name of credil user/broker/exchange
Personally came belore me this _ day of _ 20 _.The above namedthe person(s) who executed the foregoing instrument and acknowledge the same.
Signature of credit usBribrok€r/€xchange
STATE OF WISCONSIN
Corntyss.
signature of Nolary Public
Notary Public _ County, Wisconsin
My commission (is permanent) ( expires _ ).
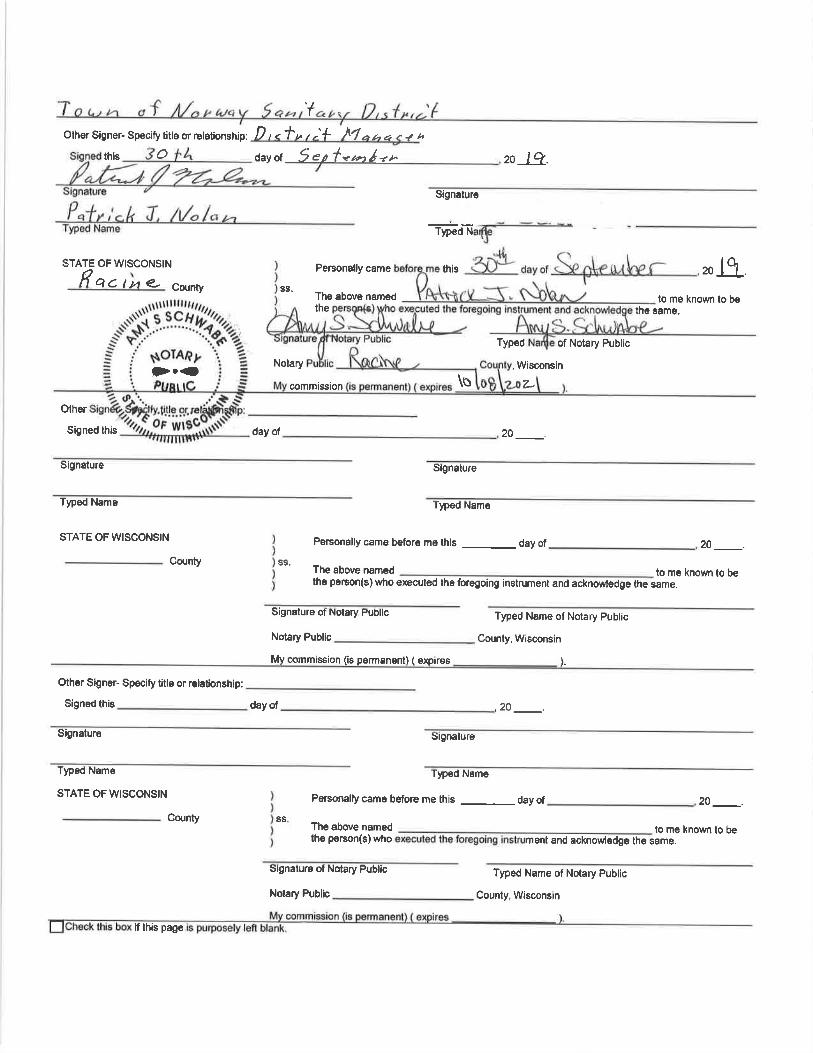
'tOther Signer- Specify title or relationship: D ,.f u, -'# l'/oz,o"tt,
this o day of I et t*o-rltr
STATE OFWISCONSIN Personally came
Bo. I t', e- County ss.The above namedlhe
|}11Nolary
Other
Signed this day of
Signalure
Tlpad Name
STATE OF WISCONSIN
Cannty
Cdl"-rff-*2,i&-sJV dayof S"pk" [^r- .rolt
20 lq.
Signature
this
lo me known lo b€the rame.
Typed of Notary Public
, Wisconsin
@mmtsson \o
20 _.
stgnature
Tlped Name
Personafly came before me this _ day of _ ZO _.The above named to me known to bethe person(s) who execuled the foregoing instrument and acknow{edge the same.
Signaturg of Nolary Public Typed Name ot Nolary Public
County, WisconsinNolary Public _
a/
8S.
Mv commission (is permansnt) ( exoires ).
Other Signer- Sp€cify title or r€lationahip: _Signed this _ day of .
Signature Signature
Typed NEms
STATE OF WISCONSIN
TlDed Neme
Personally came before me this _ day of
Cwnty
20 _.
20 _.ss. Theabovenamed to me known to be
the person(s) wtro e ame.
Stgnatura of Notary Public Typed Name of Nolary Public
County, Wisconsin
if lhis page
Notary Public _
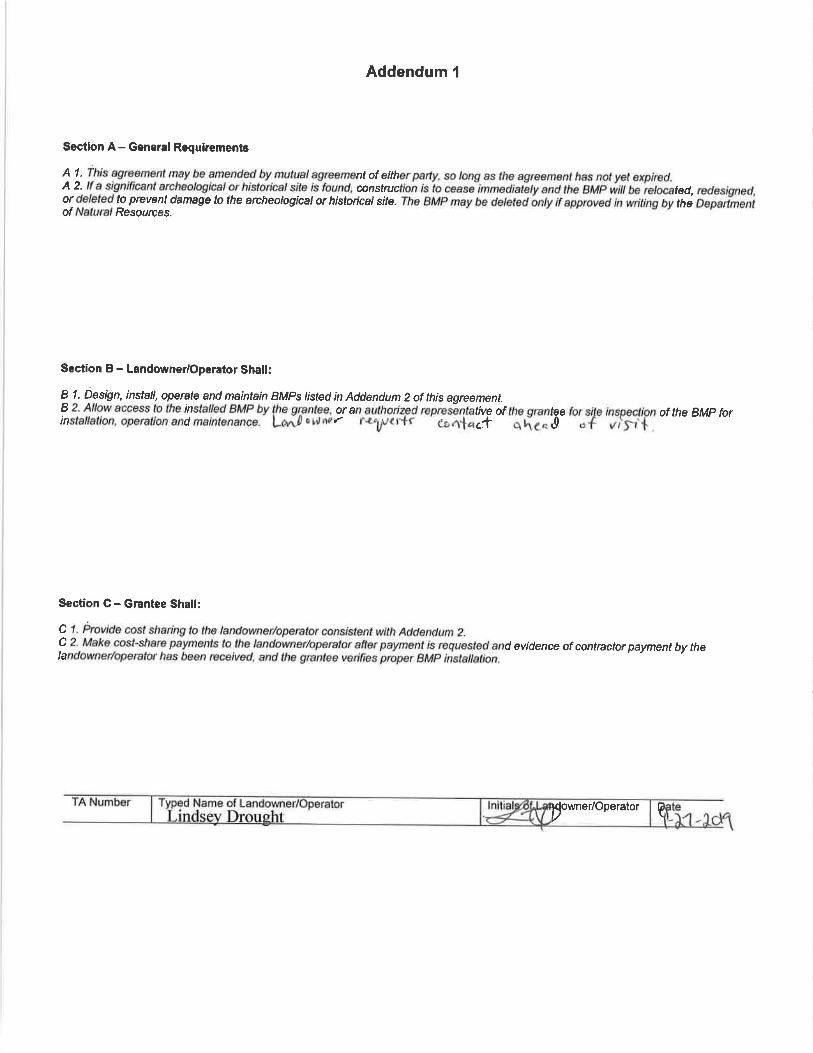
Addendum 1
Sectlon A- General Requlrements
4 ! Tlrir agreemenl mgv le amended by mutual agrcement of either party, so long as the agreement has not yet expired.A 2-.lf,a significant archeological or histonca/ site is found, canstruction is io
-cease-rn mediatity and the BMP,in Ae'retocated, redesigned,
o1leleted t9 prevent damage to the archeological or histoicat site. The BMP may be deteted only if approved in writing iV ni Depaimeniof Natural Resoutres.
Section B - Landownerloperator Shall:
B_1^. Qe-sign, instal!, operate and maintain BMps listed in Addendum 2 of this agr€ement.B 2' Allow access to the installed BMP by {he gnntee, or an authorizpd represintative of the grantee for sile inspection of the BMp forinstallation, operation and maintenance. LfiyJ ovn^er r*yt<rlr ' contact q {C" $
" f y-,tF S
Section G - Gnntee Shall:
c 1. Provide cost $hartng b the landownerlopentor consistent with Addendum z.C 2'-Make gost-sharc payments lo lhe landownerlopentor after payment is requesfed an d evidenee of contnctor payment by thelandowner/opentar has been rcceived, and the gnntee varifies pr6per BMP iistalalion.
powner/OAerator t
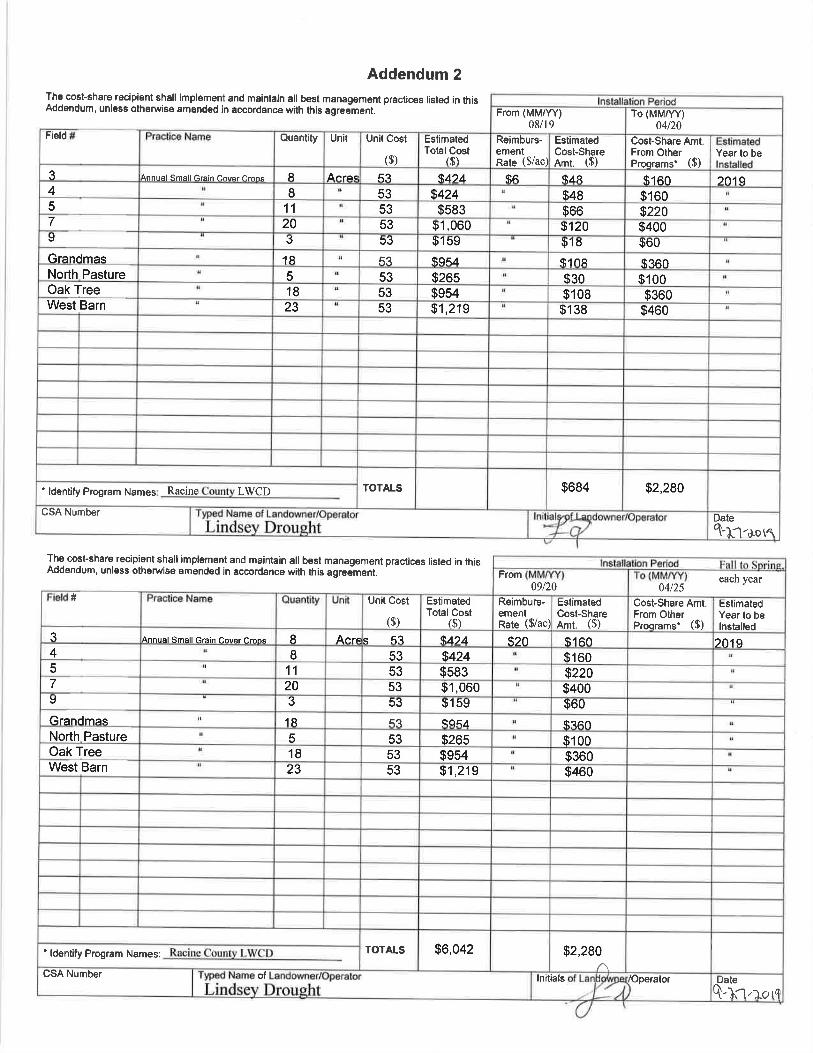
Addendum 2
The cost-share recipiant shall implement and mainlain all best managemenl practices listed in thisAddandum, unless othenivise amEnded in accordance with this agredmenl.
Field
From (MM/YY)08/19
To (MM/YY)04t20
Quantity Unit Unit Cost
($)
EstimatedTotal Cost
($)
Reimburs-ementRate ($/ac)
EslimatedCost-ShareAmt ($)
Cost-Share Amt,From OtherProqrams' ($)
Year to be
3 Annual Smell GEin Cover crons 8 A nrac 53 s42A s6 s48 s160 20194 8 53 $424 $48 $1605 11 53 $583 $66 $2207 20 53 $1,060 $1 20 $400I 3 53 $1 59 sl6 $60Grandmas 18 53 s954 s,toR s360North Pasture 5 53 $265 $30 $100Oak Tree 18 53 $954 $1 08 $360West Barn 23 53 $1,219 $138 $460
TOTALS $684 $2,280' ldentity Program Names Racine LWCD
CSA NumberDate
t-l:l-o.otl
The cost'share recipiant shall implement and maintain all best managemant practic€s listed in thisAddEndum, unl€ss otharwise amended in accordance with this agreJmeni. From
09/20each year
04t25# Unit Cost
($)
EstimatedTotal Cost
($)
Reimburs-ementRate ($/ac)
EstimatedCost-ShareAmt. ($)
Cosl-Share Amt.From OtherProsrams. ($)
EstimatedYear to belnstalled
3 Annual Small Grain cover crons 8 Anre s53 s424 s20 s160 20194 8 53 $424 $1605 11 53 $583 $2207 20 53 $1,060 $4009 3 53 lr1b9 $60Grandmas 18 53 s954 s3AONorth Pasture 5 53 $265 $1 00Oak Tree 18 53 $954 $360West Barn 23 53 $1,219 $460
'ldentify Program Names: Racine County LWCD -TOTALS $6,042 $2,280
CSA Number of lnilials fopetator Date
Q'}fl,rorq
WATER QUALITY TRADE SUMMARY TABLES AND MAPS
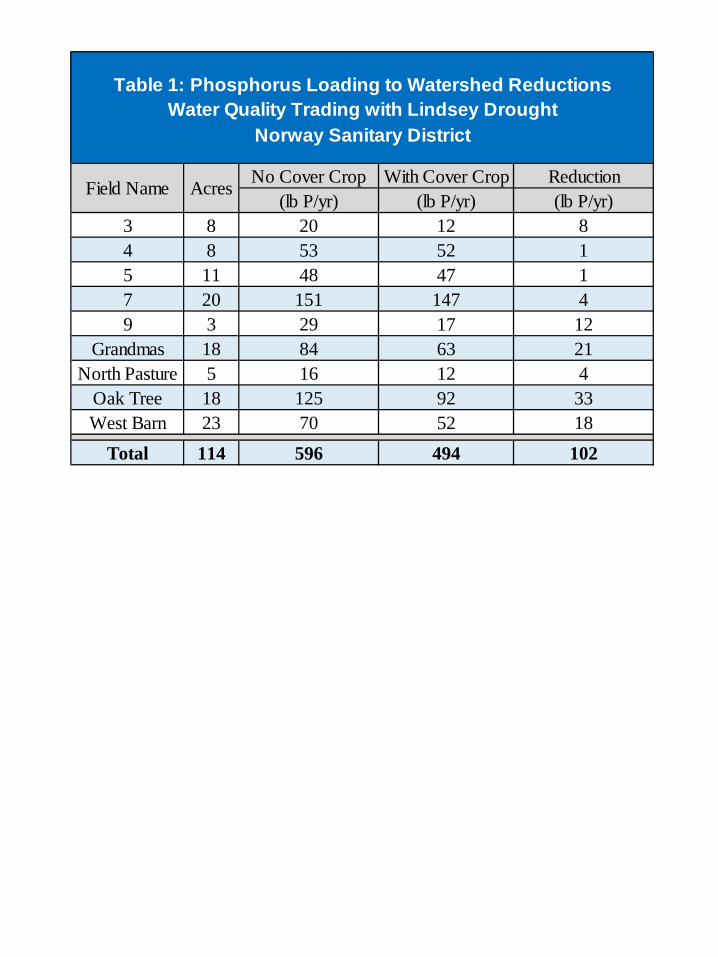
No Cover Crop With Cover Crop Reduction(lb P/yr) (lb P/yr) (lb P/yr)
3 8 20 12 84 8 53 52 15 11 48 47 17 20 151 147 49 3 29 17 12
Grandmas 18 84 63 21North Pasture 5 16 12 4
Oak Tree 18 125 92 33West Barn 23 70 52 18
Total 114 596 494 102
Table 1: Phosphorus Loading to Watershed ReductionsWater Quality Trading with Lindsey Drought
Norway Sanitary District
Field Name Acres
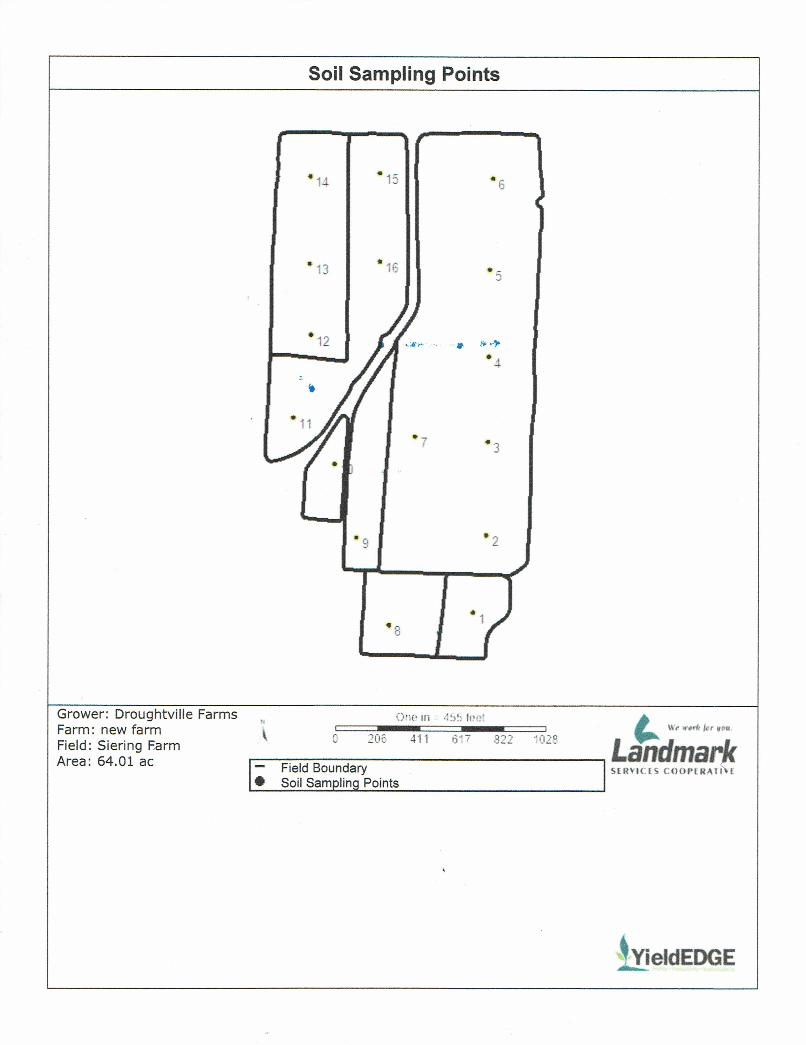
ArcGIS Web Map
NMB, Racine County, Racine County, SEWRPC, Sources: Esri, HERE,Garmin, Intermap, increment P Corp., GEBCO, USGS, FAO, NPS, NRCAN,
Sections
Municipal Boundaries
Dover Norway Drainage
September 30, 20190 3.5 71.75 mi
0 5.5 112.75 km
1:288,896
Esri Canada, Esri, HERE, Garmin, USGS, NGA, EPA, USDA, NPS | Racine County | NMB, Racine County | Racine County, WI, Pro-West & Associates, Inc. | Southeastern Wisconsin Regional Planning Commission, Racine County | Southeastern Wisconsin Regional
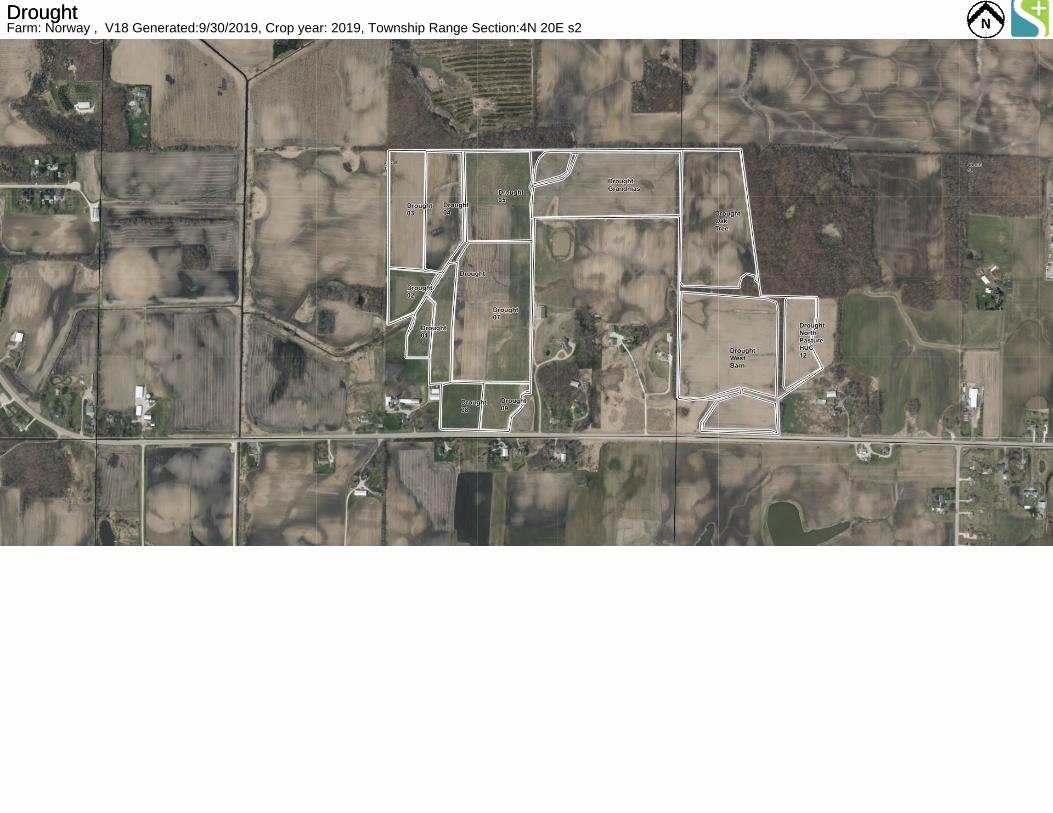
DroughtFarm: Norway , V18 Generated:9/30/2019, Crop year: 2019, Township Range Section:4N 20E s2Drought
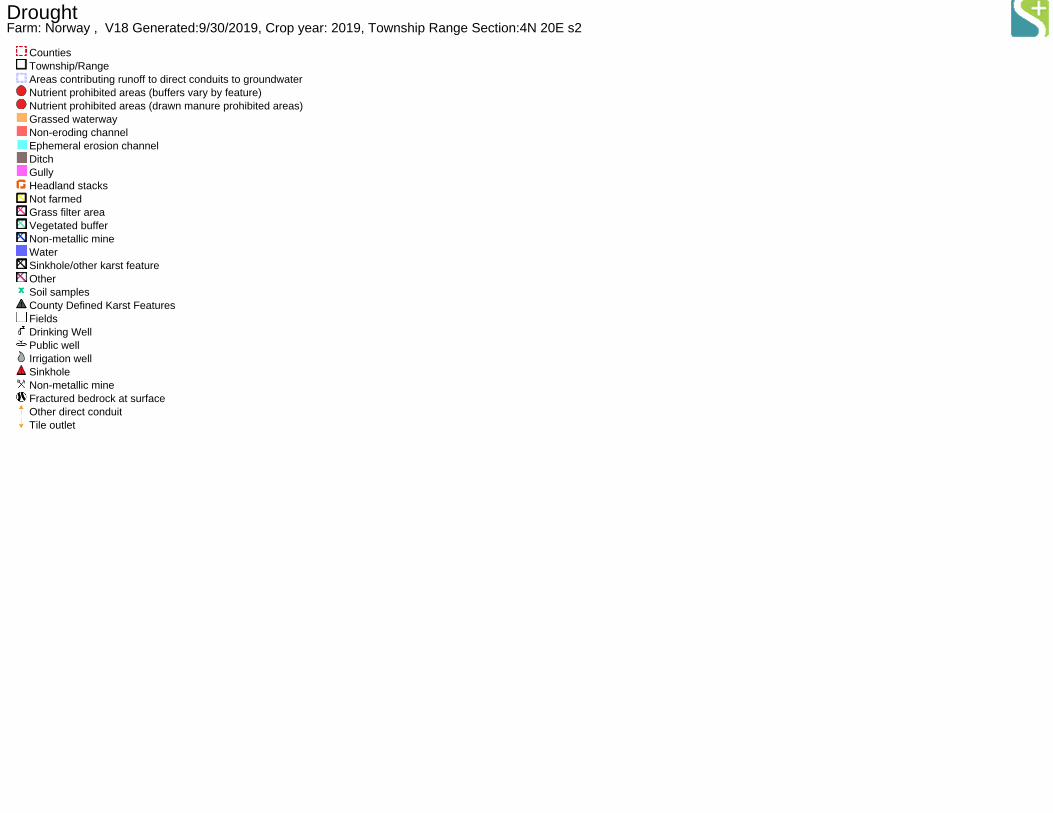
Farm: Norway , V18 Generated:9/30/2019, Crop year: 2019, Township Range Section:4N 20E s2Drought
CountiesTownship/RangeAreas contributing runoff to direct conduits to groundwaterNutrient prohibited areas (buffers vary by feature)Nutrient prohibited areas (drawn manure prohibited areas)Grassed waterwayNon-eroding channelEphemeral erosion channelDitchGullyHeadland stacksNot farmedGrass filter areaVegetated bufferNon-metallic mineWaterSinkhole/other karst featureOtherSoil samplesCounty Defined Karst FeaturesFieldsDrinking WellPublic wellIrrigation wellSinkholeNon-metallic mineFractured bedrock at surfaceOther direct conduitTile outlet
SNAPPLUS MODEL – NO COVER CROP
(BASELINE CONDITION)
WQ1: P Trade Report
Reported For Norway
Printed 2019-09-24
Plan Completion/Update Date 2019-05-24
SnapPlus Version 18.1 built on 2019-01-15
C:\Users\lakucek\Desktop\Norway_190923\Norway_No Cover Crops_ LAK_190923.snapDb
Prepared for:Norway attn:Greil_10acres
P Trade Report PTP
Field Name Soil SeriesSoil
Symbol Acres 2021
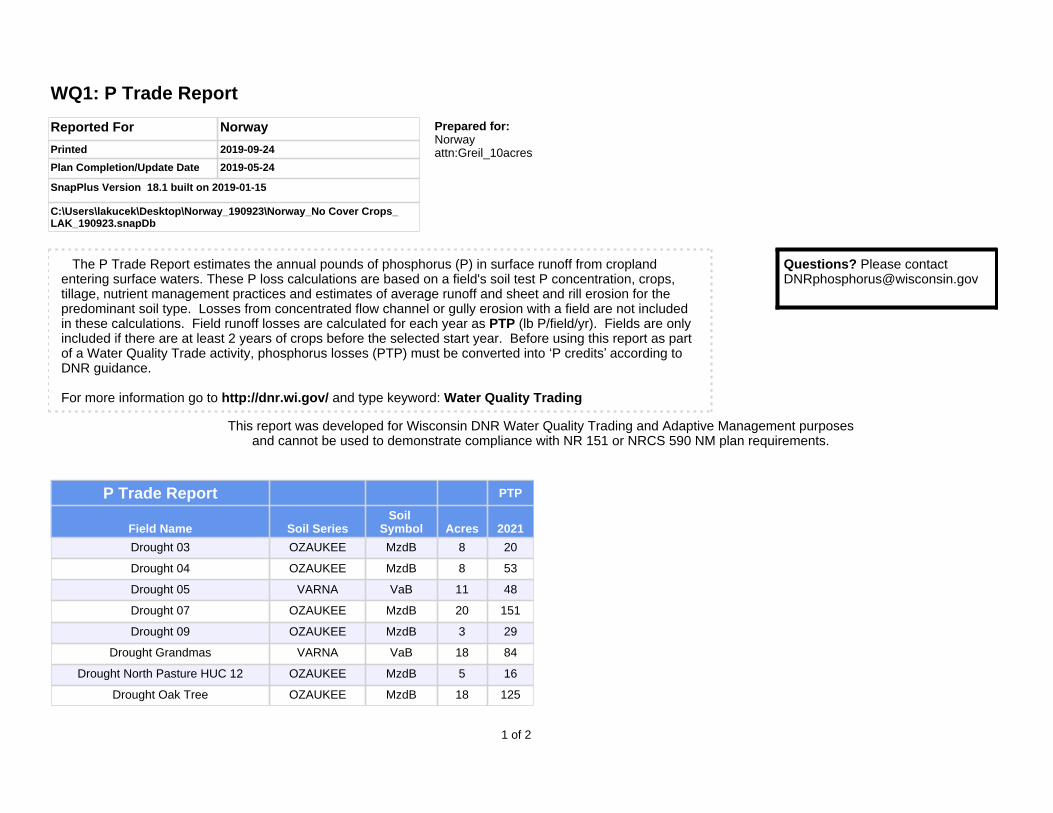
Drought 03 OZAUKEE MzdB 8 20
Drought 04 OZAUKEE MzdB 8 53
Drought 05 VARNA VaB 11 48
Drought 07 OZAUKEE MzdB 20 151
Drought 09 OZAUKEE MzdB 3 29
Drought Grandmas VARNA VaB 18 84
Drought North Pasture HUC 12 OZAUKEE MzdB 5 16
Drought Oak Tree OZAUKEE MzdB 18 125
Questions? Please contact [email protected]
The P Trade Report estimates the annual pounds of phosphorus (P) in surface runoff from cropland entering surface waters. These P loss calculations are based on a field's soil test P concentration, crops, tillage, nutrient management practices and estimates of average runoff and sheet and rill erosion for the predominant soil type. Losses from concentrated flow channel or gully erosion with a field are not included in these calculations. Field runoff losses are calculated for each year as PTP (lb P/field/yr). Fields are only included if there are at least 2 years of crops before the selected start year. Before using this report as part of a Water Quality Trade activity, phosphorus losses (PTP) must be converted into ‘P credits’ according to DNR guidance.
For more information go to http://dnr.wi.gov/ and type keyword: Water Quality Trading
This report was developed for Wisconsin DNR Water Quality Trading and Adaptive Management purposes and cannot be used to demonstrate compliance with NR 151 or NRCS 590 NM plan requirements.
1 of 2

P Trade Report PTP
Field Name Soil SeriesSoil
Symbol Acres 2021
Drought West Barn VARNA VaB 23 70
Total 114 597
2 of 2
Norway SnapPlus P Trade Report 09/24/2019
Reported For Norway
Printed 2019-09-24
Plan Completion/Update Date 2019-05-24
SnapPlus Version 18.1 built on 2019-01-15
C:\Users\lakucek\Desktop\Norway_190923\Norway_No Cover Crops_ LAK_190923.snapDb
Prepared for:Norway attn:Greil_10acres
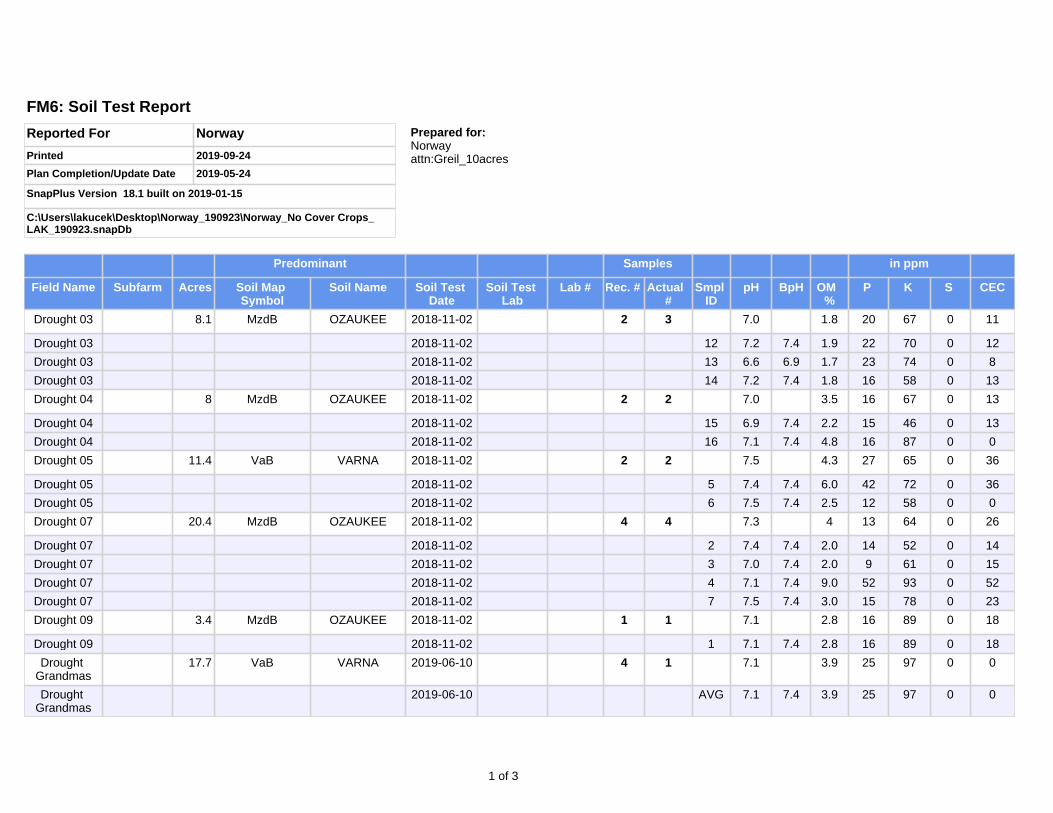
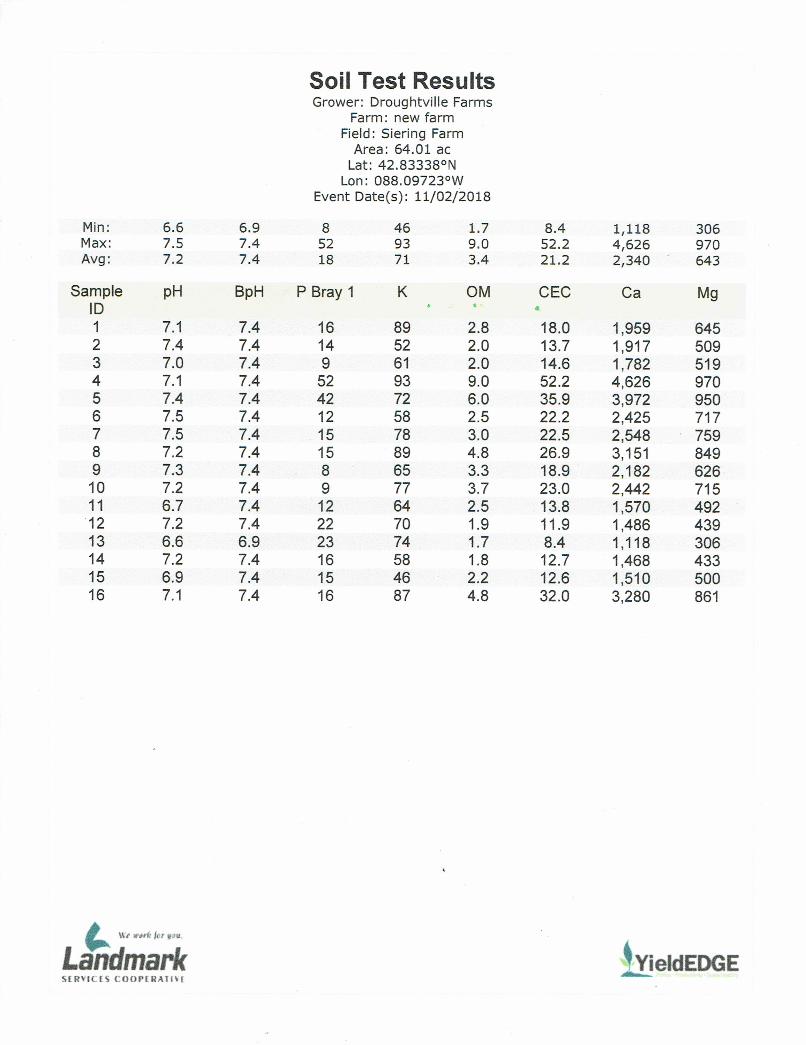
FM6: Soil Test Report
Predominant Samples in ppm
Field Name Subfarm Acres Soil Map Symbol
Soil Name Soil Test Date
Soil Test Lab
Lab # Rec. # Actual #
Smpl ID
pH BpH OM %
P K S CEC
Drought 03 8.1 MzdB OZAUKEE 2018-11-02 2 3 7.0 1.8 20 67 0 11
Drought 03 2018-11-02 12 7.2 7.4 1.9 22 70 0 12
Drought 03 2018-11-02 13 6.6 6.9 1.7 23 74 0 8
Drought 03 2018-11-02 14 7.2 7.4 1.8 16 58 0 13
Drought 04 8 MzdB OZAUKEE 2018-11-02 2 2 7.0 3.5 16 67 0 13
Drought 04 2018-11-02 15 6.9 7.4 2.2 15 46 0 13
Drought 04 2018-11-02 16 7.1 7.4 4.8 16 87 0 0
Drought 05 11.4 VaB VARNA 2018-11-02 2 2 7.5 4.3 27 65 0 36
Drought 05 2018-11-02 5 7.4 7.4 6.0 42 72 0 36
Drought 05 2018-11-02 6 7.5 7.4 2.5 12 58 0 0
Drought 07 20.4 MzdB OZAUKEE 2018-11-02 4 4 7.3 4 13 64 0 26
Drought 07 2018-11-02 2 7.4 7.4 2.0 14 52 0 14
Drought 07 2018-11-02 3 7.0 7.4 2.0 9 61 0 15
Drought 07 2018-11-02 4 7.1 7.4 9.0 52 93 0 52
Drought 07 2018-11-02 7 7.5 7.4 3.0 15 78 0 23
Drought 09 3.4 MzdB OZAUKEE 2018-11-02 1 1 7.1 2.8 16 89 0 18
Drought 09 2018-11-02 1 7.1 7.4 2.8 16 89 0 18
Drought Grandmas
17.7 VaB VARNA 2019-06-10 4 1 7.1 3.9 25 97 0 0
Drought Grandmas
2019-06-10 AVG 7.1 7.4 3.9 25 97 0 0
1 of 3
Predominant Samples in ppm
Field Name Subfarm Acres Soil Map Symbol
Soil Name Soil Test Date
Soil Test Lab
Lab # Rec. # Actual #
Smpl ID
pH BpH OM %
P K S CEC
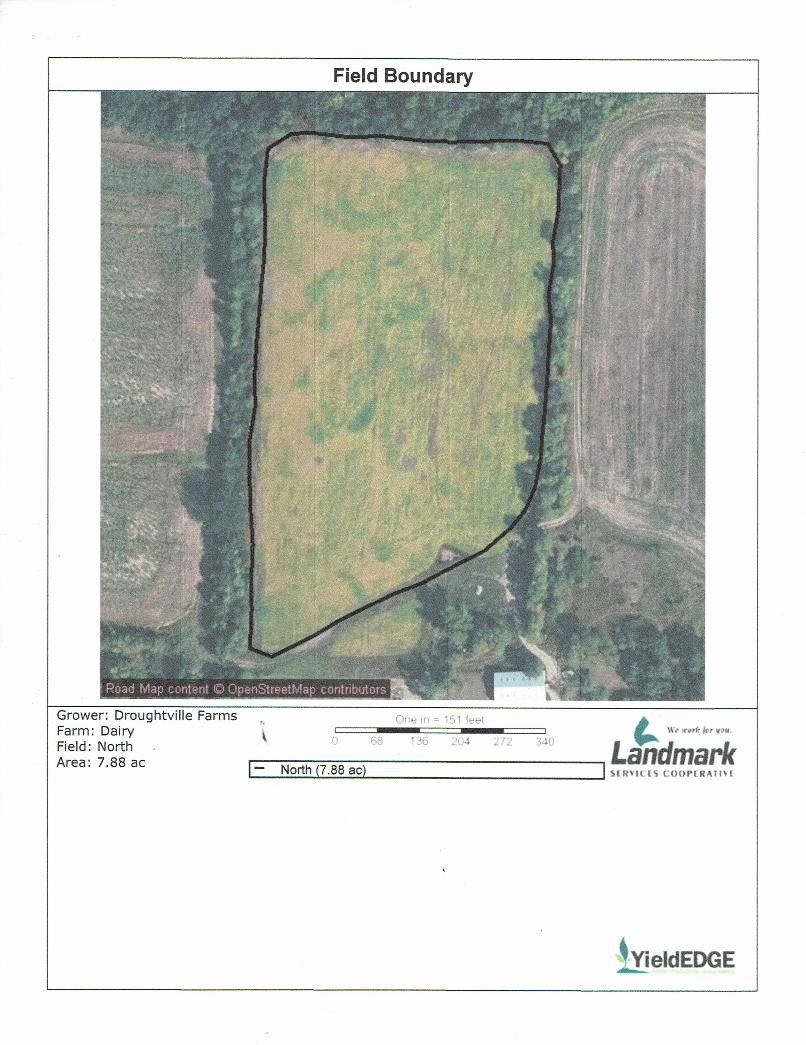
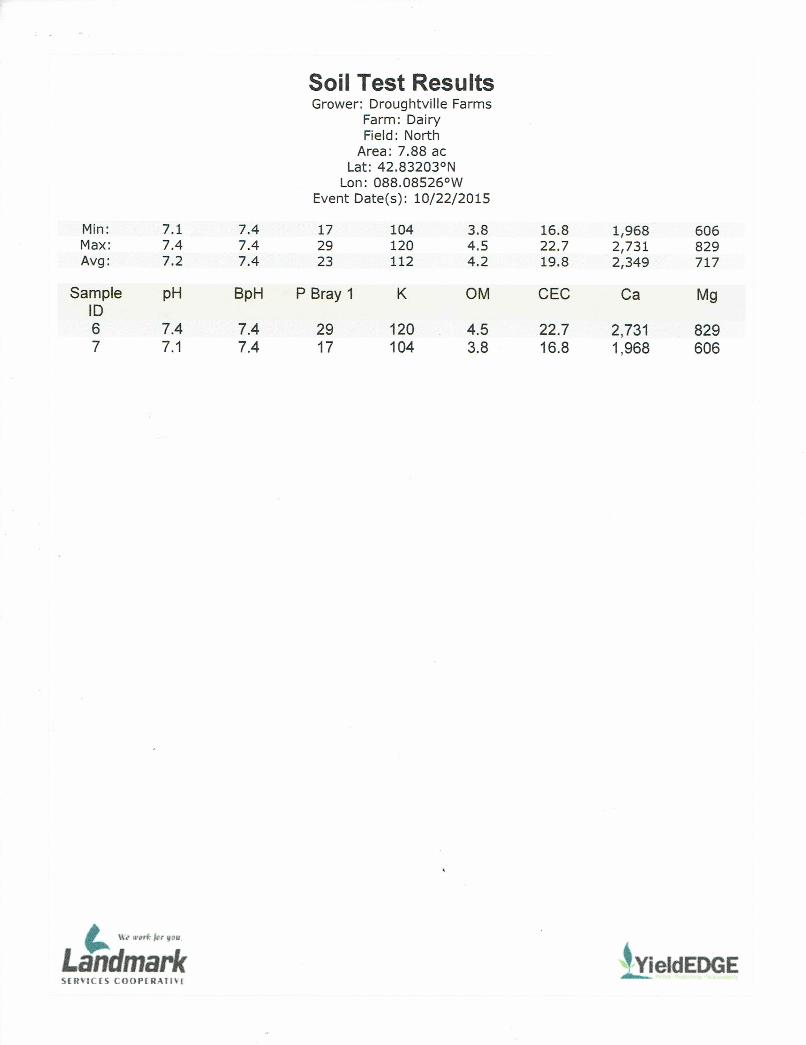
Drought North
Pasture HUC 12
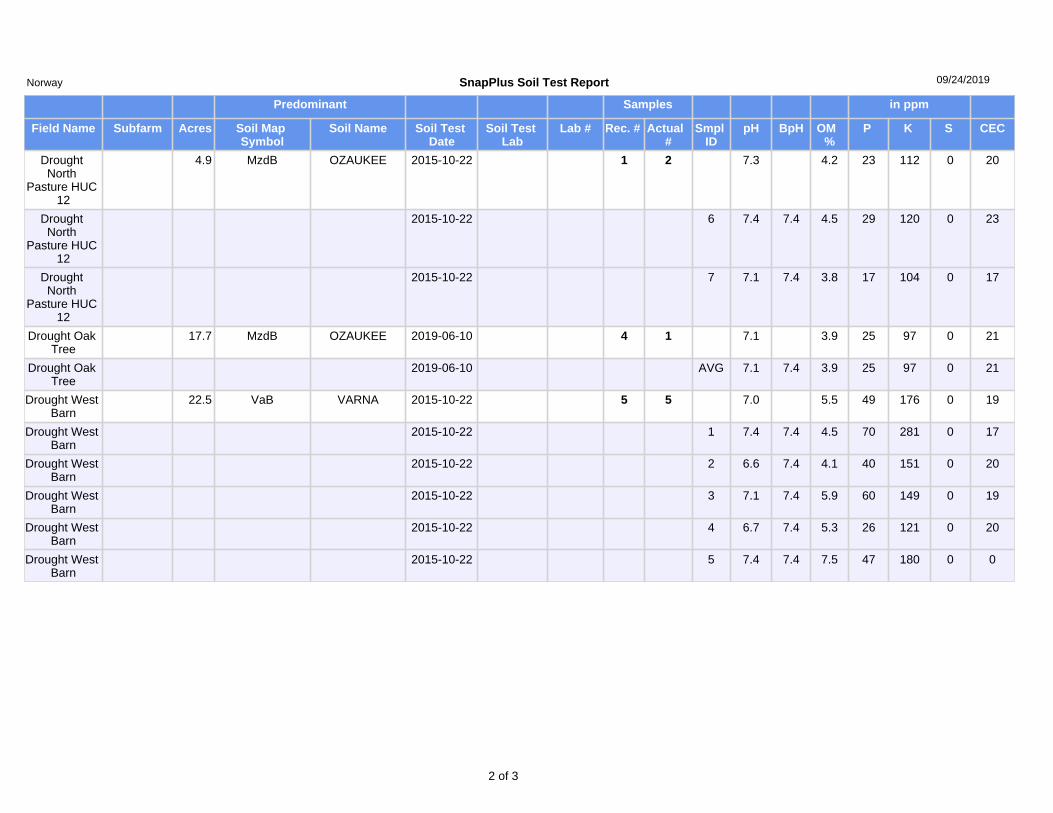
4.9 MzdB OZAUKEE 2015-10-22 1 2 7.3 4.2 23 112 0 20
Drought North
Pasture HUC 12
2015-10-22 6 7.4 7.4 4.5 29 120 0 23
Drought North
Pasture HUC 12
2015-10-22 7 7.1 7.4 3.8 17 104 0 17
Drought Oak Tree
17.7 MzdB OZAUKEE 2019-06-10 4 1 7.1 3.9 25 97 0 21
Drought Oak Tree
2019-06-10 AVG 7.1 7.4 3.9 25 97 0 21
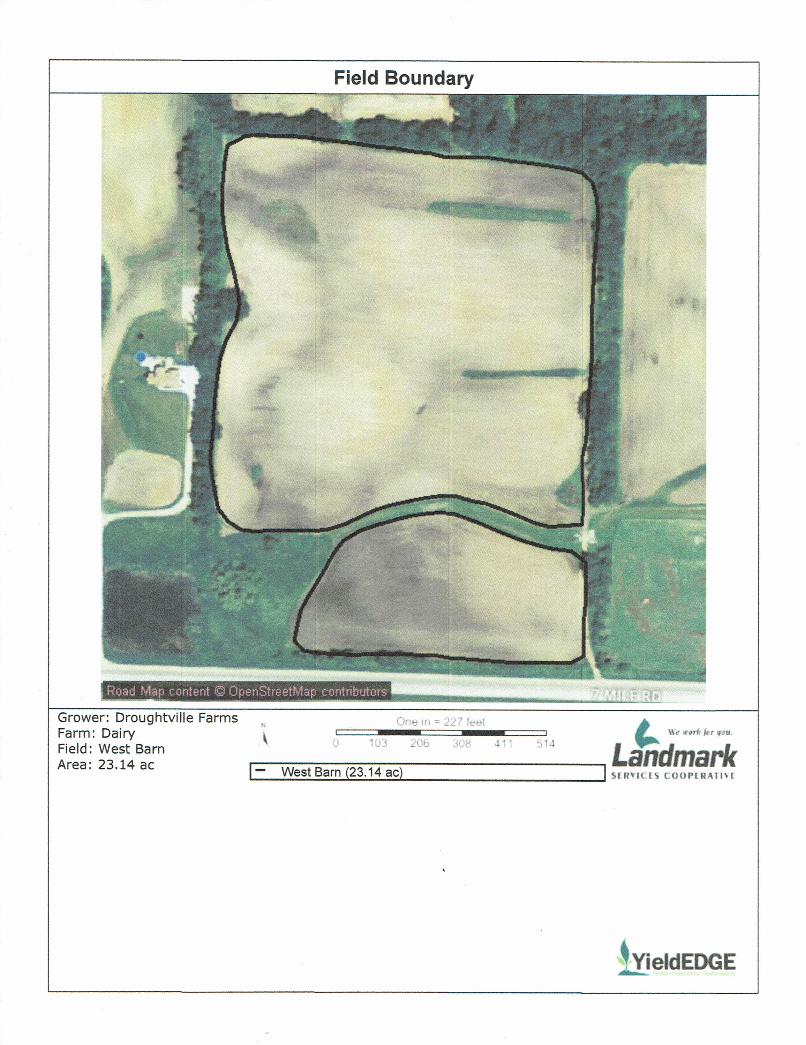
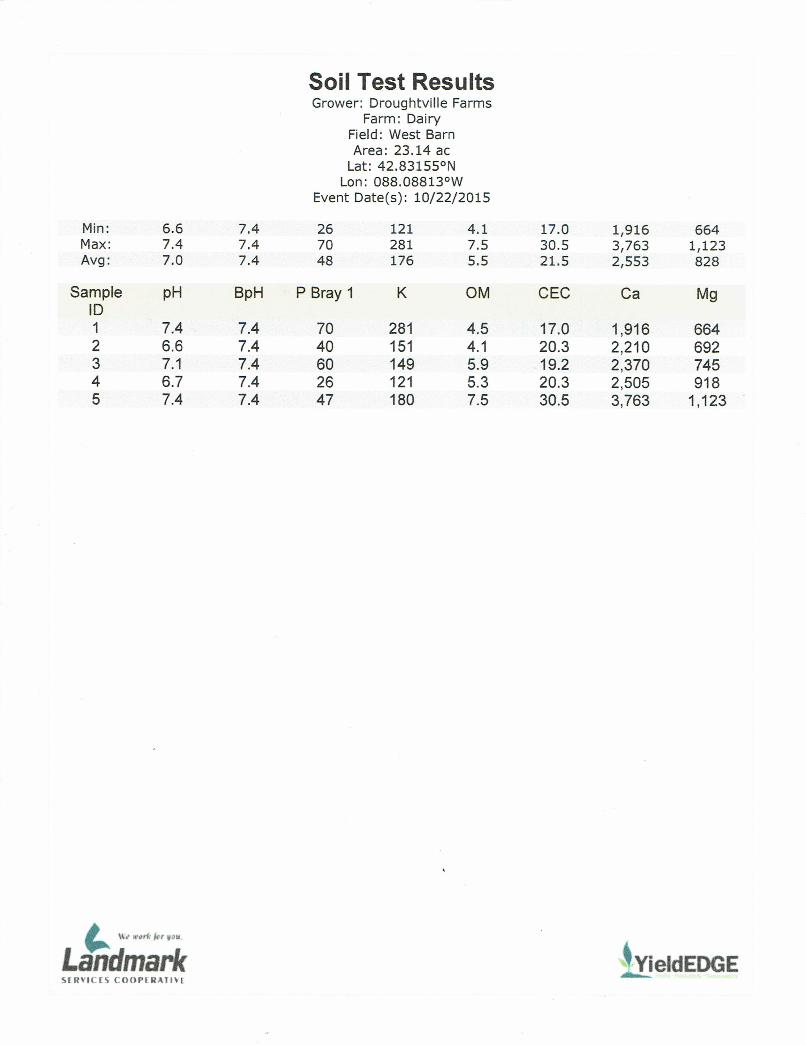
Drought West Barn
22.5 VaB VARNA 2015-10-22 5 5 7.0 5.5 49 176 0 19
Drought West Barn
2015-10-22 1 7.4 7.4 4.5 70 281 0 17
Drought West Barn
2015-10-22 2 6.6 7.4 4.1 40 151 0 20
Drought West Barn
2015-10-22 3 7.1 7.4 5.9 60 149 0 19
Drought West Barn
2015-10-22 4 6.7 7.4 5.3 26 121 0 20
Drought West Barn
2015-10-22 5 7.4 7.4 7.5 47 180 0 0
2 of 3
SnapPlus Soil Test ReportNorway 09/24/2019
Field Name
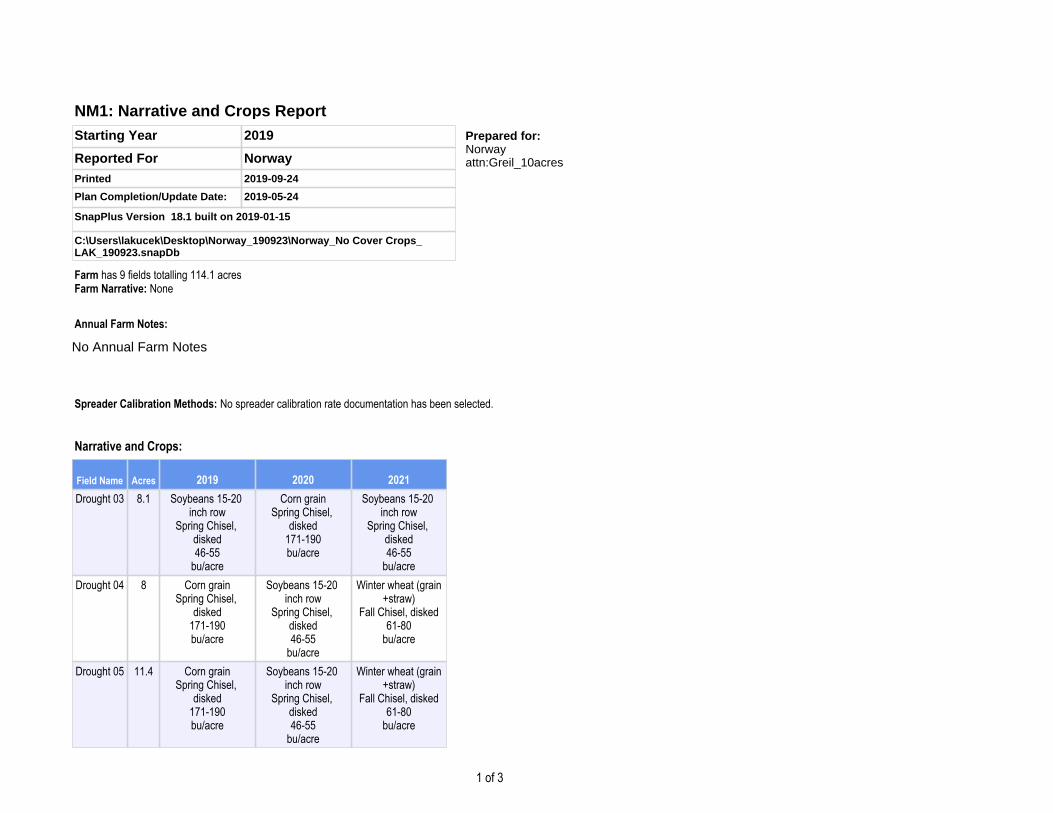
Acres 2019 2020 2021Drought 03 8.1 Soybeans 15-20
inch rowSpring Chisel,
disked46-55
bu/acre
Corn grainSpring Chisel,
disked171-190bu/acre
Soybeans 15-20 inch row
Spring Chisel, disked46-55
bu/acreDrought 04 8 Corn grain
Spring Chisel, disked
171-190bu/acre
Soybeans 15-20 inch row
Spring Chisel, disked46-55
bu/acre
Winter wheat (grain+straw)
Fall Chisel, disked61-80
bu/acre
Drought 05 11.4 Corn grainSpring Chisel,
disked171-190bu/acre
Soybeans 15-20 inch row
Spring Chisel, disked46-55
bu/acre
Winter wheat (grain+straw)
Fall Chisel, disked61-80
bu/acre
Farm has 9 fields totalling 114.1 acresFarm Narrative: None
Starting Year 2019
Reported For Norway Printed 2019-09-24
Plan Completion/Update Date: 2019-05-24
SnapPlus Version 18.1 built on 2019-01-15
C:\Users\lakucek\Desktop\Norway_190923\Norway_No Cover Crops_ LAK_190923.snapDb
Prepared for:Norway attn:Greil_10acres
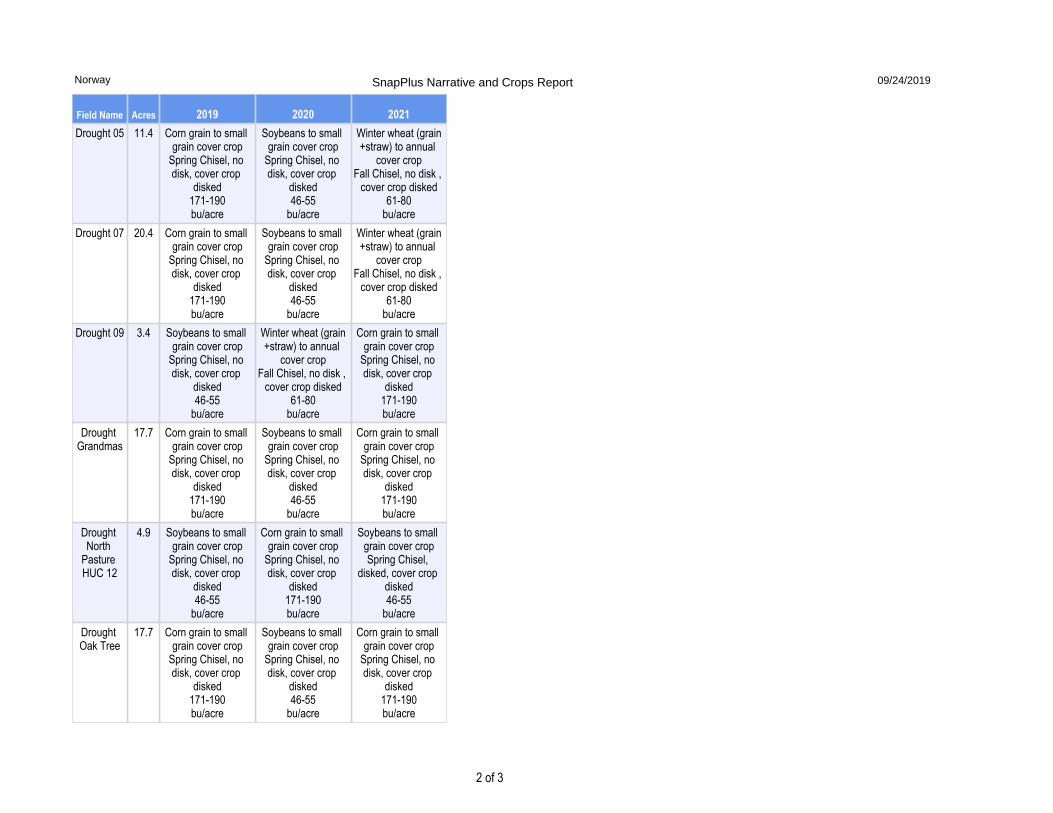
NM1: Narrative and Crops Report
No Annual Farm Notes
Annual Farm Notes:
Narrative and Crops:
Spreader Calibration Methods: No spreader calibration rate documentation has been selected.
1 of 3
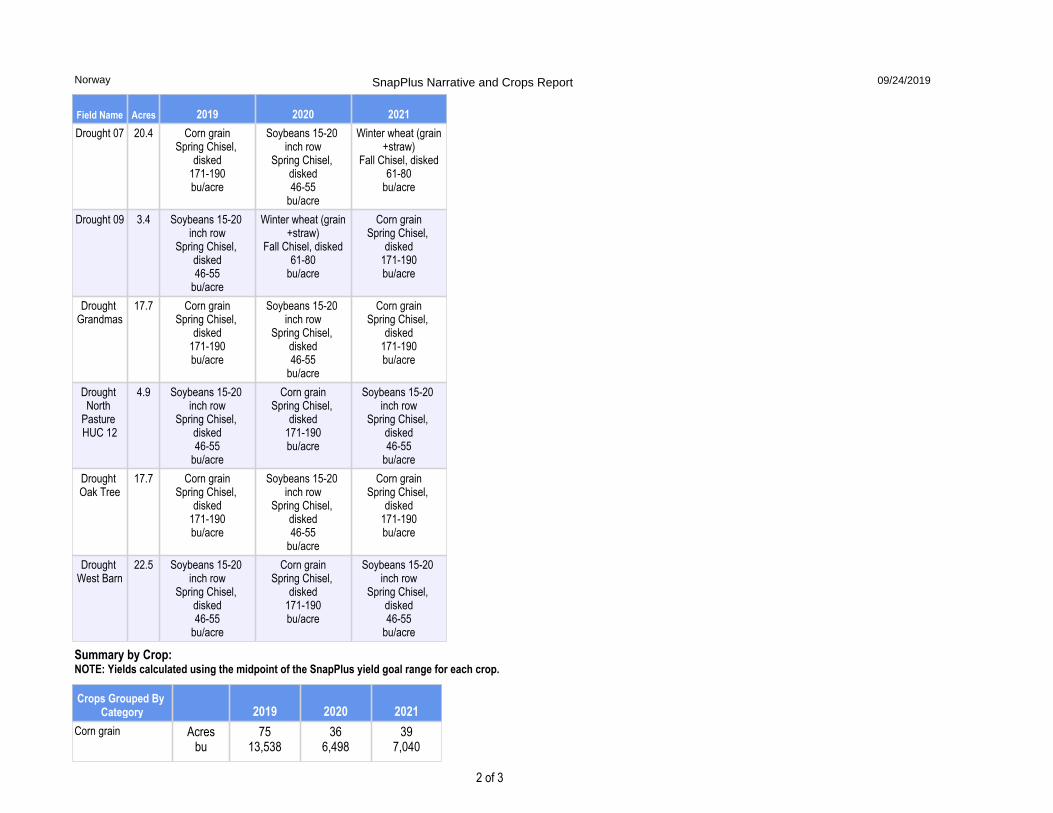
Field Name
Acres 2019 2020 2021Drought 07 20.4 Corn grain
Spring Chisel, disked
171-190bu/acre
Soybeans 15-20 inch row
Spring Chisel, disked46-55
bu/acre
Winter wheat (grain+straw)
Fall Chisel, disked61-80
bu/acre
Drought 09 3.4 Soybeans 15-20 inch row
Spring Chisel, disked46-55
bu/acre
Winter wheat (grain+straw)
Fall Chisel, disked61-80
bu/acre
Corn grainSpring Chisel,
disked171-190bu/acre
Drought Grandmas
17.7 Corn grainSpring Chisel,
disked171-190bu/acre
Soybeans 15-20 inch row
Spring Chisel, disked46-55
bu/acre
Corn grainSpring Chisel,
disked171-190bu/acre
Drought North
Pasture HUC 12
4.9 Soybeans 15-20 inch row
Spring Chisel, disked46-55
bu/acre
Corn grainSpring Chisel,
disked171-190bu/acre
Soybeans 15-20 inch row
Spring Chisel, disked46-55
bu/acreDrought Oak Tree
17.7 Corn grainSpring Chisel,
disked171-190bu/acre
Soybeans 15-20 inch row
Spring Chisel, disked46-55
bu/acre
Corn grainSpring Chisel,
disked171-190bu/acre
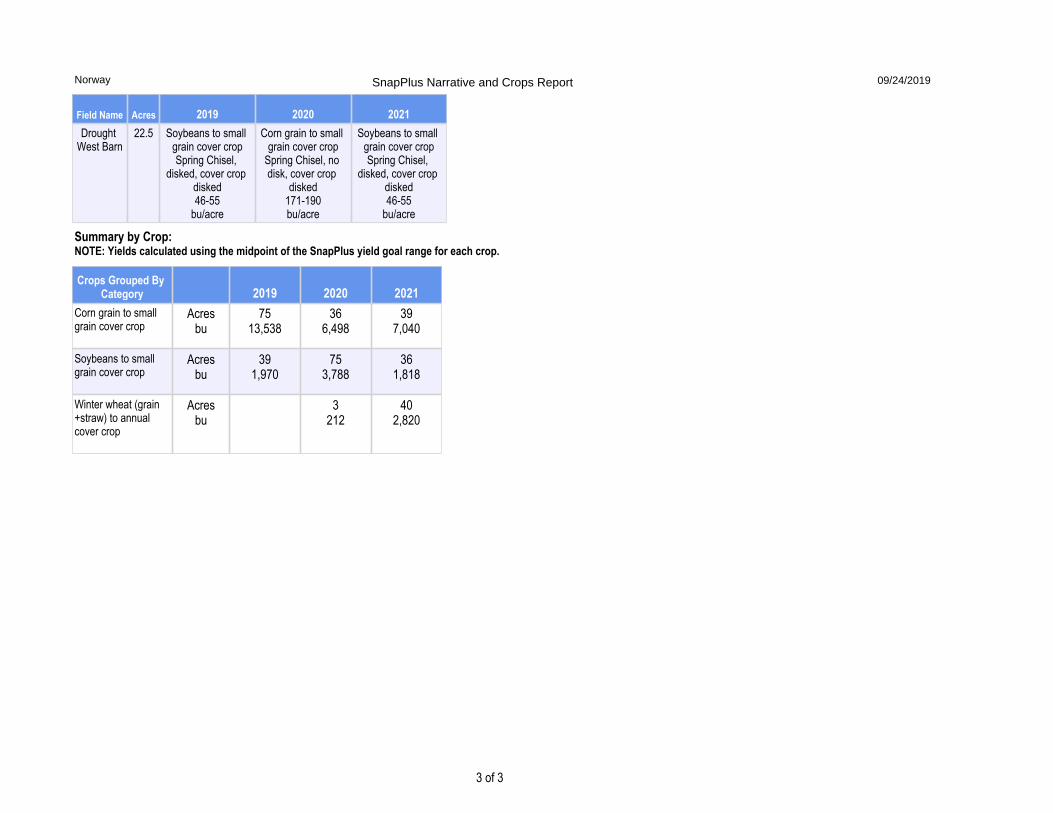
Drought West Barn
22.5 Soybeans 15-20 inch row
Spring Chisel, disked46-55
bu/acre
Corn grainSpring Chisel,
disked171-190bu/acre
Soybeans 15-20 inch row
Spring Chisel, disked46-55
bu/acre
Crops Grouped By Category 2019 2020 2021
Corn grain
Acresbu
7513,538
366,498
397,040
Summary by Crop:NOTE: Yields calculated using the midpoint of the SnapPlus yield goal range for each crop.
2 of 3
SnapPlus Narrative and Crops ReportNorway 09/24/2019
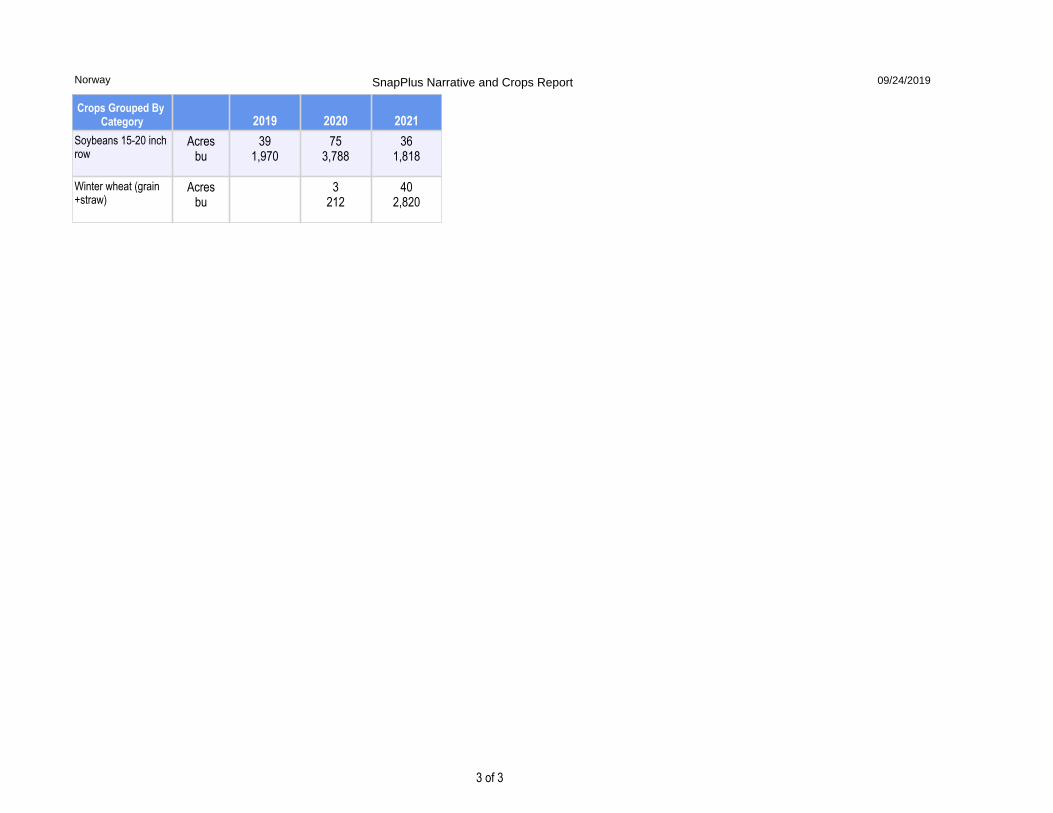
Crops Grouped By Category 2019 2020 2021
Soybeans 15-20 inch row
Acresbu
391,970
753,788
361,818
Winter wheat (grain+straw)
Acresbu
3212
402,820
3 of 3
SnapPlus Narrative and Crops ReportNorway 09/24/2019
SNAPPLUS MODEL – WITH COVER CROP
(PROPOSED CONDITION)

WQ1: P Trade Report
Reported For Norway
Printed 2019-09-24
Plan Completion/Update Date 2019-05-24
SnapPlus Version 18.1 built on 2019-01-15
C:\Users\lakucek\Desktop\Norway_190923\Norway_Cover Crops_ LAK_190610.snapDb
Prepared for:Norway attn:Greil_10acres
P Trade Report PTP
Field Name Soil SeriesSoil
Symbol Acres 2021
Drought 03 OZAUKEE MzdB 8 12
Drought 04 OZAUKEE MzdB 8 52
Drought 05 VARNA VaB 11 47
Drought 07 OZAUKEE MzdB 20 147
Drought 09 OZAUKEE MzdB 3 17
Drought Grandmas VARNA VaB 18 63
Drought North Pasture HUC 12 OZAUKEE MzdB 5 12
Drought Oak Tree OZAUKEE MzdB 18 92
Questions? Please contact [email protected]
The P Trade Report estimates the annual pounds of phosphorus (P) in surface runoff from cropland entering surface waters. These P loss calculations are based on a field's soil test P concentration, crops, tillage, nutrient management practices and estimates of average runoff and sheet and rill erosion for the predominant soil type. Losses from concentrated flow channel or gully erosion with a field are not included in these calculations. Field runoff losses are calculated for each year as PTP (lb P/field/yr). Fields are only included if there are at least 2 years of crops before the selected start year. Before using this report as part of a Water Quality Trade activity, phosphorus losses (PTP) must be converted into ‘P credits’ according to DNR guidance.
For more information go to http://dnr.wi.gov/ and type keyword: Water Quality Trading
This report was developed for Wisconsin DNR Water Quality Trading and Adaptive Management purposes and cannot be used to demonstrate compliance with NR 151 or NRCS 590 NM plan requirements.
1 of 2
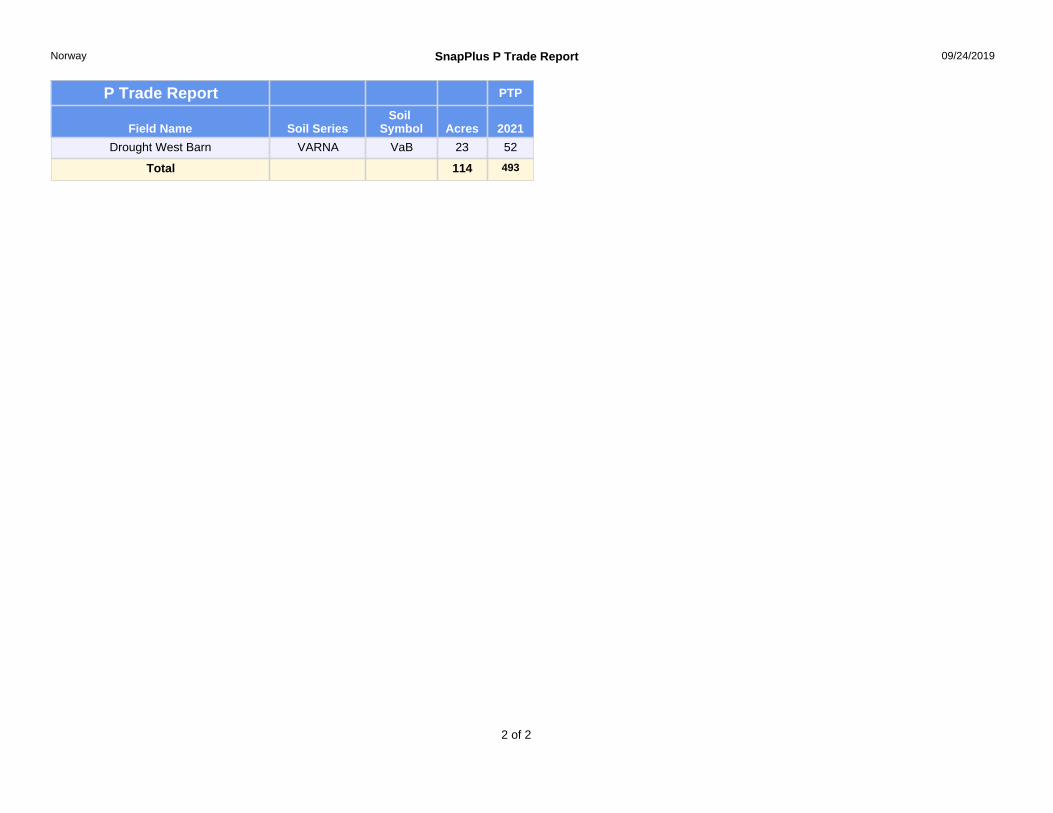
P Trade Report PTP
Field Name Soil SeriesSoil
Symbol Acres 2021
Drought West Barn VARNA VaB 23 52
Total 114 493
2 of 2
Norway SnapPlus P Trade Report 09/24/2019
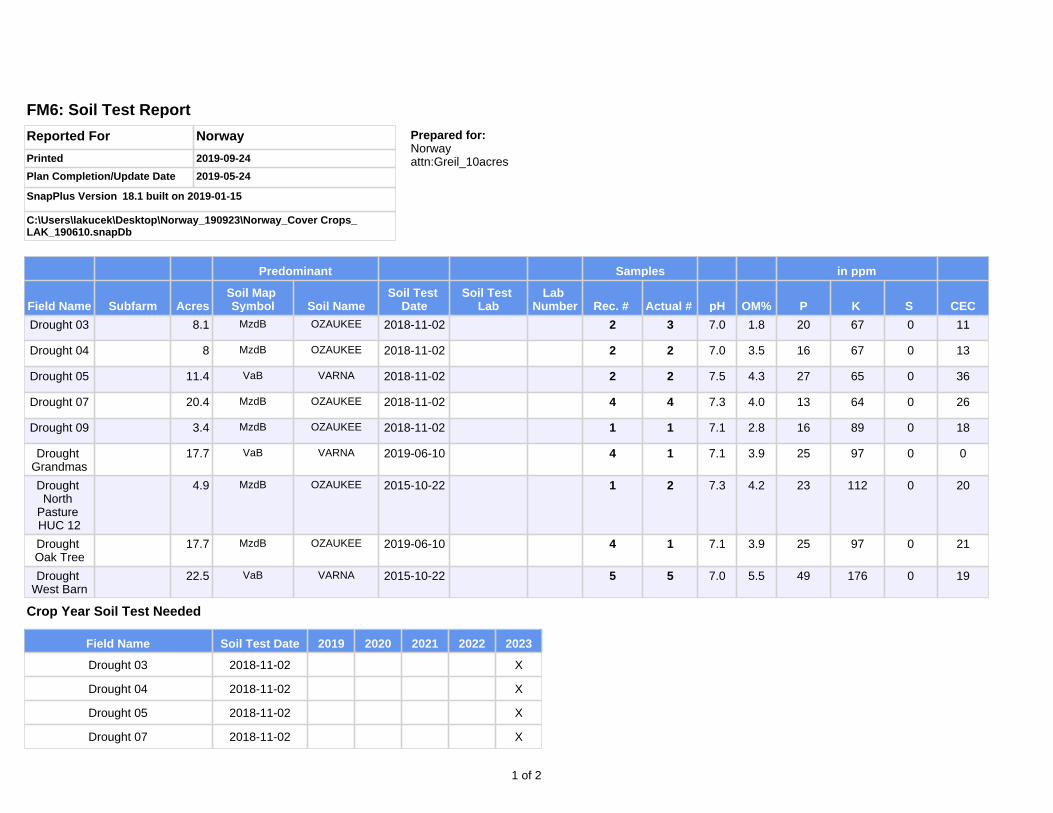
Predominant Samples in ppm
Field Name Subfarm AcresSoil Map Symbol Soil Name
Soil Test Date
Soil Test Lab
Lab Number Rec. # Actual # pH OM% P K S CEC
Drought 03 8.1 MzdB OZAUKEE 2018-11-02 2 3 7.0 1.8 20 67 0 11
Drought 04 8 MzdB OZAUKEE 2018-11-02 2 2 7.0 3.5 16 67 0 13
Drought 05 11.4 VaB VARNA 2018-11-02 2 2 7.5 4.3 27 65 0 36
Drought 07 20.4 MzdB OZAUKEE 2018-11-02 4 4 7.3 4.0 13 64 0 26
Drought 09 3.4 MzdB OZAUKEE 2018-11-02 1 1 7.1 2.8 16 89 0 18
Drought Grandmas
17.7 VaB VARNA 2019-06-10 4 1 7.1 3.9 25 97 0 0
Drought North
Pasture HUC 12
4.9 MzdB OZAUKEE 2015-10-22 1 2 7.3 4.2 23 112 0 20
Drought Oak Tree
17.7 MzdB OZAUKEE 2019-06-10 4 1 7.1 3.9 25 97 0 21
Drought West Barn
22.5 VaB VARNA 2015-10-22 5 5 7.0 5.5 49 176 0 19
FM6: Soil Test Report
Reported For Norway
Printed 2019-09-24
Plan Completion/Update Date 2019-05-24
SnapPlus Version 18.1 built on 2019-01-15
C:\Users\lakucek\Desktop\Norway_190923\Norway_Cover Crops_ LAK_190610.snapDb
Prepared for:Norway attn:Greil_10acres
Field Name Soil Test Date 2019 2020 2021 2022 2023
Drought 03 2018-11-02 X
Drought 04 2018-11-02 X
Drought 05 2018-11-02 X
Drought 07 2018-11-02 X
Crop Year Soil Test Needed
1 of 2
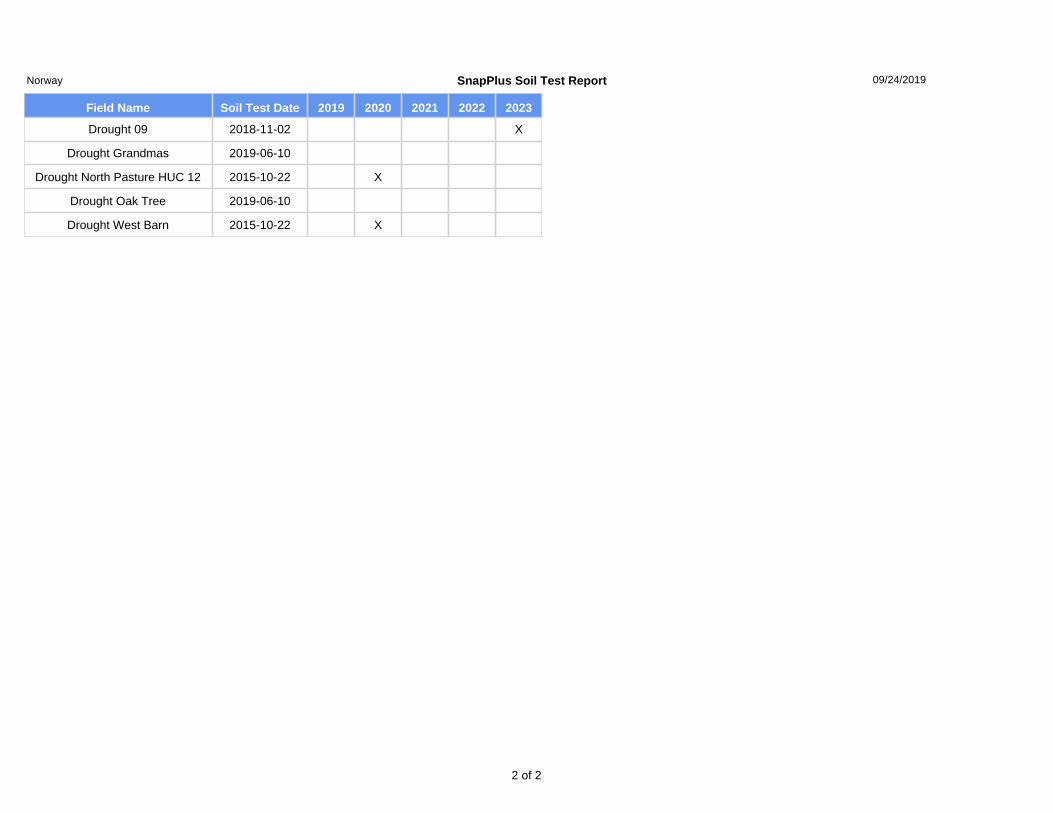
Field Name Soil Test Date 2019 2020 2021 2022 2023
Drought 09 2018-11-02 X
Drought Grandmas 2019-06-10
Drought North Pasture HUC 12 2015-10-22 X
Drought Oak Tree 2019-06-10
Drought West Barn 2015-10-22 X
2 of 2
SnapPlus Soil Test ReportNorway 09/24/2019
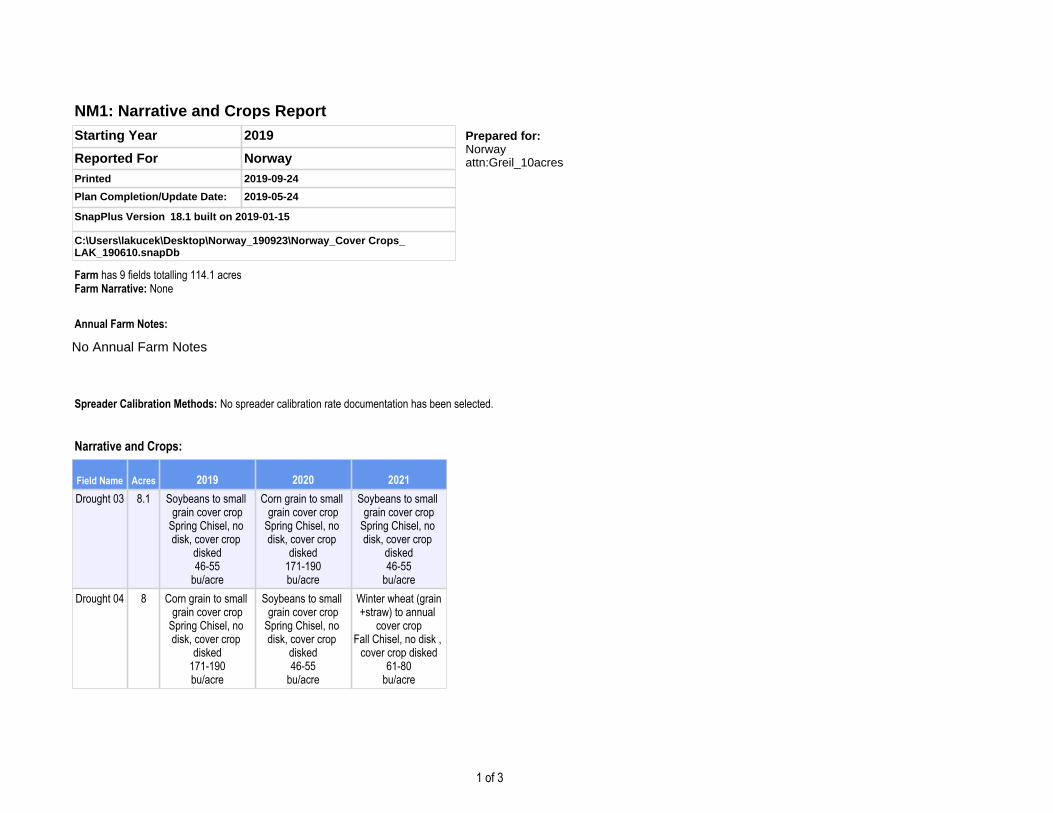
Field Name
Acres 2019 2020 2021Drought 03 8.1 Soybeans to small
grain cover cropSpring Chisel, no disk, cover crop
disked46-55
bu/acre
Corn grain to small grain cover crop
Spring Chisel, no disk, cover crop
disked171-190bu/acre
Soybeans to small grain cover crop
Spring Chisel, no disk, cover crop
disked46-55
bu/acreDrought 04 8 Corn grain to small
grain cover cropSpring Chisel, no disk, cover crop
disked171-190bu/acre
Soybeans to small grain cover crop
Spring Chisel, no disk, cover crop
disked46-55
bu/acre
Winter wheat (grain+straw) to annual
cover cropFall Chisel, no disk ,
cover crop disked61-80
bu/acre
Farm has 9 fields totalling 114.1 acresFarm Narrative: None
Starting Year 2019
Reported For Norway Printed 2019-09-24
Plan Completion/Update Date: 2019-05-24
SnapPlus Version 18.1 built on 2019-01-15
C:\Users\lakucek\Desktop\Norway_190923\Norway_Cover Crops_ LAK_190610.snapDb
Prepared for:Norway attn:Greil_10acres
NM1: Narrative and Crops Report
No Annual Farm Notes
Annual Farm Notes:
Narrative and Crops:
Spreader Calibration Methods: No spreader calibration rate documentation has been selected.
1 of 3
Field Name
Acres 2019 2020 2021Drought 05 11.4 Corn grain to small
grain cover cropSpring Chisel, no disk, cover crop
disked171-190bu/acre
Soybeans to small grain cover crop
Spring Chisel, no disk, cover crop
disked46-55
bu/acre
Winter wheat (grain+straw) to annual
cover cropFall Chisel, no disk ,
cover crop disked61-80
bu/acreDrought 07 20.4 Corn grain to small
grain cover cropSpring Chisel, no disk, cover crop
disked171-190bu/acre
Soybeans to small grain cover crop
Spring Chisel, no disk, cover crop
disked46-55
bu/acre
Winter wheat (grain+straw) to annual
cover cropFall Chisel, no disk ,
cover crop disked61-80
bu/acreDrought 09 3.4 Soybeans to small
grain cover cropSpring Chisel, no disk, cover crop
disked46-55
bu/acre
Winter wheat (grain+straw) to annual
cover cropFall Chisel, no disk ,
cover crop disked61-80
bu/acre
Corn grain to small grain cover crop
Spring Chisel, no disk, cover crop
disked171-190bu/acre
Drought Grandmas
17.7 Corn grain to small grain cover crop
Spring Chisel, no disk, cover crop
disked171-190bu/acre
Soybeans to small grain cover crop
Spring Chisel, no disk, cover crop
disked46-55
bu/acre
Corn grain to small grain cover crop
Spring Chisel, no disk, cover crop
disked171-190bu/acre
Drought North
Pasture HUC 12
4.9 Soybeans to small grain cover crop
Spring Chisel, no disk, cover crop
disked46-55
bu/acre
Corn grain to small grain cover crop
Spring Chisel, no disk, cover crop
disked171-190bu/acre
Soybeans to small grain cover cropSpring Chisel,
disked, cover crop disked46-55
bu/acreDrought Oak Tree
17.7 Corn grain to small grain cover crop
Spring Chisel, no disk, cover crop
disked171-190bu/acre
Soybeans to small grain cover crop
Spring Chisel, no disk, cover crop
disked46-55
bu/acre
Corn grain to small grain cover crop
Spring Chisel, no disk, cover crop
disked171-190bu/acre
2 of 3
SnapPlus Narrative and Crops ReportNorway 09/24/2019
Field Name
Acres 2019 2020 2021Drought
West Barn22.5 Soybeans to small
grain cover cropSpring Chisel,
disked, cover crop disked46-55
bu/acre
Corn grain to small grain cover crop
Spring Chisel, no disk, cover crop
disked171-190bu/acre
Soybeans to small grain cover cropSpring Chisel,
disked, cover crop disked46-55
bu/acre
Crops Grouped By Category 2019 2020 2021
Corn grain to small grain cover crop
Acresbu
7513,538
366,498
397,040
Soybeans to small grain cover crop
Acresbu
391,970
753,788
361,818
Winter wheat (grain+straw) to annual cover crop
Acresbu
3212
402,820
Summary by Crop:NOTE: Yields calculated using the midpoint of the SnapPlus yield goal range for each crop.
3 of 3
SnapPlus Narrative and Crops ReportNorway 09/24/2019
RAW DATA FROM LINDSEY DROUGHT
BMP TECHNICAL STANDARD NATURAL RESOURCES
CONSERVATION SERVICE (NRCS)
340 - 1
NATURAL RESOURCES CONSERVATION SERVICE CONSERVATION PRACTICE STANDARD
COVER CROP (Ac.)
CODE 340
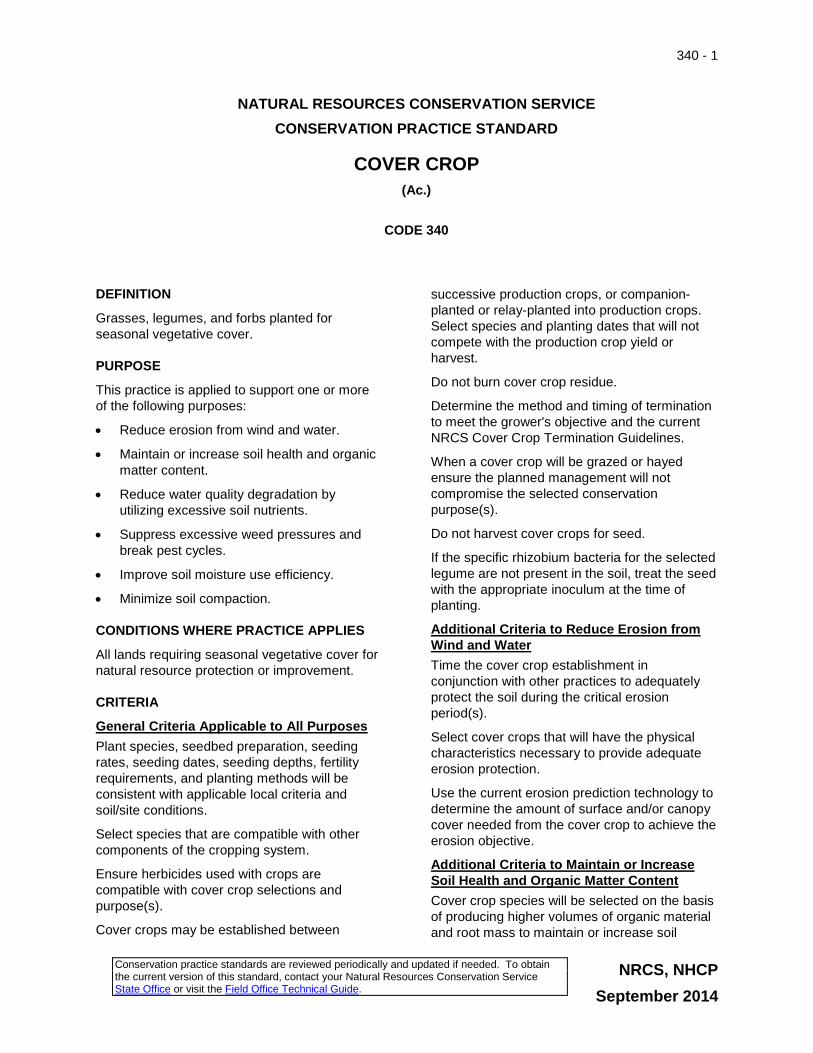
DEFINITION
Grasses, legumes, and forbs planted for seasonal vegetative cover.
PURPOSE
This practice is applied to support one or more of the following purposes:
• Reduce erosion from wind and water.
• Maintain or increase soil health and organic matter content.
• Reduce water quality degradation by utilizing excessive soil nutrients.
• Suppress excessive weed pressures and break pest cycles.
• Improve soil moisture use efficiency.
• Minimize soil compaction.
CONDITIONS WHERE PRACTICE APPLIES
All lands requiring seasonal vegetative cover for natural resource protection or improvement.
CRITERIA
General Criteria Applicable to All Purposes Plant species, seedbed preparation, seeding rates, seeding dates, seeding depths, fertility requirements, and planting methods will be consistent with applicable local criteria and soil/site conditions.
Select species that are compatible with other components of the cropping system.
Ensure herbicides used with crops are compatible with cover crop selections and purpose(s).
Cover crops may be established between
successive production crops, or companion-planted or relay-planted into production crops. Select species and planting dates that will not compete with the production crop yield or harvest.
Do not burn cover crop residue.
Determine the method and timing of termination to meet the grower's objective and the current NRCS Cover Crop Termination Guidelines.
When a cover crop will be grazed or hayed ensure the planned management will not compromise the selected conservation purpose(s).
Do not harvest cover crops for seed.
If the specific rhizobium bacteria for the selected legume are not present in the soil, treat the seed with the appropriate inoculum at the time of planting.
Additional Criteria to Reduce Erosion from Wind and Water Time the cover crop establishment in conjunction with other practices to adequately protect the soil during the critical erosion period(s).
Select cover crops that will have the physical characteristics necessary to provide adequate erosion protection.
Use the current erosion prediction technology to determine the amount of surface and/or canopy cover needed from the cover crop to achieve the erosion objective.
Additional Criteria to Maintain or Increase Soil Health and Organic Matter Content Cover crop species will be selected on the basis of producing higher volumes of organic material and root mass to maintain or increase soil
NRCS, NHCP September 2014
Conservation practice standards are reviewed periodically and updated if needed. To obtain the current version of this standard, contact your Natural Resources Conservation Service State Office or visit the Field Office Technical Guide.
340 - 2
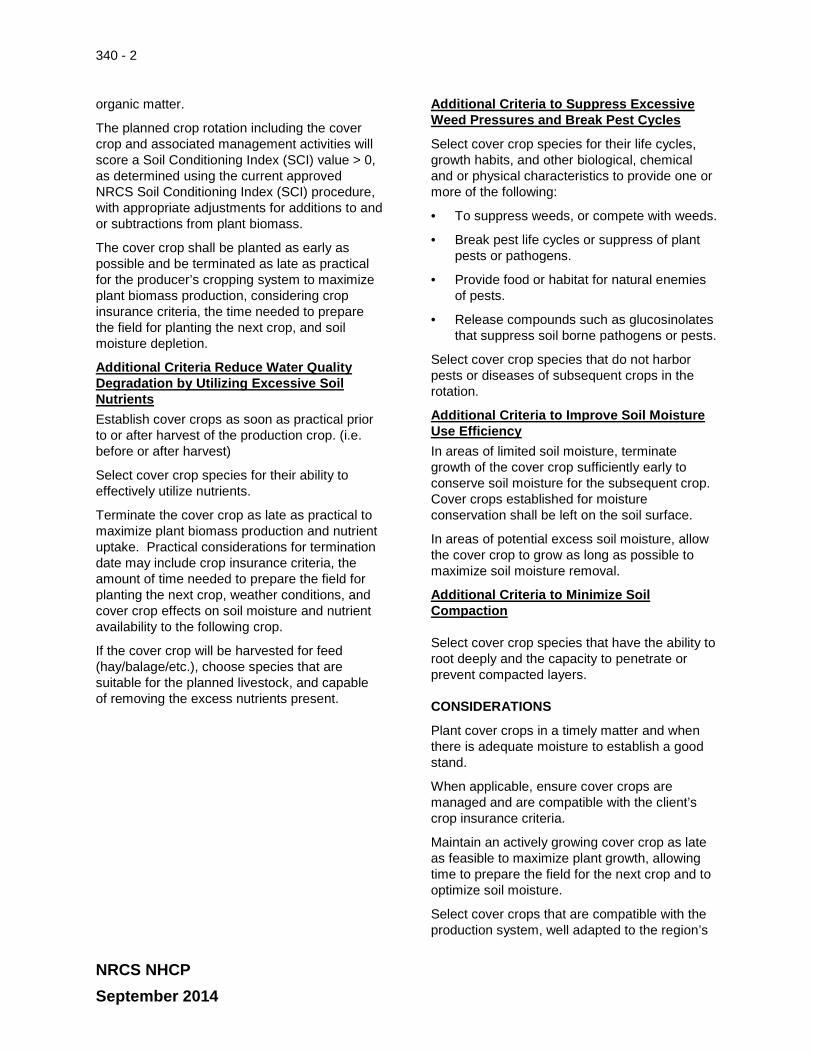
organic matter.
The planned crop rotation including the cover crop and associated management activities will score a Soil Conditioning Index (SCI) value > 0, as determined using the current approved NRCS Soil Conditioning Index (SCI) procedure, with appropriate adjustments for additions to and or subtractions from plant biomass.
The cover crop shall be planted as early as possible and be terminated as late as practical for the producer’s cropping system to maximize plant biomass production, considering crop insurance criteria, the time needed to prepare the field for planting the next crop, and soil moisture depletion.
Additional Criteria Reduce Water Quality Degradation by Utilizing Excessive Soil Nutrients Establish cover crops as soon as practical prior to or after harvest of the production crop. (i.e. before or after harvest)
Select cover crop species for their ability to effectively utilize nutrients.
Terminate the cover crop as late as practical to maximize plant biomass production and nutrient uptake. Practical considerations for termination date may include crop insurance criteria, the amount of time needed to prepare the field for planting the next crop, weather conditions, and cover crop effects on soil moisture and nutrient availability to the following crop.
If the cover crop will be harvested for feed (hay/balage/etc.), choose species that are suitable for the planned livestock, and capable of removing the excess nutrients present.
Additional Criteria to Suppress Excessive Weed Pressures and Break Pest Cycles
Select cover crop species for their life cycles, growth habits, and other biological, chemical and or physical characteristics to provide one or more of the following:
• To suppress weeds, or compete with weeds.
• Break pest life cycles or suppress of plant pests or pathogens.
• Provide food or habitat for natural enemies of pests.
• Release compounds such as glucosinolates that suppress soil borne pathogens or pests.
Select cover crop species that do not harbor pests or diseases of subsequent crops in the rotation.
Additional Criteria to Improve Soil Moisture Use Efficiency In areas of limited soil moisture, terminate growth of the cover crop sufficiently early to conserve soil moisture for the subsequent crop. Cover crops established for moisture conservation shall be left on the soil surface.
In areas of potential excess soil moisture, allow the cover crop to grow as long as possible to maximize soil moisture removal.
Additional Criteria to Minimize Soil Compaction
Select cover crop species that have the ability to root deeply and the capacity to penetrate or prevent compacted layers.
CONSIDERATIONS
Plant cover crops in a timely matter and when there is adequate moisture to establish a good stand.
When applicable, ensure cover crops are managed and are compatible with the client’s crop insurance criteria.
Maintain an actively growing cover crop as late as feasible to maximize plant growth, allowing time to prepare the field for the next crop and to optimize soil moisture.
Select cover crops that are compatible with the production system, well adapted to the region’s
NRCS NHCP September 2014
340 - 3
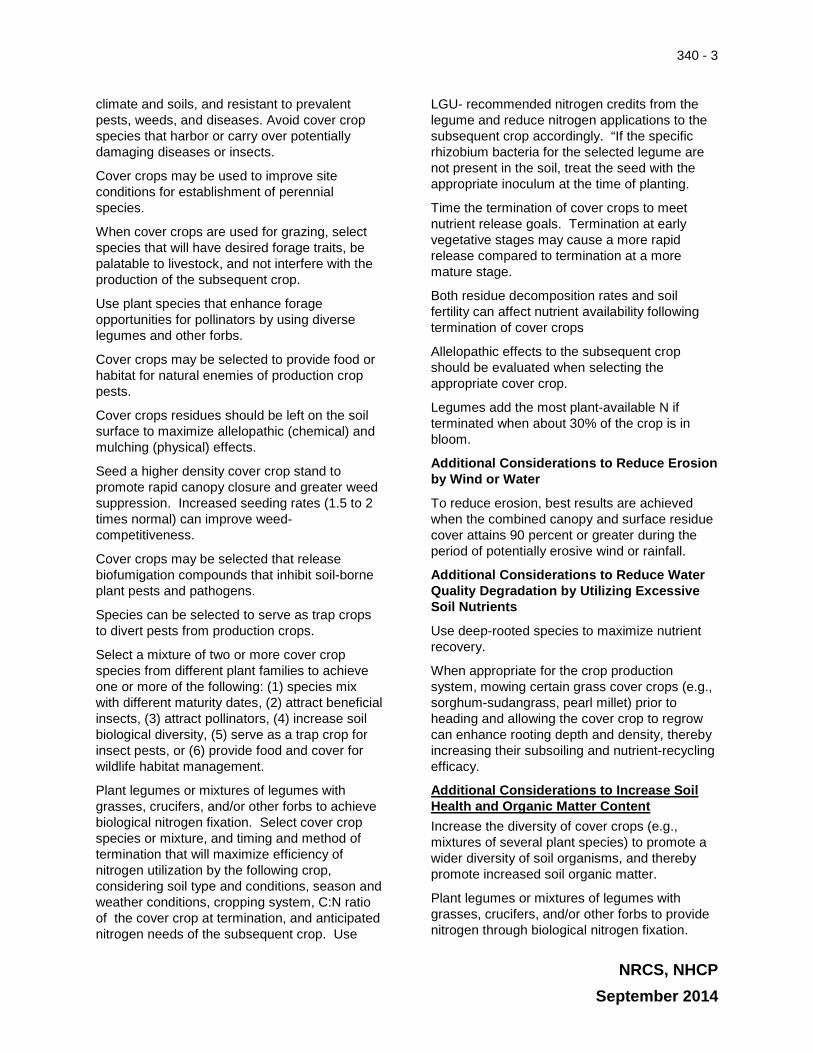
climate and soils, and resistant to prevalent pests, weeds, and diseases. Avoid cover crop species that harbor or carry over potentially damaging diseases or insects.
Cover crops may be used to improve site conditions for establishment of perennial species.
When cover crops are used for grazing, select species that will have desired forage traits, be palatable to livestock, and not interfere with the production of the subsequent crop.
Use plant species that enhance forage opportunities for pollinators by using diverse legumes and other forbs.
Cover crops may be selected to provide food or habitat for natural enemies of production crop pests.
Cover crops residues should be left on the soil surface to maximize allelopathic (chemical) and mulching (physical) effects.
Seed a higher density cover crop stand to promote rapid canopy closure and greater weed suppression. Increased seeding rates (1.5 to 2 times normal) can improve weed-competitiveness.
Cover crops may be selected that release biofumigation compounds that inhibit soil-borne plant pests and pathogens.
Species can be selected to serve as trap crops to divert pests from production crops.
Select a mixture of two or more cover crop species from different plant families to achieve one or more of the following: (1) species mix with different maturity dates, (2) attract beneficial insects, (3) attract pollinators, (4) increase soil biological diversity, (5) serve as a trap crop for insect pests, or (6) provide food and cover for wildlife habitat management.
Plant legumes or mixtures of legumes with grasses, crucifers, and/or other forbs to achieve biological nitrogen fixation. Select cover crop species or mixture, and timing and method of termination that will maximize efficiency of nitrogen utilization by the following crop, considering soil type and conditions, season and weather conditions, cropping system, C:N ratio of the cover crop at termination, and anticipated nitrogen needs of the subsequent crop. Use
LGU- recommended nitrogen credits from the legume and reduce nitrogen applications to the subsequent crop accordingly. “If the specific rhizobium bacteria for the selected legume are not present in the soil, treat the seed with the appropriate inoculum at the time of planting.
Time the termination of cover crops to meet nutrient release goals. Termination at early vegetative stages may cause a more rapid release compared to termination at a more mature stage.
Both residue decomposition rates and soil fertility can affect nutrient availability following termination of cover crops
Allelopathic effects to the subsequent crop should be evaluated when selecting the appropriate cover crop.
Legumes add the most plant-available N if terminated when about 30% of the crop is in bloom.
Additional Considerations to Reduce Erosion by Wind or Water
To reduce erosion, best results are achieved when the combined canopy and surface residue cover attains 90 percent or greater during the period of potentially erosive wind or rainfall.
Additional Considerations to Reduce Water Quality Degradation by Utilizing Excessive Soil Nutrients
Use deep-rooted species to maximize nutrient recovery.
When appropriate for the crop production system, mowing certain grass cover crops (e.g., sorghum-sudangrass, pearl millet) prior to heading and allowing the cover crop to regrow can enhance rooting depth and density, thereby increasing their subsoiling and nutrient-recycling efficacy.
Additional Considerations to Increase Soil Health and Organic Matter Content Increase the diversity of cover crops (e.g., mixtures of several plant species) to promote a wider diversity of soil organisms, and thereby promote increased soil organic matter.
Plant legumes or mixtures of legumes with grasses, crucifers, and/or other forbs to provide nitrogen through biological nitrogen fixation.
NRCS, NHCP September 2014
340 - 4
Legumes add the most plant-available N if terminated when about 30% of the crop is in bloom.
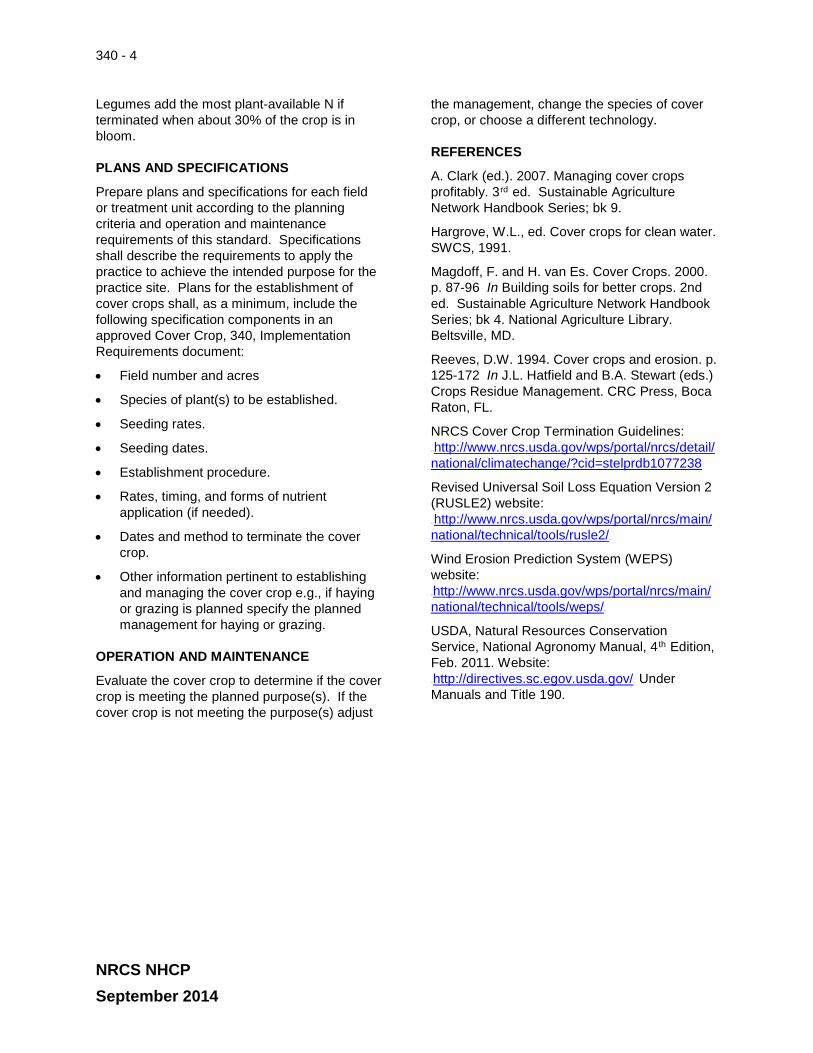
PLANS AND SPECIFICATIONS
Prepare plans and specifications for each field or treatment unit according to the planning criteria and operation and maintenance requirements of this standard. Specifications shall describe the requirements to apply the practice to achieve the intended purpose for the practice site. Plans for the establishment of cover crops shall, as a minimum, include the following specification components in an approved Cover Crop, 340, Implementation Requirements document:
• Field number and acres
• Species of plant(s) to be established.
• Seeding rates.
• Seeding dates.
• Establishment procedure.
• Rates, timing, and forms of nutrient application (if needed).
• Dates and method to terminate the cover crop.
• Other information pertinent to establishing and managing the cover crop e.g., if haying or grazing is planned specify the planned management for haying or grazing.
OPERATION AND MAINTENANCE
Evaluate the cover crop to determine if the cover crop is meeting the planned purpose(s). If the cover crop is not meeting the purpose(s) adjust
the management, change the species of cover crop, or choose a different technology.
REFERENCES
A. Clark (ed.). 2007. Managing cover crops profitably. 3P
rdP ed. Sustainable Agriculture
Network Handbook Series; bk 9.
Hargrove, W.L., ed. Cover crops for clean water. SWCS, 1991.
Magdoff, F. and H. van Es. Cover Crops. 2000. p. 87-96 In Building soils for better crops. 2nd ed. Sustainable Agriculture Network Handbook Series; bk 4. National Agriculture Library. Beltsville, MD.
Reeves, D.W. 1994. Cover crops and erosion. p. 125-172 In J.L. Hatfield and B.A. Stewart (eds.) Crops Residue Management. CRC Press, Boca Raton, FL.
NRCS Cover Crop Termination Guidelines: 21TUhttp://www.nrcs.usda.gov/wps/portal/nrcs/detail/national/climatechange/?cid=stelprdb1077238
Revised Universal Soil Loss Equation Version 2 (RUSLE2) website: 21TUhttp://www.nrcs.usda.gov/wps/portal/nrcs/main/national/technical/tools/rusle2/U21T
Wind Erosion Prediction System (WEPS) website: 21Thttp://www.nrcs.usda.gov/wps/portal/nrcs/main/national/technical/tools/weps/21T
USDA, Natural Resources Conservation Service, National Agronomy Manual, 4P
thP Edition,
Feb. 2011. Website: 21Thttp://directives.sc.egov.usda.gov/21T Under Manuals and Title 190.
NRCS NHCP September 2014
WATER QUALITY TRADING CHECKLIST
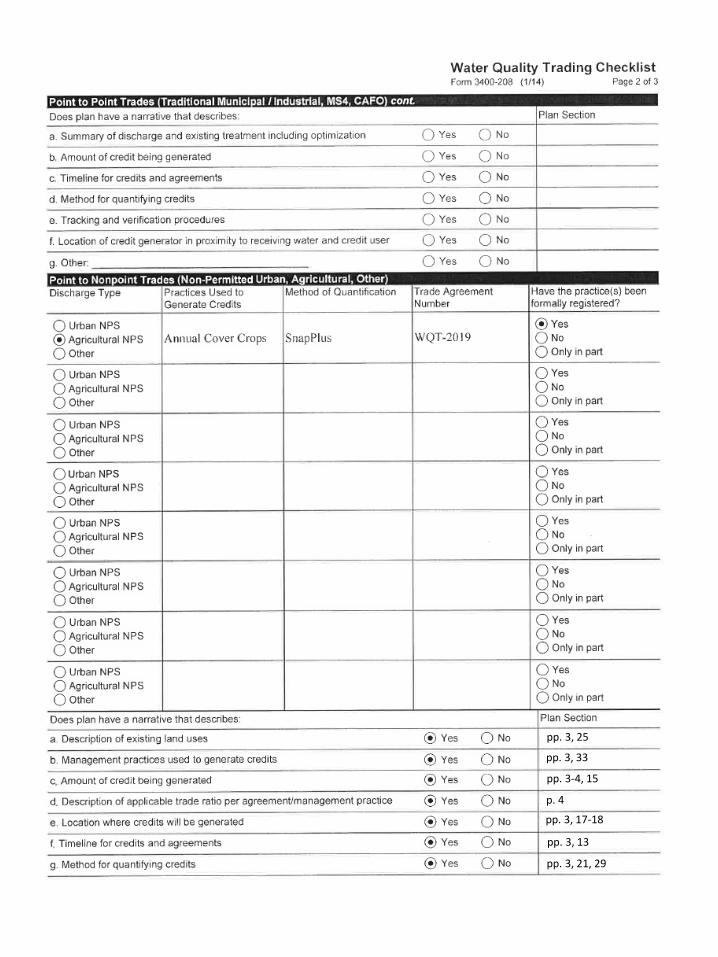
pp. 3, 25
pp. 3, 33
pp. 3-4, 15
p. 4
pp. 3, 17-18
pp. 3, 13
pp. 3, 21, 29
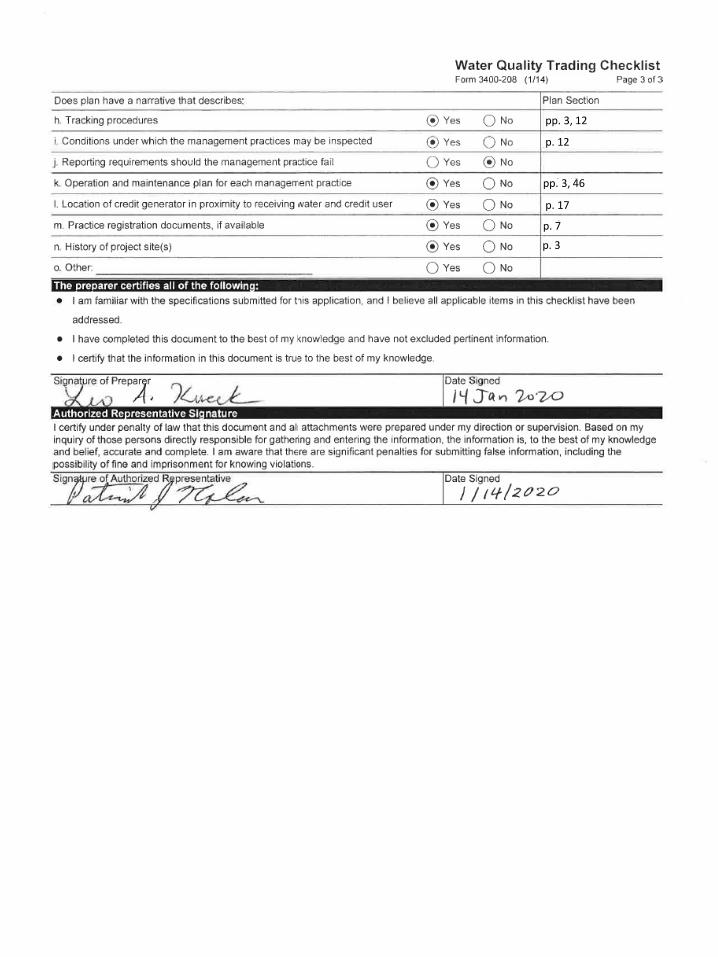
pp. 3, 12
p. 12
pp. 3, 46
p. 17
p. 7
p. 3