water quality within the york river estuary - vims.edu · duce water clarity, and serve to...
TRANSCRIPT
23
Water Quality within the York River EstuaryWilliam G. Reay
Virginia Institute of Marine Science Gloucester Point, VA 23062 U.S.A.
ABSTRACT
Key water quality management issues and threats within the Chesapeake Bay and its tidal tributaries include excess loadings of sediment and nutrients, and the introduction of toxic chemicals and microbial agents. Poor water clarity, principally controlled by suspended sediments and phytoplankton, is a persistent and widespread problem in the York River estuary with the oligoha-line and middle mesohaline regions failing to meet submerged aquatic vegetation (SAV) habitat requirements (SAV criteria: ~10 NTU and TSS < 15 mg L-1). Both the primary and more localized secondary estuarine turbidity maximum are associated with these regions where elevated surface (30-35 mg L-1) and bottom (80-105 mg L-1) water TSS levels are observed. While nonpoint agriculture sources dominate riverine sediment load inputs, tidal and nearshore erosion are a significant source of suspended sediment in the York River estuary. As with sediment, nonpoint agricultural sources dominate nutrient inputs and streamflow is a dominant controlling factor in explaining variability in annual loads. Within mainstem surface waters, TDN and TDP concentra-tions exhibit a decreasing trend with increasing salinity. TDN and TDP concentrations are on the order of 40-45 µmol L-1 and 1.2 µmol L-1, respectively, in the tidal freshwater reaches of the Pamunkey and Mattaponi Rivers and 22-24 µmol L-1 and 0.6 µmol L-1
in the polyhaline regions of the York River. Mean DON exhibits little variation between salinity regimes. Seasonal phytoplankton biomass and productivity vary between salinity regimes with mean monthly peak chlorophyll a concentrations on the order of 9-10 µg L-1 in the tidal freshwater reaches, 14-18 µg L-1 in the transition zone below the freshwater region, 25-28 µg L-1 in the upper and middle mesohaline reaches, and 15 µg L-1 in the lower meso-polyhaline region. Based on DIN:DIP molar ratios and limited nutrient enrichment studies, tidal freshwater regions experience year-round phosphorus limitation, shifting to seasonal nitrogen limitation in the lower oligo, meso and polyhaline regions of the York River. Harmful algal bloom (HAB) producing dinoflagelletes have resulted in “red tides” that generally occur annually (summer, early fall) in the lower York River. With respect to low dissolved oxygen levels, hypoxia derived from oxidation of organic matter and sediment oxygen demand has also been observed repeatedly in the bottom waters of the lower, high salinity reaches when water temperatures exceed 20 °C. While studies have indicated limited toxic chemical contamination, mercury and PCB fish consumption advisories and restrictions have been issued within the York River estuary. Mercury impacted regions of the Mattaponi and Pamunkey Rivers receive significant wetland drainage that can enhance the potential for bioaccumulation of mercury in fish. Sediments in the York River proper exhibit PCB levels ranging from 1-5 ppb with more elevated levels (25 ppb) being observed in some contributing tidal creeks. In contrast to mercury where atmospheric deposition is a primary pathway, PCBs are generally released into the environment from runoff processes occurring at hazardous waste sites. With varying sources of fecal pollution, 20 percent (31.1 km2) of the York River’s as-sessed shellfish waters has been designated as impaired. Condemned waters are restricted to major industrial and defense facility sites, and contributing smaller tidal creek systems.
GENERAL PHYSICAL CHARACTERIZATION
The York River is the Chesapeake Bay’s fifth largest tribu-tary in terms of flow and watershed area (≅ 6900 km2). The York River basin is located within Virginia’s Coastal Plain and Piedmont physiographic provinces and includes all of the land draining into the Mattaponi, Pamunkey and York Rivers. Land use is predominantly rural in nature with forest cover account-ing for 61% of the basin’s cover, agricultural lands accounting for 21%, developed lands 2%, wetlands 7%, barren lands 1% and water accounting for the remaining 8% (Chesapeake Bay Program watershed profiles: http://www.chesapeakebay.net). Percentage of impervious surfaces, a component of developed lands, is on the order of 1%. Average annual precipitation rates within the watershed varies from 111 cm in the upper reaches of tidal waters (Walkerton; 1932-2007) to 121 cm in lower reaches (Williamsburg; 1948-2007).
The York River estuary receives freshwater from its two major tributaries whose confluence is at West Point located
approximately 52 km from the rivers mouth near the Good-win Islands component of the Reserve. Long-term daily mean streamflow is 16.3 m3 sec-1 for the Mattaponi (USGS Station: 01674500; 1942-2007) and 30.7 m3 sec-1 for the Pamunkey (USGS Station: 01673000; 1972-2007) Rivers (Figure 1). The York River estuary also receives freshwater input from a large number of smaller ungaged subbasins and direct groundwa-ter discharge to tidal waters; approximately 35% of the York River basin is below USGS gaging stations (Seitz, 1971). The base flow index, a measure of groundwater flow within non-tidal portions of the rivers and expressed as the ratio of base flow to total streamflow, is estimated at 0.46 for the Pamunkey and 0.58 for the Mattaponi River (Bachman et al.,, 1998).
The York River system is classified as a microtidal, partially mixed estuary. The mean tidal range is 0.7 m at its mouth and increases to over 1 m in the upper tidal freshwater regions of the Mattaponi and Pamunkey Rivers (SiSSon et al.,, 1997). The tidal prism has been estimated at 110 million m3 at the mouth and 35 million m3 at West Point (Sturm and neilSon, 1977).

24
Because the Mattaponi and Pamunkey Rivers do not exhibit a prominent fall-line as delineated by other Bay tributaries, the uppermost extent of tidal propagation is somewhat variable and on the order of 120 km upriver on the Mattaponi and as far as 150 km upriver on the Pamunkey (lin and Kuo, 2001). The phase of tide lags with distance up the estuary. The tide is about 2.2 hours behind the mouth of the estuary (Goodwin Is-lands) at the confluence of the Mattaponi and Pamunkey Riv-ers (West Point; 52 km upriver), and 3.9 hours behind at the Sweet Hall Marsh (75 km upriver). Residence time, defined as the time taken for an element to be discharged from the estu-ary, in the York River estuary is dependent on freshwater dis-charges rates. Shen and Haas (2004) have estimated residence times are the order of 45 and 90 days for material discharged at the headwaters of the Mattaponi and Pamunkey Rivers dur-ing high (upper 90th percentile) and mean flows, respectively.
Salinity distribution along the York River estuary ranges from tidal freshwater to polyhaline regimes (Figure 2). Sea-sonal salinity (2003-2006) patterns specific to the Reserve components are presented in Figure 3 and generally indi-
cate tidal freshwater to oligohaline conditions at Sweet Hall Marsh (SH), mesohaline conditions at Taskinas Creek (TC) and Catlett Island (CI), and a meso to polyhaline salinity re-gimes at Goodwin (GI) Islands. Interannual variations in hy-drologic budgets and large-scale episodic events (e.g., tropi-cal cyclones) can have a significant impact on the short and long-term salinity patterns within the estuary. This can be exemplified by the salinity record at Sweet Hall Mash during historic dry (CY 2002, annual precipitation: 78 cm) and wet (CY2003, annual precipitation: 191 cm) years; tropical storm Isabel made landfall on September 18, 2003 (Figure 4). An-nual streamflow values for the Mattaponi and Pamunkey Riv-ers were 0.20 and 0.36 × 10⁶ m3 day-1 in CY 2002, respectively, and 1.92 and 4.09 × 10⁶ m3 day-1 in CY 2003.
Vertical salinity stratification and homogeneity has been shown to regularly oscillate with the spring-neap tidal cycle in the lower and upper York River estuary (haaS, 1977; SharpleS,
Figure 2. Mean salinity map of York River estuary based on monthly (April-October) Dataflow cruises of 2003, 2004 and 2005 and general locations of primary and secondary ETM.
Figure 4. Daily mean salinity values at Sweet Hall Marsh for CY 2002 and 2003. (Figure from Reay and Moore 2005).
Figure 3. Seasonal salinity patterns for Reserve components and Clay Bank. GI: Goodwin Islands, CI: Catlett Islands, TC: Taskinas Creek, SH: Sweet Hall Marsh and CB: Clay Bank. Data sources: NOAA/NERRS 15 minute continuous data for SH, TC, CB and GI; VIMS shoal data (1-3 samplings per month).
Figure 1. Longterm daily mean streamflow for the Mattaponi and Pa-munkey Rivers.

25
et al., 1994). Stability of the water column is controlled by processes that support stratification (e.g., freshwater induced density gradient, decreased turbulent mixing during neap tides and local surface heating) and processes that induce vertical mixing (e.g., elevated tidal action during spring tides and wind driven shear stresses). With respect to water quality, periodic and episodic vertical homogeneity and stratification of the water column is significant. Mixing of the water column can result in the reintroduction of nutrients to surface waters and subsequent enhanced phytoplankton growth (WeBB and D’elia, 1980; haaS et al., 1981) and replenishment of oxygen to deeper waters (Kuo et al., 1991). Conversely, stratification can lead to low dissolved oxygen conditions in bottom waters and influence the development of secondary turbidity maxi-mums (lin and Kuo, 2001).
The York River estuary can exhibit both a primary (ETM) and a more localized secondary estuarine turbidity maximum (STM) where suspended sediments occur at greater concen-trations than observed either upriver or seaward (Figure 2; lin and Kuo, 2001). The ETM is situated near the confluence of the Mattaponi and Pamunkey Rivers at the town of West Point, VA and the STM occurs within the region about 20 to 40 km from the mouth of the York River estuary. Resuspension of the bottom mud layer in the mid-region of the York River is believed to be a primary sediment contributor to the STM. The turbidity maximums may shift seasonally, migrating up-river during periods of low freshwater discharge.
BAY-WIDE WATER QUALITY ISSUES AND CRITERIA
Degradation of marine and estuarine environments is of global concern and the Chesapeake Bay along with its York River subestuary is no exception. Water quality may be af-fected by anthropogenic factors such as point and nonpoint source inputs as well as natural events such as excessively wet years and large-scale storms. A growing population along with associated land use changes are primary factors causing water quality and habitat degradation in the Bay’s watershed, its tributaries and the Bay proper. Key water quality manage-ment issues and threats to the Bay system include:
• excesssedimentswhichresultindegradedhabitat,re-duce water clarity, and serve to transport toxic materi-als, pathogens and nutrients to water resources;
• excessnutrients,bothnitrogenandphosphorus, thatstimulate algal blooms and lead to oxygen deprived waters and reduced water clarity;
• introductionof toxic chemicals (e.g.,mercury, PCBs,pesticides) and associated health impacts on wildlife and humans; and
• microbialagents.
In place of its traditional sediment and nutrient percent re-duction strategy to assess water quality and contaminant input trends, the multi-state and agency Chesapeake Bay Program (CBP) has recently adopted a new habitat or designated use ap-proach to more clearly define current water quality and devel-op strategies to achieve desired results (USEPA, 2003). Specific water quality criteria (i.e., water clarity, dissolved oxygen and chlorophyll a) are applied to five Bay habitat zones (i.e., spawn-ing and nursery grounds, shallow water, open water, deep water
and deep channel) (Figure 5) at specified times of the year de-pending on the needs of key Bay resources. Dissolved oxygen criteria are presented in Table 1 and water clarity criteria are presented in Moore of this Special Issue. With the exception of numeric criteria for specific regions of the James River, chloro-phyll a criteria is based on narrative criteria that suggests that concentrations shall not exceed levels that result in ecologically undesirable consequences (e.g., reduced water clarity, low dis-solved oxygen, food supply imbalances, or proliferation of un-desirable species potentially harmful to aquatic or human life) or otherwise render tidal waters unsuitable for designated uses.
SEDIMENT
Recent sediment water quality status reports indicate con-tinued degraded conditions in the Chesapeake Bay and York River subestuary. Based on 2005 estimates, agriculture lands contributed 62% of the sediment load to the Bay followed
Figure 5. Oblique view of the Chesapeake Bay and tidal tributaries identifying principal habitat zones. Image from the Chesapeake Bay Program.
Table 1. Summary of CBP dissolved oxygen criteria by habitat zone (USEPA 2007).

26
by forested (20%) and urban/suburban (18%) lands (CBP 4.3 Watershed model results). Long-term (1985-2006) sediment concentration trends at primary CBP River Input Monitoring Program (RIM) stations (located at gaging stations above the point of tidal influence), which have been adjusted to reflect changes in river flow, are presented in Figure 6. Data from these monitoring stations generally show decreasing or no significant trends in flow adjusted sediment concentrations. Exception occurred in the Pamunkey River where a significant increasing trend (reported percent change: 85%; 1989-2006) was observed (langlanD et al., 2007).
Based on Chesapeake Bay water quality and watershed model simulations, York River basin total sediment input is on the order of 1.1-1.5 × 10⁸ kg (does not include loading from shoreline erosion). Temporal changes in sediment and nutrient loads from the York River’s primary tributaries are primarily a function of streamflow variability and changes in land use and/or management strategies over the longer term. Between 1985 and 2006, mean and ranges of annual sediment loads at CBP RIM stations on the Pamunkey River were 40.0 × 10⁶ kg yr-1 and 1.6-104.0 × 10⁶ kg yr-1, respectively (Langland et al., 2007; determined from graphics). During this same period, mean and range of sediment loads were 5.2 × 10⁶ kg yr-1and 0.4-10.5 kg yr-1 for the Mattaponi River. Low-
est sediment loads occurred during the regions historic dry year (2002) and peak sediment loads were associated with the historic wet year (2003) on the Pamunkey River.
Nonpoint agriculture sources of sediment dominate (52%) load inputs to the York River system, followed by forested (26%) and mixed open (14%) lands; urban runoff contribu-tions are estimated at 8% (cWVa, 2005). Trend analysis of sediment loadings to the York River show a 21% decrease in nonpoint sources between 1985-2004 (Dauer et al., 2005). Data specific to the York River watershed suggest annual sedi-ment losses on the order of 9600 kg ha-1 for cultivated crop-land, 2700 kg ha-1 for uncultivated cropland and 2600 kg ha-1 for pasture lands (NRCS, 1992). To put undisturbed forested land use in perspective, erosion rates for U.S. East Coast are on the order of 112-224 kg ha-1 (patricK, 1976).
Sediment sources are not limited to watershed sources (e.g., upland surface and stream corridors erosion) but also includes tidal erosion from direct tide and wave action, ocean and aeolian input, and that of internal biogenic origin. Tidal erosion, which includes both fastland (land above tidal wa-ter often called shoreline) and nearshore erosion (sediment within shallow waters adjacent to shorelines), is a significant source of suspended sediment in many portions of the Bay and its tributaries (USEPA, 2005). With respect to the York River system, characterized by relatively low water discharge rates and basin slopes, tidal erosion is the dominant sediment source. Based on summarized model data, annual estimates of silt/clay sediment loads are on the order of 0.1 million MT from the York River watershed above the fall-line, 0.1 million MT from the watershed below the fall-line and 0.55 million MT from tidal erosion (USEPA, 2005, modified from lang-lanD and cronin, 2003); rivers generally do not have suffi-cient energy to transport gravel and sand through their tidal reaches. Reported long-term annual shoreline erosion rates for the York River are 15 and 30 cm for the north and south shore, respectively (Bryne and anDerSon, 1976).
Spatial variations in turbidity, a qualitative measurement of the effect that suspended solids has on the transmission of light through water, are evident in the shallow waters of the York River estuary (see FrieDrichS, Figure 7 of this Issue). Mean monthly turbidity values from shallow water stations in vari-ous salinity regimes are presented in Figure 7. Lower monthly mean values are associated with the higher salinity regions (i.e., polyhaline, range: 5-10 NTUs; and lower mesohaline region of the York River, range: 4-20 NTUs) and the tidal freshwater regions (range: 7-27 NTUs) of the estuary. Elevated monthly mean values are associated with the upper mesohaline (range: 11-76 NTUs) and oligohaline (range: 23-87 NTUs) regions of the estuary that contain both the ETM and STM.
Figure 8 depicts summarized ten-year (1997-2006) surface and bottom water total suspended solids (TSS) concentrations of selected Pamunkey, Mattaponi and York River main-stem stations. As with shallow water turbidity, reduced mean sur-face TSS concentrations were associated with the high salinity regions the River’s mouth (<10 mg L-1) and lower mesohaline (17 mg L-1), and the tidal freshwater reaches of the Pamunkey (19 mg L-1) and Mattaponi Rivers (11 mg L-1). The transi-tional (36 mg L-1) and upper mesohaline (27 mg L-1) regions which include the general locations of the ETM and STM, re-spectively, exhibit elevated surface water TSS concentrations Particularly within the transitional and mesohaline regions of the river, bottom waters associated with the ETM and STM ex-
Figure 6. Long-term (1985-2006) selected RIM station flow adjusted sediment concentration trends. Image from the Chesapeake Bay Pro-gram.

27
hibited elevated mean TSS concentrations on the order of 80-105 mg L-1. Poor water clarity is a persistent and widespread problem in the York River system (Dauer et al., 2005) and a principal factor regulating the growth and distribution of sub-merged aquatic vegetation (SAV). Light attenuation is princi-pally controlled by interactions between plankton and suspend-ed sediments. Based on turbidity (~10 NTU) and TSS (< 15 mg L-1; BatiuK et al., 1992) SAV habitat requirement criteria, much of the York River system (e.g., transitional/oligohaline and middle mesohaline York) fail to meet SAV habitat require-ments. High salinity regions in the lower York meet criteria
and much of the tidal freshwater reaches are marginal (Dauer et al., 2005). For greater detail on SAV distribution, water quality habitat criteria and restoration see Chapter 6 of the document.
NUTRIENTS
As with sediments, nutrient water quality status reports indicate continued degraded conditions in the Chesapeake Bay and York River subestuary. Agricultural land uses con-tinue to dominate nutrient load nutrient contributions to the Bay system. Based on 2005 estimates, agriculture fertilizer and manure sources contributed 34% and 45% of the nitro-gen and phosphorus load to the Bay, respectively (CBP 4.3 Watershed model results). Atmospheric sources of nitrogen such as nitrous oxide emissions from vehicles, electric utili-ties and industry and ammonia contributions from livestock and fertilized soils are significant and responsible for approxi-mately 30% of the nitrogen load to the Bay. Other significant contributors of nitrogen and phosphorus include municipal and industrial wastewater, responsible for approximately 20% of the annual loads, and fertilizer loads from urban/subur-ban lands. Long-term (1985-2006) nitrogen and phosphorus concentration trends at primary Bay tributary RIM stations, which have been adjusted to reflect changes in river flow, are presented in Figures 9 and 10, respectively (langlanD et al., 2007). Data from these monitoring stations generally show decreasing or no significant trends in flow adjusted nitrogen and phosphorus concentrations. Flow adjusted total nitrogen (TN) concentrations for the Mattaponi River did show a sig-nificant reduction with a reported change of -10%. Exceptions or increasing trends for nitrogen were observed in the Pamun-key River (reported change: 20%) and for phosphorus in the Potomac, Pamunkey (reported change: 122%), Appomattox (a tributary of the James River) and the Choptank Rivers.
As with riverine sediment loads, streamflow was a domi-nant controlling factor in explaining variability in annual nu-trient loads. Between 1985 and 2006, mean and ranges of annual TN loads at RIM stations on the Pamunkey River were 6.8 × 10⁵ kg yr-1 and 0.9-13.2 × 10⁵ kg yr-1, respectively (lang-lanD et al., 2007). During this same period, mean and range of nitrogen loads were 2.9 × 10⁵ kg yr-1and 0.4-4.9 × 10⁵ kg yr-1for the Mattaponi River. With respect to total phosphorus (TP), load mean and ranges were 7.97 × 10⁴ kg yr-1 and 1.22-18.98 × 10⁴ kg yr-1 for the Pamunkey and 2.66 × 10⁴ kg yr-1 and 0.32-4.59 × 10⁴ kg yr-1 for the Mattaponi River. Lowest nutrient loads occurred during the regions historic dry year (2002), peak nitrogen loads were associated with the historic wet year (2003) and peak phosphorus loads occurred in 2003 on the Pamunkey River. Estimates of TN and TP loads to the entire York River basin are on the order of 3.5×10⁶ kg and 3.4×10⁵ kg, respectively (Dauer, 2005; cWVa, 2005). Between 1985 and 2006, median TN concentrations were 47.1µmol L-1 (10th percentile: 34.3 1µmol L-1; 90th percentile: 71.6 1µmol L-1) at the RIM station on the Pamunkey River and 41.4 µmol L-1 (10th: 29.3; 90th: 57.1) on the Mattaponi River (Langland et al., 2007). Median TP concentrations were 2.26 µmol L-1 (10th: 1.00; 90th: 4.55) for the Pamunkey and 1.61 µmol L-1 (10th: 0.97; 90th: 2.13) for the Mattaponi Rivers.
Results of CBP watershed model simulations (1985 and 1998) indicate that agriculture (range: 38-46%); urban areas (31-32%) and forested lands (15-20%) were the dominant ni-trogen contributors in the Pamunkey and Mattaponi subba-
Figure 8. Long-term (1997-2006) TSS concentrations for surface (S) and bottom (B) waters at selected York River estuary sampling stations. Error bars: ± one SEM. Data source: Chesapeake Bay Program.
Figure 7. Mean monthly turbidity values for near continuous shallow water monitoring stations in the polyhaline (Goodwin Island), lower York mesohaline (Gloucester Point and Yorktown), upper York meso-haline (Clay Bank and Taskinas Creek), oligohaline (Sweet Hall Marsh and Muddy Point) and tidal freshwater (White House and Walkerton) reaches of the estuary. Data source: NOAA/NERRS SWMP program: 2003-2006; note: data availability for some stations was from 2003-2005 and may not have included all months.

28
sins (Sprague et al., 2000). Point sources were more variable between the Pamunkey (2-10%) and Mattaponi (0-1%) Rivers; point source loading estimates increased dramatically in the Pamunkey River basin in 1998. Septic tank loadings ranged between 4-7% and direct atmospheric nitrogen deposition ac-counted for approximately 1%. With respect to phosphorus, agriculture (range: 55-76%) and urban areas (18-22%) were the dominant phosphorus contributors in the river subbasins; for-ested land contributions varied from 5-8%. Phosphorus point source contributions varied 11 to 18% in the Pamunkey and 0-5% in the Mattaponi basin; 1998 contributions increased by approximately 5% from 1985 to 1998. Septic tank contribu-tions were insignificant and direct atmospheric phosphorus deposition accounted for approximately 1-2%. Trend analysis of TN loadings to the York River show an 18% decrease in nonpoint sources and a modest 1% increase in point sources between 1985-2004 (Dauer et al., 2005). With respect to TP loadings, Dauer et al. (2005) reported a 19% decrease in non-point and 63% decrease in point source loadings since 1985.
In addition to interannual variability, nitrogen loads and concentrations generally exhibit strong seasonal patterns. To-
tal dissolved nitrogen (TDN) and phosphorus (TDP) loads and concentrations for the Pamunkey River RIM station are pre-sented in Figure 11 for the time period 1997 to 2006. TDN loads display a strong positive correlation with streamflow, with spring peak values followed by recession through the summer and gradual increase through fall and winter. It should be noted that elevated long-term discharge rates in September are in response to periodic large-scale storms (e.g., hurricanes and tropical storms) that impact the region. In contrast, TDN concentrations (e.g., particularly nitrate) are often high during periods of low flow, suggesting significant groundwater input. Groundwater nitrogen concentrations vary by land use with coastal agricultural lands displaying elevated values. Reported mean agricultural site values for dissolved inorganic nitrogen (DIN) ranged from 200-1085 µmol L-1 as compared to forested lands where values ranged from 9-89 umol L-1 (macintyre et al., 1989; SimmonS et al., 1992; reay et al., 1992; gallagher et al., 1996). Developed lands utilizing on-site wastewater dis-posal systems (e.g., septic tanks) also pose a risk to ground wa-ter resources with drainfield DIN levels on the order of 5000 µmol L-1 (reay, 2004). TDP loads and concentrations follow
Figure 9. Long-term (1985-2006) selected RIM station flow adjusted total nitrogen concentration trends. Image from the Chesapeake Bay Program.
Figure 10. Long-term (1985-2006) selected RIM station flow adjusted total phosphorus concentration trends. Image from the Chesapeake Bay Program.

29
similar seasonal patterns and relative percent changes as ex-hibited by TDN. Nitrogen and phosphorus ratios of riverine input are important and have implications with respect to phy-toplankton distribution and productivity. Seasonal variations in TDN:TDP of riverine input show elevated ratios in winter (TDN:TDP ratio: 35) and spring (ratio: 30) and declining in summer (ratio: 20-25) and fall (ratio: 20).
Within mainstem surface waters of the York River estuary, TDN levels show a decreasing trend with increasing salinity (Figure 12). Mean TDN levels, for the time period 1997-2006, within the tidal freshwater reaches are on the order of 40 µmol L-1 (Mattaponi) and 45 µmol L-1 (Pamunkey) and de-crease to 22-24 µmol L-1 in the lower meso and polyhaline regions. While the mean dissolved organic fraction (DON) exhibits little variation between salinity regimes (mean range: 17-22 µmol L-1), DIN shows a clear decrease as one moved
from tidal freshwater to polyhaline regions of the estuary. It should be noted that both the addition of DIN and DON can stimulate algal blooms. As with TDN, mean 10 year TDP con-centrations (Figure 13) decrease with increasing salinity, from approximately 1.2 µmol L-1 at the selected tidal freshwater sta-tions to 0.6 µmol L-1 in the polyhaline region. Aside from the tidal freshwater stations where the inorganic and organic frac-tions of TDP where relatively similar, inorganic phosphorus (primarily PO4) dominated the organic fraction whose mean value was approximately 0.2 µmol L-1 throughout the transi-tional to polyhaline regions. Regarding SAV water quality cri-teria, the meso and polyhaline regions of the York River meet DIN (< 10.7 µmol L-1) and DIP criteria (< 0.65 µmol L-1).
Daeur et al. (2005) provide the most current report on ni-trogen and phosphorus status and trends for the York River estuary. Surface water total nitrogen status, utilizing 2001-2004 data and comparing to Bay-wide benchmarks, was fair for all segments (upper tidal freshwater to lower York River) while bottom waters were fair to good in the Mattaponi and Pamunkey Rivers and poor in the middle and lower York River segments. Surface water total phosphorus status was good in the upper tributaries, fair in the lower tributary seg-ments and fair to poor in the York River segments. Status of bottom total phosphorus was generally more degraded as compared to surface waters in the lower tributary reaches and the York River. Concerning long-term trends (1985-2004) or post 1994 trends, Daeur et al. (2005) reported that degrading trends in total nitrogen were detected in all surface and most bottom waters (lower Mattaponi showed no significant trend) segments within the York River estuary. As with surface wa-ter total nitrogen trends, total phosphorus showed degrading trends at all York River estuary segments. With respect to bot-tom waters, degrading trends were observed at all segments except for the lower Pamunkey River which did not exhibit a significant trend. Degrading trends in total nitrogen and phosphorus (1995-2002) were also reported for the Pamunkey River watershed input station (cWVa, 2005).
Figure 11. Ten year (1997-2006) monthly mean total dissolved ni-trogen and phosphorus concentrations and loads for the Pamunkey River RIM station.
Figure 12. Mean DIN and DON concentrations by York River estuary salinity regimes. Data source: CBP; surface water concentrations from 1997-2006; CBP station identifications are presented in parenthesis.
Figure 13. Mean PO4 and DOP concentrations by York River estuary salinity regimes. Data source: CBP; surface water concentrations from 1997-2006; CBP station identifications are presented in parenthesis.
30
PRIMARY PRODUCTIVITY AND HARMFUL ALGAL BLOOMS
Diverse ecological and physiographic features of the Ches-apeake system, along with variations in chronic and episodic material loadings can result in spatial and temporal variations in phytoplankton biomass, productivity and composition. De-spite the complex nature of the Bay system, annual patterns of phytoplankton biomass and productivity are generally recognized. Within the Bay proper, high phytoplankton bio-mass dominated by diatoms is typically observed in the spring (April-May) in association with high winter-spring riverine nutrient inputs and results in elevated water column produc-tivity (gliBert et al., 1995; malone et al., 1996; marShall et al., 2006). Declines in spring phytoplankton biomass are a result of increased nutrient demand coincident with reduced riverine nutrient input (conley and malone, 1992; malone et al., 1996). As the spring phytoplankton bloom settles and accumulates, nutrients are recycled through benthic-pelagic processes to fuel a summer productivity maximum (Kemp and Boynton, 1992 and 1994). Summer composition of phyto-plankton is more diverse and includes greater abundance and biomass of chlorophytes and cyanobacteria in the lower salinity regions and dinoflagellates in higher salinity waters (mallone et al., 1996; marShall et al., 2006). Phytoplankton biomass and productivity generally decline through the late fall and early winter in association with reduced water tem-peratures, available nutrients and light.
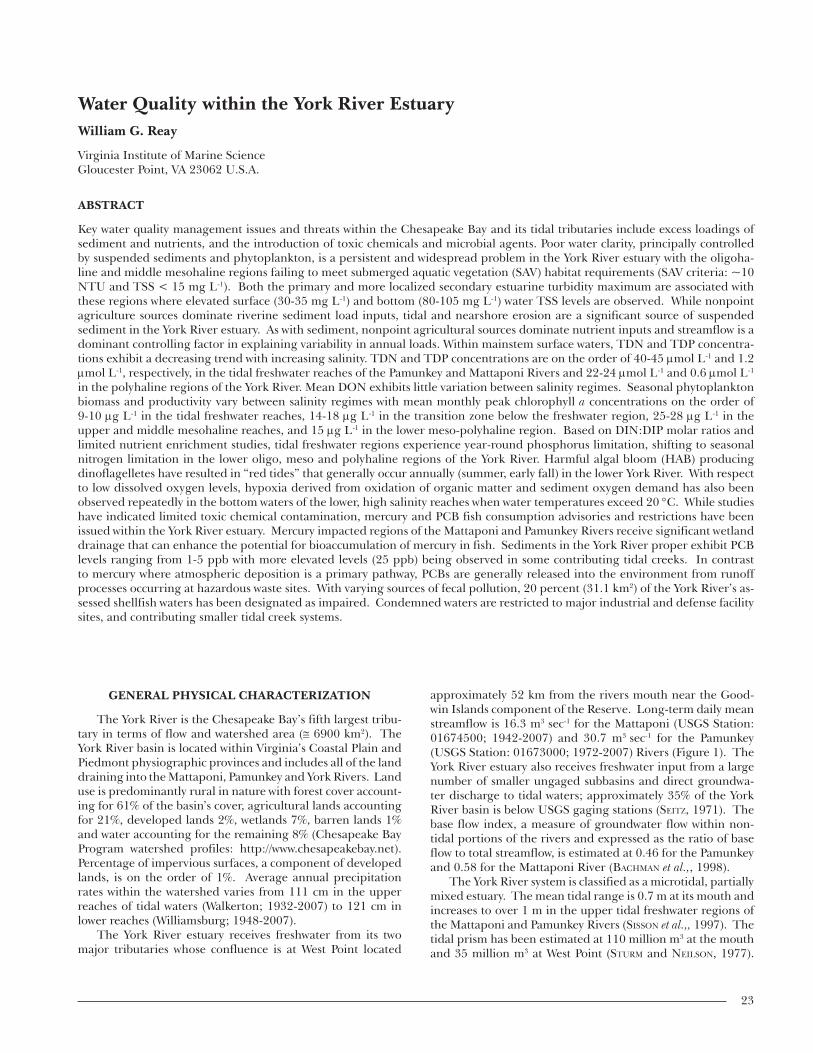
Analyzing multi-year data, Sin et al. (1999) reported re-peating patterns of seasonal phytoplankton biomass and pro-ductivity that varied between salinity regimes within the York River estuary. In tidal freshwater regions, maximum chloro-phyll a concentrations (peak monthly mean: 9 µg L-1) gener-ally occurred in the summer and coincided with peak monthly primary productivity on the order of 27 µg C L-1h-1. In the transition zone below the freshwater region, which includes the region immediately downriver of the town West Point and the ETM, both a short winter-spring (peak monthly mean: 14 µg L-1) and prolonged summer (peak monthly mean: ~ 18 µg L-1) peak in chlorophyll a concentrations were reported. Peak mean monthly primary productivity coincided with periods of elevated chlorophyll a concentrations and was on the order of 35 µg and 40 C L-1 h-1, respectively. The upper and middle reaches of the mesohaline region exhibited elevated late win-ter-spring chlorophyll a concentrations (peak monthly mean: ~ 25-28 µg L-1) followed by a smaller peak later in the sum-mer (peak monthly mean: ~ 12-14 µg L-1). Sin et al. (1999) reported a relatively small late winter-spring chlorophyll a concentration peak (peak monthly mean: ~ 15 µg L-1) with no apparent elevated summer values (monthly mean: < 10 µg L-1) in the lower meso-polyhaline region. Primary production within this region showed a spring peak (peak monthly mean: 32 µg C L-1 h-1) with relatively high production throughout the summer/fall (mean monthly range: ~15-22 µg C L-1 h-1) and in specific winter months. Within the polyhaline region lo-cated at the mouth of the York River estuary, seasonal patterns in chlorophyll a concentration and productivity were subtle with a minor peak in chlorophyll a concentrations of 8-11 µg L-1 observed in the late winter-spring and summer with cor-responding primary productivity on the order of 22-31µg C L-1 h-1 (Sin et al., 2006). Mean monthly chlorophyll a concen-trations for CBNERRVA Reserve components are presented
in Figure 14 and follow the temporal patterns as reported by others (Sin et al., 1999, 2006).
Utilizing high resolution temporal dissolved oxygen data from 1995-2000, Sanger et al. (2002) estimated gross primary productivity, total respiration and net ecosystem metabolism for the Goodwin Islands and Taskinas Creek Reserve compo-nents. Gross primary productivity estimates were 5.15 and 8.88 g O2 m
-2 d-1, total respiration was 4.68 and 8.52 g O2 m-2
d-1 and net ecosystem metabolism was 0.48 and -2.07 g O2 m-2
d-1, for Goodwin Islands and Taskinas Creek, respectively. Es-timates of net community metabolism indicate Taskinas Creek is a heterotrophic site as compared to Goodwin Island which is autotrophic, one of the few in the National Estuarine Re-search Reserve System. It should be noted that the location of the Goodwin Island monitoring station is located within SAV beds and Taskinas Creek drains a nontidal forested wetland and tidal marsh system.
By affecting residence time, nutrient input, light regime and tidal mixing, river discharge is a controlling factor that regulates temporal and spatial phytoplankton dynamics with-in the York River estuary (Sin et al., 1999). A negative cor-relation between chlorophyll a levels and river discharge in the tidal freshwater region suggests that winter or high flow periods flush this region at a sufficient rate to prevent accu-mulation of phytoplankton biomass. In the more downriver mesohaline reaches, a positive correlation suggests that high riverine input stimulates growth and may determine location, magnitude and timing of winter-spring bloom. Investigating phytoplankton assemblages in the York River estuary, Mar-shall and Alden (1990) report bidirectional transport of phy-toplankton with short-lived to moderately tolerant freshwater species moving downstream and estuarine Bay species mov-ing upstream throughout the year in sub-pycnocline waters.
Based on long-term data analyses, field and model-ing studies (Sin and Wetzel, 2002a, 2002b; Sin et al., 2006), phytoplankton dynamics in the lower mesohaline region of
Figure 14. Seasonal chlorophyll a concentrations for Reserve compo-nents. GI: Goodwin Islands, CI: Catlett Islands, TC: Taskinas Creek and SH: Sweet Hall Marsh. Data sources: NOAA/NERRS SWMP monthly sampling program: 2002-2006.
31
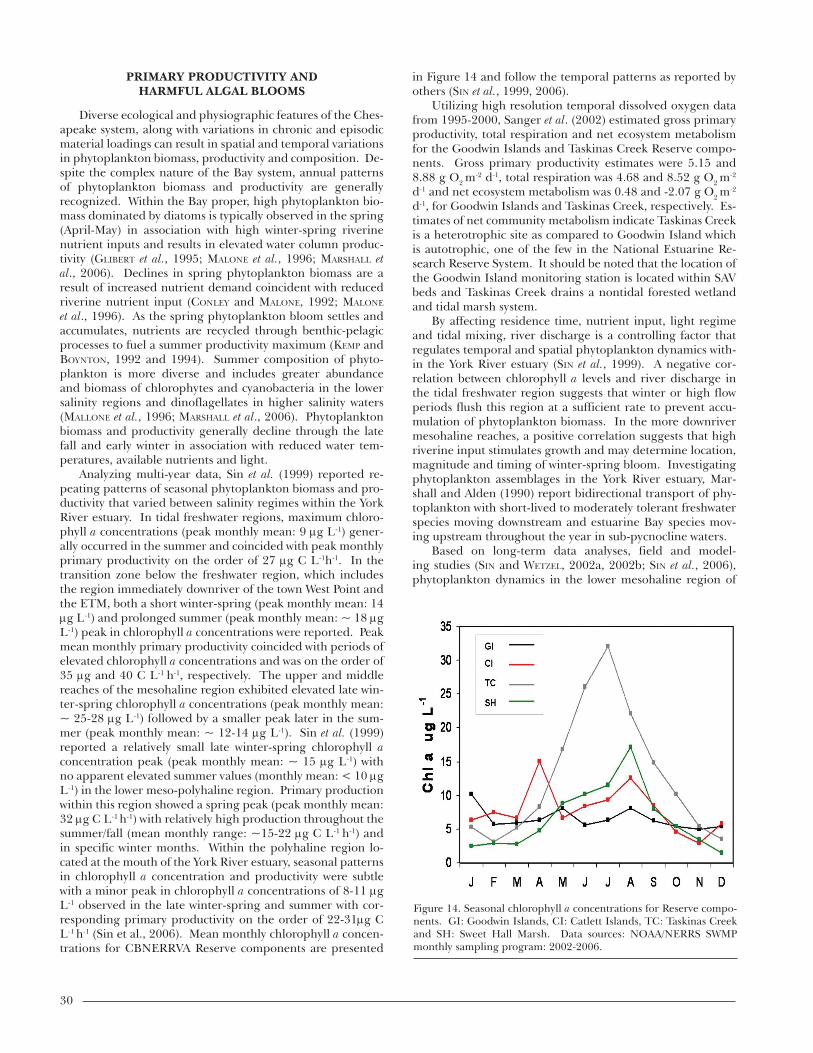
the York River estuary are regulated by abiotic mechanisms (bottom-up control) such as nutrient supply rather than biotic mechanisms (top-down control) such as zooplankton grazing. The availability of nutrients and light are governing factors affecting phytoplankton growth rates and production. Based on DIN:DIP molar ratios (16:1), Sin (1999) suggested poten-tial year-round phosphorus limitation for all seasons in tidal freshwater regions, shifting to potential nitrogen limitation during the summer-fall period in the oligohaline transitional zone, and potential nitrogen limitation within the mid and lower mesohaline regions throughout the year except during periods of peak river discharge. Nutrient enrichment stud-ies by Webb (1987) also indicated seasonal nutrient limitation patterns in the lower York River with phosphorus limitation in the late fall and spring and nitrogen limitation during late spring and summer. DIN:PO4 ratios for Reserve components are presented in Figure 15. While all Reserve components exhibited DIN:PO4 ratios indicative of both potential nitro-gen and phosphorus limitation, values associated with Sweet Hall Marsh (located in the lower tidal freshwater-oligohaline region of the Pamunkey River) were elevated suggesting a greater degree for potential phosphorus limitation than other Reserve components.
A Phytoplankton Index of Biotic Integrity (PIBI) has been developed for Chesapeake Bay to assess phytoplankton health with respect to “reference communities” found in desirable water quality conditions (Buchanan et al., 2005). Utilizing data from 1985-2002, PIBI scores of CBP monitoring stations for the tidal freshwaters of the Pamunkey River indicate poor to fair status in the spring and fair to good status in the sum-mer while the upper mesohaline reach of the York River indi-cates a poor-fair status in the spring and a poor status in the summer (lacouture et al., 2006). Waters in the open Mobjack Bay complex exhibit a poor-fair status for both spring and summer. Phytoplankton features in waters with a fair-poor
status include frequent algal blooms and somewhat frequent HABs, high variability in biomass and species composition, and exceedance of water quality criteria (Buchanan, 2006).
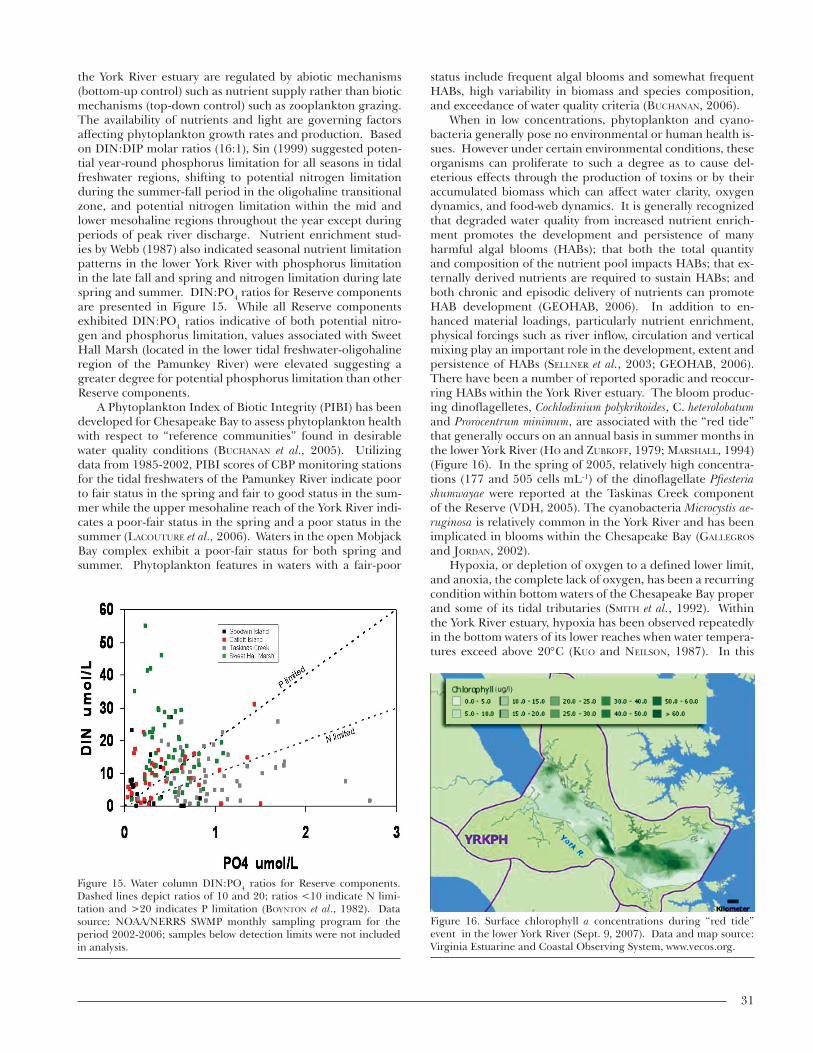
When in low concentrations, phytoplankton and cyano-bacteria generally pose no environmental or human health is-sues. However under certain environmental conditions, these organisms can proliferate to such a degree as to cause del-eterious effects through the production of toxins or by their accumulated biomass which can affect water clarity, oxygen dynamics, and food-web dynamics. It is generally recognized that degraded water quality from increased nutrient enrich-ment promotes the development and persistence of many harmful algal blooms (HABs); that both the total quantity and composition of the nutrient pool impacts HABs; that ex-ternally derived nutrients are required to sustain HABs; and both chronic and episodic delivery of nutrients can promote HAB development (GEOHAB, 2006). In addition to en-hanced material loadings, particularly nutrient enrichment, physical forcings such as river inflow, circulation and vertical mixing play an important role in the development, extent and persistence of HABs (Sellner et al., 2003; GEOHAB, 2006). There have been a number of reported sporadic and reoccur-ring HABs within the York River estuary. The bloom produc-ing dinoflagelletes, Cochlodinium polykrikoides, C. heterolobatum and Prorocentrum minimum, are associated with the “red tide” that generally occurs on an annual basis in summer months in the lower York River (ho and zuBKoFF, 1979; marShall, 1994) (Figure 16). In the spring of 2005, relatively high concentra-tions (177 and 505 cells mL-1) of the dinoflagellate Pfiesteria shumwayae were reported at the Taskinas Creek component of the Reserve (VDH, 2005). The cyanobacteria Microcystis ae-ruginosa is relatively common in the York River and has been implicated in blooms within the Chesapeake Bay (gallegroS and JorDan, 2002).
Hypoxia, or depletion of oxygen to a defined lower limit, and anoxia, the complete lack of oxygen, has been a recurring condition within bottom waters of the Chesapeake Bay proper and some of its tidal tributaries (Smith et al., 1992). Within the York River estuary, hypoxia has been observed repeatedly in the bottom waters of its lower reaches when water tempera-tures exceed above 20°C (Kuo and neilSon, 1987). In this
Figure 15. Water column DIN:PO4 ratios for Reserve components. Dashed lines depict ratios of 10 and 20; ratios <10 indicate N limi-tation and >20 indicates P limitation (Boynton et al., 1982). Data source: NOAA/NERRS SWMP monthly sampling program for the period 2002-2006; samples below detection limits were not included in analysis.
Figure 16. Surface chlorophyll a concentrations during “red tide” event in the lower York River (Sept. 9, 2007). Data and map source: Virginia Estuarine and Coastal Observing System, www.vecos.org.

32
study, hypoxia, defined as < 50% of dissolved oxygen summer saturation values, occurred in 50 % of the York River surveys over a 15 year period. Based on 1997-2006 CBP data for bot-tom waters in the lower York River (station: LE4.2), average summer dissolved oxygen levels are 4.1 mg L-1 (range: 1.1 to 7.3), compared to 8.5 mg L-1 (range: 3.7-12.5) for spring, 5.9 mg L-1 (range: 3.4-9.1) for fall and 10.1 mg L-1 (range: 7.4-13.4) for winter months. Oxidation of organic matter and sediment oxygen demand are important dissolved oxygen sinks while vertical diffusion transport and longitudinal ad-vective transport due gravitational circulation are thought to be primary controlling factors replenishing the supply of oxy-gen to deep waters (Kuo and neilSon, 1987). With respect to status and trends of bottom waters within the York River estu-ary, dissolved oxygen level status (2002-2004) was fair to good and there were no significant degrading or improving trends (1985-2004) in all segments of the estuary (Dauer, 2005).
In addition to depletion of oxygen in channel bottom waters, diel variations in dissolved oxygen concentration in shallow waters can be significant and result in low dissolved oxygen conditions. This phenomenon is often observed in temperate unstratified shallow habitats where nighttime res-piration temporarily deplete water oxygen levels which are subsequently replenished by photosynthesis during day-time conditions. Investigating dissolved oxygen dynamics at the national reserve-wide scale, Wenner et al. (2001) did report hypoxic water conditions, however at a very low percent level, for the Taskinas Creek component of the Reserve.
TOXIC CHEMICALS
Chemical contaminants entering the Bay and its tidal tributaries come from a variety of natural processes, such as weathering of rocks, and human derived point and nonpoint sources. Toxicity of a chemical depends on a multitude of factors, including the chemical and physical properties of the contaminant (e.g. concentration, form of speciation, persis-tence), the receiving water body and the living resources of interest. Priority toxic contaminants identified by the CBP include polychlorinated biphenyls (PCBs), polycyclic aromatic hydrocarbons (PAHs), organochlorine and organophosphate pesticides, and “other” priority pollutants such as metals (USEPA, 2006). These toxic compounds are known or sus-pected carcinogens (PAHs, PCBs, organochlorine pesticides), cause neurological damage (PCBs, mercury, organochlorine and organophosphate pesticides) and other adverse health conditions. While there appears to be areas of limited toxic chemical contamination and associated adverse effects, broad-scale degradation of the York River estuary due to toxicologi-cal stressors is not apparent.
There have been a limited number of studies that have fo-cused on ambient water column and sediment toxic chemical testing in the York River estuary. Hall et al. (1998) monitored water toxicity in the mouth of the Pamunkey River, adjacent to the town of West Point and location of potential industrial contaminant sources, in 1995 and reported concentrations of organochlorine pesticides that were below levels that cause adverse effects and elevated lead concentrations that exceed-ed USEPA chronic water quality criteria. Aqueous and sedi-ment toxicity was not observed during this study. McGee et al. (2001) monitored sediment toxicity in both the Mattaponi
and Pamunkey Rivers adjacent to and downstream of the town of West Point and reported no contaminant concentrations of concerns and found little to no sediment toxicity. Wright et al. (2002) evaluated a number of sites on the Mattaponi and Pamunkey Rivers in 2000-2001 with respect to aqueous and sediment chemical analysis and sediment toxicity. With the exception of the metal manganese (Mn), most sediment contaminant (PAHs, selected chlorinated pesticides, selected metals) concentrations were low or below detection levels. Se-lected pesticides, in particular atrazine and metalochlor, were detected in water samples during this study.
As part of VaDEQ’s Fish Tissue and Sediment Monitoring Program, sediment metal and PAH concentrations are mea-sured within the Mattaponi and Pamunkey River systems. As summarized by Roberts et al. (2004) for the period 1997-2000, the sediment quality guideline Effects Range - Low (ERL; ad-verse effects on organisms are rarely observed when concentra-tions fall below the ERL value.) was exceeded at selected sta-tions for the metals Chromium, Nickel, Mercury and Zinc; no exceedances for metals were observed for stations located in the Mattaponi River. With total low and high molecular weight PAHs concentrations ranging from 6.2-218.6 and 59.6-1210.5 ng g-1 dry weight, respectively, no exceedances of PAH sediment quality guidelines were observed in either river. The most ex-tensive study to characterize the chemistry, toxicology and bio-logical community of the sediments within the tidal reaches of the Mattaponi and Pamunkey Rivers was conducted by Roberts et al. (2004). Reported sediment low molecular PAHs concen-trations did not exceed detectable limits, high molecular PAHs concentrations were low and did not exceed ERL guidelines, and exceedances of ERL guidelines for the 16 tested metals were relatively infrequent and included Arsenic (range: detec-tion limit to 10.2 µg g-1), Chromium (range: 6-47.7µg g-1), Zinc (range: 22.2-163 µg g-1), and Manganese (range: 136-3,380 µg g-1). Selected organophosphate and organochloride pesticides were detected in both aqueous and sediment samples at rela-tively low levels and selected herbicides were below detection for all samples. Sediment toxicity tests of three invertebrate species showed no significant impacts.
A recent report by Hartwell and Hameedi (2007) sum-marizes the results of NOAA’s Chesapeake Bay-wide sediment chemistry, toxicity and benthic community studies. The study reported mean Effects Range - Median quotient (ERMq; con-taminant concentrations equal to or exceeding ERM levels would frequently result in adverse effects on organisms) levels of <0.1 and 0.1 to 0.2 for York River stations; the calculation included low and high molecular weight PAHs, total PCBs, total DDT, and individual metals except for Nickel. For com-parison purposes, mean ERMq levels within the Chesapeake Bay and its tributaries varied from 0.0 to 0.72 with contami-nated sites such as Baltimore Harbor and the Elizabeth River exhibiting ERMq levels on the order of 0.5. In the southeast US, a mean ERMq value of 0.1 is generally considered the threshold where degradation of benthic communities can be-gin to be observed (hylanD et al., 1999). Results of York River toxicity tests reported in the NOAA study were mixed, show-ing no significant difference in amphipod survival responses in whole sediment bioassays at all stations, both significant and no significant differences in sea urchin fertilization bio-assay responses in sediment pore water, and low (≤10 B[a]P equivalents) human reporter gene system cytochrome P450 bioassays responses at all stations.

33
Investigating PAH distribution and association with organ-ic matter in surface waters of the York River estuary, Countway et al. (2003) classified PAHs into three groups (e.g., volatile, soot-associated and perylene) and suggested processes con-trolling their delivery to the estuary. The more volatile PAHs enter through gas exchange across the air-sea interface with subsequent partitioning by phytoplanton; soot-associated PAHs were primarily (~75%) coal derived and enter through watershed runoff of soot particulate matter; and the source of perylene is terrestrial and/or a product of diagenetic processes in soil and/or marshes.
Specific contaminants can bioaccumulate in fish tissue at levels that warrant consumption advisory in order to pro-tect human health. Contaminants listed in fish consumption advisories in Virginia coastal waters include polychlorinated biphenyls (PCBs), mercury and Kepone (VaDeQ, 2006). Spe-cific to the York River basin, mercury and PCB fish consump-tion advisories and restrictions were issued by the Virginia De-partment of Health in 2004 and are currently in effect (VaDh; Figure 17). As with other principal tributaries (i.e. James and Rappahannock Rivers) within the southern Chesapeake Bay region, a PCB fish consumption advisory exists for the en-tire York River estuary below the confluence of the Mattaponi and Pamunkey Rivers. The upper tidal regions of the Matta-poni and Pamunkey Rivers, which receive significant wetland drainage, exhibit environmental conditions (e.g., low pH, low dissolved oxygen levels, and high organic matter) that have been recognized as being associated with increased potential for bioaccumulation of mercury in fish (see reviews by ull-rich et al., 2001 and raVichanDran, 2004). Additional mer-cury fish consumption advisories, including the Dragon Run Swamp/Upper Piankatank River, and the Dismal Swamp canal and Blackwater and Nottoway Rivers within the Chowan River basin, occur within coastal water bodies associated with large swamp and wetland systems with little or no industrial or mu-nicipal dischargers.
PCBs are a class of organic chemical compounds that were used extensively in industrial manufacturing (e.g., produc-tion of dielectric fluids for transformers and capacitors, syn-thetic resins and epoxy paints) and exhibit a high degree of
resistance to degradation processes. Given that production of PCBs ceased in 1977, PCBs are currently released into the environment from hazardous waste sites, illegal/improper discarding of PCB-containing wastes, atmospheric deposi-tion or from failing PCB-containing equipment. Large-scale soil PCB removal actions have occurred at federal (Yorktown Naval Weapons Station and Camp Peary immediately adja-cent to the York River in James City County) and superfund (H&H burn pit site in Hanover County) facilities within the York River basin (VaDeQ, 2005). Being only slightly soluble in water, PCBs accumulate in soil where they can enter water-bodies through runoff processes and persist in sediments for many years and enter the foodchain. Reported PCB sediment concentration ranges within the Pamunkey River are 0.0-2.3 ppb (dry weight basis), 0.0- 0.76 ppb in the Mattaponi River and 1.2-5.3 ppb in the York River proper. Creeks draining into the York River exhibited elevated sediment levels of 25.6 ppb for Felgates Creek and 63.5 ppb for King Creek (PCB ERL = 22.7 ppb; VaDEQ 1995-2002 PCB sediment database).
In contrast to PCBs, mercury is released to the environ-ment by both natural processes and human induced activities. Model simulations suggest that atmosphere deposition is a pri-mary source of mercury to the Chesapeake Bay system (maSon et al., 1997); dominant emission sources within the Bay region include coal fired electrical generation and waste incineration plants. Regional weekly total mercury wetfall concentrations, for the time period (12/2004-4/2007) ranged from 0.9 to 40.4 ng L-1 and deposition rates varied from 3.9 to 1697.4 ng m-2 (NADP/MDN, Station ID VA(98); estimates of weekly dryfall are on the order of 1080 ng m-2. Atmospheric mercury exists in three primary forms, gaseous elemental mercury, reactive gaseous mercury and fine particulate bound mercury. One of the key factors that can influence the bioaccumulation of mercury is its conversion to methyl-mercury (CH3Hg+) via mi-crobial mediated pathways. Once in the methyl-mercury form it is readily assimilated into higher trophic levels. Reported mercury sediment concentration ranges within the Pamunkey River are 0.03-0.57 ppm (dry weight basis), <0.01- 0.32 ppm in the Mattaponi River and 0.11-0.22 ppm in the York River proper. Creeks draining into the York River exhibited elevat-ed sediment levels of 0.15 ppm for Felgates Creek and 0.19 ppm for King Creek (PCB ERL = 0.15 ppm; VaDEQ 1995-2002 metals sediment database).
MICROBIAL PATHOGENS
The existence of pathogens has been the most cited water quality problem associated with nonpoint sources of pollution in Virginia (VaDeQ, 2004). Due to the presence of patho-genic bacteria and viruses, fecal contamination of water used for domestic, commercial, recreational purposes is regarded as a health hazard. Examples of human health hazards in-clude the waterborne diseases of dysentery, viral and bacterial gastroenteritis, typhoid fever and hepatitis A. Sources of fe-cal indicator pathogens include nonpoint source runoff from urbanized, agricultural and natural lands, failing residential on-site septic systems and municipal wastewater treatment facilities, combined sewer and stormwater runoff systems, in-dustrial point sources such as paper mill effluent, and direct domestic and wild animal loadings. A GIS-based analysis of fecal coliform bacteria levels within Virginia’s coastal waters identified several significant trends that included elevated con-
Figure 17. Current PCB and mercury fish consumption advisories within the York River watershed and estuary. Image source: VA De-partment of Health.
34
centrations in the summer versus winter, consistently higher fecal coliform bacteria concentrations with distance upstream in tidal creeks and embayments, and elevated concentrations after period of high rainfall (Shima et al., 1994).
In order for the Commonwealth’s shellfish industry to en-gage in interstate commerce, shellfish waters are classified us-ing the requirements and standards of the National Shellfish Sanitation Program (NSSP). Virginia’s Department of Health (VaDH)/Division of Shellfish Sanitation classification of shell-fish water is a multi-step process that includes shoreline sur-veys to identify actual and potential sources of pollution and fecal coliform bacteria monitoring of growing waters. Fecal coliform organisms are used as an indicator of fecal pollution from warm blooded animals. The national standard for shell-fish waters is a geometric mean of 30 samples not to exceed 14 fecal coliforms 100 mL-1 of seawater (USFDA, 2003). Addi-tionally, the standard requires that the estimated ninetieth per-centile not exceed 49 fecal coliforms 100 mL-1. With respect to primary contact recreation protection, the standard is com-monly set at 200 fecal coliforms 100 mL-1 (VaSWcB, 2007).
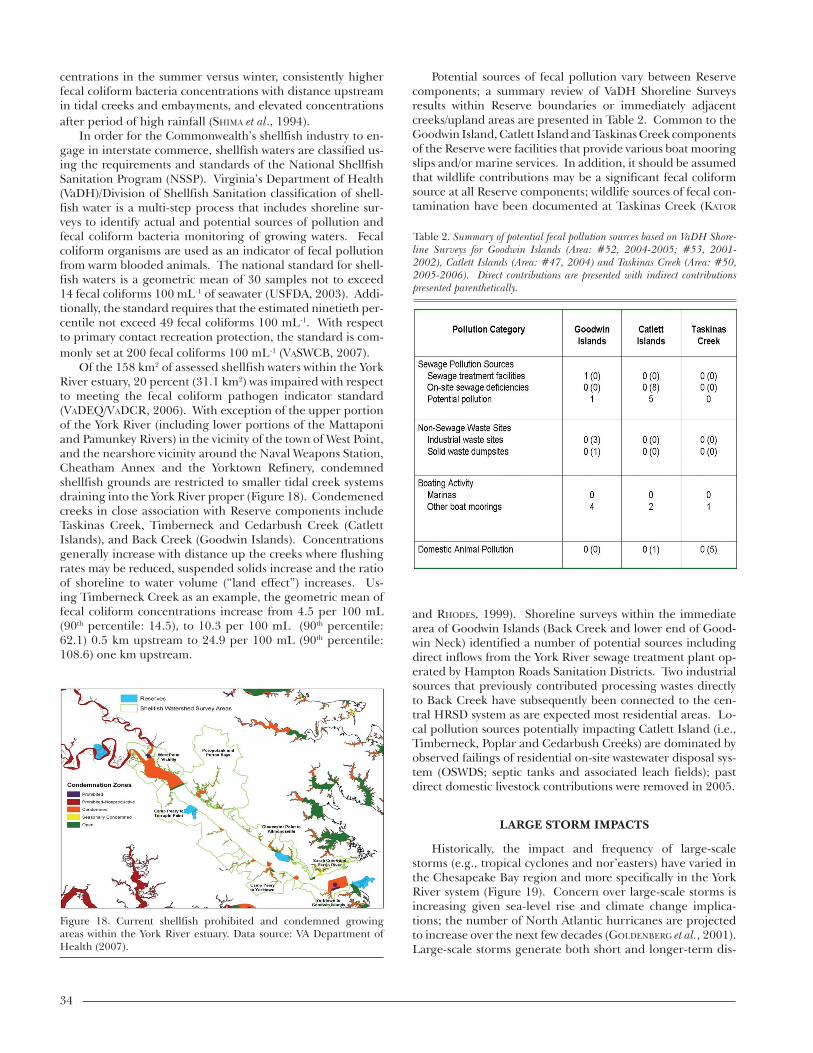
Of the 158 km2 of assessed shellfish waters within the York River estuary, 20 percent (31.1 km2) was impaired with respect to meeting the fecal coliform pathogen indicator standard (VaDeQ/VaDcr, 2006). With exception of the upper portion of the York River (including lower portions of the Mattaponi and Pamunkey Rivers) in the vicinity of the town of West Point, and the nearshore vicinity around the Naval Weapons Station, Cheatham Annex and the Yorktown Refinery, condemned shellfish grounds are restricted to smaller tidal creek systems draining into the York River proper (Figure 18). Condemened creeks in close association with Reserve components include Taskinas Creek, Timberneck and Cedarbush Creek (Catlett Islands), and Back Creek (Goodwin Islands). Concentrations generally increase with distance up the creeks where flushing rates may be reduced, suspended solids increase and the ratio of shoreline to water volume (“land effect”) increases. Us-ing Timberneck Creek as an example, the geometric mean of fecal coliform concentrations increase from 4.5 per 100 mL (90th percentile: 14.5), to 10.3 per 100 mL (90th percentile: 62.1) 0.5 km upstream to 24.9 per 100 mL (90th percentile: 108.6) one km upstream.
Potential sources of fecal pollution vary between Reserve components; a summary review of VaDH Shoreline Surveys results within Reserve boundaries or immediately adjacent creeks/upland areas are presented in Table 2. Common to the Goodwin Island, Catlett Island and Taskinas Creek components of the Reserve were facilities that provide various boat mooring slips and/or marine services. In addition, it should be assumed that wildlife contributions may be a significant fecal coliform source at all Reserve components; wildlife sources of fecal con-tamination have been documented at Taskinas Creek (Kator
Figure 18. Current shellfish prohibited and condemned growing areas within the York River estuary. Data source: VA Department of Health (2007).
Table 2. Summary of potential fecal pollution sources based on VaDH Shore-line Surveys for Goodwin Islands (Area: #52, 2004-2005; #53, 2001-2002), Catlett Islands (Area: #47, 2004) and Taskinas Creek (Area: #50, 2005-2006). Direct contributions are presented with indirect contributions presented parenthetically.
and rhoDeS, 1999). Shoreline surveys within the immediate area of Goodwin Islands (Back Creek and lower end of Good-win Neck) identified a number of potential sources including direct inflows from the York River sewage treatment plant op-erated by Hampton Roads Sanitation Districts. Two industrial sources that previously contributed processing wastes directly to Back Creek have subsequently been connected to the cen-tral HRSD system as are expected most residential areas. Lo-cal pollution sources potentially impacting Catlett Island (i.e., Timberneck, Poplar and Cedarbush Creeks) are dominated by observed failings of residential on-site wastewater disposal sys-tem (OSWDS; septic tanks and associated leach fields); past direct domestic livestock contributions were removed in 2005.
LARGE STORM IMPACTS
Historically, the impact and frequency of large-scale storms (e.g., tropical cyclones and nor’easters) have varied in the Chesapeake Bay region and more specifically in the York River system (Figure 19). Concern over large-scale storms is increasing given sea-level rise and climate change implica-tions; the number of North Atlantic hurricanes are projected to increase over the next few decades (golDenBerg et al., 2001). Large-scale storms generate both short and longer-term dis-

35
turbances in response to high winds, storm surges and rain-fall. Consequences of storm surges and surface waves include extensive flooding of low-lying areas, shoreline erosion, sedi-ment resuspension and associated pollutant availability, verti-cal column mixing and increased upstream salinities (WalKer, 2001). Consequences of excessive rainfall include elevated direct and watershed runoff freshwater input and associated downstream salinity depression (peierlS et al., 2003; BaleS, 2003), along with elevated material (e.g., sediment, carbon, nutrients) loadings from stormwater runoff (WalKer, 2001; paerl et al., 2001; mallin et al., 2002; BaleS, 2003; BurKholD-er et al., 2004). Just as each storm has distinct characteris-tics and hydrologic responses by the impacted watershed and water body, the type and severity of ecosystem responses can also vary. Reported responses by estuarine systems include elevated phytoplankton biomass and changes in community composition stimulated by newly available nutrients (peierlS et al., 2003), depressed oxygen levels and severe hypoxic events (paerl et al., 2001, 2003; BurKholDer et al., 2004) and damage to vegetative communities (Valiela et al., 1998).
Two of the most studied large-scale storms within the Ches-apeake Bay region include Tropical Storm Agnes in June 1972 (DaViS et al., 1976) and Isabel which made landfall Septem-ber 18, 2003 (Sellner, 2005). Focus will be given to Tropical Storm Isabel due to the availability of York River water quality related information. The hydrodynamic response of the York River estuary to Isabel has been reported on by a number of investigators (reay and moore, 2005; BraSSeur et al., 2005; gong et al., 2007). Regional rainfall from September 18-19, 2003, ranged from 5.8-11.7 cm. Peak mean daily streamflow occurred on September 21, 2003 and represented a 20 and 30 fold increase over pre-storm conditions on the Mattaponi and Pamunkey Rivers, respectively. Isabel produced a storm surge of 1.7 m near the mouth of the York River estuary and 2.0 m in the upper tidal freshwater regions. Maximum wave height (H1/10) was on the order of 2.0 m and maximum water velocity was 1.0 m sec-1 at the surface and 1.6 m sec-1 at depth (4 m). Net salt flux into the York River estuary increased by a fac-tor of 30 during the storm surge and resulted in a short-term pulse of high salinity water; approximately 10 ppt greater
than pre-storm conditions within the oligohaline portion of the estuary (see Figure 4). In comparison, salinity levels in the upper tidal freshwater regions and the downriver meso and polyhaline regions remained relatively unchanged. Following the storm surge, salinity levels within the lower portions of the York River estuary declined 1.5 to 4.5 ppt for an extended period in response to freshwater input. The high freshwater input changed the York River estuary from a partially mixed estuary to a very stratified estuary for a prolonged period of time.
Decreased water clarity, as measured by increased turbid-ity, was observed throughout the York River estuary during and after Isabel’s passage. Contributing factors that led to elevated, and in some case extreme, turbidity levels included shoreline erosion and sediment resuspension caused by cur-rents and waves during the storm surge, and subsequent wa-tershed runoff. During the storm, acoustic Doppler current profiler (ADCP) backscatter, which can serve as a qualitative measure of suspended solids, was elevated and uniform with depth indicating elevated sediment load and complete water column (water depth range: 8-10 m) mixing during the storm and into the following day at Gloucester Point (BraSSeur et al., 2005). It took at least one-week for surface backscatter signals to return to pre-storm levels. With regards to shallow waters, maximum storm surge associated turbidity levels var-ied between 192 and > 1000 NTUs; pre-storm turbidity levels were 10-15 NTUs within the tidal freshwater and polyhaline regions and 50-100 NTUs at upper meso haline and lower oligohaline regions (reay and moore, 2005). The duration of highly turbid water (≥ 200 NTUs) in shallow shoal waters was relatively short-lived, returning to pre-storm or near pre-storm conditions within 24-30 hrs at the oligo through poly-haline stations. Moderately elevated turbidity levels persisted for several days at the tidal freshwater stations due to freshwa-ter inflow and associated runoff.
A gradual increase (1-2 mg L-1) in dissolved oxygen was observed immediately prior to and during the storm tide at shallow water tidal freshwater and oligohaline station likely in response to enhanced mixing and agitation from wind, waves, current and influx of higher salinity water (reay and moore, 2005). This pattern was not evident at higher salinity stations where daily maximum oxygen levels were already at or near saturation levels as compared to tidal freshwater and oligo-haline stations. As the storm tide ebbed, dissolved oxygen returned to pre-storm conditions at shallow water oligohaline stations but continued to recede, resulting in mean daily con-centrations of 3-4 mg L-1, in the tidal freshwater regions and taking an additional two-weeks to return to pre-storm condi-tions (Figure 20). Enhanced watershed material loadings, in particular degradable organic matter, are implicated in be-ing a controlling factor in the development and sustaining reduced oxygen levels within these regions. Inadequate data was available to assess dissolved oxygen dynamics in deep channel waters of the York River. CBP monitoring data col-lected prior to Isabel’s passage showed dissolved oxygen con-centration of 4.7 mg L-1 (date: 9/16/2003) and 5.1 mg L-1 on subsequent sampling (10/7/2003) near Gloucester Point (sta-tion ID: LE4.2). In contrast to other regions of the Bay, no apparent increases in phytoplankton biomass was observed post-Isabel in the York River. Miller et al., (2005) reported significant phytoplankton biomass increases in the mid-lower Chesapeake Bay following the passage of Isabel. The inves-
Figure 19. Nearshore impact at Gloucester Point, VA. from tropical depression Ernesto (9/1/2006). Photo courtesy of W. Reay.

36
tigators suggested that storm surge and wind mixing intro-duced bottom water nutrients into the photic layer during a period of nitrogen limitation as the likely physical mechanism responsible for enhanced phytoplankton biomass. It should be noted that the passage of Tropical Storm Isabel occurred following historic wet conditions within the Bay region.
FUTURE RESEARCH NEEDS
While significant effort has focused on water quality as-pects of the York River estuary, there remains a number of research and monitoring priority areas that would enhance our basic understanding of estuarine processes and support tributary management strategies. Essential to York River wa-ter quality management strategies is a better understanding of material flux into and out of the riverine system. Specific to nutrients and contaminants (e.g., PCBs, PAHs and Hg), addi-tional information is needed with respect to groundwater and atmospheric loadings, and Bay/oceanic flux occurring at the mouth of the York River estuary. Studies should be conducted to address the impacts of landscape management as related to increasing watershed population, changing landscapes, sea level rise and climate change, and episodic events (e.g., large-scale storms, droughts) on watershed processes and material loadings to tidal waters. Additional studies are needed to source track pathogenic microbes and investigate the role of estuarine substrates with respect to microbe survival and sedi-ment resuspension with respect to water quality and shellfish growing bed closures. As well as watershed processes, addi-tional efforts should refine the description of physical estua-rine processes, such as circulation patterns, mixing processes, residence time and exchange of water between shallow shoal and deeper channel regions and their impacts water quality.
Further studies are needed regarding interrelationships between ecosystem response and water quality and physical factors within various salinity regimes. Of prime importance is ecosystem response to temporal and spatial variations in nutrient (i.e., N, P and Si) and sediment inputs. In addition
to general phytoplankton dynamics, a greater understanding of the linkages of water quality to the development and suste-nance of HABs is warranted. Determination of the spatial and temporal extent of hypoxic and anoxic conditions within the York River proper, its principal tributaries and of smaller sub-tributaries would greatly support tributary management and habitat restoration efforts within the York River system. In ad-dition to focusing on degrading water quality, efforts should also focus on ecosystem (i.e., benthic, nekton and plankton) response to improving water quality conditions. Maintenance and enhancement of long-term monitoring programs would also support resource management and scientific community. In addition to current efforts that support regulatory pro-grams and physical modeling efforts, build-out or technologi-cal advances of the monitoring program could lead to forecast ability with respect to HABs and low DO events.
ACKNOWLEDGEMENTS
The author would like to thank Robert Croonenberghs for providing current Virginia Department of Health shellfish closure and shoreline survey information, and Scott Lerberg and David Parrish for providing map figures in the chapter.
LITERATURE CITED
Bachman, l., B. linDSey, J. BraKeBill and D. poWarS, 1998. Ground-water discharge and baseflow nitrate loads of nontidal streams, and their relation to a hydrogeomorphic classification of the Chesa-peake Bay watershed, Middle Atlantic Coast. USGS Water Resources Investigation Report, 98-4059, 72p.
BaleS, J., 2003. Effects of Hurricane Floyd inland flooding, Septem-ber-October 1999, on tributaries to Pamlico Sound, North Caro-lina. Estuaries, 26(5), 1319-1328.
Boynton, W., m. Kemo and c. KeeFe, 1982. A comparative analysis of nutrients and other factors influencing estuarine phytoplankton production. In: Kennedy V. (ed.), Estuarine Comparisons. Academic Press, New York, pp.209-230.
BraSSeur, l., a. tremBaniS, J. BruBaKer, c. FrieDrichS, t. nelSon, l. Wright, W. reay and l. haaS, 2005. Physical response of the York River estuary to Hurricane Isabel. In: Sellner, K. (ed.), Hurricane Isabel in Perspective. Chesapeake Research Consortium, CRC Publi-cation 05-160, Edgewater, Md., pp. 57-63.
Buchanan, c., r. lacouture, h. marShall, m. olSon and J. JohnSon, 2005. Phytoplankton reference communities for Chesapeake Bay and its tidal tributaries. Estuaries, 28(1),138-159.
Buchanan, C., 2006. A restoration goal for Chesapeake Bay phyto-plankton communities. Interstate Commission on the Potomac River White Paper. Rockville, Md., 12p.
BurKholDer, J., D. eggleSton, h. glaScoW, c. BroWnie, r. reeD, g. JanoWitz, m. poSey, g. melia, c. KinDer, r. corBett, D. tomS, t. alphin, n. Deamer and J. Springer, 2004. Comparative impacts of two major hurricanes seasons on the Neuse River and western Pamlico Sound ecosystems. Proceedings of the National Academy of Sci-ences, 101(25), 9291-9296.
Byrne, R. and G. anDerSon, 1976. Shoreline erosion in Tidewater Vir-ginia. SRAMSOE No. 111. Virginia Institute of Marine Science, Gloucester Point, VA.
conley, D. and T. mallone, 1992. Annual cycle of dissolved silicate in Chesapeake Bay: Implications for the production and fate of phy-toplankton biomass. Marine Ecology Progress Series, 81, 121-128.
countWay, r., r. DicKhut and e. canuel, 2003. Polycyclic aromatic hydrocarbon (PAH) distributions and associations with organic matter in surface waters of the York River, VA estuary. Organic Geo-chemistry, 34(2), 209-224.
cWVa, 2005. Chesapeake Bay Nutrient and Sediment Reduction Tributary Strategy for the York River and Lower York Coastal Basins. Common-wealth of Virginia, Richmond, VA. 113pp.
Figure 20. Daily mean and minimum dissolved oxygen concentra-tions at White House, located in the upper tidal freshwater regions of the Pamunkey River, prior to, during and post Isabel. Streamflow is from Hanover located above tidal influence. Figure from reay and moore, 2005.

37
Dauer, D., h. marShall, J. Donat, m. lane, p. morton, S. Doughten and F. hoFFman. 2005. Status and trends in water quality and living resources in the Virginia Chesapeake Bay: York River (1985-2004). Final Report. Virginia Department of Environmental Quality, Rich-mond, Va., 63p.
DaViS, J., B. lairD, e. ruzecKi, J. SchuBel, r. huggett, a. anDerSon, m. WaSS, r. maraSco and m. lynch (eds.), 1976. The Effects of Tropi-cal Storm Agnes on the Chesapeake Bay Estuarine System. Chesapeake Research Consortium Publication No. 54. The Johns Hopkins Uni-versity Press, Baltimore, Md. 639 p.
gallagher, D., a. Dietrich, W. reay, m. hayeS, and g. SimmonS, Jr., 1996. Groundwater discharge of agricultural pesticides and nutri-ents to estuarine waters. Ground Water Monitoring and Remedia-tion, (Winter), 118-129.
gallegroS, c. and t. JorDan, 2002. Impact of the spring 2000 phyto-plankton bloom in Chesapeake Bay on optical properties and light penetration in the Rhode River, Maryland. Estuaries, 25, 508-518.
GEOHAB, 2006. Global ecology and oceanography of harmful algal blooms. In: Glibert, P. (ed.), Harmful Algal Blooms in Eutrophic Systems (. GEOHAB report no. 4. IOC and SCOR, Paris and Baltimore, 74p.
gliBert, p., D. conley, t. FiSher, l. harDing and t. mallone, 1995. Dynamics of the 1990 winter/spring bloom in Chesapeake Bay. Ma-rine Ecology Progress Series, 122, 27-43.
golDenBerg, S., c. lanDSea, a. meStaS-nunez and W. gray, 2001. The recent increase in Atlantic hurricane activity: Causes and implica-tions. Science, 293, 474-478.
gong, W., J. Shen and W. reay, 2007. The hydrodynamic response of the York River estuary to Tropical Cyclone Isabel, 2003. Estuarine, Coastal and Shelf Science, 73, 695-710.
haaS, L., 1977. The effect of the spring-neap tidal cycle on the verti-cal salinity structure of the James, York and Rappahannock Rivers, Virginia, U.S.A. Estuarine and Coastal Marine Science, 5, 485-496.
haaS, l., S. haStingS and K. WeBB, 1981. Phytoplankton response to a stratification-mixing cycle in the York River estuary during late summer. In: Neilson, B. and L. Cronin (eds.), Estuaries and Nutri-ents. Humana Press, Clifton, NJ, pp. 619-635.
hall, l., r. anDerSon, r. meSSing, t. turner, D. goShorn and m. mcginty, 1998. Ambient toxicity testing Chesapeake Bay – Year 6 report. EPA 903-R-98-017, USEPA Chesapeake Bay Program Office, An-napolis, MD. 79p. plus appendices.
hartWell, S. and J. hameeDi, 2007. Magnitude and extent of contami-nated sediment and toxicity in Chesapeake Bay. NOAA Technical Memorandum NOS NCCOS 47, 234p.
ho, M. and P. zuBKoFF, 1979. The effects of a Cochlodinium heterolo-batum bloom on the survival and calcium uptake by larvae of the American oyster, Crassostrea virginica. In: Taylor, F. and H.H. Seli-ger (eds.), Toxic Dinoflagellate Blooms. New York, pp. 409-412.
hylanD, J., r. Van Dolah and t. SnootS, 1999. Predicting stress in benthic communities of southeastern U.S. estuaries in relation to chemical contamination of sediments. Environmental Toxicology and Chemistry, 18(11), 2557-2564.
Kator, H. and M. rhoDeS, 1999. Continued evaluation of pollutant sources contributing to degraded sanitary water quality in Taskinas Creek Reserve, Virginia. Final Report. NOAA Office of Ocean and Coastal Resource Management, Richmond, Va., 29p.
Kemp, M. and W. Boynton, 1992. Spatial and temporal coupling of nutrient inputs to estuarine primary production: The role of par-ticulate transport and decomposition. Bulletin of Marine Science, 35, 522-535.
Kemp, M. and W. Boynton, 1994. Benthic-pelagic interactions: Nutri-ent and oxygen dynamics. In: Smith, D., M. Leffler and G. Macki-ernan (eds.), Oxygen Dynamics in the Chespeake Bay: A Synthesis of Research. Maryland Sea Grant College, College Park, MD, pp. 149-221.
Kuo, A. and B. neilSon, 1987. Hypoxia and salinity in Virginia estuar-ies. Estuaries, 10(4), 277-283.
Kuo, a., K. parc and m. mouStaFa, 1991. Spatial and temporal vari-abilities of hypoxia in the Rappahannock River, Virginia. Estuaries, 14, 113-121.
lacouture, r., J. JohnSon, c. Buchanan and h. marShall, 2006. Phy-toplankton index of biotic integrity for Chesapeake Bay and its tidal tributaries. Estuaries, 29(4), 598-616.
langlanD, M. and T. cronin, 2003. A summary report of sediment processes in Chesapeake Bay and watershed. USGS Water Resourc-es Investigations Report, 03-4123.
langlanD, m., D. moyer and J. BlomQuiSt, 2007. Changes in stream-flow concentrations in selected nontidal basins in the Chesapeake Bay watershed, 1985-2006. USGS Open File Report 2007-1372, 58p. plus appendices.
lin, J. and A. Kuo, 2001. Secondary turbidity maximum in a partially mixed microtidal estuary. Estuaries, 24, 707-720.
macintyre, W., g. JohnSon, W. reay, and g. SimmonS Jr., 1989. Groundwater non-point sources of nutrients to the southern Ches-apeake Bay. In: Proceedings of Groundwater Issues and Solutions in the Potomac River Basin/Chesapeake Bay Region. National Water Well As-sociation, Dublin, OH, pp. 83-104.
mallin, m., m. poSey, m. mciVer, D. parSonS, S. enSign and t. alphin, 2002. Impacts and recovery from multiple hurricanes in a Pied-mont-Coastal Plain river system. Bioscience, 52, 999-1010.
malone, t., D. conley, t. FiSher, p. gliBert, l. harDing and K. Sell-ner, 1996. Scales of nutrient-limited phytoplankton productivity in Chesapeake Bay. Estuaries, 19(2B), 371-385.
marShall, H. and R. alDen, 1990. A comparison of phytoplankton assemblages and environmental relationships in three estuarine rivers of the lower Chesapeake Bay. Estuaries, 13(3), 287-300.
marShall, H., 1994. Succession of dinoflagellate blooms in the Chesa-peake Bay, USA. In: Lassus, P. et al. (eds.), Harmful Marine Algal Blooms. Proceedings of the 6th International Conference on Toxic Marine Phytoplankton. Intercept, Ltd., Andover, UK, pp. 615-620.
marShall, h., r. lacourture, c. Buchanan and J. JohnSon, 2006. Phytoplankton assemblages associated with water quality and sa-linity regions in Chesapeake Bay, USA. Estuarine, Coastal and Shelf Science, 69, 10-18.
maSon, r., n. laWSon and K. SulliVan, 1997. Atmospheric deposi-tion to the Chesapeake Bay watershed – Regional ad local sources. Atmospheric Environment, 31, 3513-3540.
mcgee, B., D. FiSher, J. aShley and D. VelinSKy, 2001. Using the sedi-ment quality triad to characterize toxic conditions in the Chesa-peake Bay (1999): An assessment of the tidal river segments in the Bohemia, Magothy, Patuxent, James, and York Rivers. EPA 903-R-01-008, CBP/TRS 257/01, USEPA, Chesapeake Bay Program Of-fice, Annapolis, MD, 35p. plus appendices.
miller, W., l. harDing and J. aDolF, 2005. The influence of Hurricane Isabel on Chesapeake Bay phytoplankton dynamics. In: Sellner, K. (ed.), Hurricane Isabel in Perspective. Chesapeake Research Consor-tium, CRC Publication 05-160, Edgewater, MD, pp. 155-160.
NRCS, 1992. Natural Resources and Conservation Service, USLE data for the York River watershed.
patricK, J., 1976. Soil erosion in the eastern forest. Journal of Forestry, 74(10), 671-677.
paerl, h., J. BaleS, l. auSley, c. Buzzelli, l. croWDer, l. eBy, J. Fear, m. go, B. peierlS, t. richarDSon and J. ramuS, 2001. Ecosystem impacts of three sequential hurricanes (Dennis, Floyd, and Irene) on the United States’ largests lagoonal estuary, Pamlico Sound, NC. Proceedings of the National Academy of Sciences, 98(10), 5655-5660.
peierlS, B., r. chriStian and h. paerl, 2003. Water quality and phy-toplankton as indicators of hurricane impacts on a large estuarine ecosystem. Estuaries, 26(5), 1329-1343.
raVichanDran, M., 2004. Interactions between mercury and dissolved organic matter – A review. Chemosphere, 55, 319-331.
reay, W., D. gallagher and g. SimmonS, Jr., 1992. Groundwater dis-charge and its impact on surface water quality in a Chesapeake Bay inlet. Water Resources Bulletin, 28(6), 1121-1134.
reay, W., 2004. Septic tank impacts on ground water quality and near-shore sediment nutrient flux. Ground Water, 42(7), 1079-1089.
reay, W. and K. moore, 2005. Impacts of tropical cyclone Isabel on shallow water quality of the York River estuary. In: Sellner, K. (ed.), Hurricane Isabel in Perspective. Chesapeake Research Consortium, CRC Publication 05-160, Edgewater, MD, pp. 135-144.
roBertS, m., m. richarDS and p. D’liSle, 2004. Chemical and toxi-cological characterization of the upper York River, Virginia – The Mattaponi and Pamunkey Rivers. Final Report. Virginia Depart-ment of Environmental Quality, Richmond, VA, 57p.

38
Sanger, D., m. arenDt, y. chen, e. Wenner, a. hollanD, D. eDWarDS and J. caFFrey, 2002. A synthesis of water quality data: National Es-tuarine Research Reserve System-wide Monitoring Program (1995-2000). National Estuarine Research Reserve Technical Report Series 2002: 3. South Carolina Department of Natural Resources, Marine Resources Division Contribution No. 500, 135p.
Seitz, R.C., 1971. Drainage area statistics for the Chesapeake Bay freshwater drainage basin. Chesapeake Bay Institute, Special Report No. 119. The Johns Hopkins University, Baltimore, MD.
Sellner, K. (ed.), 2005. Hurricane Isabel in Perspective. Proceedings of a Conference. Chesapeake Research Consortium, CRC Publication 05-160, Edgewater, MD, 266p.
Sellner, K., g. Doucette and g. KirKpatricK, 2003. Harmful algal blooms: Causes, impacts and detection. Journal of Industrial Micro-biology and Biotechnology, 30(7), 383-406.
SharpleS, J., J. SimpSon and J. BruBaKer, 1994. Observations and mod-eling of periodic stratification in the upper York River estuary, Vir-ginia. Estuarine, Coastal and Shelf Science, 38, 301-312.
Shen, J. and L. haaS, 2004. Calculating age and residence time in the tidal York River using three-dimensional model experiments. Estuarine, Coastal and Shelf Science, 61, 449-461.
Shima, F., W. reay, D. gallagher, g. SimmonS, J. WalDon and K. reay, 1994. Groundwater transport of fecal coliform bacteria to open coastal waters of Virginia’s Coastal Plain: A GIS approach. Final report. Virginia Department of Environmental Quality, Coastal Re-sources Management Program. Richmond, VA.
SimmonS, g., Jr., e. mileS, W. reay and D. gallagher, 1992. Subma-rine groundwater discharge quality in relation to land-use patterns in the southern Chesapeake Bay. In: Stanford, J. and J. Simon (eds.), Proceedings of the First International Conference on Ground Water Ecology. American Water Resources Association, Bethesda, MD, pp 341-350.
Sin, y., r. Wetzel and i. anDerSon, 1999. Spatial and temporal char-acteristics of nutrient and phytoplankton dynamics in the York River estuary, Virginia: Analyses of long-term data. Estuaries, 22, 260-275.
Sin, y. and r. Wetzel, 2002a. Ecosystem modeling analysis of size-structured phytoplankton dynamics in the York River estuary, Vir-ginia (USA). I. Development of a plankton ecosystem model with explicit feedback controls and hydrodynamics. Marine Ecology Progress Series, 228, 75-90.
Sin, y. and r. Wetzel, 2002b. Ecosystem modeling analysis of size-structured phytoplankton dynamics in the York River estuary, Vir-ginia (USA). II. Use of a plankton ecosystem model for investigat-ing controlling factors on phytoplankton and nutrient dynamics. Marine Ecology Progress Series, 228, 91-101.
Sin, y., r. Wetzel, B. lee and y. Kang, 2006. Integrative ecosystem analyses of phytoplankton dynamics in the York River estuary (USA). Hydrobiologia, 571, 93-108.
SiSSon, g., J. Shen, S. Kim, J. Boone and a. Kuo, 1997. VIMS three dimensional hydrodynamic-eutrophication model (HEM-3D): Ap-plication of the hydrodynamic model to the York River system. SRAMSOE Report No. 341. Virginia Institute of Marine Science, Gloucester Point, VA, 123p.
Smith, D., m. leFFler and g. macKiernan (eds). 1992. Oxygen dy-namics in the Chesapeake Bay: A synthesis of recent research. Maryland and Virginia Sea Grant College Program, College Park, MD. 252p.
Sprague, l., m. langlanD, S. yochum, r. eDWarDS, J. BlomQuiSt, S. phillipS, g. ShenK and S. preSton, 2000. Factors affecting nutrient trends in major rivers of the Chesapeake Bay watershed. USGS Water Resouces Investigations Report 00-4218, 109p.
Sturm, S. and B. neilSon, 1977. Water quality in the York River. VIMS SRAMSOE Report 130. VIMS, College of William and Mary, Gloucester Point, VA, 55p.
ullrich, S. t. tanton and S. aBDraShitoVa, 2001. Mercury in the aquatic environment: A review of factors affecting methylation. Critical Reviews in Environmental Science and Technology, 31, 241-293.
USFDA, 2003. Guide for the control of molluscan shellfish. National Shellfish Sanitation Program, U.S. Food and Drug Administration, 427p.
USEPA, 2003. Ambient water quality criteria for dissolved oxygen, water clarity and chlorophyll a for the Chesapeake Bay and its tidal tributaries. EPA 903-R-03-002, 219p. plus appendices.
USEPA, 2005. Sediment in the Chesapeake Bay and management is-sues: Tidal erosion processes. Tidal Sediment Task Force of the Sedi-ment Workgroup, Chesapeake Bay Program. CBP-TRS276-05, 16p.
USEPA, 2006. Toxics of concern: Prioritizing organic pollutants that threaten the Chesapeake Bay. Chesapeake Bay Program Scientific and Technical Advisory Committee, Toxics Fact Sheet, 2p.
USEPA, 2007. Ambient water quality criteria for dissolved oxygen, water clarity and chlorophyll a for the Chesapeake Bay and its tidal tributaries, 2007 addendum. EPA 903-R-07-003, 97p. plus appen-dices.
VDH, 2005. Virginia Department of Health News Release 3/30/2005. Richmond, VA, 1p.
VaDeQ/VaDcr, 2004. Virginia water quality assessment 305(b)/303(d) integrated report. Virginia Departments of Environmental Quality and Conservation and Recreation. Richmond, VA, 505p. plus appendices.
VaDeQ, 2005. PCB strategy for the Commonwealth of Virginia. Vir-ginia Department of Environmental Quality. Richmond, VA, 32p. plus appendices
VaDeQ/VaDcr, 2006. Virginia water quality assessment 305(b)/303(d) integrated report. Virginia Departments of Environmental Quality and Conservation and Recreation. Richmond, VA, 505p. plus appendices.
Valiela, i., p. pecKol, c. D’aVanzo, J. Kremer, D. herSh, K. Foreman, K. laJtha, B. Seely, W. geyer, t. iSaJi and r. craWForD, 1998. Eco-logical effects of major storms on coastal watersheds and coastal waters: Hurricane Bob on Cape Cod. Journal of Coastal Research, 14(1), 218-238.
VaSWcB, 2007. Virginia State Water Control Board. VAC 25-260 Vir-ginia Water Quality Standards. Statutory Authority: § 62.1-44.15 3a of the Code of Virginia, with amendments effective September 11, 2007, 180p.
WalKer, N., 2001. Tropical storm and hurricane wind effects on wa-ter level, salinity and sediment transport in the river-influenced Atchafalaya-Vermilion Bay stytem, Louisiana USA. Estuaries, 24(4), 498-508.
WeBB, K., 1987. Nutrient limitation studies in a coastal plain estuary: Seasonal and salinity effects. EOS, 68, 1689 (abstract).
WeBB, K. and C. D’elia, 1980. Nutrient and oxygen redistribution during a spring-neap tidal cycle in a temperate estuary. Science, 207, 983-985.
Wenner, e., a. hollanD, m. arenDt, y.chen, D. eDWarDS, c. miller, m. meece and J. caFFrey, 2001. A synthesis of water quality data from the National Estuarine Research Reserve’s System-Wide Mon-itoring Program. NOAA Grant NA97OR0209, MRD Contribution No. 459, 276p.
Wright, D., c. orano-DaWSon, l. cole, t. luSKey and a. hall, 2002. Characterization of contaminant impacts in tidal fresh reaches of Chesapeake Bay tributaries, 2000. UMCES Technical Report Se-ries No. TS-348-02-CBL, 4p. plus appendix.