water resources management concepts and tools · water resources management concepts and tools...
TRANSCRIPT
$• H.H.G. Savenije
III
WERM011/96
FI
Water Resources ManagementConcepts and Tools
D E L F T
International Institute forInfrastructural, Hydraulic andEnvironmental Engineering
The Netherlands

Fax:+31™ 35899 64BARCODE: *LO:
H.H.G. Savenije Lecture Notes WERM011/96
Water Resources ManagementConcepts and Tools
Dr. H.H.G. Savenije Delft, November 1996
WATER RESOURCES MANAGEMENTCONCEPTS AND TOOLS
CONTENTS
1. CONCEPTS IN WATER RESOURCES MANAGEMENT 11.1. Definitions 11.2. Strategic Issues in Water Resources Management 61.3. Activities involved in WRM 101.4. Coping with uncertainty 121.5. Types of planning 131.6. Involvement of stakeholders 161.7. People's Participation 19
2. HUMAN INTERFERENCES IN THE WATER RESOURCE SYSTEM . . . 212.1. Man's attitude towards nature and development 212.2. Flood protection 242.3. Irrigation and drainage 282.4. Flow regulation and reservoir construction 282.5. Water resources management in The Netherlands 30
3. WATER RESOURCES 373.1. Groundwater resources 373.2. Surface water 423.3. Catchment yield 453.4. Integrated water resources 503 5. Is evaporation a loss? 56
4. WATER DEMAND 594.1. General 594.2. Projections of water demand 614.3. Demand Management 684.4. Relations between price and demand 754.5. Experiences with water pricing and demand management 78
5. WATER RESOURCES SYSTEM MODELS 815.1. System elements 815.2. Simple reservoir model 845.3. River Basin Simulation model 895.4. Incorporation of water quality 905.5. Integrated water resources system 94
Exercises 96References 100Annotated Recommended Bibliography 103
Preamble
on Water Resources Management, Concepts and Tools is a compulsory subjectof three courses: the Water and Environmental Resources Management (\JiiSilM) Course(both for WQM and ^ R M branches), the Course for Hydrologists, and theHydroinformatics Course. It is meant to give an introduction to present-day views andtechniques regarding the sustainable management of water resources as an integrated partii/Hie national policy framework. It is the basic lecture for the Water ResourcesManagement (WRM) branch of the WERM Course. It is part of a sequence of key lectureson planning, analysis, management and decision making:
• Framework for Analysis; focusing on an integrated systematic approach to planningand analysis;
• Planning Economics; focusing on analyzing the costs and benefits of actions in bothmonetary and non-monetary terms;
• Management Arrangements; focusing on the implementation mechanisms forintegrated water resources management;
• Decision Making and Communication; focusing on techniques to facilitate thecomparison of alternatives and the communication with stakeholders;
• Water Using Activities; focusing of the claims that water users lay on the waterresources system and the impacts they may have on it;
• The INCQMANA groupwork which integrates all the theoretical concepts and toolslearned in the WERM course into a real-life planning case;
• The various Roleplays that give real-life and hands-on experience of how waterresources managers and stakeholders operate.
These lecture notes address the basic components of water resources management: thewater resources system, comprising the w«t$ir*weurces, the physical infrastructure andthe institutional framework, and the rtMir ^emaads as expressed by the different waterusers. It describes their particulars and the way these components interact. Chapter 3 onWater Resources, to some extent, contains redundant material which has been lectured inthe lecture Principles of Hydrology. The redundant material is not presented in this lectureseries, but has been retained in the lecture notes for reasons of completeness.
Water in The Netherlands
The Committee for Hydrological Research, TNO-CHO issued an interesting booklet calledWafer in The Netherlands (1986, 1989). Besides general information on the history ofwater resources management, the climate and water works in The Netherlands, the bookletgives extensive information on the present organization of the Dutch water sector, themanagement of both quantity and quality of water, and most importantly on the wateradministration and water resources management (Chapter 8). Since the institutionalarrangements of The Netherlands are considered interesting for IHE participants, thisChapter is fully reproduced in Section 2.5.
1. CONCEPTS IN WATER RESOURCES MANAGEMENT
1.1. Definitions
This Section deals with the definitions of the terminology used in the water sector withregard to planning and management. Definitions are given of water resources management,integrated water resources management, sustainable use of water resources and waterresources capacity building.
WATER RESOURCES MANAGEMENT
Three activities are distinguished: Wtlpr Resources Development (WRD), Watt®Resourceso p t i n g (WRP), and W«iw Resources Management (WRM). Water ResourcesDevelopment is defined as:
Water Resources Development: actions, both physical and administrative that leadto the beneficial use of water resources for single or multiple purposes.
People from different backgrounds seldom have the same idea about what water resourcesdevelopment means (see Fig. 1.1). To those living in an arid country, it means droughtrelief, food, jobs, law and politics. To those living in humid areas, it brings to mindwaterworks, flood protection, navigation, hydropower and pollution control. To theecologist, water resources development is often connected with the deterioration ofhabitats, the destruction of natural rivers and pollution. To the water resources engineer,water resources development is related to dams, reservoirs, flood protection, diversions,river training, water treatment and reclamation. To the lawyer, a water resource systemis a device for the implementation of water rights. To the economist, water resourcesdevelopment is connected with economic efficiency, stimulation of growth, poverty al-leviation and employment generation. Similar specialized viewpoints are held by politiciansand decision makers.
Water resources development includes all these points of view. It is physical, economic,political, sociological, environmental, agricultural and technical. The relative ease withwhich one of these aspects might be quantifiable, as compared to another, does not in anyway reflect a correspondingly great importance. If not enough weight is given to either oneof these aspects, a water resources development project is likely to fail.
Hence the planning of WRD is q^lMifiCiiri;t1trY It is defined as:
Water Resources Planning: planning of the development and allocation of ascarce resource (sectoral and intersectoral), matching water availability anddemand, taking into account the full set of national objectives and constraints andthe interests of stakeholders
Hence WRP is multi-sectoral, multi-objective and multi-constrained. Planning is onlyeffective if all interested parties (both formal and informal) during the planning andimplementation stage (stakeholders) are - in one way or another - involved in the processof decision making and hence feel committed. If not, the project(s) or programme is likelyto fail.

What is
« to
• to
• to
• to
• to
• to
Water Resources Development ?
people in arid countries:
- drought relief
- irrigation
- jobs, food
- flash floods
people in wet countries:
- water works
- navigation
- flood protection
— hydro power
the water engineer:
— dams, reservoirs
- flood protection
— river training
- water treatment
the environmentalist:
•• habitat deterioration
- deforestation
- pollution
— destruction of wet lands
the lawyer: '
- legislation
- international law
- water rights
the economist:
- stimulation of economic growth
- poverty alleviation
— employment generation
Fig. 1.1 How do people from different backgrounds consider Water Resources Development

The management of water resources is defined as:
lent: tKP«**fto*e set of technical, institutional,ggfeagerial,lipfrahtfOperational acifillfti nmniisd to plan, develop, operate and
water resources
Water Resources Management can be considered as a jpocess including all activities ofplanning, design, construction and operation of water resources systems.
Hence: WRM > WRP
Water Resources Management integrates by definition all aspects and functions related towater. The term integrated Water Resources Management. I WRM. is defined as WRMthat takes full account of:
• all natural aspects of the water resources system: surface water,groundwater, water quality (physical, biological and chemical) and itsphysical behaviour;
• the interests of water users in all sectors of the national economy (agricul-ture, water supply, hydropower, inland transportation, fisheries, recreation,environment, nature conservation); hence the complete mix of inputs andoutputs related to water;
• the relevant national objectives and constraints (social, legal, institutional,financial, environmental);
• the institutional framework and stakeholders (national, provincial, local);• the spatial variation of resources and demands (upstream-downstream
interaction, basin-wide analysis, interbasin transfer).
In fact, good water resources management is integrated water resources management andthe addition of the word '^Btegfated'' is merely used for emphasis.
SUSTAINABLE USE OF WATER RESOURCES
Water resources development that is not sustainable is ill-planned. Fresh water resourcesare scarce and to a large extent finite. Although ijiifcce water m0^tm considered ar^p.wable resource, it only constitutes 1.5% of all terrestrial fresh water resources; thevast majority is fgrepndwater (98.5%) which - at a human scale - is virtually unrenewable.Consequently, there are numerous ways to jeopardize the future use of water, either byoverexploitation (mining) of resources or by destroying resources for future use (e.g.pollution). Besides physical aspects of sustainability there are social, financial andinstitutional aspects. The following ^ p p t s of sustainability are distinguished:
sustainability (balanced demand and supply, no mining)sustainability (cost recovery)
sustainability (stability of population, stability of demand, willingnessto "pay")
• eemwmic sustainability (sustaining economic development or welfare andproduction)

sustainability (capacity to plan, manage and operate the system)• environmental sustainability (no long-term negative or irreversible effects)
Fig. 1.2 (from Koudstaal, Rijsberman and Savenije, 1991) shows a schematicrepresentation of the concept of integrated water resources management for sustainabledevelopment. The core of sustainable water resources management is the balance betweensupply and demand of water related goods and services. The Water Resources System(WRS), which consists of the water resources, the water infrastructure (both natural andmanmade) and the administrative infrastructure (institutional framework), supplies goodsand services to the Water Users (WU), which are all activities in society that use water,whether consumptive or not. The WRS only supplies water to the WU on the basis ofexplicit demands, often expressed in a willingness to pay, not on the basis of forecasts orsome vague ideas. A direct and explicit interest from the WU is a condition to guaranteethe sustainability of the supply, both in terms of quality and quantity.
In the interaction between WRS and WU, Water Resources Development activities takeplace. These activities have impacts on both the state of the Environment (E) and the stateof the Socio-Economic Development (SED) of the planning unit (river basin, region orstate). On the other hand, developments are only possible if the state of the environment(E) and the state of the socio-economic development (SED) has sufficient e*»ying capacityto sustain these developments; these carrying capacities are indicated by the dashed arrows.The double sets of arrows both with regard to impact and capacity and with supply anddemand should guarantee the sustainability of the activities. Koudstaal et al. (1992) callthis a "bottom-up" approach, as opposed to the traditional "impact oriented" approach. Aninteresting literature review on carrying capacity based water resources management wasmade by Kern (1994).
The water resources manager interferes with the system through two types of actions:SMflfi&y oriented measures, such as building infrastructure, drilling boreholes, or buildingdams, and through deaaand Oriented measures to influence demand. The water resourcesmanager is prompted to take actions by triggers from society: from the state of the SEDor from the state of the E. In this way the cycle is closed.
In the past, most of the attention of water managers has been dedicated to supply, the maintask being to match the ever increasing demand projections with options for water supply.As a result, in many parts of the world, the most attractive alternatives for thedevelopment of water resources infrastructure have already been implemented and in manyplaces it is hard to think of feasible alternatives for a further increase of the supply. Whenput against the sharp increase in water demand, which is occurring and expected toincrease even more during the coming decades, the problem of water shortage takesdramatic proportions. In short, a further growth of demand is no longer sustainable andincreases the problems to be solved by future generations.
As a consequence, leading water resources managers btfftRVtt̂ ftlMt further developmentshould be based oa the principle that water is finite, and consequently that the attentionshould be shifted from m%pp)jn the supply to infUwmc***tim demand (see Section 4.3).
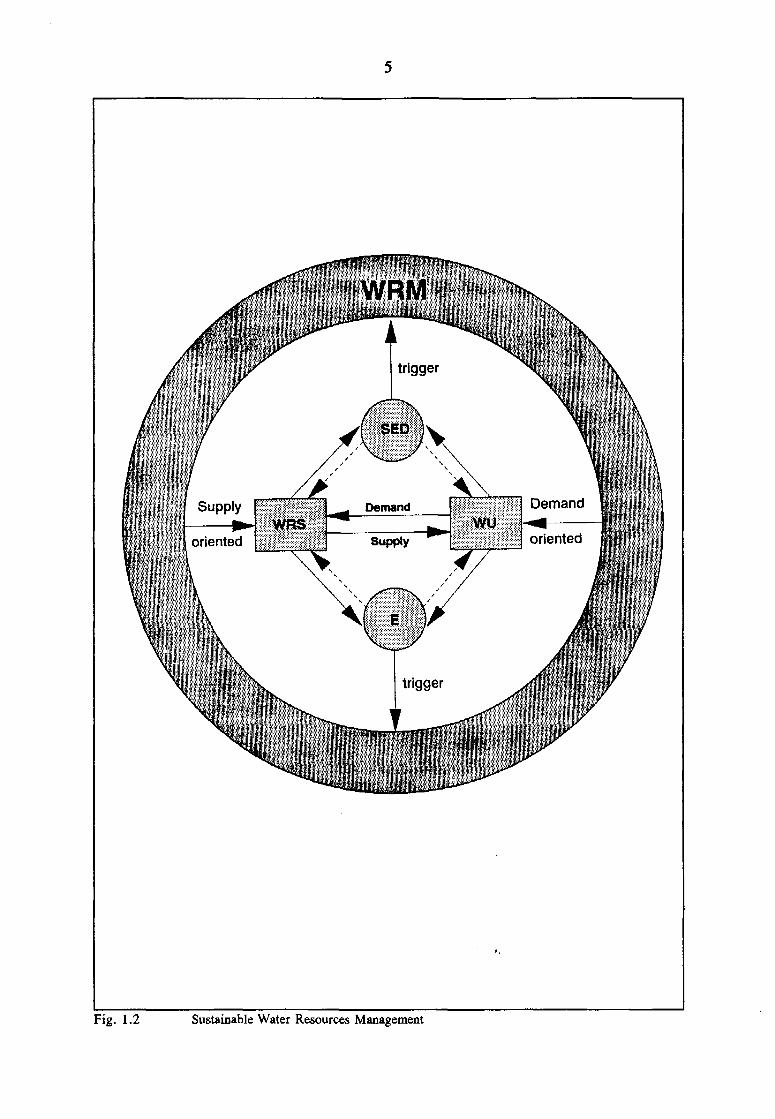
Fig. 1.2 Sustainable Water Resources Management

WATER SECTOR CAPACITY BUILDING
Capacity building in water resources management is required to guarantee institutionalsustainability; it is defined as:
Water Sector Capacity Building: Activities involving the development ofinstitutions needed for sustainable water resources utilization, (including theestablishment of sound management systems and incentive structures, and humanresources development), as well as favourable policy environments with respect toall actors involved.
Water Sector Capacity Building has been introduced at the UNDP/IHE Symposium on "Astrategy for Water Sector Capacity Building" (Alaerts et al., 1991). At the TechnicalConsultation on Integrated Rural Water Management (FAO, 1993), capacity building wassaid to consist of:
• the creation of an eiwbling environment with appropriate policy and legalframeworks; policy issues to be addressed include a focus on sustainabledevelopment, pricing of water as an economic good (see Section 1.2), andthe principle of cost recovery;
• institutional development, preferably building on existing institutions;institutional development includes national, local, quasi-governmental, publicand private institutions, and community participation;
• human resources development and strengthening of managerial systems at alllevels.
Key actors in capacity building include government at various levels, external supportagencies (ESAs), education and training institutes, professional associations, national andinternational corporations, consulting firms and individuals.
1.2. Strategic Issues in Water Resources Management
In this Section, the present issues in water resources management are briefly introduced.These issues have been discussed in international meetings at New Delhi (UNDP, 1990),Delft (Alaerts et al., 1991), Dublin (ICWE, 1992), Rio de Janeiro (UNCED, 1992), Paris(UNESCO/WMO/ICSU, 1993), Rome (FAO, 1993), Delft (IHE, 1993), Cairo (ICPD,1994) and in the Water Resources Management Policy Paper of the World Bank (WorldBank, 1993).
Since the appearance of the Brundtland report "Our Common Future" (WCED, 1987),sustainable development has been embraced by planners as the leading philosophy thatwould on the one hand allow the world to develop its resources and on the other handpreserve unrenewable and finite resources and guarantee adequate living conditions forfuture generations.
Water resources managers are convinced that if ever the theory of attainable developmentcan be put into practice, that tht?«te of water in this*|iiiW»w crucial. Although this wasa clear implicit conclusion of the Dublin (1992) Conference on Water and theEnvironment, water did not receive the attention it deserved at the UNCED (1993)

conference in Rio de Janeiro. It was President Mitterrand of France who made theobservation that water is the key to sustainable development and that it did not receive theprominent place it deserved in Agenda 21.
In fact, most of theWorld's attention at theRio conference focusedon more general issuessuch as biodiversityand the greenhousee f f e c t ( c l i m a t echange), both of whichare very important butnot very tangible.Scientists are not yetcompletely sure whichprocesses govern andthreaten biodiversityand climate change.But we know that theactivities of Man areimportant in the reduction of biodiversity, in climate change, and - more in general - inexceeding the carrying capacity of the environment. Man's activities are to a large extentdependent on the availability of water and hence water management can and should beinstrumental in guiding human activities for sustainable development
KEEDiwrPROTECT Ut PROW
kit.summing how little attention is paid |q nwirtr on the international agenda. If onerealizes how controversial and still poorly defined the problems of biodiversity and thegreenhouse effect are as compared to the water issue, and how important water is inguiding Man's activities, than it is surprising that Itoere still is no Water Convention,whereas conventions for biodiversity and control of the greenhouse effect have beensigned.
In general the awareness of peepie and of politicians for water issues is small. Except inthose parts of the world where water shortage is strongly felt in day to day life, peopleappear to take water for granted and don't seem to be aware that the limits of waterresources development are within reach. And if awareness is low with the people, thanawareness is low with the politicians. U is important that ways be sought to raiseawarenessjhrQugh education, ttaMtfgk cx>mmtwtcati0i& and through enhanced participationof peoplein water Msomrces de
Fortunately this situation is changing. The World Bank is advertising the viewpoint thata global water crisis is looming and that many of the future national and internationalconflicts will concentrate around water as the most emotive issue, even to bypass landissues. In fact, modern historians believe that conflicts such as in Rwanda and Bosnia, areresource conflicts rather than ethnic conflicts which find their origin in sharing scarce landand water resources. Ecologists tend to agree. Brown (1995), in the State of the World1995, states: "Rwanda is a tragic example of a war as a result of ecological stress"
8
The sharing of international water resources is a possible source of conflict betweenriparian countries. Worldwide, there are 215 international river basins, constituting 47%of the total area (Gleick, 1993). In Africa, South America and Asia this percentage ishigher (more than 60%) probably as a result of colonial divisions. In several regions ofthe developing world, water is one of the main reasons for, or even the root of,international conflicts. Particularly where water resources are a limiting factor fordevelopment, conflicts are likely to arise. In future, under the influence of populationgrowth and economic growth, these conflicts are to become more numerous and probablymore violent, if no adequate action is taken. International rules on the use of water ofinternational rivers have been developed long ago: the Helsinki Rules (ILA, 1966) and alaw is under preparation (UN, 1991), but this issue warrants more attention byinternational organisations and ESAs alike.
Whether or not we shall succeed in reaching sustainable levels of development shalldepend, to a large extent, on two factors that are out of the reach of water resourcesmanagement: population growth and economic growth. From the viewpoint ofsustainability, the world population should stabilize and overall economic growth can notbe more than moderate, based on the availability of renewable resources. Although indeveloping countries, in general, there still is ample scope for development and foreconomic growth, in the industrialized world there are strong indications that thesustainable level of development has already been exceeded. The consequence of this isthat in the developed countries one should look for ways to fonnulate and implement zero-growth scenarios. In developing countries it is essential that the population be kept inbalance with the environmental carrying capacity, which, in most cases, implies strictlimitations on population growth.
In Cairo, at the International Conference on Population and Development, important issueswere addressed with regard to population control. A very important conclusion of theconference was that the responsibility of how many children a family should have lies withthe parents and primarily the women. The conference concluded that, in order to do so,women should have access to reproductive health care and should be empowered to takeadequate decisions on the health and prosperity of their own family. An importantrecommendation of Cairo was that women, particularly girls and young women, shouldhave access to schooling and education. The general feeling was that educated andempowered women will generally take the decisions which are best for their family, fora sustainable future and, hence, for society.
Consequently, the way in which population growth can be influenced by natural resourcesmanagers is through facilitating etSHtfon and access to rflpMMStve health ' l i r e forwomen. Such measures should be part of national strategies for natural resourcesmanagement. Moreover one can say that where adequate living conditions are present(adequate water supply, sanitation, health care and education, and sound socio-economicperspectives), people are more likely to consider family planning then in situations wherethese conditions are lacking.
Although Cairo has opened new approaches to limitation of population growth, thequestion of limiting economic growth in overdeveloped countries remains unaddressed.Unfortunately, both population growth and economic growth are generally consideredexogenous scenarios to water resources management.

most important activities that have to be deployed during the coming years isanagement. In the past, the attention of water resources management mainly
focused on supply management: making sure that enough water is made available for thedifferent users, without taking into consideration whether the (often exponential) growthof the demand could continue indefinitely. Since the Dublin Conference, water managersagree that we should actively search for ways to implement demand management througheconomic, administrative and legal implementation incentives.
Since Delft (Alaerts et al., 1991) and Dublin (ICWE, 1992), the integrated, also calledholistic, approach to water resources management has been accepted as a guiding principle.Integrated water resources management implies integration in terms of:
the different physical aspects of the water resources (surface water, groundwater,water quality)its jfttejal,variation (upstream, downstream) resulting in a river basin approachthe dUfiwant interests of water users and economic sectorsthe i«rtitati©ftal frameworkthe complete set of uaipiWtf objectives and constraints
Particularly the latter three non-technical elements require an institutional set-up thatallows adequate iatastctetw) ttnkages. These linkages should not merely exist at the toplevel. Since Dublin it has been accepted that decision making should be dgpftfratized untilthe | p p g appropriate level, meaning that only those decisions are taken at the top levelthat can not be solved at lower institutional levels. It is presently believed that intersectorallinkages should be mainly built on existing institutions and that the creation of newgovernmental bodies should be avoided where possible.
In the Delft Symposium on Water Sector Capacity Building in 1991, institutional issuesof water resources management were discussed. Water Sector Capacity Building iscreating the enabling environment for implementing integrated water resourcesmanagement (including the policy and legal framework, the institutional framework andthe human resources). It was agreed that present day knowledge has gone far inunderstanding most of the water related problems that we are facing, and that we knowalong which lines solutions can be found. What we lack in the developing countries is thecapacity to carry out appropriate research, to gather adequate information, to implementmeasures, to operate water resources systems and to supply adequate services.
It has been expressed in Vine , at the Technical Consultation on Integrated Rural WaterManagement in 1 0 3 , that there appears to be a JlM* »**d for the exchange ofqNVNtfMMts and knowledge between countries and particularly among developingcountries. Not only is the transfer of knowledge from industrialized countries to thedeveloping world important and are financial means for transfer insufficiently available,there is an even larger demand for setting up facilities for developing countries toexchange problems, experiences, solutions, research results and education in a regionalcontext. In Delft, at the Conference on Water and the Environment, Key to Africa'sDevelopment, in 1993, this point was strongly emphasized by African participants. Inaddition the lack of career opportunities, the occurrence of brain drain and the lack of anAfrican knowledge base are considered major constraints for development. It was observedthat it is disturbing to realize that most of the knowledge about Africa is concentrated inWestern institutes and universities, and that no regional centre of excellence in Africaexists that could assist in policy development.

10
As a result of ever more powerful computing facilities, it has been possible to show thatthe relation between land use and climate, at a regional scale, is significant. Studies inthe Amazonas (Lettau e.a., 1979) and in the Sahel (Savenije & Hall, 1993; Savenije, 1995,1996) have shown that the relation between rainfall and vegetation cover is strong and thatthe further one travels inland, tbeaaore important the recycling of moisture becomes. Thisaspect forms a direct and important feedback mechanism between rainfall and humanactivities, such as deforestation, firewood collection, forest clearing, land use, overgrazingand other agricultural practices such as shifting cultivation and irrigation. It also meansthat once the relations have been established, the direct benefits, both economic andenvironmental, of remedial actions to restore the climate through the restoration ofvegetation can be determined on the basis of physical relations.
Finally there is an eaonnous need for reliable and adequate nij»nW"mntThe recent WB/UNDP Hydrological Assessment of Sub-Saharan Africa has shown that~theobservation and monitoring networks in Africa are in a miserable situation. But also inother parts of the developing world, data collection has received low priority in view ofthe huge economic and social problems that developing countries are facing. However, nosound and integrated water management is possible without adequate information, both onwater resources and water use. Fortunately, the technical instruments that have comeavailable in recent years, such as: powerful computers, sophisticated software, remotesensing facilities, telemetry systems, etc., have widened the scope of water managerssubstantially. The time that data collection was considered as an objective in itself has past.Presently, the requirements of models that describe our natural system determine the needfor information. Networks should be designed and operated on the basis of physicallybased models in a way that minimizes the discrepancy with the real world in the mostefficient way.
1.3. Activities involved in WRM
The management of the development of water resources is a complex activity. It comprisesthe full range of activities in the development of water resources, from demand analysisthrough planning, design and construction to operation and monitoring. In a sense, theseactivities are sequential: analysis comes before planning, and planning comes beforedesign; but more importantly, there are numerous places in the process where back-loopsand feed-backs occur, where new information urges new views and new decisions have tobe taken. Water Resources Management (WRM) is a highly dynamic process, covering awide spectrum of activities in the fields of assessment, planning and operation. Some ofthese are listed below:
Assessment:water resources assessmentenvironmental assessment
Planning:problem analysisactivity analysisdemand analysisformulation of objectives and constraintsdemand forecastingdesign of alternative water resource systems

11
system analysissystem simulation and optimizationsensitivity analysismulticriteria and multiconstraints trade-off analysisselection and decision makinginvolvement of stakeholderscommunication, negotiation and conflict resolution
Operation:allocation of resourcesdemand managementmanagement and administration of water institutionsoperation and maintenancemonitoring and evaluationfinancial management and performance auditing
The activities are highly multidisciplinary, involving, engineers in the area of hydrology,hydraulics, construction, water supply, sanitation, hydropower, irrigation, and non-engineers such as: environmentalists, ecologists, lawyers, economists, sociologists,agriculturists, politicians and representatives of interested parties, pressure groups, andwater users.
In this list, the activities are not yet structured, they are a mere enumeration of activitiesinvolved in planning and management. In the lecture Framework for Analysis, alriagtealImpwork is presented identifying the relations between the planning activities and thesteps to be followed in a planning cycle.
In our definition, WRM includes WRP. The expression: water resources planning andmanagement is identical to water resources management. However, there is good reasonto consider WRP as a separate activity within WRM. Many of the complexities of WRMare related to the planning of the development of the resources. Techniques to cope withuncertainty, to compare alternatives for development and select the most promisingalternative, which may be considered the major challenges of WRM, lie in the field ofplanning. WRP is a permanent activity, not only on a national or regional scale, but at thescale of any complex water resources system. Such a system is never completed in thesense that no further development is possible or necessary. The planned system isimplemented in stages, each stage lasting sometimes several years, and the changingtechnology, demand, political and socio-economical conditions require a permanentreadjustment of the existing system and an adjustment of the planned development. Theplanning of water resources development, thus, has a sufficiently large domain forengineers to exclusively specialize in. However, as a result of the many moments ofdecision making which occur during the planning process, there is a close interaction withmanagement. Consequently the activity is and should be fully integrated in WRM.
In the past, there was a strong bias in WRP to optimization. This was so strong, that tosome people, WRP was almost identical to optimization (linear programming, dynamicprogramming, etc). Nowadays, it is widely recognised that optimization techniques servea limited purpose. The reason for this lies in two key elements of planning, which togetherare largely responsible for the complexity of WRP:
12
• uncertainty of scenarios• conflict of interests• political reality.
If there were no uncertainty and conflict of interest, the planning of water resources wouldindeed be a simple optimization problem. In addition, the political reality of the momentdoes not always permit the implementation of "optimal" solutions. The final decision isgenerally a result of the balance of power. Optimization is only useful as a component ofWRP where boundary conditions can be considered as fixed.
1.4. Coping with uncertainty
Uncertainty exists in almost all scenarios that form the boundary conditions for planning:
• hydrologic scenarios: occurrence of droughts, floods disasters; within the fullspectrum of uncertainty probably the most simple scenario to forecast with areasonable accuracy;
• financial and economic scenarios: the development of commodity prices, energyprices, exchange rates, or inflation;
• socio-economic scenarios: population growth, level of consumption, unemploymentrates, willingness to pay, mentality, acceptability of measures, attention of thepublic for water issues;
• political scenarios: changes in government, changes in political system, outbreakof wars, policy changes, e.g. towards small scale versus large scale, the questionof whether the emphasis will lie on guaranteeing some of the water for all, or mostof the water for some, privatized or subsidized water, development of bilateralrelations between riparian countries which share a river basin;
• technological scenarios: the capacity to develop resources for a certain price willchange as a function of the technology available.
Some of these scenarios are highly unpredictable and depend on global developments suchas energy prices, international conflicts, economic recession, etc. A plan which has beenshown to be "optimal" in relation to a certain combination of the above scenarios mayprove the "worst" scenario under another combination of scenarios.
This could easily lead to the cynical conclusion that the only thing sure about a plan is thatit will not come true. However, there are ways to cope with uncertainty; and some of thetechniques involved are briefly discussed below.
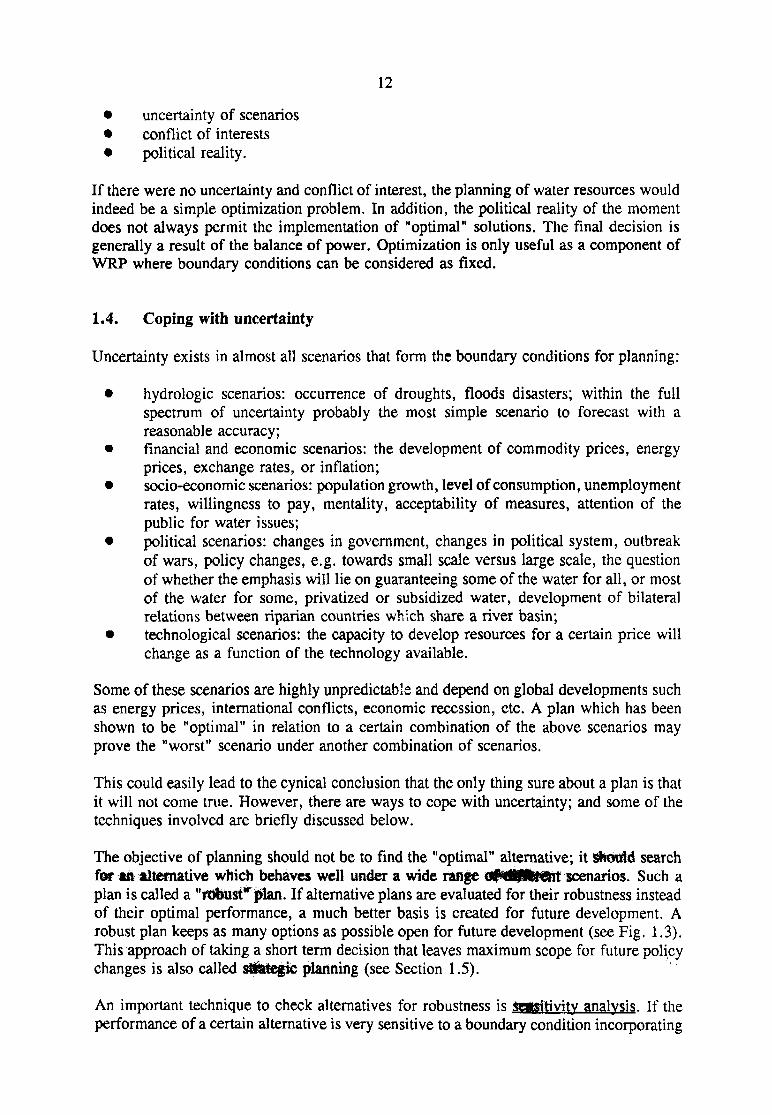
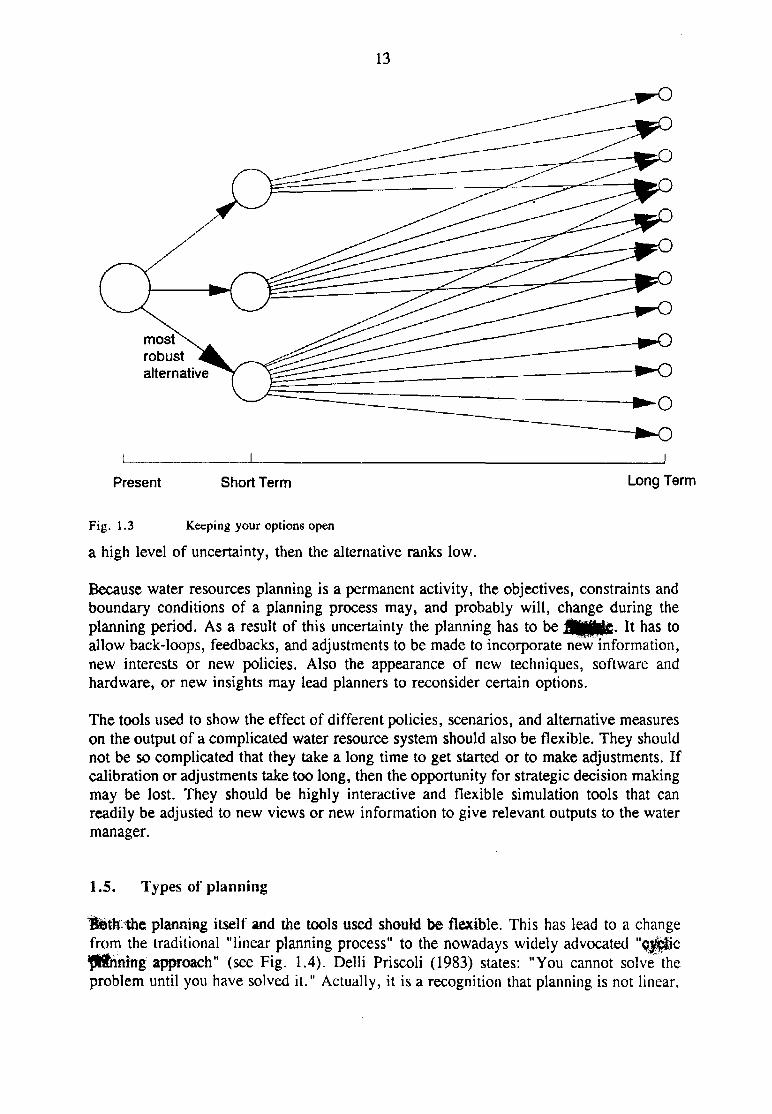
The objective of planning should not be to find the "optimal" alternative; it should searchfor an alternative which behaves well under a wide range 0#<IHIU€iU scenarios. Such aplan is called a "«Jt»ist*|ilan. If alternative plans are evaluated for their robustness insteadof their optimal performance, a much better basis is created for future development. Arobust plan keeps as many options as possible open for future development (see Fig. 1.3).This approach of taking a short term decision that leaves maximum scope for future policychanges is also called sfi&tegie planning (see Section 1.5).
An important technique to check alternatives for robustness is SCTBitivity analysis. If theperformance of a certain alternative is very sensitive to a boundary condition incorporating
13
mostrobustalternative
L J_
Present Short Term Long Term
Fig. 1.3 Keeping your options open
a high level of uncertainty, then the alternative ranks low.
Because water resources planning is a permanent activity, the objectives, constraints andboundary conditions of a planning process may, and probably will, change during theplanning period. As a result of this uncertainty the planning has to be JHH$£. ^ n a s t 0
allow back-loops, feedbacks, and adjustments to be made to incorporate new information,new interests or new policies. Also the appearance of new techniques, software andhardware, or new insights may lead planners to reconsider certain options.
The tools used to show the effect of different policies, scenarios, and alternative measureson the output of a complicated water resource system should also be flexible. They shouldnot be so complicated that they take a long time to get started or to make adjustments. Ifcalibration or adjustments take too long, then the opportunity for strategic decision makingmay be lost. They should be highly interactive and flexible simulation tools that canreadily be adjusted to new views or new information to give relevant outputs to the watermanager.
1.5. Types of planning
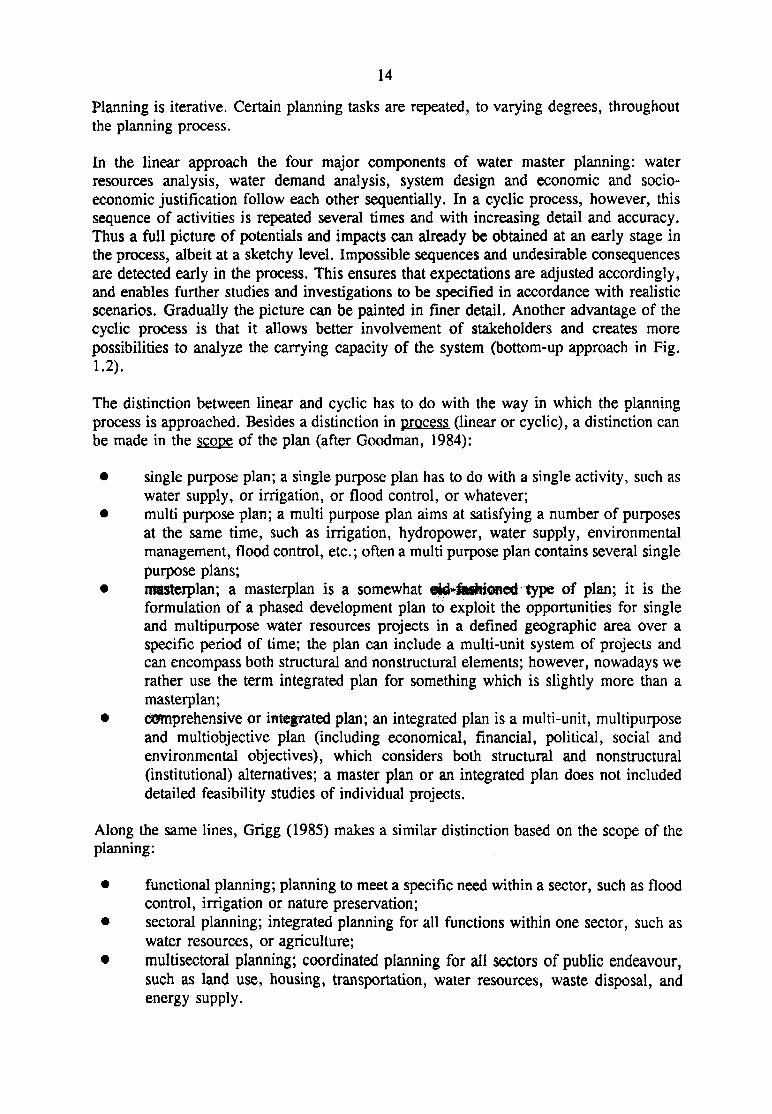
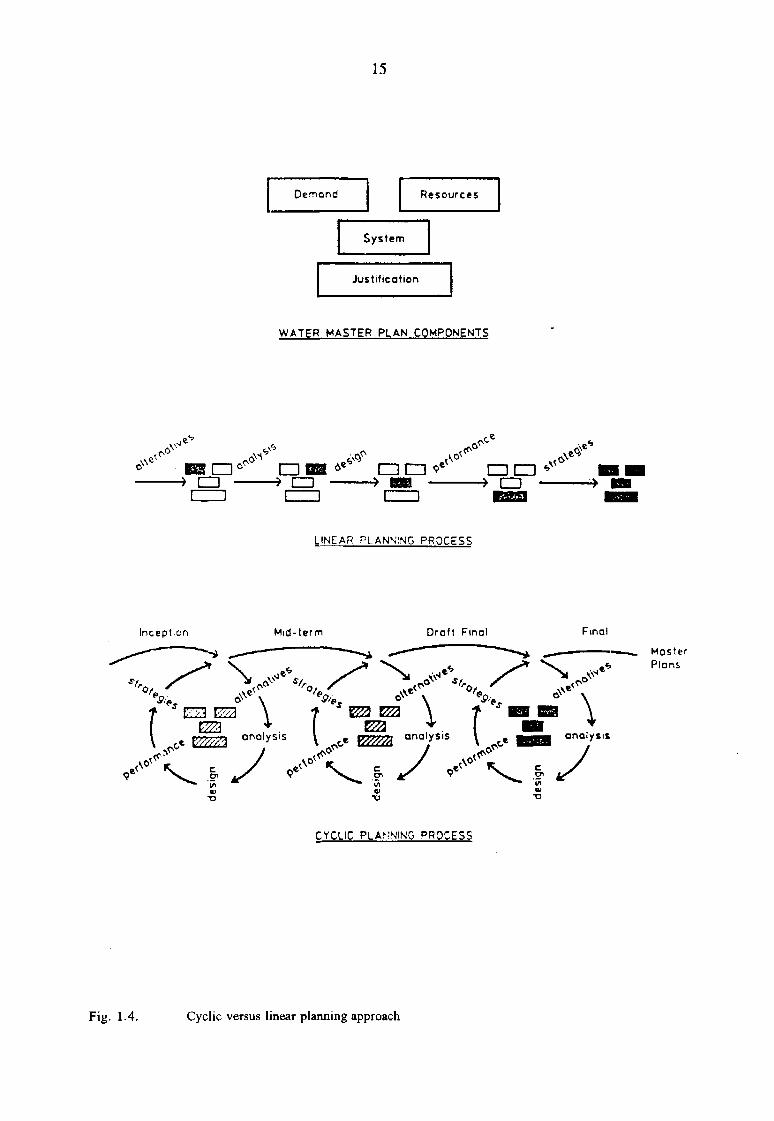
planning itself and the tools used should be flexible. This has lead to a changefrom the traditional "linear planning process" to the nowadays widely advocated "cjpicfUnning approach" (see Fig. 1.4). Delli Priscoli (1983) states: "You cannot solve theproblem until you have solved it." Actually, it is a recognition that planning is not linear.
14
Planning is iterative. Certain planning tasks are repeated, to varying degrees, throughoutthe planning process.
In the linear approach the four major components of water master planning: waterresources analysis, water demand analysis, system design and economic and socio-economic justification follow each other sequentially. In a cyclic process, however, thissequence of activities is repeated several times and with increasing detail and accuracy.Thus a full picture of potentials and impacts can already be obtained at an early stage inthe process, albeit at a sketchy level. Impossible sequences and undesirable consequencesare detected early in the process. This ensures that expectations are adjusted accordingly,and enables further studies and investigations to be specified in accordance with realisticscenarios. Gradually the picture can be painted in finer detail. Another advantage of thecyclic process is that it allows better involvement of stakeholders and creates morepossibilities to analyze the carrying capacity of the system (bottom-up approach in Fig.1.2).
The distinction between linear and cyclic has to do with the way in which the planningprocess is approached. Besides a distinction in process (linear or cyclic), a distinction canbe made in the scope of the plan (after Goodman, 1984):
• single purpose plan; a single purpose plan has to do with a single activity, such aswater supply, or irrigation, or flood control, or whatever;
• multi purpose plan; a multi purpose plan aims at satisfying a number of purposesat the same time, such as irrigation, hydropower, water supply, environmentalmanagement, flood control, etc.; often a multi purpose plan contains several singlepurpose plans;
• misterplan; a masterplan is a somewhat eto f̂ctthiofled type of plan; it is theformulation of a phased development plan to exploit the opportunities for singleand multipurpose water resources projects in a defined geographic area over aspecific period of time; the plan can include a multi-unit system of projects andcan encompass both structural and nonstructural elements; however, nowadays werather use the term integrated plan for something which is slightly more than amasterplan;
• comprehensive or integrated plan; an integrated plan is a multi-unit, multipurposeand multiobjective plan (including economical, financial, political, social andenvironmental objectives), which considers both structural and nonstructural(institutional) alternatives; a master plan or an integrated plan does not includeddetailed feasibility studies of individual projects.
Along the same lines, Grigg (1985) makes a similar distinction based on the scope of theplanning:
• functional planning; planning to meet a specific need within a sector, such as floodcontrol, irrigation or nature preservation;
• sectoral planning; integrated planning for all functions within one sector, such aswater resources, or agriculture;
• multisectoral planning; coordinated planning for all sectors of public endeavour,such as land use, housing, transportation, water resources, waste disposal, andenergy supply.
15
Demand Resources
System
Justification
WATER MASTER PLAN COMPONENTS
Ban* LTD
in maC D •
Atf
Inception
LINEAR PLANNING PROCESS
Mid-term Droft Final Final
CYCLIC PLANNING PROCESS
Fig. 1.4. Cyclic versus linear planning approach

16
Another distinction often encountered has to do with the areal extent such as:
• national plan; a national water resources plan is made to determine the nationalpriorities for the allocation of scarce water resources in view of the nationalobjectives and constraints; in this respect a national water plan should be anintegrated plan;
• regional plan; at regional level a similar exercise can be done, depending on thesize of the country; a regional plan, in principle, does not differ from a nationalplan;
• river basin plan; a river basin plan is particular because it uses the hydrologicalboundaries as the planning limits; in principle it is should be a multi-unit,multipurpose and multiobjective plan, and hence an integrated plan.
In addition there is a distinction that can be made as regards the time frame of the plan:
• short term planning; short term planning has the advantage that the uncertainty inthe scenarios that form the boundary conditions to planning is small; thedisadvantage is that a short term plan may lack a vision on future developments;
• long term planning; a long term plan tries to set out a long term perspective andguidelines for the future development of a nation, region or river basin; it has thelarge disadvantage of urtMrtainty; a*-# eansejpieace, short term planning isbaeemiBg gradually more important than long term planning; the long termplanning is thereby reduced to a long term policy (also called tactical planning),in which the short term plan should leave open a wide range of options that maylead to the ultimate goal;
• such an "open ended approach" is also called "atptosic planning"; strategicplanning tries to be a combination of the two; it concentrates on the short term ina way that an as wide as possible range of future options remains open (see Fig.1.3); a plan that foregoes future options and that excludes future developmentoptions is not strategic, not flexible and not robust;
• «5tftng (revolving or continuous) fUmung; the consequence of the strategicplanning approach is that a plan needs continuous updating and continuousadjustment to ever changing circumstances; such a type of planning is calledcontinuous or rolling planning.
It may be clear that strategic and rolling planning lays a heavy claim on the flexibility ofthe planning tools used in the process. The database and the software used (the WaterResources Information System WRIS) needs continuous updating to adjust to ever changingconditions. It is the challenge of the modern water resources planner to develop and usethese flexible tools.
1.6. Involvement of stakeholders
Where resources are scarce, conflicts of interest arise, which are generally politicallycharged. Changes in the political boundary conditions may change the planning of waterprojects substantially, especially if the interests of the new group in power had beendisregarded before the political transformation.
17
For a water resource system to function, whether at a local, a river basin, or a nationalscale, it is necessary that all parties involved are committed to make the system work. Thisis only possible if they are involved in the planning, design, construction and operation ofthe system, and if they are convinced that it is in their own interest. The "optimal" planis the plan which stakeholders accepted as the optimal plan. The only plan that willactually work is a plan based on heavy involvement of the relevant stakeholders, leadingto a compromise, or possibly consensus, on design and implementation.
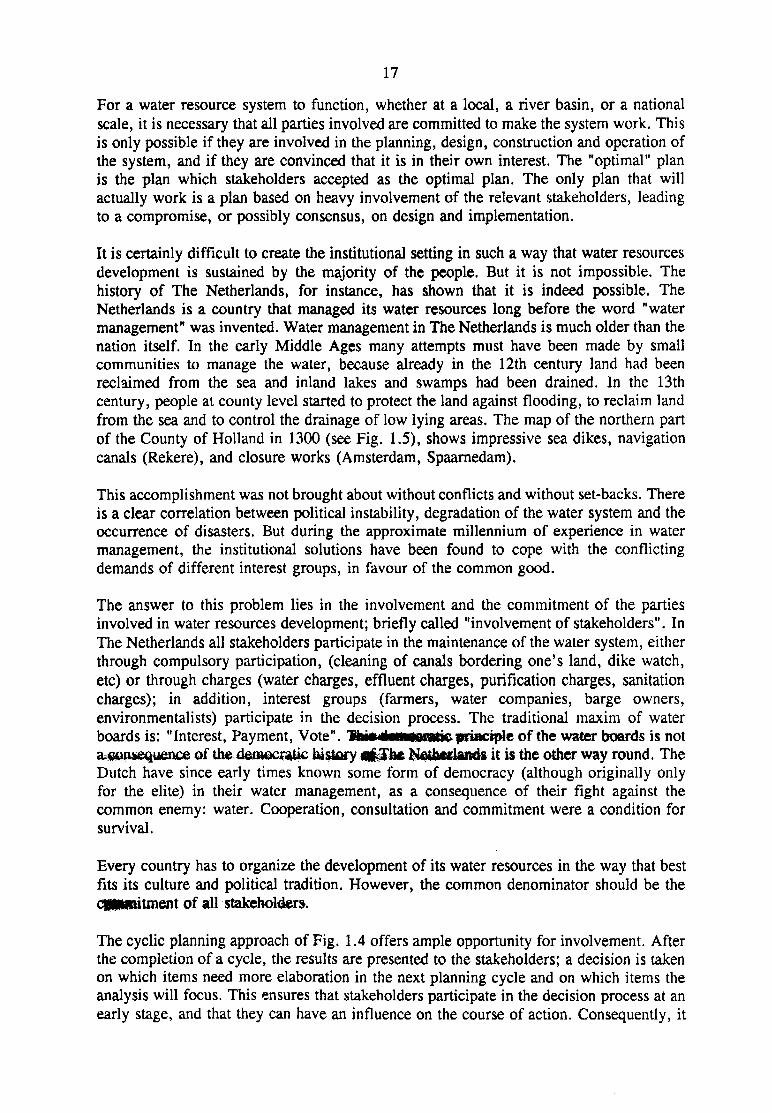
It is certainly difficult to create the institutional setting in such a way that water resourcesdevelopment is sustained by the majority of the people. But it is not impossible. Thehistory of The Netherlands, for instance, has shown that it is indeed possible. TheNetherlands is a country that managed its water resources long before the word "watermanagement" was invented. Water management in The Netherlands is much older than thenation itself. In the early Middle Ages many attempts must have been made by smallcommunities to manage the water, because already in the 12th century land had beenreclaimed from the sea and inland lakes and swamps had been drained. In the 13thcentury, people at county level started to protect the land against flooding, to reclaim landfrom the sea and to control the drainage of low lying areas. The map of the northern partof the County of Holland in 1300 (see Fig. 1.5), shows impressive sea dikes, navigationcanals (Rekere), and closure works (Amsterdam, Spaarnedam).
This accomplishment was not brought about without conflicts and without set-backs. Thereis a clear correlation between political instability, degradation of the water system and theoccurrence of disasters. But during the approximate millennium of experience in watermanagement, the institutional solutions have been found to cope with the conflictingdemands of different interest groups, in favour of the common good.
The answer to this problem lies in the involvement and the commitment of the partiesinvolved in water resources development; briefly called "involvement of stakeholders". InThe Netherlands all stakeholders participate in the maintenance of the water system, eitherthrough compulsory participation, (cleaning of canals bordering one's land, dike watch,etc) or through charges (water charges, effluent charges, purification charges, sanitationcharges); in addition, interest groups (farmers, water companies, barge owners,environmentalists) participate in the decision process. The traditional maxim of waterboards is: "Interest, Payment, Vote". Thiilimnaaraticprinciple of the water boards is nota consequence of the dewocriitic history fltJhe Nstkeriands it is the other way round. TheDutch have since early times known some form of democracy (although originally onlyfor the elite) in their water management, as a consequence of their fight against thecommon enemy: water. Cooperation, consultation and commitment were a condition forsurvival.
Every country has to organize the development of its water resources in the way that bestfits its culture and political tradition. However, the common denominator should be thecmwoiUnent of all stakeholders.
The cyclic planning approach of Fig. 1.4 offers ample opportunity for involvement. Afterthe completion of a cycle, the results are presented to the stakeholders; a decision is takenon which items need more elaboration in the next planning cycle and on which items theanalysis will focus. This ensures that stakeholders participate in the decision process at anearly stage, and that they can have an influence on the course of action. Consequently, it

18
Fig. 1.5 State of hydraulic works in North Holland in 1300 and in 1990

19
creates the basis for commitment.
In short, it can be stated that in order to be really effective, water resources managementshould have two characteristics:
* JfcgMM&ty in approach and in planning toolsof stakeholders to achieve commitment
1.7. People's Participation
Many water resources management projects, although technically and economicallysuccessful have enlarged inequality and failed to reach and benefit the poor, and mostimportantly failed to be sustainable in the long term due to lack of maintenance and properoperation.
Some of the main suspected reasons for this are (Mirghani and Savenije, 1995):
• People don't see the benefits. Social impacts and the distribution of benefits werenot taken into account sufficiently when projects were first proposed. Effortsmainly concentrated on finding a solution to an existing natural problem, such as,for instance, flooding. Possible negative impacts of a flood protection project are:loss of access of the poor to resources (landownership changes), effects of landacquisition (e.g., loss of homestead or fertile land), or decreased fishing potential.Such social and socio-economic changes and loss of access to productive resourcescould reverse the intended project output leaving the poor majority in a worsesituation. Such a situation is a real failure for any development intervention. Whenpeople do not really feel the benefits of development, and moreover if the projectaffects their lives negatively, technical and economical success are of no value.
• People have no incentive for opera|jpp. Intended beneficiaries of the project oftenhave no incentive to maintain the project, since they were not committed to theproject ideas from the beginning; nor were they committed to bearing theresponsibility of the development. Moreover, the organisation responsible foroperation and maintenance often does not have the financial and physical resourcesto run the project efficiently.
But are these reasons for project failure or symptoms of an unsustainable planningmethodology? People's Participation <#»P) in project planning and implementation isgenerally believed to be an important prerequisite to overcome these problems and to makepeople responsible for the operation and maintenance of the project (ICWE, 1992).Through PP in project identification and preparation (data collection, selection andfeasibility assessment), those issues which control the success of the project can beidentified and dealt with in the project plan.
When PP is applied to rural water resources projects, the initial emphasis should be onstakeholders' participation. This participation should not be limited to the implementationactivities and the sharing of benefits, but should be considered at the very start of theproject during problem identification and analysis. People's participation is an importantelement in socio-economic development and integrated water resources management. Aproject is only sustainable if it has the support of a broad base of stakeholders, thereby*

20
opening up the possibilities both to strengthen local institutions and people's organisationsand to develop self-reliance and confidence. For further reading Mirghani and Savenije(1995) is recommended.
21
2. HUMAN INTERFERENCES IN THE WATER RESOURCE SYSTEM
2.1. Man's attitude towards nature and development
Human action has influenced to a very large extent the present state of the environment.The driving force which led to these actions is simply that humans needed to survive andfeed, clothe and house themselves. About the way in which they interfered in theirenvironment, however, it is important to realize what their attitude towards theenvironment was. Did they look upon the environment as something separate from themor did they consider themselves as being an integral part of the environment? This attitudevery much depends on culture and religion.
In the western world, where the exploitation of resources has been most pronounced, bothin Europe and in the parts of the world which were colonized by Europeans, the attitudeof man towards nature has been very much determined by the teachings of the bible. Inthis respect the attitude is not essentially different from the attitude in Muslim religion. InGenesis it is clearly stated that the world, the plants and the animals were created for manto benefit from it. The conviction in European tradition is very strong, both in classical(celtic, roman, greek) and Christian traditions, that human beings have been put in aposition of dominance over nature. Over time, although the culture has changed, thisconviction has remained, until recently (the last few years), when the "green movement"started to convince us that man is as much part of nature as animals, plants and naturalresources. However, the state of deterioration of the environment that we witness in manyparts of the world is the consequence of the philosophy that man dominates over natureand has to fight nature to survive (Ponting, 1991).
Not in all cultures is this conviction as clearly present. Buddhism, for example, considersman as part of nature, and so do several other eastern religions. Also several naturalreligions look upon man as part of nature.
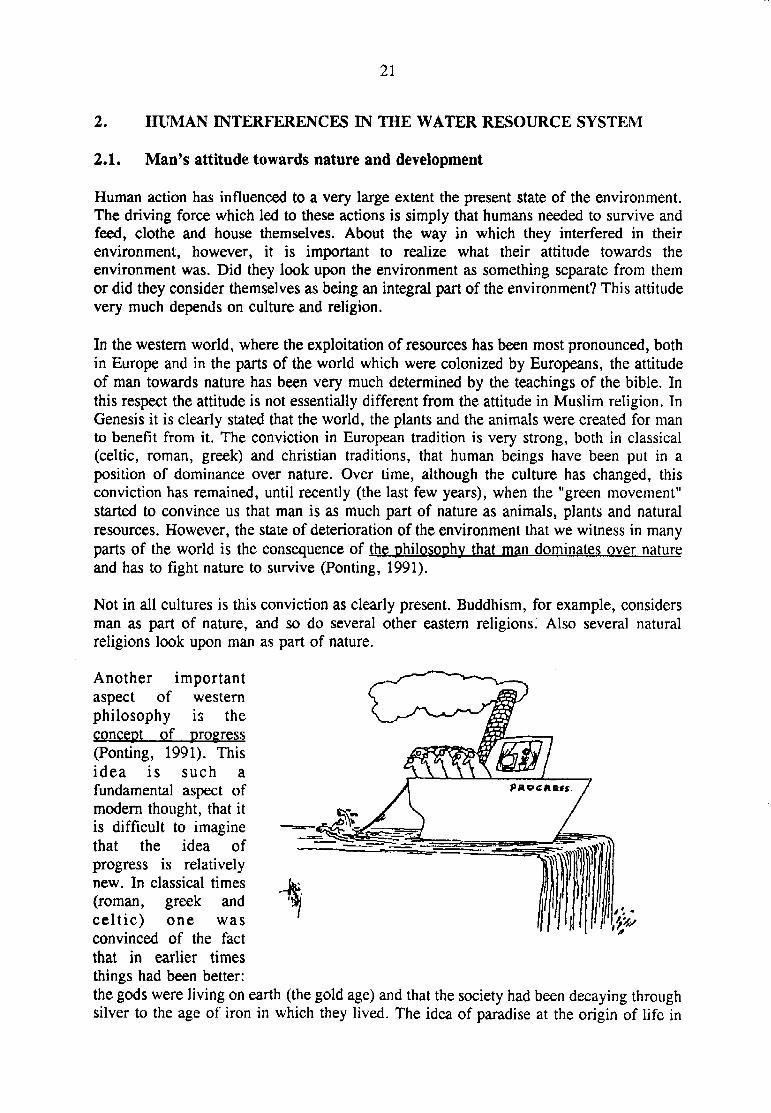
Another importantaspect of westernphilosophy is theconcept of progress(Ponting, 1991). Thisidea is such afundamental aspect ofmodern thought, that itis difficult to imaginethat the idea ofprogress is relativelynew. In classical times(roman, greek andcel t ic) one wasconvinced of the factthat in earlier timesthings had been better:the gods were living on earth (the gold age) and that the society had been decaying throughsilver to the age of iron in which they lived. The idea of paradise at the origin of life in
22
Christian and muslim religion is not much different from that. Also Taoist in China, theCherokee in America and the Christians in medieval (Middle Ages) Europe considered theworld as a world of decline. It is only after the Enlightenment and the Age of Reason inthe 18th century and after the success of physical science and technology (which triggeredthe industrial revolution), that people started thinking of progress and economic growthas a necessity for survival and even as an economic law.
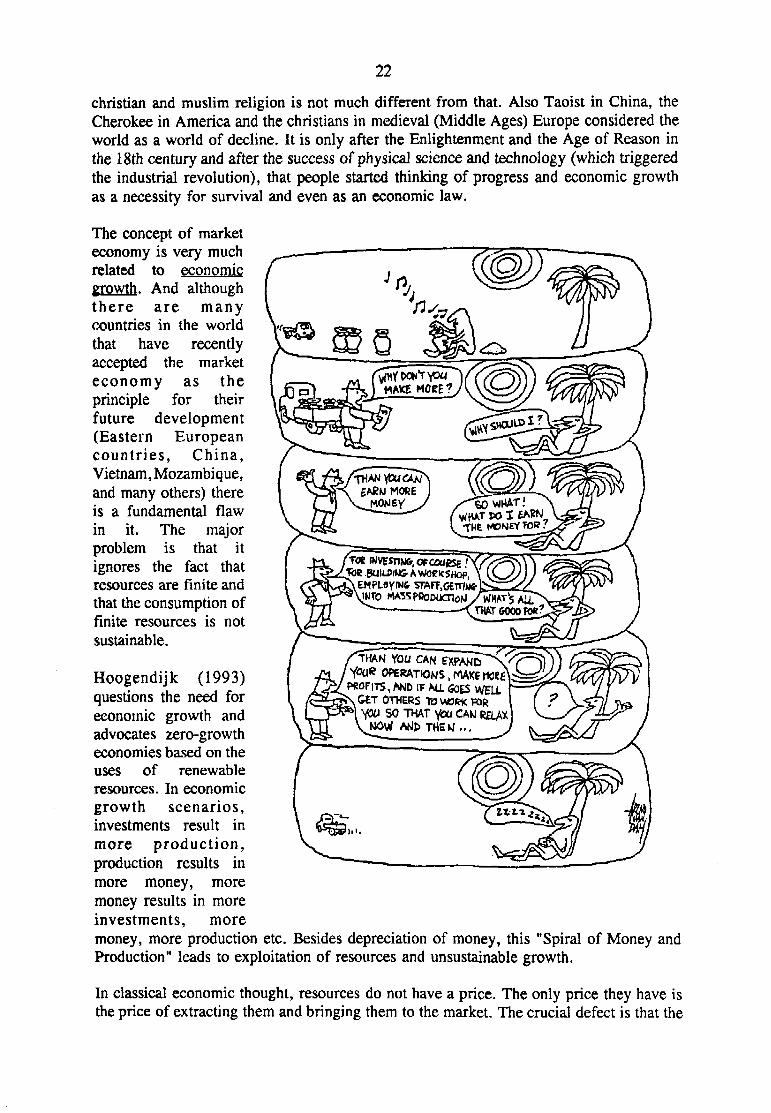
The concept of marketeconomy is very muchrelated to economicgrowth. And althoughthere are manycountries in the worldthat have recentlyaccepted the marketeconomy as theprinciple for theirfuture development(Eastern Europeancountries, China,Vietnam, Mozambique,and many others) thereis a fundamental flawin it. The majorproblem is that itignores the fact thatresources are finite andthat the consumption offinite resources is notsustainable.
Hoogendijk (1993)questions the need foreconomic growth andadvocates zero-growtheconomies based on theuses of renewableresources. In economicgrowth scenarios,investments result inmore production,production results inmore money, moremoney results in moreinvestments, moremoney, more production etc. Besides depreciation of money, this "Spiral of Money andProduction" leads to exploitation of resources and unsustainable growth.
tfny DON'T youMAKE MOEE ?
THAN you a w£AKU MORE
HAT K I EARNTHE MONEY TO* 7
TOR INVESTING; O F C W C S E 'BUILDIM& A WORKSHOP,
THAN YOU CAN fXPANDY<5U<? OPERATIONS , MAKE M0«£
PROFITS, AND IF A l l SOESGET OTHERS TO WORK FOR
SO THAT you CAWNOW AMbTHEW. . .
In classical economic thought, resources do not have a price. The only price they have isthe price of extracting them and bringing them to the market. The crucial defect is that the

23
earth's resources are treated as capital. But since resources are finite, they have a price:the price of withholding them from future generations. In the lectures on PlanningEconomics attention will be paid to this aspect.
This classical economic thinking has lead to a situation where the best way to get rich isby undertaking an environment-unfriendly business and exploitation of resources: trade inindustrial and nuclear waste, drugs-trade, arms-trade, trade in rare species, large scalefisheries, etc. Whenever governments try to limit these actions, they tend to be overtakenby criminal organizations.
Human interferences
Man influences the hydrological cycle in several ways, either to protect himself against thewater, or to try to make use of the water. The next main activities can be distinguished:
flood protection,irrigation,drainage,groundwater withdrawal,water supply,sanitation,flow regulation,power generation,navigation.
Unfortunately there are also a number of unproductive interferences of man, such as:
• discharge of wastes,• discharge of polluted water,• pollution of aquifers,• discharge of cooling water from industrial and thermal plants.
Man tries to control the water resource system through hydraulic structures. Thesestructures are designed taking into consideration the risk of failure acceptable for thespecific case. In the following paragraphs, some of the human interferences will bediscussed briefly.
2.2. Flood protection
In low-lying and deltaic areas, floods occur regularly both from the sea and the river. Thefollowing types of dikes can be distinguished:
sea dikesinland dikesriver dikessubmersible dikescompartmental dikesno dikes
24
Sea dikes are designed to protect the coastal area against tidal and storm surges. Thedesign situation is generally of a short duration (days), related to the duration of a stormand a spring tide. Sea dikes have to be sturdy to withstand violent wave action. As a resultthey are generally steep on the landward side and gently sloping on the seaward side.
Inland dikes are designed to protect lowlying areas from flooding. They include polderdikes, dikes surrounding lakes, and canals dikes. These type of dikes are common in theNetherlands. Other inland dikes are sleeper dikes, as a second defence line, andcompartment dikes (also for military defence).
River dikes in a temperate climate are different from sea dikes in the sense that they haveto withstand high water levels over a longer period of time (weeks, months), whereas waveaction is not so strong. This results in a relatively steep slope on the river side and amoderate slope on the landward side. In less temperate climates where flash floods occur,dike slopes on the landward side may be steeper, as they run less risk of failure throughseepage.
In a number of cases the no-dikes alternative is desirable. Flooding has a number ofbeneficial effects. Floods bring nutrients, fish, sediments, allow easy transport, replenishsoil moisture, and rinse the land of pests and pollution. Moreover, if floods are gentle(e.g. Chao Phya in Thailand, Chalan Beel and Sylhet in Bangladesh) it is quite possibleto grow floating rice. In societies where people live with the floods, the no-dikealternative, accompanied by a number of alleviating measures may be a good alternative.Also in the coastal region, the no-dike alternative may be the best alternative. Themaintenance of a sound mangrove belt along the coast is often more effective than dikeconstruction.
Submersible dikes are a compromise between dikes and no-dikes. Submersibleembankments are very popular in Bangladesh. In situations where full flood protection isnot possible nor desirable, (e.g. for reasons of finance, fisheries, ecology, or environment)submersible embankments offer a good alternative. The objective of submersibleembankments is to protect the land against early, unexpected floods, which may destroya crop just before, or during, the harvest. After the harvest, the dikes are overtopped andthe water propagates freely over the flood plain. The advantage of this system is that theembankments are cheap, the flood levels remain low (because no storage is lost), theenvironment is not much affected, the floods brings nutrients and fertility, fisheries are notjeopardized, spawning grounds are not destroyed, transport by boat is possible during mostof the year, the flooding often allows people to cultivate floating rice varieties, and peoplecan be sure of a high yielding variety pre-flood (pre-monsoon) crop which may give asubstantial boost to their income.
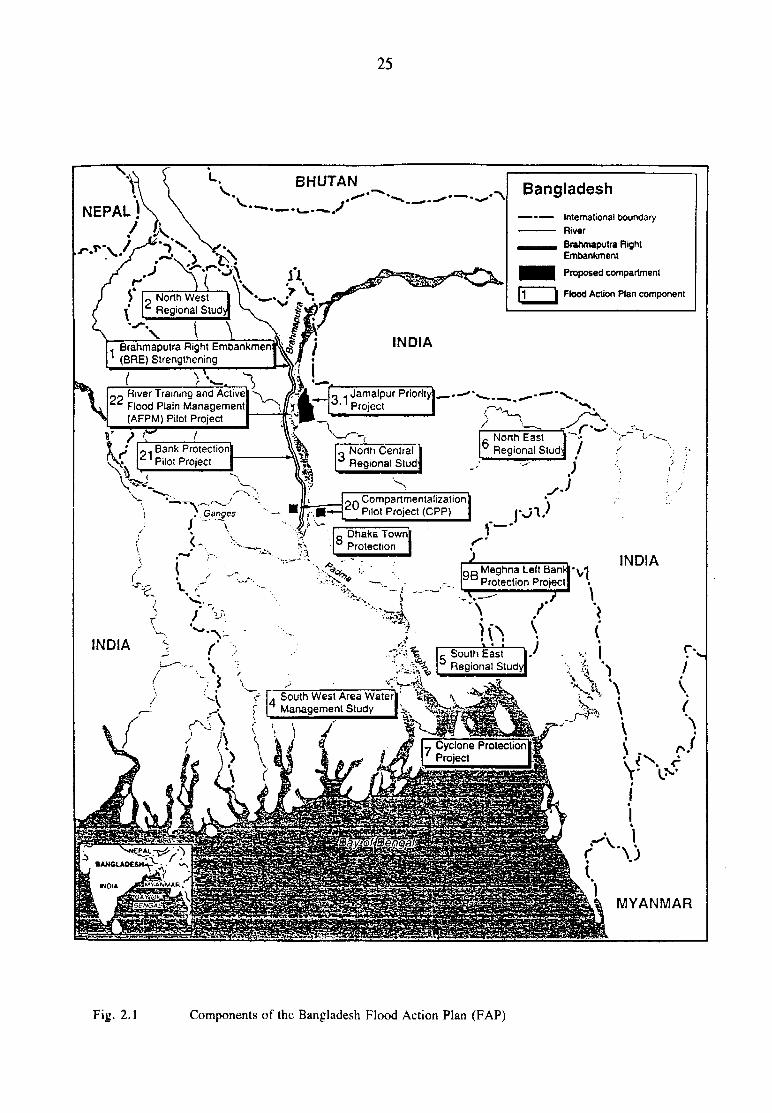
In Bangladesh (see Fig. 2.1) this has lead to an experiment where controlled flooding isimplemented in polders on the left bank of the Jamuna river; the river that dischargesalmost the entire flood flow of the Brahmaputra, with peak discharges of 100 000 nvVs.In the FAP 20 project, in Tangail, polders have open connections to the river through inletstructures, which are open during normal floods and are closed when flood levels are toohigh or too rapidly rising. The polders are divided into compartments that are separatedby compartmental dikes containing regulating structures. In each compartment water levelsare maintained that are most suitable for the predominant water using activity in thecompartment. The operation of the structures is a compromise between fishery interests,
25
BangladeshNEPAL) \
^ - ^ International boundaryRiverBrahmaputra RightEmbankment
Proposed compartment
Flood Action Plan component
1 Brahmaputra Right EmbankmenJKjg a I1 (BRE) Strengthening | \ / ;
!
River Training and Active Jamalpur Priorityi 1 ProjectFlood Plain Management
(AFPM) Pilot Project
Bank Protection
„ - . Compartmentalization^ u Pilot Project (CPP)
Regional Study
South West Area WaterManagement Study
Cyclone ProtectionProject
MYANMAR
Fig. 2.1 Components of the Bangladesh Flood Action Plan (FAP)

26
transport interests, and different farming interests.
The Netherlands, see Fig. 2.2, has examples of almost all the mentioned flood protectionalternatives. The high economic value of the land permits the enormous annual amountsof money spent on the maintenance and construction of flood protection infrastructure. Atpresent the sea dikes have been designed for a flood with a probability of exceedence ofonce in 10000 years. The river dikes along the Rhine delta, which protect low lying areasthat run the risk of 4-6 m depth of long-duration flooding, have been designed for a designflood of once in 1250 years. For the Maas river, where the damage in case of aninundation is less, the flooding depth is in the order of 1 m and the flooding duration isshort, a design flood of once in 500 years is used.
In general the level of protection against flooding is high in The Netherlands. However,if we could have started anew, with the knowledge we have now, we would probably havedone a few things differently. The complete protection against river flooding has led to agradual increase in the bed level of the rivers. The rivers which used to spill theirsediment on the land deposited their load in the river bed. The subsiding land, on the otherhand, was not replenished with sediment. This meant that the dikes became graduallyhigher. In addition, the drainage of large areas of land aggravated the land subsidence sothat it is now far below sea level. Controlled flooding would probably have been a betteralternative.
In fact this development has only been possible, because the rivers Rhine and Maas arerelatively gentle rivers, with a slow morphological time scale. If the Dutch rivers had beenmore vehement, the present flood protection system would probably not have existed.
On the coast, The Netherlands is in the situation that the no-dike alternative is completelyunrealistic. The natural situation where land is deposited at approximately mean high waterhas for many years been disturbed by the interference of man. But in more or lessundisturbed deltas, it would be wise to consider maintaining the mangrove protected coastline.
Until recently, in The Netherlands, a situation existed where people did not believe thatflooding would ever occur. This was a dangerous situation, because the risk of floods isever present. Since the floods in the Rhine and Maas of 1995, however, there is again ageneral concern for the flooding risk. Moreover, the political will to prevent floodingdisaster in the future is high. The latest development is that international cooperation onthe integrated management of international rivers is receiving renewed attention.Hopefully, the riparian countries will come to better cooperation in the control andprevention of floods, through improved physical planning, coordinated land use and theimplementation of flood alleviating and compensating measures.

27
Jtt*<m#tfpoicJ»'i D«v«topm«ni Authority
§
GERMANY
•rM tubi*ct to flooding in th« abiinct of i u dikn and dun#«
• r u tubjact to flooding in th» »b*tr>e* 01 riv»r dik»t
driinad lakti
i land gaintd on tht • • •
frontier
i u dik«
dun«
Fig. 2.2 Areas in The Netherlands protected against flooding
28
2.3. Irrigation and drainage
Human settlement is closely related to irrigation. A society which consists of more than100 people requires intensive agriculture to feed those people in the society that do notproduce food but which have other important tasks, such as: religious services, protection(military services), administration, manufacturing, trade, transport, etc. To feed apart ofthe population that does not produce requires intensive agriculture and in many casesirrigation.
The total area of cultivation in the world is about 1500 million ha. Of this total, about 250million ha are irrigated. Normally water is diverted from a river and transported bygravity, or with the aid of pumping stations to the fields. In many cases, irrigation wateris needed in the dry season, when the river flow is also low. Hence, irrigation works areoften accompanied by the construction of reservoirs, in which case, high costs areinvolved. It should be kept in mind that NMwIiUit l a f^f" im^Ot t projects in the wo«W,y4mM involve the construction of roawvoffs, are able to pay back the costs in croppipfcwction. The return of the costs involved in dam construction is generally paid fromhydropower, or from the national budget.
In general, irrigation should be accompanied by wbsurface drainage to avoid water loggingand salinization. This is clearly illustrated by the fall of the Sumerian empire (4500-2500BC) in present day Iraq and Iran, which was caused by desertification as a result ofsalinization. In these areas, as in large parts of Pakistan and India, the threat of salinizationdue to irrigation, is as strongly present as ever.
In addition, if no appropriate measures are taken, the drainage water from irrigated areasmay cause the river from which the irrigation water has been drawn, to be polluted withsalt, pesticides, herbicides and fertilizers, rendering the water useless for downstreamconsumption.
2.4. Flow regulation and reservoir construction
The main purpose of reservoirs is to attenuate irregularities of flow through the creationof storage. The reason why man wants to smooth out irregularities can be manifold:
to supply water for irrigation in the dry season or during dry spells;to guarantee a constant supply of water for urban or industrial water consumption;to have a reliable source of hydropower;to reduce flooding hazard by smoothing out flood peaks;to create a reservoir for recreation and fisheries.
The five purposes mentioned require different types of operation. In the case of a reservoirfor irrigation, the reservoir is filled as early as possible, to ensure that the reservoir is fullat the start of the dry season. During the dry season, as much water as possible is used,while enough water is conserved to cater for a possible drought. Normally, by the end ofthe dry season, the reservoir will be empty except for an amount saved for the eventualityof a prolonged drought.
29
The water supply reservoir does not differ much from the reservoir for irrigation, exceptthat the risk one is willing to take of running dry is smaller. This will lead to a moreprudent use of water by the end of the wet season, if the rains are late.
The operation for hydropower is completely different. In the case of hydropower it isgenerally more beneficial to maintain the reservoir as full as possible, the whole yearthrough, in order to maintain head. A small amount of water in a full reservoir generatesas much power as a large amount of water with little head.
However, if the main purpose of the reservoir is flood control, the operation is quitedifferent again. The reservoir should be kept as empty as possible the whole year round,to allow storage of flood water in order to release it at a moderate rate.
In reservoirs with a recreational purpose, a more or less constant water level should bemaintained. For ecological purposes, a minimum amount of water is required in thereservoir for the animals to remain healthy. In some cases environmentalists require floodreleases to simulate floods in downstream ecosystems.
Sometimes the sediment load of the river is so high that sedimentation control requires aspecial way of operating the reservoir to prevent loss of storage. These operationalconstraints are particularly strong in the Blue Nile (Roseris dam).
It may be clear from the above, that reservoirs that serve more than one purpose, so calledlffirrnirn; nrr tint I I I J tir rrrrrrmtr J tmf rttffmiiit water users will demand
t way of operating the reservoir. Hence, the water manager, also in the simplecase of a single reservoir, has to take a decision in a situation of conflicting interests,taking into account multiobjectives and multiconstraints.
Multi-purpose reservoirs are normally operated based on rule curves that result in thezoning of the reservoir storage. Each zone has a certain operating rule. These operatingrules are derived through systems analysis (optimization) or simulation. In Chapter 5 thetheory of reservoir operation is presented, as well as models that can be used for reservoirsimulation.
30
2.5. Water resources management in The Netherlands (TNO-CHO, 1989)
Water administrationThe first settlers in the Low Countries had toprotect their lives and cattle against floodingfrom the sea and this led to the creation of the"polders". In the Middle Ages single or groupsof polders were combined to form "WaterBoards", one of the earliest forms of governmentadministration in the Netherlands, in whichlandowners had the right to elect their governingboard. These have been followed by dikeboards, storage-basin boards and purificationboards. All organisations, both old and new,continue to carry out an important function inthe administrative structure of the country.In the sixteenth century the Netherlands wereno more than a set of autonomous counties andduchies and only at the end of that century didthe country emerge as a united political state.The political power now carried by Provinces isreflecting this historical background.Municipalities and water boards operate with ahigh degree of independence, under thesupervision of the provincial authorities. Thecentral government, of course, has thesupervision and final decision in many matters,and particularly in matters regarding the safety,distribution and quality of water.The central government and the governingbodies of provinces and municipalities areso-called "general democracies". The governingboards of the water boards are elected bylandowners and other functional groups.In a country like the Netherlands it is notsurprising that all levels of government haveresponsibilities in water management. Some 10to 20 years ago the approximate division wasthat responsibility for safety and navigation wasresting with the central government and theprovinces and that the responsibility for waterlevels and internal distribution was resting withthe water boards. The responsibilities ofmunicipalities were incidental.The government has transferred overallresponsibility for water resources managementto the Public Works Department (Rijkswater-staat). Likewise, the provinces have PublicWorks Departments with comparableresponsibilities. More recent administrativedevelopments include the amalgamation ofwater boards and creation of boards withspecialized responsibilities, such as: dikemanagement and water purification (after the
Pollution of Surface Waters Act came intoforce). The general picture, however, has alwaysbeen of a very decentralized form of governmentwith separate responsibilities, maintained bytraditional codes of conduct. This system hasbeen functioning well for many centuries.However, the modern developments ofpopulation growth, industrialization, pollutionetc., call for integrated water managementpolicies. These developments identifieddeficiencies in the decision making processregarding legislation and a need for a morecoherent approach to planning and policymaking. For example the Ministry ofEnvironment, though not responsible for watermanagement, is developing environmentalpolicies which include the soil, groundwaterand aquatic environment and shares with Rijks-waterstaat the responsibility to develop waterquality standards. Furthermore, physicalplanning, environmental and water resourcesmanagement are no longer separate fields ofpolicy. This illustrates the fact that thedevelopments of modern society have made itincreasingly difficult to develop a cohesive andconsistent water policy. Such a policy mustbalance the conflicting interests of the varioussectors and regions and should be able toenhance the efficiency of water utilization.
Legislation, planning, finance.Although there was a clear need for an integratedWater Management Act, in practice thePollution of Surface Waters Act was consideredmost urgent and has been operational since1970, followed by the Groundwater Act of 1982.A Soil Protection Act (which includes theprotection of groundwater) is now actuallybeing promoted in response to the recentdiscoveries of pollution from various sources.The act will be operative by the end of 1986.A Water Management Bill with severalintegrating characteristics is being discussed inParliament, but it is not fully comprehensivecovering all facets of the interdisciplinary issuesof planning development and management ofsurface and groundwater resources.The policy instruments of these laws aregenerally licences and charges, but comprisealso prohibitive and restrictive measures. Theresponsibilities are structured differently. ThePollution of Surface Waters Act dividesresponsibilities (dependent on the '"ownership"
31
of the water) between government andprovinces; the latter may (and in most cases do)delegate these tasks to water boards. TheGroundwater Act and the Soil Protection Actdelegate the major responsibility to theprovinces, with a supervision at national level.The Water Management Bill dividesresponsibilities between the different levels ofadministration and apart from licences(administration to private entities) has the newconcept of "water agreements" (betweenauthorities). Like most modern acts, thosementioned have extensive procedural securitiesbuilt in with possibilities for appeal.Planning procedures had developed into anunmanageable multitude of planningobligations. For this reason the WaterManagement Bill is now being reformulated tosimplify the entire planning system.The latest tendency is towards an integratedapproach to water syterns (local, regional ornational), meaning that all relevant aspects aretaken into account. System, in this context, isnot only water, but also river beds and banks,shores, and all forms of aquatic life.Finally it should be mentioned that the methodof financing water policy is subject toreconsideration. The usual financial sources arethe government's general budget, the chargesand levies ensuing from the various laws and theobligatory contributions to water boards. Onthe one hand a policy to improve the quality oflife (and water!) against the odds of modernindustrial society tends to become increasinglyexpensive. On the other hand, in managing a
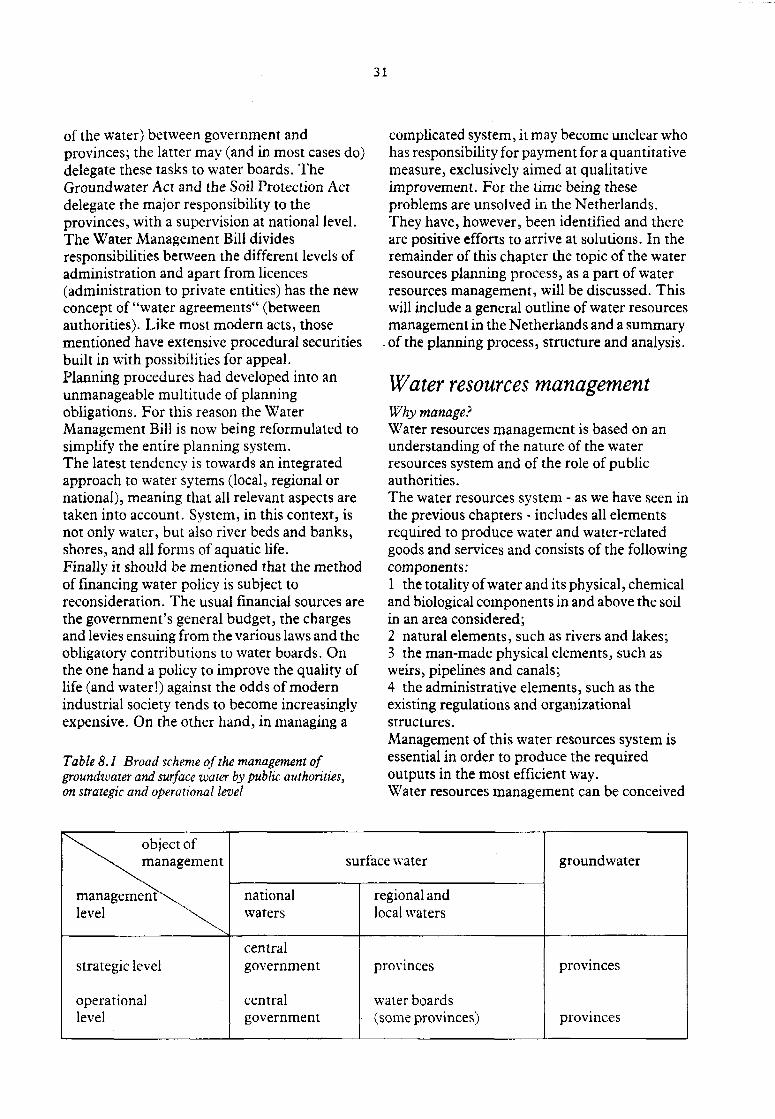
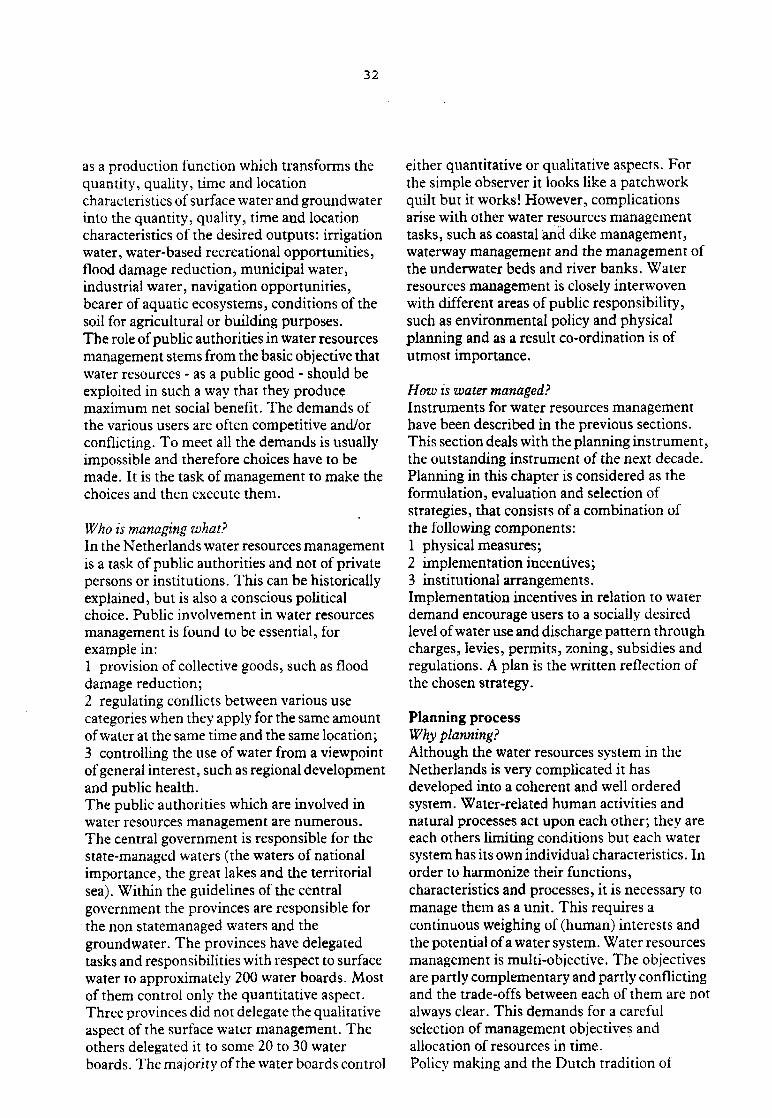
Table 8.1 Broad scheme of the management ofgroundwater and surface water by public authorities,on strategic and operational level
complicated system, it may become unclear whohas responsibility for payment for a quantitativemeasure, exclusively aimed at qualitativeimprovement. For the time being theseproblems are unsolved in the Netherlands.They have, however, been identified and thereare positive efforts to arrive at solutions. In theremainder of this chapter the topic of the waterresources planning process, as a part of waterresources management, will be discussed. Thiswill include a general outline of water resourcesmanagement in the Netherlands and a summaryof the planning process, structure and analysis.
Water resources managementWhy manage?Water resources management is based on anunderstanding of the nature of the waterresources system and of the role of publicauthorities.The water resources system - as we have seen inthe previous chapters - includes all elementsrequired to produce water and water-relatedgoods and services and consists of the followingcomponents:1 the totality of water and its physical, chemicaland biological components in and above the soilin an area considered;2 natural elements, such as rivers and lakes;3 the man-made physical elements, such asweirs, pipelines and canals;4 the administrative elements, such as theexisting regulations and organizationalstructures.Management of this water resources system isessential in order to produce the requiredoutputs in the most efficient way.Water resources management can be conceived
^ • ^ object of^ ^ . management
management"--^level ^ v
strategic level
operationallevel
surface water
nationalwaters
centralgovernment
centralgovernment
regional andlocal waters
provinces
water boards(some provinces)
groundwater
provinces
provinces
32
as a production function which transforms thequantity, quality, time and locationcharacteristics of surface water and groundwaterinto the quantity, quality, time and locationcharacteristics of the desired outputs: irrigationwater, water-based recreational opportunities,flood damage reduction, municipal water,industrial water, navigation opportunities,bearer of aquatic ecosystems, conditions of thesoil for agricultural or building purposes.The role of public authorities in water resourcesmanagement stems from the basic objective thatwater resources - as a public good - should beexploited in such a way that they producemaximum net social benefit. The demands ofthe various users are often competitive and/orconflicting. To meet all the demands is usuallyimpossible and therefore choices have to bemade. It is the task of management to make thechoices and then execute them.
Who is managing what?In the Netherlands water resources managementis a task of public authorities and not of privatepersons or institutions. This can be historicallyexplained, but is also a conscious politicalchoice. Public involvement in water resourcesmanagement is found to be essential, forexample in:1 provision of collective goods, such as flooddamage reduction;2 regulating conflicts between various usecategories when they apply for the same amountof water at the same time and the same location;3 controlling the use of water from a viewpointof general interest, such as regional developmentand public health.The public authorities which are involved inwater resources management are numerous.The central government is responsible for thestate-managed waters (the waters of nationalimportance, the great lakes and the territorialsea). Within the guidelines of the centralgovernment the provinces are responsible forthe non statemanaged waters and thegroundwater. The provinces have delegatedtasks and responsibilities with respect to surfacewater to approximately 200 water boards. Mostof them control only the quantitative aspect.Three provinces did not delegate the qualitativeaspect of the surface water management. Theothers delegated it to some 20 to 30 waterboards. The majority of the water boards control
either quantitative or qualitative aspects. Forthe simple observer it looks like a patchworkquilt but it works! However, complicationsarise with other water resources managementtasks, such as coastal and dike management,waterway management and the management ofthe underwater beds and river banks. Waterresources management is closely interwovenwith different areas of public responsibility,such as environmental policy and physicalplanning and as a result co-ordination is ofutmost importance.
How is water managed?Instruments for water resources managementhave been described in the previous sections.This section deals with the planning instrument,the outstanding instrument of the next decade.Planning in this chapter is considered as theformulation, evaluation and selection ofstrategies, that consists of a combination ofthe following components:1 physical measures;2 implementation incentives;3 institutional arrangements.Implementation incentives in relation to waterdemand encourage users to a socially desiredlevel of water use and discharge pattern throughcharges, levies, permits, zoning, subsidies andregulations. A plan is the written reflection ofthe chosen strategy.
Planning processWhy planning?Although the water resources system in theNetherlands is very complicated it hasdeveloped into a coherent and well orderedsystem. Water-related human activities andnatural processes act upon each other; they areeach others limiting conditions but each watersystem has its own individual characteristics. Inorder to harmonize their functions,characteristics and processes, it is necessary tomanage them as a unit. This requires acontinuous weighing of (human) interests andthe potential of a water system. Water resourcesmanagement is multi-objective. The objectivesare partly complementary and partly conflictingand the trade-offs between each of them are notalways clear. This demands for a carefulselection of management objectives andallocation of resources in time.Policy making and the Dutch tradition of
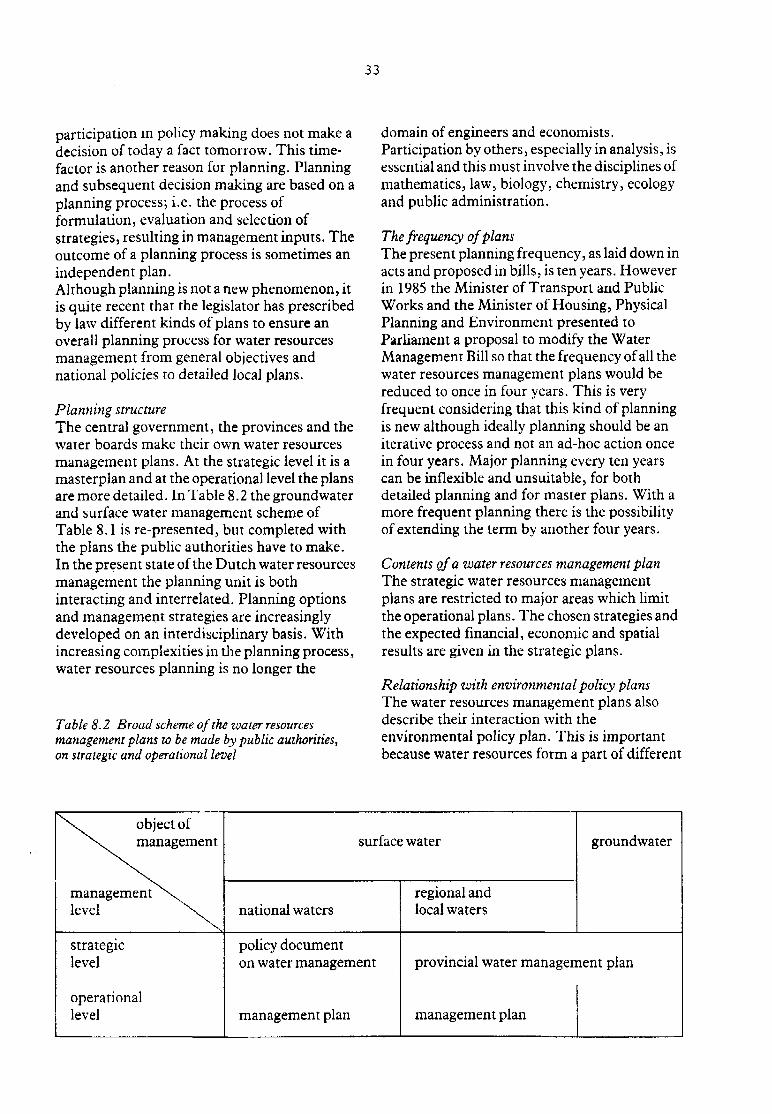
33
participation in policy making does not make adecision of today a fact tomorrow. This time-factor is another reason for planning. Planningand subsequent decision making are based on aplanning process; i.e. the process offormulation, evaluation and selection ofstrategies, resulting in management inputs. Theoutcome of a planning process is sometimes anindependent plan.Although planning is not a new phenomenon, itis quite recent that the legislator has prescribedby law different kinds of plans to ensure anoverall planning process for water resourcesmanagement from general objectives andnational policies to detailed local plans.
Planning structureThe central government, the provinces and thewater boards make their own water resourcesmanagement plans. At the strategic level it is amasterplan and at the operational level the plansare more detailed. In Table 8.2 the groundwaterand surface water management scheme ofTable 8.1 is re-presented, but completed withthe plans the public authorities have to make.In the present state of the Dutch water resourcesmanagement the planning unit is bothinteracting and interrelated. Planning optionsand management strategies are increasinglydeveloped on an interdisciplinary basis. Withincreasing complexities in the planning process,water resources planning is no longer the
Table 8.2 Broad scheme of the water resourcesmanagement plans to be made by public authorities,on strategic and operational level
domain of engineers and economists.Participation by others, especially in analysis, isessential and this must involve the disciplines ofmathematics, law, biology, chemistry, ecologyand public administration.
The frequency of plansThe present planning frequency, as laid down inacts and proposed in bills, is ten years. Howeverin 1985 the Minister of Transport and PublicWorks and the Minister of Housing, PhysicalPlanning and Environment presented toParliament a proposal to modify the WaterManagement Bill so that the frequency of all thewater resources management plans would bereduced to once in four years. This is veryfrequent considering that this kind of planningis new although ideally planning should be aniterative process and not an ad-hoc action oncein four years. Major planning every ten yearscan be inflexible and unsuitable, for bothdetailed planning and for master plans. With amore frequent planning there is the possibilityof extending the term by another four years.
Contents of a water resources management planThe strategic water resources managementplans are restricted to major areas which limitthe operational plans. The chosen strategies andthe expected financial, economic and spatialresults are given in the strategic plans.
Relationship with environmental policy plansThe water resources management plans alsodescribe their interaction with theenvironmental policy plan. This is importantbecause water resources form a part of different
x. object of^ ^ management
management^\^level \
strategiclevel
operationallevel
surface water
national waters
policy documenton water management
management plan
regional andlocal waters
provincial water managen
management plan
groundwater
lent plan
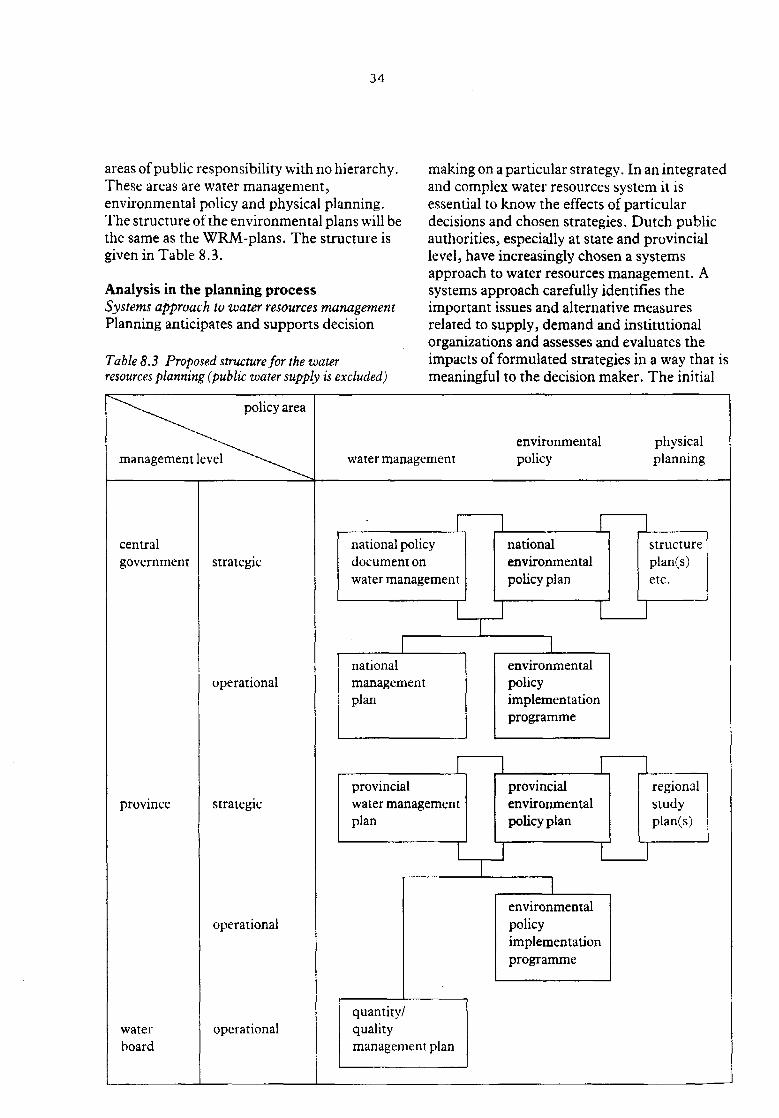
34
areas of public responsibility with no hierarchy.These areas are water management,environmental policy and physical planning.The structure of the environmental plans will bethe same as the WRM-plans. The structure isgiven in Table 8.3.
Analysis in the planning processSystems approach to water resources managementPlanning anticipates and supports decision
Table 8.3 Proposed structure for the waterresources planning (public water supply is excluded)
making on a particular strategy. In an integratedand complex water resources system it isessential to know the effects of particulardecisions and chosen strategies. Dutch publicauthorities, especially at state and provinciallevel, have increasingly chosen a systemsapproach to water resources management. Asystems approach carefully identifies theimportant issues and alternative measuresrelated to supply, demand and institutionalorganizations and assesses and evaluates theimpacts of formulated strategies in a way that ismeaningful to the decision maker. The initial
policy area
management level water managementenvironmentalpolicy
physicalplanning
centralgovernment
province
waterboard
strategic
operational
strategic
operational
operational
national policydocument onwater management
nationalenvironmentalpolicy plan
structureplan(s)etc.
nationalmanagementplan
environmentalpolicyimplementationprogramme
provincialwater managementplan
quantity/qualitymanagement plan
provincialenvironmentalpolicy plan
environmentalpolicyimplementationprogramme
regionalstudyplan(s)
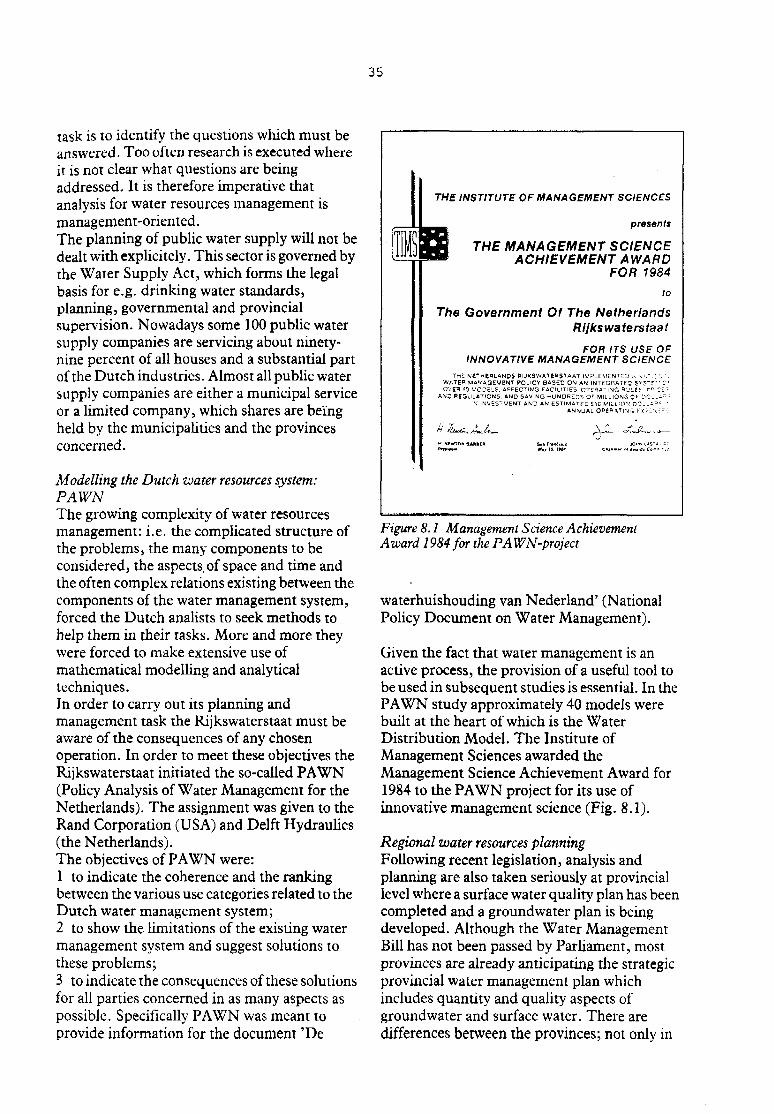
35
task is to identify the questions which must beanswered. Too often research is executed whereit is not clear what questions are beingaddressed. It is therefore imperative thatanalysis for water resources management ismanagement-oriented.The planning of public water supply will not bedealt with explicitely. This sector is governed bythe Water Supply Act, which forms the legalbasis for e.g. drinking water standards,planning, governmental and provincialsupervision. Nowadays some 100 public watersupply companies are servicing about ninety-nine percent of all houses and a substantial partof the Dutch industries. Almost all public watersupply companies are either a municipal serviceor a limited company, which shares are beingheld by the municipalities and the provincesconcerned.
Modelling the Dutch water resources system:PAWNThe growing complexity of water resourcesmanagement: i.e. the complicated structure ofthe problems, the many components to beconsidered, the aspects of space and time andthe often complex relations existing between thecomponents of the water management system,forced the Dutch analists to seek methods tohelp them in their tasks. More and more theywere forced to make extensive use ofmathematical modelling and analyticaltechniques.In order to carry out its planning andmanagement task the Rijkswaterstaat must beaware of the consequences of any chosenoperation. In order to meet these objectives theRijkswaterstaat initiated the so-called PAWN(Policy Analysis of Water Management for theNetherlands). The assignment was given to theRand Corporation (USA) and Delft Hydraulics(the Netherlands).The objectives of PAWN were:1 to indicate the coherence and the rankingbetween the various use categories related to theDutch water management system;2 to show the limitations of the existing watermanagement system and suggest solutions tothese problems;3 to indicate the consequences of these solutionsfor all parties concerned in as many aspects aspossible. Specifically PAWN was meant toprovide information for the document 'De
THE INSTITUTE OF MANAGEMENT SCIENCES
presents
THE MANAGEMENT SCIENCEACHIEVEMENT AWARD
FOR 1984
to
The Government Of The NetherlandsRijkswaterstaat
FOR ITS USE OFINNOVATIVE MANAGEMENT SCIENCE
THE N"H£RLAND& RUKSWAYEHSIAAY | V^LEMENT EZ,1 A \ A " , : '.--.
WATER MANAGEMENT POLICY BASED ON AN INTEGRATES $V7:~:" L':
OVER *0 VCDtLS . AFFECTING FACILITIE5. C F E R A T I N G a ' JL l r ; ' • ; • : "-
AND REGULATIONS. AND SAVING HUNDRED5 OF MILLIONS C< -:Q---~-:
:N INVESTMENT A N D A N ESTIMATED 5 \C MILLION1 D ? _ _ - - : •.A N N U A L O P £ R 4 T I ^ / ; rX " : : ' . \ - : r :
Figure 8.1 Management Science AchievementAward 1984 for the PAWN-project
waterhuishouding van Nederland' (NationalPolicy Document on Water Management).
Given the fact that water management is anactive process, the provision of a useful tool tobe used in subsequent studies is essential. In thePAWN study approximately 40 models werebuilt at the heart of which is the WaterDistribution Model. The Institute ofManagement Sciences awarded theManagement Science Achievement Award for1984 to the PAWN project for its use ofinnovative management science (Fig. 8.1).
Regional water resources planningFollowing recent legislation, analysis andplanning are also taken seriously at provinciallevel where a surface water quality plan has beencompleted and a groundwater plan is beingdeveloped. Although the Water ManagementBill has not been passed by Parliament, mostprovinces are already anticipating the strategicprovincial water management plan whichincludes quantity and quality aspects ofgroundwater and surface water. There aredifferences between the provinces; not only in
36
their approach, but also in identifying prioritiesand in implementation. To compare the resultsand to influence the policy of other publicauthorities involved in the Dutch waterresources management, it is important to usethe same scenarios, criteria etc., andinstruments, such as compatible computermodels. The Rijkswaterstaat encourages theprovincial use of PAWN instruments.
In conclusionAn important step in the modernization of theDutch water resources management is theintroduction by law of the planning instrument.The coherence that characterizes the waterresources systems makes the integratedapproach essential.The opportunities to support water resourcesmanagement have multiplied through thedevelopment and introduction of a systemsapproach in water resources management.The coming years will prove:- whether planning will be able to live up toexpectations;- to what extent the definition of a waterresources system can be broadened to make anintegrated approach possible and- whether a systems approach, the use ofcomputer models and ongoing automation willbecome general practice for the publicauthorities involved in the Dutch waterresources management.
37
3. WATER RESOURCES
Note: Parts of this chapter are dealt with in the lecture Principles of Hydrology. Althoughthese topics are not presented in the lecture Water Resources Management, they have beenretained in the lecture note for reasons of completeness.
3.1. Ground water resources
Two zones can be distinguished in which water occurs in the ground:
• the saturated zone• the unsaturated zone.
For the hydrologist both zones are important links and storage devices in the hydrologicalcycle. For the engineer the importance of each zone depends on his field of interest. Anagricultural engineer is principally interested in the unsaturated zone, where the necessarycombination of soil, air and water occurs for a plant to live. The water resources engineeris mainly interested in the groundwater which occurs and flows in the saturated zone.
The process of water entering into the ground is called iniimtion. Downward transportof water in the unsaturated zone is called ptMailtaon, whereas the upward transport in theunsaturated zone is called nifjUaryiif The flow of water through saturated porous mediais called grouiMlwater flow. The outflow from groundwater to surface water is called
The type of openings (voids or pores) in which groundwater occurs is an importantproperty of the subsurface formation. Three types are generally distinguished:
1. B«es, openings between individual particles as in sand and gravel. Pores aregenerally interconnected and allow capillary flow for which Darcy's law (seebelow) can be applied.
2. iMNHes, crevices or joints in hard rock which have developed from breaking ofthe rock. The pores may vary from super capillary size to capillary size. Only forthe latter situation application of Darcy's law is possible. Water in these fracturesis known as fissure or fault water.
3. iflMonitiflWHRls and caverns in limestone (karst water), and openings resultingfrom gas bubbles in lava. These large openings result in a turbulent flow ofgroundwater which cannot be described with Darcy's law.
The 0H0ty n of the subsurface formation is that part of its volume which consists ofopenings and pores:
n = ^ (3-1)V
where Vp is the pore volume and V is the total volume of the soil.
38
When water is drained by gravity from saturated material, only a part of the total volumeis released. This portion is known as appcific yield. The water not drained is calledspecific retention and the sum of specific yield and specific retention is equal to theporosity. In fine-grained material the forces that retain water against the force of gravityare high due to the small pore size. Hence, the specific retention of fine-grained material(silt or clay) is larger than of coarse material (sand or gravel).
Gfeimdwftter is the water which occurs in the saturated zone. The study of the occurrenceand movement of ground water is called ground water hydrology or geohydrology. Thehydraulic properties of a water-bearing formation are not only determined by the porositybut also by the interconnection of the pores and the pore size. In this respect thesubsurface formations are classified as follows:
1. At$0&r, which is a water-bearing layer for which the porosity and pore size aresufficiently large to allow transport of water in appreciable quantities (e.g. sanddeposits).
2. Aqaiclude is an impermeable layer, which may contain water but is incapable oftransmitting significant quantities.
3. Aqaiiard is a less permeable layer, not capable of transmitting water in ahorizontal direction, but allowing considerable vertical flow (e.g. clay layer).
4. A<pfoge is impermeable rock neither containing nor transmitting water (e.g.granite layers).
Classification of rocks
The water transmitting properties are dominated by the type of geological formation.Rocks can be divided in three main groups:
1. Igneous rocks, which are formed at the solidification of cooling magma (e.g.granite) or volcanic material (e.g. basalt). Igneous rocks have a crystallinestructure and a very low porosity (often less than 1 %). The water-bearingproperties are generally very low unless an extensive jointing, fracturing andfaulting is present.
2. Sedimentary rocks are formed by deposits of weathered material of pre-existingrocks. Depending on the type of transporting mechanism the following sedimentaryrocks may be distinguished:a. Fluvial or alluvial (river) deposits, which include gravel, sand, silt and clay.
These formations are characterized by stratification. The porosity variesbetween 20 and 60 %, but only gravel and sand show macro-pores! Due tocementing, pressure and/or temperature sand may have changed in sandstoneand lime deposits into limestone. These consolidated rocks have a muchlower ability to transmit water unless fractures or karst phenomena(limestone) are present.
b. Aeolian (wind) deposits include sand and silt (loess). Often large areas arecovered with relatively homogeneous material.
c. Glacial (ice) deposits. During the Pleistocene glaciers deposited glacial tillwhich usually is a mixture of silt, sand and clay in which pebbles and huge
39
boulders may be present. These deposits are in general poor water producers.
Other sedimentary rocks are named in relation to their origin, location andenvironmental conditions, e.g. marine (sea) deposits, organogenic deposits (fromorganic life), terrestrial deposits, etc.
3. Metamorphic rocks are formed from igneous or sedimentary rocks by chemical andphysical processes (heat and pressure). Examples are slate, gneiss, quartzite andmarble. These rocks are the poorest water producers.
Aquifers
For a description or mathematical treatment of groundwater flow the geological formationcan be schematized into an aquifer system, consisting of various layers with distinctdifferent hydraulic properties. The aquifers are simplified into one of the following types(see Fig. 3.1):
1. Unconfined aquifer (also phreatic or water-table aquifer) which consists of apervious layer underlain by a (semi-) impervious layer. The aquifer is notcompletely saturated with water. The upper boundary is formed by a free water-table (phreatic surface).
2. Confined aquifer, consisting of a completely saturated pervious layer bounded byimpervious layers. The water level in wells tapping those aquifers rises above thetop of the pervious layer and sometimes even above soil surface (artesian wells).
3. Semi-confined or leaky aquifers consist of a completely saturated pervious layer,but the upper and/or under boundaries are semi-pervious.
The pressure of the water in an aquifer is measured with agiMMMneter, which is an open-ended pipe with a diameter of 3 - 10 cm. The height to which the water rises with respectto a certain reference level (e.g. the impervious base, mean sea level, etc.) is called thehydraulic head. Strictly speaking the hydraulic head measured with a piezometer appliesfor the location at the lower side of the pipe, but since aquifers are very pervious, thisvalue is approximately constant over the depth of the aquifer. For unconfined aquifers thehydraulic head may be taken equal to the height of the water-table, which is known as theDupuit-Forchheimer assumption.
Water moves from locations where the hydraulic head is high to places where thehydraulic head is low. For example, Fig. 3.1 shows that the hydraulic head in the semi-confined aquifer is below the hydraulic head (or phreatic surface) in the unconfinedaquifer. Hence, water flows through the semi-pervious layer from the unconfined aquiferinto the semi-confined aquifer. A perched water-table may develop during a certain timeof the year when percolating soil moisture accumulates above a less pervious layer.

40
perc phreaticgroundwater
pressuregroundwater
artesiangroundwater
• S t s *?i, 11 :i3 l'i i! si •? i " I i - s ; • f| Ei.1 11:: E;c:; a • >t! E- - . . . . . . - - - - - *. J r ' r ' T i ' r "
unconflnedaquifer
aquitard(semi-permeable)
semi-confinedaquifer
aquiclude (impervious)• confined aquifer
impervious baseof aquifer system
Fig. 3.1 Aquifer types
Groundwater flow
The theory on groundwater movement originates from a study by the Frenchmanfirst published in 1856. From many experiments (Fig. 3.2) he concluded that thegroundwater discharge Q is proportional to the difference in hydraulic head AH and cross-sectional area A and inversely proportional to the length As, thus
Q = A*V = -A*k*AHAs
(3.2)
where k, the proportionality constant, is called the hydraulic conductivity, expressed inm/d; and v is the specific discharge, also called the filter velocity.
Since the hydraulic head decreases in the direction of flow, the filter velocity has anegative sign. The actual velocity v^, of a fluid particle is much higher because only theeffective pore space ne is available for transport, thus
v«* = — (3.3)
The effective porosity ne is smaller than the porosity n, as the pores that do not contributeto the transport are excluded (dead-end pores). The actual velocity is important in waterquality problems, to determine the transport of contaminants.
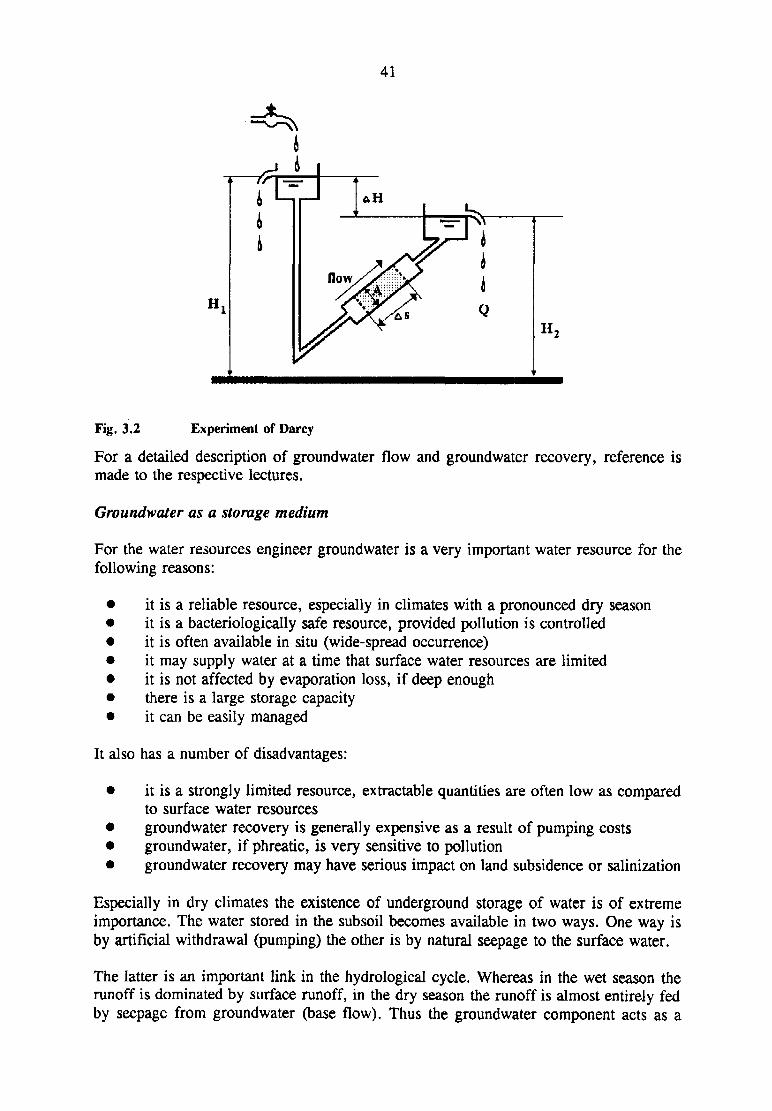
41
Fig. 3.2 Experiment of Darcy
For a detailed description of groundwater flow and groundwater recovery, reference ismade to the respective lectures.
Groundwater as a storage medium
For the water resources engineer groundwater is a very important water resource for thefollowing reasons:
it is a reliable resource, especially in climates with a pronounced dry seasonit is a bacteriologically safe resource, provided pollution is controlledit is often available in situ (wide-spread occurrence)it may supply water at a time that surface water resources are limitedit is not affected by evaporation loss, if deep enoughthere is a large storage capacityit can be easily managed
It also has a number of disadvantages:
• it is a strongly limited resource, extractable quantities are often low as comparedto surface water resources
• groundwater recovery is generally expensive as a result of pumping costs• groundwater, if phreatic, is very sensitive to pollution• groundwater recovery may have serious impact on land subsidence or salinization
Especially in dry climates the existence of underground storage of water is of extremeimportance. The water stored in the subsoil becomes available in two ways. One way isby artificial withdrawal (pumping) the other is by natural seepage to the surface water.
The latter is an important link in the hydrological cycle. Whereas in the wet season therunoff is dominated by surface runoff, in the dry season the runoff is almost entirely fedby seepage from groundwater (base flow). Thus the groundwater component acts as a
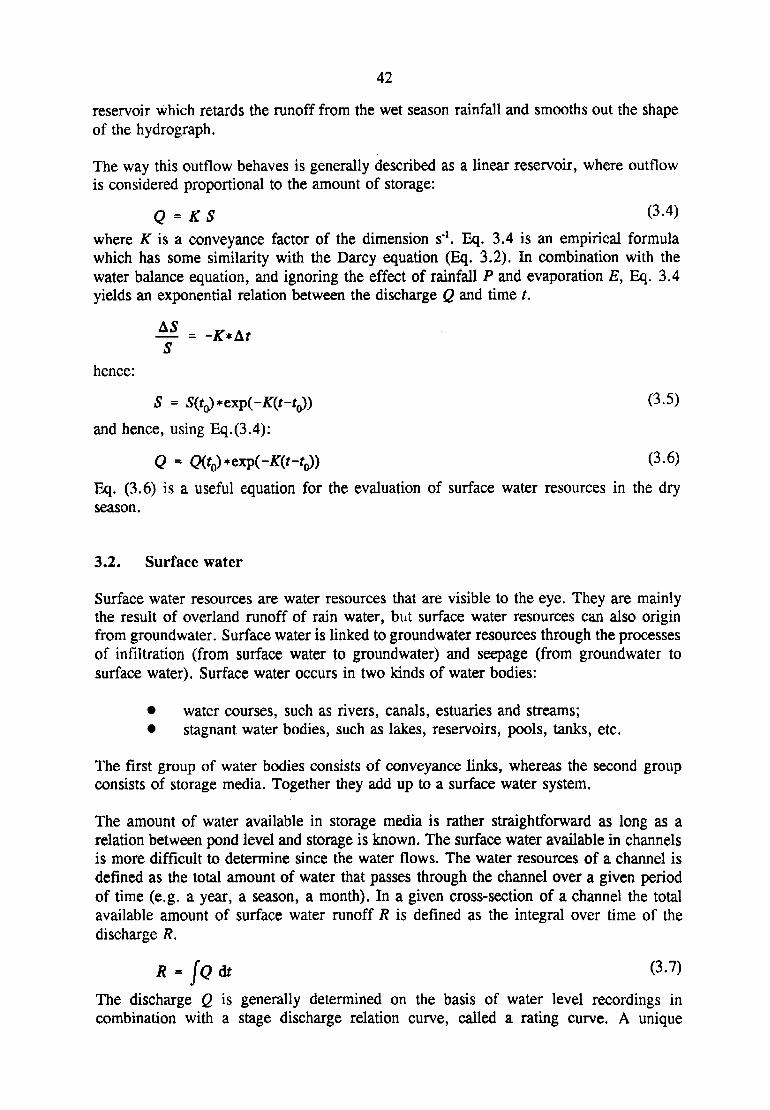
42
reservoir which retards the runoff from the wet season rainfall and smooths out the shapeof the hydrograph.
The way this outflow behaves is generally described as a linear reservoir, where outflowis considered proportional to the amount of storage:
Q = K S (3-4)where AT is a conveyance factor of the dimension s"1. Eq. 3.4 is an empirical formulawhich has some similarity with the Darcy equation (Eq. 3.2). In combination with thewater balance equation, and ignoring the effect of rainfall P and evaporation E, Eq. 3.4yields an exponential relation between the discharge Q and time t.
shence:
S = 5(fo)*exp(-^T(f-fo)) V.5)
and hence, using Eq.(3.4):
Q = CWo)*exP(~^('~'o)) ®'®Eq. (3.6) is a useful equation for the evaluation of surface water resources in the dryseason.
3.2. Surface water
Surface water resources are water resources that are visible to the eye. They are mainlythe result of overland runoff of rain water, but surface water resources can also originfrom groundwater. Surface water is linked to groundwater resources through the processesof infiltration (from surface water to groundwater) and seepage (from groundwater tosurface water). Surface water occurs in two kinds of water bodies:
• water courses, such as rivers, canals, estuaries and streams;• stagnant water bodies, such as lakes, reservoirs, pools, tanks, etc.
The first group of water bodies consists of conveyance links, whereas the second groupconsists of storage media. Together they add up to a surface water system.
The amount of water available in storage media is rather straightforward as long as arelation between pond level and storage is known. The surface water available in channelsis more difficult to determine since the water flows. The water resources of a channel isdefined as the total amount of water that passes through the channel over a given periodof time (e.g. a year, a season, a month). In a given cross-section of a channel the totalavailable amount of surface water runoff R is defined as the integral over time of thedischarge R.
R= (O6t (3-7)
The discharge Q is generally determined on the basis of water level recordings incombination with a stage discharge relation curve, called a rating curve. A unique
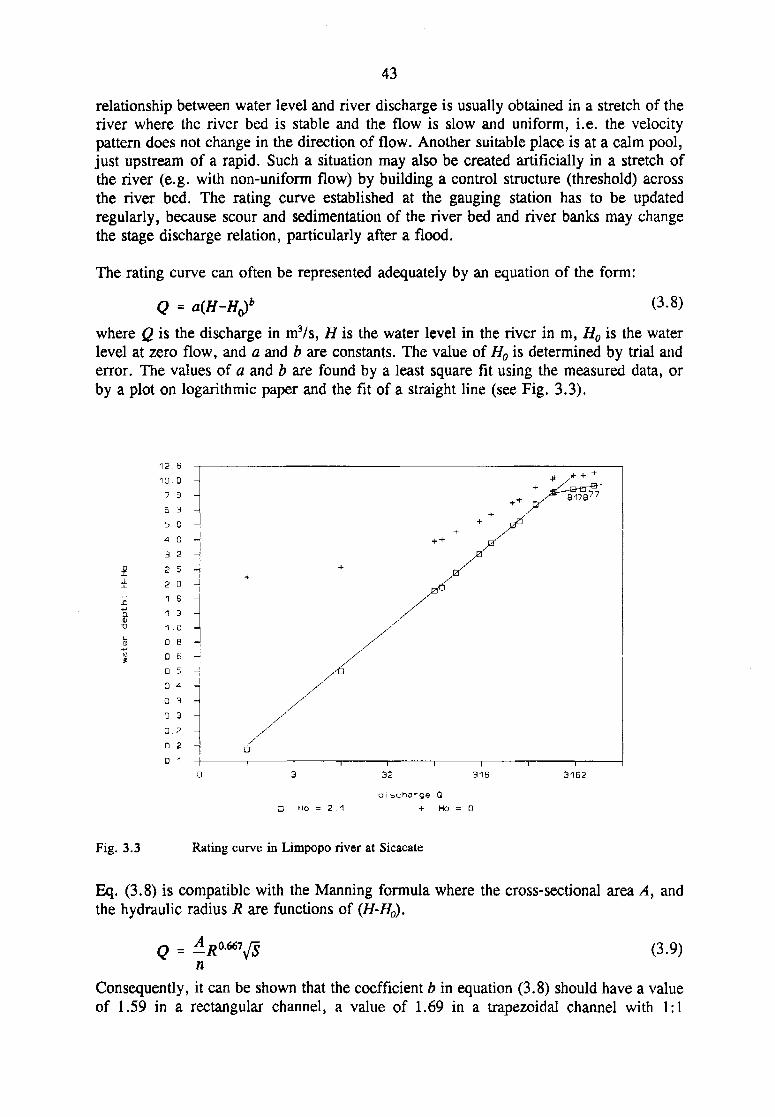
43
relationship between water level and river discharge is usually obtained in a stretch of theriver where the river bed is stable and the flow is slow and uniform, i.e. the velocitypattern does not change in the direction of flow. Another suitable place is at a calm pool,just upstream of a rapid. Such a situation may also be created artificially in a stretch ofthe river (e.g. with non-uniform flow) by building a control structure (threshold) acrossthe river bed. The rating curve established at the gauging station has to be updatedregularly, because scour and sedimentation of the river bed and river banks may changethe stage discharge relation, particularly after a flood.
The rating curve can often be represented adequately by an equation of the form:
(3.8)<? = a{H-H<)b
where Q is the discharge in m3/s, H is the water level in the river in m, Ho is the waterlevel at zero flow, and a and b are constants. The value of Ho is determined by trial anderror. The values of a and b are found by a least square fit using the measured data, orby a plot on logarithmic paper and the fit of a straight line (see Fig. 3.3).
316 3162
2, 1CJ i scharge Q
+ HO = D
Fig. 3.3 Rating curve in Limpopo river at Sicacate
Eq. (3.8) is compatible with the Manning formula where the cross-sectional area A, andthe hydraulic radius R are functions of (H-Ho).
Q = ±n
(3.9)
Consequently, it can be shown that the coefficient b in equation (3.8) should have a valueof 1.59 in a rectangular channel, a value of 1.69 in a trapezoidal channel with 1:1
44
sideslopes, a value of 2.16 in a parabolic channel, and a value of 2.67 in a triangularchannel.
Fig. 3.3 shows the rating curve of the Limpopo river at Sicacate; the value of b equals1.90. The Limpopo is an intermittent river which falls dry in the dry season and can havevery high flash floods during the flood season. The station of Sicacate has a value of Ho
equal to 2.1 m. In Fig. 3.3 a clear flood branch can be distinguished which is based onpeak flows recorded during the floods of 1981, 1977 and 1978 in the Limpopo river. Thegradient of a flood branch becomes flat as the river enters the flood plain; a small increasein water level then results in a large increase in discharge.
To illustrate the trial and error procedure in determining the value of Ho, a plot of datawith H0=0 has been added. It can be seen that the value of Ho particularly affects thedetermination of low flow.
For the methods of measuring water levels and flows one should refer to the lectures onHydrometry. Making use of the rating curve, a time series of water levels can betransformed into runoff series.
Water quality
The total water resources of a catchment are formed by the sum of surface water andgroundwater. Both resources may not be considered separately from the water quality.Abundant water resources of poor quality are still useless for consumption. A consumerof water who pollutes the water resources system through its return flows, consumes infact much more water than its actual consumption, as he makes the remaining wateruseless.
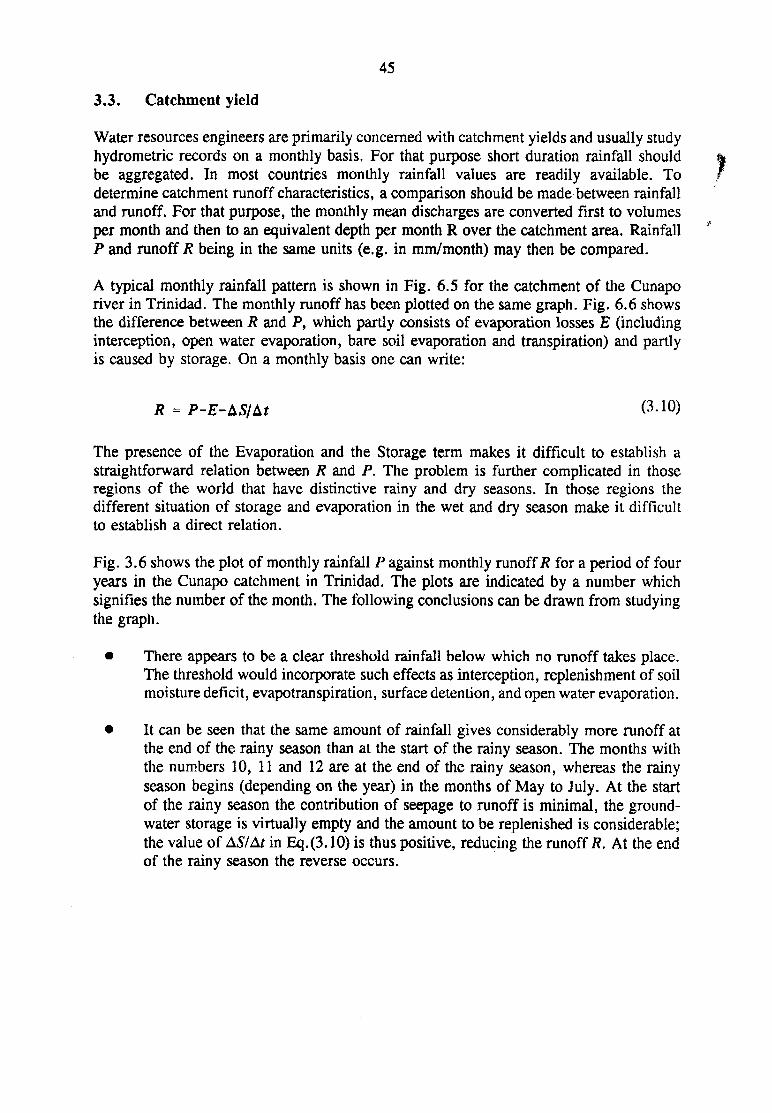
45
3.3. Catchment yield
Water resources engineers are primarily concerned with catchment yields and usually studyhydrometric records on a monthly basis. For that purpose short duration rainfall shouldbe aggregated. In most countries monthly rainfall values are readily available. Todetermine catchment runoff characteristics, a comparison should be made between rainfalland runoff. For that purpose, the monthly mean discharges are converted first to volumesper month and then to an equivalent depth per month R over the catchment area. RainfallP and runoffs being in the same units (e.g. in mm/month) may then be compared.
A typical monthly rainfall pattern is shown in Fig. 6.5 for the catchment of the Cunaporiver in Trinidad. The monthly runoff has been plotted on the same graph. Fig. 6.6 showsthe difference between R and P, which partly consists of evaporation losses E (includinginterception, open water evaporation, bare soil evaporation and transpiration) and partlyis caused by storage. On a monthly basis one can write:
R = P-E-LSILt (3-10)
The presence of the Evaporation and the Storage term makes it difficult to establish astraightforward relation between R and P. The problem is further complicated in thoseregions of the world that have distinctive rainy and dry seasons. In those regions thedifferent situation of storage and evaporation in the wet and dry season make it difficultto establish a direct relation.
Fig. 3.6 shows the plot of monthly rainfall P against monthly runoff if? for a period of fouryears in the Cunapo catchment in Trinidad. The plots are indicated by a number whichsignifies the number of the month. The following conclusions can be drawn from studyingthe graph.
• There appears to be a clear threshold rainfall below which no runoff takes place.The threshold would incorporate such effects as interception, replenishment of soilmoisture deficit, evapotranspiration, surface detention, and open water evaporation.
• It can be seen that the same amount of rainfall gives considerably more runoff atthe end of the rainy season than at the start of the rainy season. The months withthe numbers 10, 11 and 12 are at the end of the rainy season, whereas the rainyseason begins (depending on the year) in the months of May to July. At the startof the rainy season the contribution of seepage to runoff is minimal, the ground-water storage is virtually empty and the amount to be replenished is considerable;the value of AS/At in Eq.(3.10) is thus positive, reducing the runoff #. At the endof the rainy season the reverse occurs.
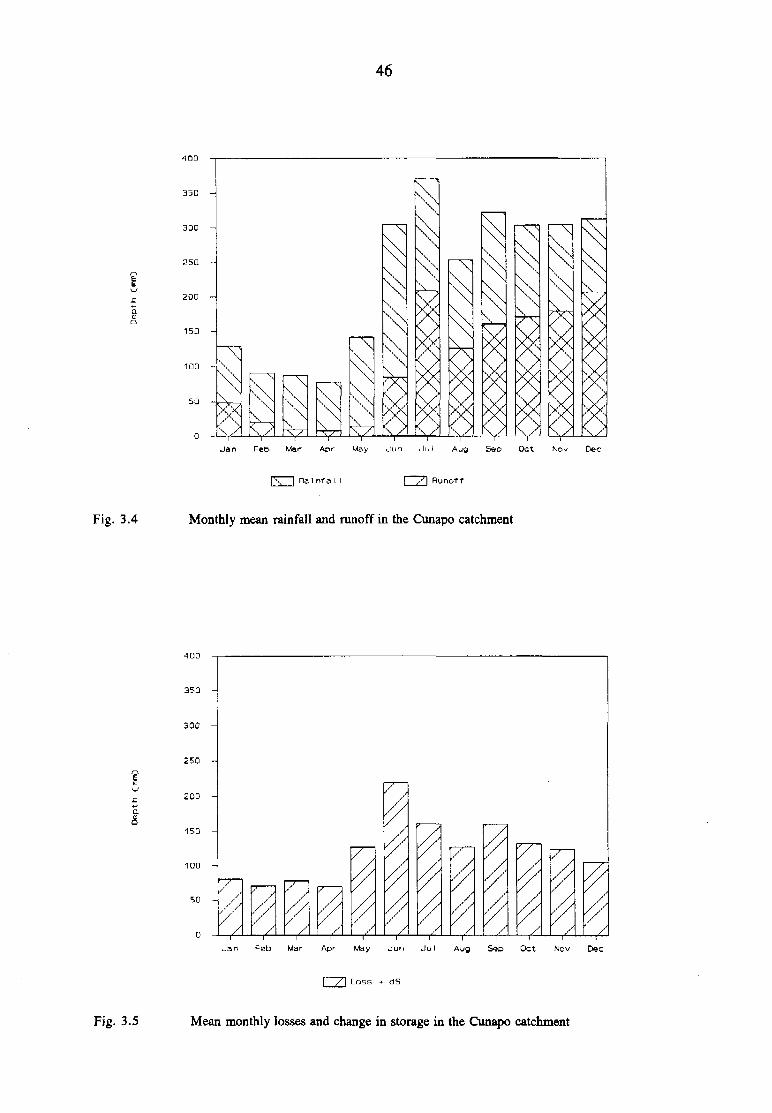
150 -
46
^ ^\y
\
\/ \/
7\
\ / \ / \ /Jan Feb Mar Apr May Jun Jul Aug Sap Oct. Nov Dec
| /\ Runoff
Fig. 3.4 Monthly mean rainfall and runoff in the Cunapo catchment
&
300 -
250 -
200 -
7 /
A ^JL —A —A _ Z —A —A _A _A _A _A _AJan Feb Mar Apr May Jun Jul Aug Sop Oct Nov Dec
Loss + dS
Fig. 3.5 Mean monthly losses and change in storage in the Cunapo catchment

47
The threshold rainfall is quite in agreement with Eq.(3.10) and has more physical meaningthan the commonly used proportional losses. Proportional losses are rather a result ofaveraging. They can be derived from the fact that a high amount of monthly rainfall isliable to have occurred during a large number of rainy days, so that threshold losses likeinterception and open water evaporation have occurred a corresponding number of times.
35D -
300 -
250 -
200 -
150 -
100 -
50 -
0 -
1D
129
8 1011 ^
72 8 11
-I 2 4 9 6
12 3 3 2 6
9S
12-12
1 0 7
7
1
911 9
11 1 7
12g
B 7 61210 7
s89
5 6 6
2DD
R a i n f a l l (mm/month)
4 0 0
Fig. 3.6 Rainfall plotted versus runoff in the Cunapo river basin
By taking into account the threshold loss T and the groundwater storage S, a relation canbe obtained between R and P. The following model, which can easily be made in aspreadsheet, has been developed for that purpose.
Moving average model for monthly runoff using threshold losses
As the amount of storage available during a particular month depends on the amount ofrainfall in the previous months, a relation is sought that relates the runoff in a particularmonth to the rainfall in the month itself and the previous months. A simple linearbackward relation is used:
Rt = a * bo(Pt-T) (3.11)
under the condition that if (P,_rT) < 0, then (/>.r7) = 0
T is the threshold loss on a monthly basis, />, is the coefficient that determines thecontribution of the effective rainfall in month t-i to the runoff in month t (proportional
48
loss); and a is a coefficient which should be zero if the full set of rainfall contributions andlosses were taken into account.
In matrix notation Eq. (3.11) reads:
Rt = B(P-T) + a (3.12)
where Rt is a scalar, the runoff in month t, B is an n by 1 matrix containing thecoefficients bt and (P-T) is a state vector of 1 by n containing the effective monthlyprecipitation values of the present and previous months. The value n-\ determines thememory of the system. Obviously n should never be more than 12, to avoid spuriouscorrelation, but in practice n is seldom more than 6 to 7.
The effective runoff coefficient C, on a water year basis, is defined as:
C = - * - (3.13)P-T
where P and R are the annual rainfall and runoff on a water year basis. It can be seenfrom comparison of Eq.'s (3.12) and (3.13) that (if the coefficient a equals zero) the sumof the coefficients in B should equal the effective runoff coefficient C:
= C (6.8)
meaning that the total amount of runoff that a certain net rainfall generates is the sum ofall the components over n months. Obviously C should not be larger than unity.
The coefficients of B are determined through multiple linear regression. For the exampleof Fig. 3.6 these results are presented in Table 3.1. Although the best correlation isobtained with a memory of 5 months, the most significant step is made by including thefirst month back. Moreover it can be seen that the correlation substantially improves bytaking into account the threshold rainfall. Fig. 3.7 shows the comparison betweencomputed and measured runoff for a threshold value T — 120 mm/month.

49
Threshold value: T = 0Average effective runoff coefficient: C = 0.45
t t-1 t-2 t-3 t-4 t-5 t-6R2 0.74 0.75 0.76 0.76 0.77 0.78 0.81Se 53.5 53.5 52.8 52.9 51.5 51.2 47.5
Threshold value: T = 120Average effective runoff coefficient: C = 0.85
t t-1 t-2 t-3 t-4 t-5 t-6R3 0.83 0.88 0.88 0.89 0.89 0.90 0.90Se 43.7 37.0 37.1 36.1 36.1 35.0 35.1
Result best regression:
Memory:constant:
i = 5 monthsa = -30
Coefficients: 0.75 0.21 - 0 . 0 0,05 0.01 0.09
Table 3.1 Summary of correlation Cunapo catchment
3
100
350 -
3DD -
250 -
200 -
150 -
30 -
100
Runoff
perfect agreement
200 300 400
Fig. 3.7 Measured versus computed runoff in the Cunapo catchment (T= 120)
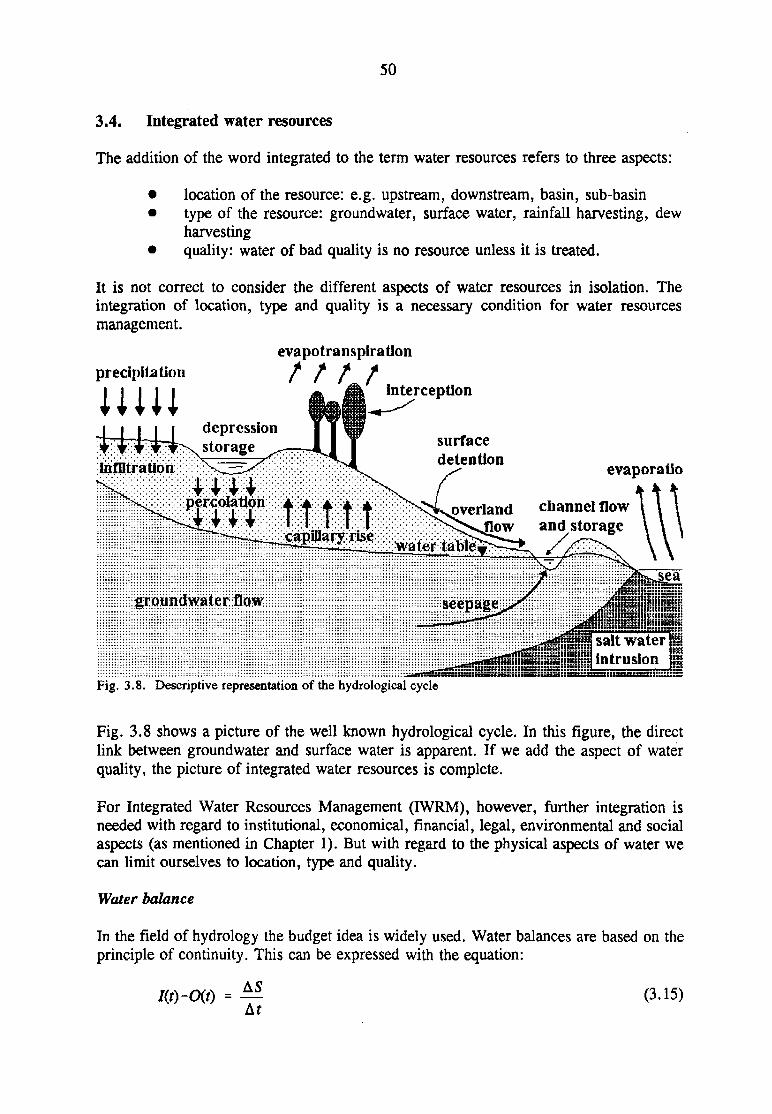
50
3.4. Integrated water resources
The addition of the word integrated to the term water resources refers to three aspects:
• location of the resource: e.g. upstream, downstream, basin, sub-basin• type of the resource: groundwater, surface water, rainfall harvesting, dew
harvesting• quality: water of bad quality is no resource unless it is treated.
It is not correct to consider the different aspects of water resources in isolation. Theintegration of location, type and quality is a necessary condition for water resourcesmanagement.
precipitation
milevapo transpiration
interception
evaporatio
depressionstorage surface
detentioninfiltration
percolation overland channel flowow and storage
Water table
groundwater flow
3.8. Descriptive representation of the hydrological cycle
Fig. 3.8 shows a picture of the well known hydrological cycle. In this figure, the directlink between groundwater and surface water is apparent. If we add the aspect of waterquality, the picture of integrated water resources is complete.
For Integrated Water Resources Management (IWRM), however, further integration isneeded with regard to institutional, economical, financial, legal, environmental and socialaspects (as mentioned in Chapter 1). But with regard to the physical aspects of water wecan limit ourselves to location, type and quality.
Water balance
In the field of hydrology the budget idea is widely used. Water balances are based on theprinciple of continuity. This can be expressed with the equation:
7(0-0(0 = ^ (3.15)
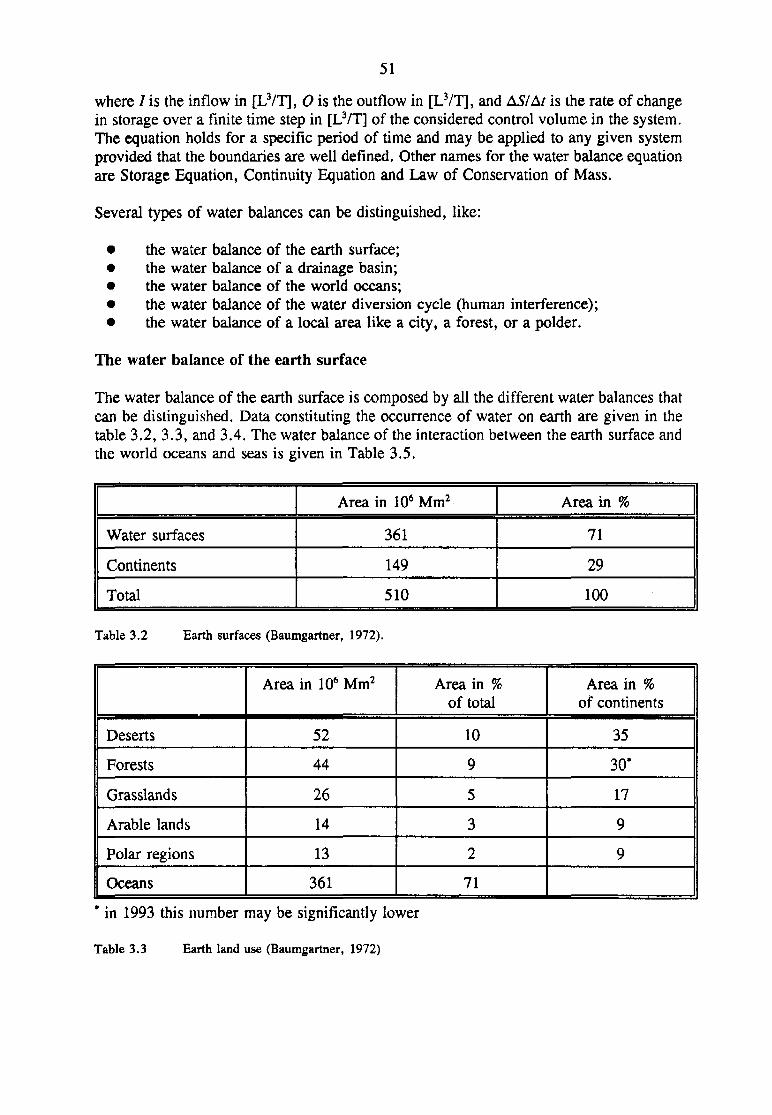
51
where / is the inflow in [L3/T], O is the outflow in [L3/T], and AS/At is the rate of changein storage over a finite time step in [L3/T] of the considered control volume in the system.The equation holds for a specific period of time and may be applied to any given systemprovided that the boundaries are well defined. Other names for the water balance equationare Storage Equation, Continuity Equation and Law of Conservation of Mass.
Several types of water balances can be distinguished, like:
the water balance of the earth surface;the water balance of a drainage basin;the water balance of the world oceans;the water balance of the water diversion cycle (human interference);the water balance of a local area like a city, a forest, or a polder.
The water balance of the earth surface
The water balance of the earth surface is composed by all the different water balances thatcan be distinguished. Data constituting the occurrence of water on earth are given in thetable 3.2, 3.3, and 3.4. The water balance of the interaction between the earth surface andthe world oceans and seas is given in Table 3.5.
Water surfaces
Continents
Total
Area in 106 Mm2
361
149
510
Area in %
71
29
100
Table 3.2 Earth surfaces (Baumgartner, 1972).
Deserts
Forests
Grasslands
Arable lands
Polar regions
Oceans
Area in 106 Mm2
52
44
26
14
13
361
Area in %of total
10
9
5
3
2
71
Area in %of continents
35
30*
17
9
9
* in 1993 this number may be significantly lower
Table 3.3 Earth land use (Baumgartner, 1972)

52
Water Occurrence
World Oceans
Salt lakes/seas
Polar ice
Atmospheric water
Water in organisms
Fresh lakes
Water courses
Unsaturated zone
Saturated zone
Total fresh water
Total water
l tfGm3
1300000
100
28500
12
1
123
1
65
8000
36700
1337000
Amount of water
% of water
97
0.008
2.14
0.001
0.000
0.009
0.000
0.005
0.60
2.77
100
% of fresh water
77.6
0.035
0.003
0.335
0.003
0.18
21.8
100
Table 3.4 Amount of water on earth according to the survey conducted within the internationalgeophysical year (Holy, 1982)
Region
Oceans
Continents
Area
106 Mm2
361
149
Precipitation
m
1.12
0.72
103Gm3
403
107
Evaporation
m
1.25
0.41
KPGm3
449
61
Runoff
m
-0.13
0.31
103 Gm3
-46
46
Table 3.5 Annual water balance of the earth according to the international geophysical year (Holy1982)
Ocean
Arctic
Atlantic
Indian
Pacific
surfacearea
1012 m2
8.5
98
77.7
176.9
P-E
mm
44
-372
-251
90
landrunoff
mm
307
197
72
69
oceanexchange
mm
351
-175
-179
159
P-E
1012 m3
0.4
-36.5
-19.5
15.9
landrunoff
1012 m3
2.6
19.3
5.6
12.2
oceanexchange
1012 m3
3
-17
-14
28
m3/s
94544
-543466
-440739
891318
Table 3.6 Annual water balance of World Oceans
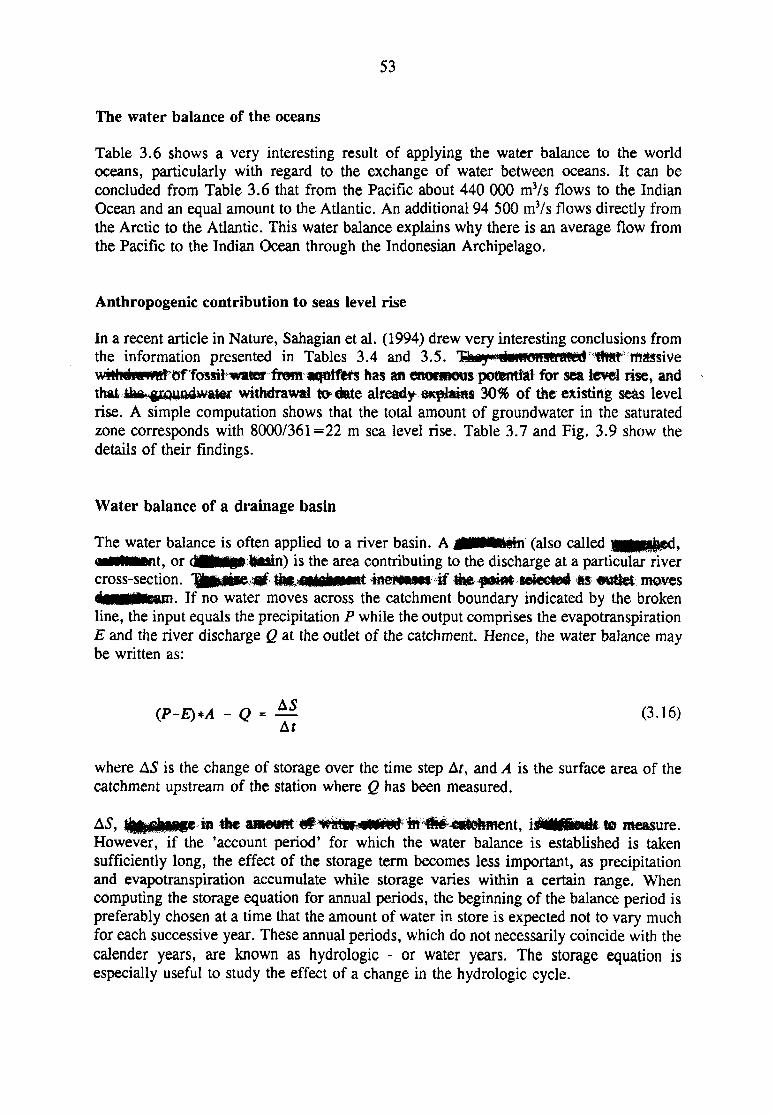
53
The water balance of the oceans
Table 3.6 shows a very interesting result of applying the water balance to the worldoceans, particularly with regard to the exchange of water between oceans. It can beconcluded from Table 3.6 that from the Pacific about 440 000 mVs flows to the IndianOcean and an equal amount to the Atlantic. An additional 94 500 mVs flows directly fromthe Arctic to the Atlantic. This water balance explains why there is an average flow fromthe Pacific to the Indian Ocean through the Indonesian Archipelago.
Anthropogenic contribution to seas level rise
In a recent article in Nature, Sahagian et al. (1994) drew very interesting conclusions fromthe information presented in Tables 3.4 and 3.5. Ttwy^wrrOTlffra^d that massivewHlrilwwwfefTo«i^>watg-l!^9ln'l<^atfft^s^ll^as an eiiormotts potential lor sea level rise, andthat ite~£j:«u»4wator withdrawal to date already explains 30% of the existing seas levelrise. A simple computation shows that the total amount of groundwater in the saturatedzone corresponds with 8000/361=22 m sea level rise. Table 3.7 and Fig. 3.9 show thedetails of their findings.
Water balance of a drainage basin
The water balance is often applied to a river basin. A JflMMl&n (also calledmtttmmnt, or dtflM§e twain) is the area contributing to the discharge at a particular rivercross-section. Tjjutir* mf flit fUriwnr-* "-^TTITIT if the pomt selected as wttket movesohMMMeam. If no water moves across the catchment boundary indicated by the brokenline, the input equals the precipitation P while the output comprises the evapotranspirationE and the river discharge Q at the outlet of the catchment. Hence, the water balance maybe written as:
(P-E)*A - Q = ™ (3.16)At
where AS is the change of storage over the time step At, and A is the surface area of thecatchment upstream of the station where Q has been measured.
AS, tfcfc t̂oftge in the awoort <rf *^^^ U l t i m a to measure.However, if the 'account period' for which the water balance is established is takensufficiently long, the effect of the storage term becomes less important, as precipitationand evapotranspiration accumulate while storage varies within a certain range. Whencomputing the storage equation for annual periods, the beginning of the balance period ispreferably chosen at a time that the amount of water in store is expected not to vary muchfor each successive year. These annual periods, which do not necessarily coincide with thecalender years, are known as hydrologic - or water years. The storage equation isespecially useful to study the effect of a change in the hydrologic cycle.
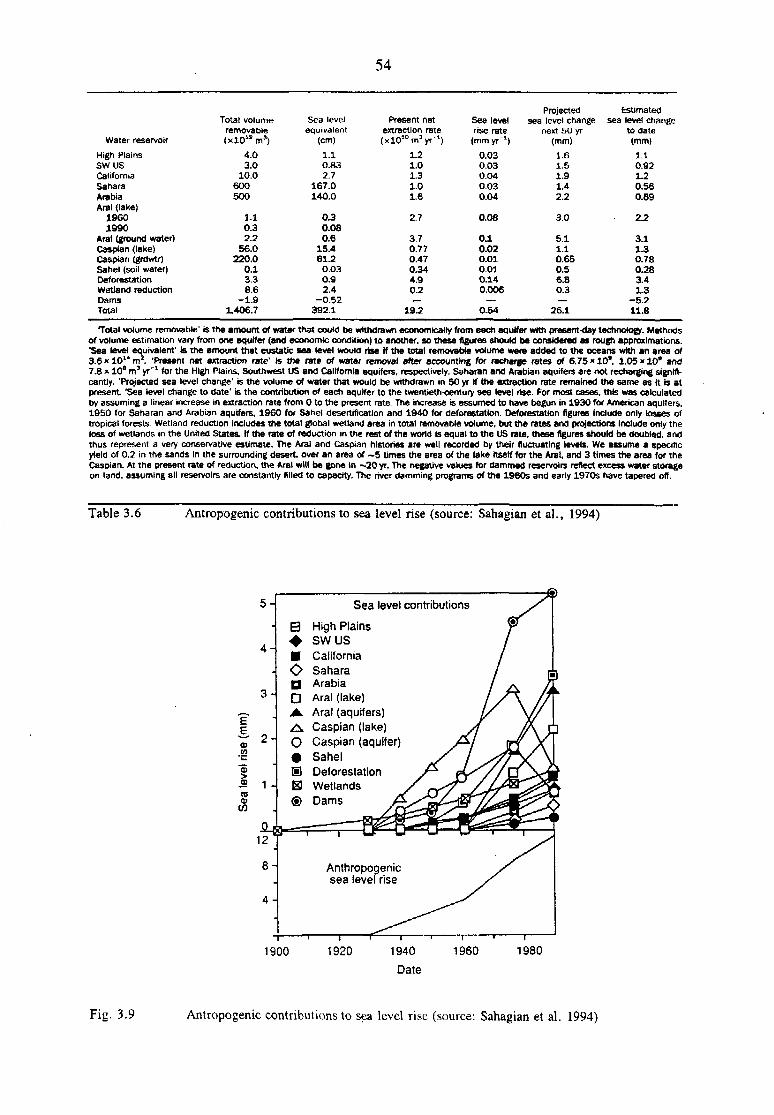
54
Water reservoir
High PlainsSWUSCaliforniaSaharaArabiaAral (lake)
19601990
Aral (ground water)Caspian (lake)Caspian (grdwtr)Sahel (soil water)DeforestationWetland reductionDamsTotal
Total volumeremovable(x lO"m 3 )
4.03.0
10.06 0 0500
1.10.32.2
56.0220.0
0.13.38.6
-1.91.406.7
Sea levelequivalent
(cm)
1.10.832.7
167.0140.0
0.30.080.6
1S.461.20.030.92.4
-0.52392.1
Present netextraction rate(xlO^mV-1)
1.21.01.31.01.6
2.7
3.70.770.470.344.90.2_
19.2
Sea levelrise rate
(mmyr"1)
0.030.030.040.030.04
0.08
0.10.020.010.010.140.006
—0.54
Projectedsea level change
new 50 yr(mm)
1.61.51.91.42.2
3.0
5.11.10.650.56.80.3—
26.1
Estimatedsea level change
to date(mm)
1.10.921.20.560.89
2.2
3.11.30.780.283.43L3
-5.211.8
Total volume removable' is the amount of water that could be withdrawn economically from each aquifer with present-day technology. Methodsof volume estimation vary from one aquifer (and economic condition) to another, so these figures should be considered as rough approximations.•Sea level equivalent' is the amount that eustatic sea level would rise if the total removable volume were added to the oceans with an area of3.6 x 1 0 " mJ. 'Present net extraction rate' is the rate of water removal after accounting for recharge rates of 6.75 * 10*, 1.05 «10* and7.8 x 10s m3 yr'1 for the High Plains, Southwest US and California aquifers, respectively. Saharan and Arabian aquifers are not recharging signifi-cantly. 'Projected sea level change' is the volume of water that would be withdrawn in 50 yr tf the extraction rate remained the same as it is atpresent 'Sea level change to date' is the contribution of each aquifer to the twentieth-century sea level rise. For most cases, this was calculatedby assuming a linear increase in extraction rate from 0 to the present rate. The increase is assumed to have begun in 1930 for American aquifers,1950 for Saharan and Arabian aquifers, 1960 for Sahel desertification and 1940 for deforestation. Deforestation figures include only losses oftropical forests. Wetland reduction includes the total global wetland area in total removable volume, but the rates and projections include only theloss of wetlands in the United States. If the rate of reduction in the rest of the world is equal to the US rate, these figures should be doubled, andthus represent a very conservative estimate. The Aral and Caspian histories are well recorded by their fluctuating levels. We assume a specificyield of 0.2 in the sands in the surrounding desert over an area of ~5 times the area of the lake Itself for the Aral, and 3 times the area for theCaspian. At the present rate of reduction, the Aral will tie gone in —20 yr. The negative values for dammed reservoirs reflect excess water storageon land, assuming all reservoirs are constantly filled to capacity. The river damming programs of the 1960s and early 1970s have tapered off.
Table 3.6 Antropogenic contributions to sea level rise (source: Sahagian et al., 1994)
5 -
•
A
4 -
3 -
E
£ 1 -
Sea
B••oDDA.A .O
- %B
®
Sea level contributions jf
High Plains J>SWUS /California /Sahara / rArabia / * /Aral (lake) 1 / \ ffAral (aquifers) / / \j/Caspian (lake) / K \Caspian (aquifer) A *J{ YSahel X 1 s7/yC \Deforestation A- e^//u\JkWetlands / ~S7 / J ^ ^ ^Dams /ks^tt-'^TZ^K^JL
4 -
Anthropogenicsea level rise
1900 1920 1960 1980
Fig. 3.9 Antropogenic contributions to sea level rise (source: Sahagian et al. 1994)
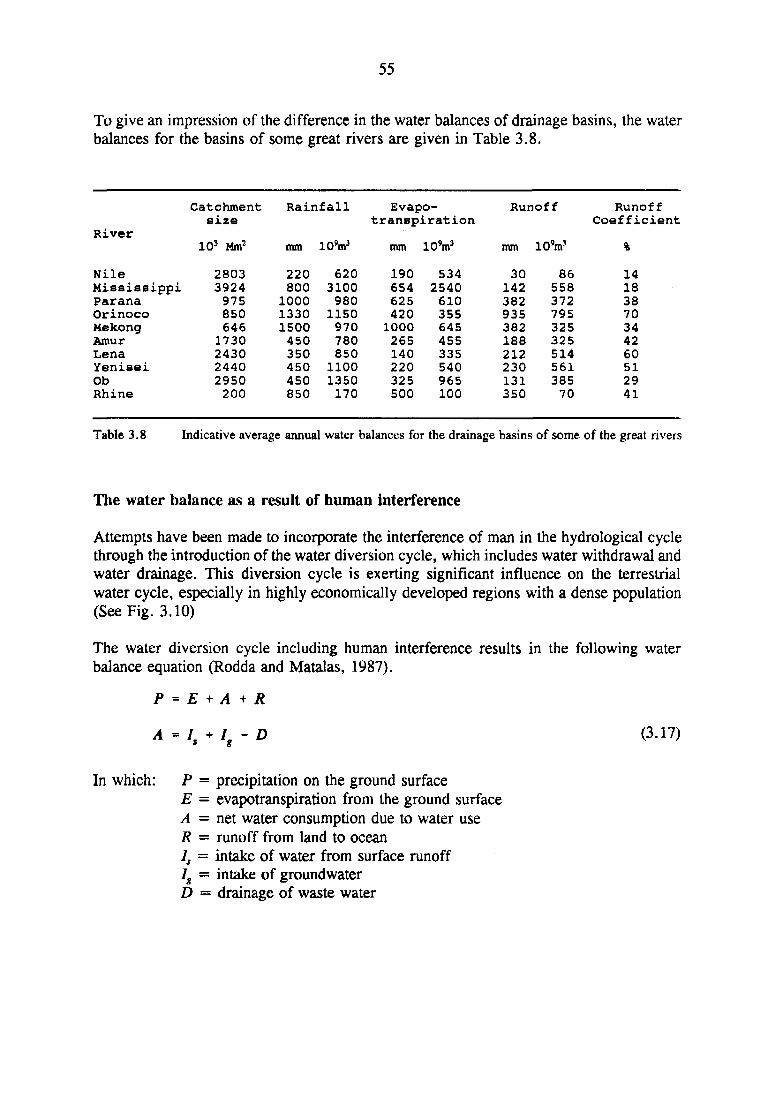
55
To give an impression of the difference in the water balances of drainage basins, the waterbalances for the basins of some great rivers are given in Table 3.8.
River
NileMississippiParanaOrinocoMekongAmurLenaYeniseiObRhine
Catchmentsize
103 Mm2
28033924975850646
1730243024402950200
Rainfall
mm
220800100013301500450350450450850
10'm3
6203100980
1150970780850
11001350170
Evapo-transpiration
mm
1906546254201000265140220325500
10W
5342540610355645455335540965100
Runoff
mm '.
30142382935382188212230131350
LOW
8655837279532532551456138570
RunoffCoefficient
%
14183870344260512941
Table 3.8 Indicative average annual water balances for the drainage basins of some of the great rivers
The water balance as a result of human interference
Attempts have been made to incorporate the interference of man in the hydrological cyclethrough the introduction of the water diversion cycle, which includes water withdrawal andwater drainage. This diversion cycle is exerting significant influence on the terrestrialwater cycle, especially in highly economically developed regions with a dense population(See Fig. 3.10)
The water diversion cycle including human interference results in the following waterbalance equation (Rodda and Matalas, 1987).
P = E + A + R
A = / . + / - D (3.17)
In which: P = precipitation on the ground surfaceE = evapotranspiration from the ground surfaceA = net water consumption due to water useR = runoff from land to ocean/j = intake of water from surface runoffIg = intake of groundwaterD = drainage of waste water
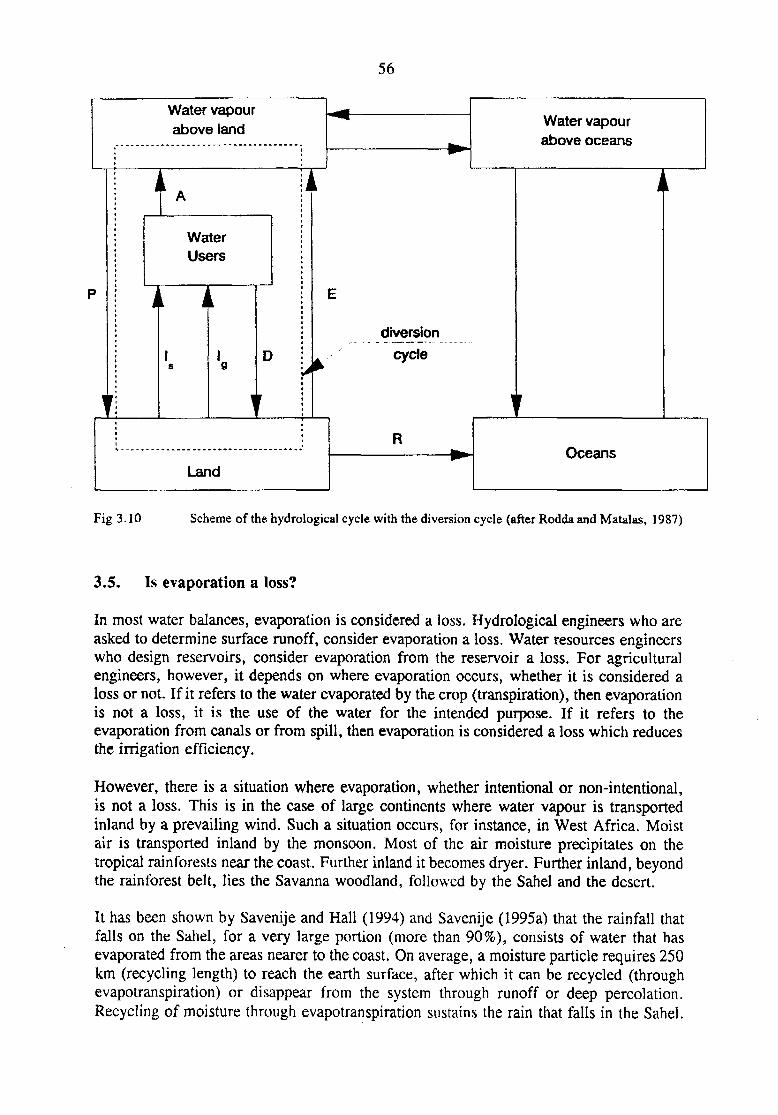
56
Water vapourabove land
WaterUsers
i^sD
1
Water vapourabove oceans
diversioncycle
Land
ROceans
Fig 3.10 Scheme of the hydrological cycle with the diversion cycle (after Rodda and Matalas, 1987)
3.5. Is evaporation a loss?
In most water balances, evaporation is considered a loss. Hydrological engineers who areasked to determine surface runoff, consider evaporation a loss. Water resources engineerswho design reservoirs, consider evaporation from the reservoir a loss. For agriculturalengineers, however, it depends on where evaporation occurs, whether it is considered aloss or not. If it refers to the water evaporated by the crop (transpiration), then evaporationis not a loss, it is the use of the water for the intended purpose. If it refers to theevaporation from canals or from spill, then evaporation is considered a loss which reducesthe irrigation efficiency.
However, there is a situation where evaporation, whether intentional or non-intentional,is not a loss. This is in the case of large continents where water vapour is transportedinland by a prevailing wind. Such a situation occurs, for instance, in West Africa. Moistair is transported inland by the monsoon. Most of the air moisture precipitates on thetropical rainforests near the coast. Further inland it becomes dryer. Further inland, beyondthe rainforest belt, lies the Savanna woodland, followed by the Sahel and the desert.
It has been shown by Savenije and Hall (1994) and Savenije (1995a) that the rainfall thatfalls on the Sahel, for a very large portion (more than 90%), consists of water that hasevaporated from the areas nearer to the coast. On average, a moisture particle requires 250km (recycling length) to reach the earth surface, after which it can be recycled (throughevapotranspiration) or disappear from the system through runoff or deep percolation.Recycling of moisture through evapotranspiration sustains the rain that falls in the Sahel.
57
Evaporation in the rainforest and the savanna woodlands, hence, is essential for the climatein the Sahel. In this case, evaporation is not a loss, it is the most important source ofrainfall further inland.
On a river basin scale, it can be shown that the portion of the rainfall that is recycled fromevapotranspiration approaches 1-CR (where CR is the runoff coefficient), and that theaverage number of times that a water particle is recycled approaches \ICR (Savenije,1995b). In semi-arid river basins, where a runoff coefficient of 10% is not abnormal, thisimplied that 90% of the rainfall stems from recycled moisture and that, on average, awater particle returns ten times to the earth surface as rainfall. Ifc&iUws th&t in semi-arid
evaporating capacity.
In the Sahel, evaporation is not a loss. What is a loss to the system is surface runoff. Notonly does it extract water from the system, it also carries nutrients and soil particles.
of runoff and, benee, increase M heeAmmpotation is an important element ofng. Measures that can be used to decrease runoff are reforestation, erosion
control, watershed management, restoration of infiltration capacity, forest-fire preventionand prevention of over-grazing.

58
59
4. WATER DEMAND
4.1. General
Man uses water resources in many ways. All water users, through their consumption oruse, affect the state of the water resource system, in one way or another. However, thedegree at which the different water uses affect the state of the system are quite different.Where some types of water uses require large amounts of water of moderate quality (e.g.for irrigation), others require only small quantities of a very high quality (e.g. fordomestic water supply), and again others just make use of it without really influencing thestate of the resource (e.g. for fisheries). The most common types of water use are:
HydropowerIrrigationDomestic and public useRural use (domestic and livestock)Industrial useCommercial useCoolingWaste and wastewater disposalNavigationRecreationFisheriesWildlife and nature preservation
A distinction is made between gUtfft&ai use and iijiHlfi|1"i|1|ii • ill use. Withdrawal usesare from diversion of water from groundwater or surface water sources such ashydropower, irrigation, domestic, rural, industrial and commercial water supply andcooling. Nonwithdrawal uses are on-site uses such as navigation, fisheries, wildlife, water-based recreation, and wastewater disposal by dilution.
Withdrawal use is subdivided into QMBwu£iye and mMiiimirmtrT use. Consumptive useis the portion of the water withdrawn that is no longer available for further use becauseof evaporation, transpiration, incorporation into manufactured products and crops, or useby human beings and livestock. The terms "consumption" and "demand" are oftenconfused. This is not correct, since only a portion of the water demand is actuallyconsumed, i.e**fo|fcfrom the water resource system.
One could argue that certain nonwithdrawal uses are consumptive uses as well.ftijjfwal and prttetim, for instance, may turn the available water resources worthless forfurther use, which is the same as withdrawing the water from the water resource system.
There is a generally increasing demand for water throughout the world. As populations andliving standards grow and economies develop, the demands made upon water resourcescontinue to increase. But if the demand grows, then what about the supply; can the supplycontinue growing as well? Clearly the basic resource does not alter; the total amount ofwater entering the hydrological cycle is limited, and hence the amount we can withdrawfrom it. Already in many developing regions, much of the demand is unsatisfied becauseof inadequate water supplies. Can technology help to reduce or limit the demand?
60
Future demands for water by the different users may be affected by technologicaldevelopments. Technological developments that will increase the demand for water are forinstance:
• Water cooled nuclear power generation• Gas production from coal• Electrification of railways etc.
Technological developments that will decrease future demands for fresh water are forinstance:
Gas cooled nuclear power generationPower generation by nuclear fusionWind and hydropower generationRecirculation of cooling waterImproved cooling tower technologyAir coolingNo-rinse washing technologyBioprocessing to provide foodGenetic development of drought resistant plantsSubirrigation and drip irrigationDesalinization of sea water
Of some technological developments it is not clear whether they will increase or reducewater demands; for example:
• Solar energy generation• Geothermal energy generation• Advanced communication systems• Environmental management
Although technology may help to reduce demand, this will probably not be enough. Toprevent the mining of limited resources, it will be necessary to reduce the demands of theindividual users.
There are substantial differences in per capita demands between countries and betweenregions. Differences in demand are attributed to both natural and economic factors. Morewater is used in warm and dry regions than in temperate and humid areas, due toirrigation, bathing and air conditioning. Of the various climatic influences, precipitationappears to have the greatest effect on per capita demand, primarily as a result of irrigationwater demands. The living standard of the population also affects the demand. Waterconsumption increases with an increase in living standard.
Before investigating the possibilities to influence demand (see Section 4.3), we shallanalyze the demand and techniques to forecast demand.

61
4.2. Projections of water demand
Population projections (source: Goodman, 1984)
For almost every water resource project, population projections (total and arealdistribution) are needed to accomplish one or more of the following:
• Estimate demands for specific outputs of the water resource project(municipal water supply, power, etc.)
• Assess the likelihood that a project built to exploit a water resource will findan adequate market.
• Schedule the implementation, including staged development, of waterresource projects.
• Provide the population component in a regional economic model. Such amodel predicts, among other things, the need for various types of projectoutputs and the economic impacts attributable to the water resourcesdevelopment.
So Old. So FastSmaller families and longer lives
coultf mean Irouble lor pensioner
Population projections should be made for the short term (2to 5 years) and for the medium term (5 to 10 years).Projections for the long term future (more than 10 years) aregenerally useless for strategic planning purposes, because oftoo much uncertainty, but they may serve as an indicativeestimate. Such an estimate may be particularly useful whenresources are limited. Forecasts made could be used to createawareness with politicians that something substantial has tobe done to solve future problems. The projections, however,are too insecure to be used as a basis for planning.
we may conciade that long term forecastsor never been evea close to correct. In the
United States low estimates made during the economicdepression of the 1930s differed substantially from post-World War II values due to the post-war baby boom and theincrease of migration to urban areas. Also, extrapolationsbased on post-World War II growth rates appeared to be toohigh due to a reduction of the birthrate. Over the lastdecades, all over the world, surprise changes have occurredthat caused growth rates to seriously deviate fromprojections. Some of these unexpected changes are: theoutbreak of wars, migration by refugees, political changes,the oil crisis, economic recession or economic revival,migration to urban areas, etc.
On the short and medium term, an inaccurate forecast wouldgenerally mean that the schedule for implementation of agroup of phased projects must be speeded up or sloweddown; but sometimes serious problems may arise. Forexample, a project may be a financial (or economic) failureif inadequate revenues (or benefits) are realized due to overoptimistic projections.
EwlAwi —1956Tcul POBUUIXHI 732 mHliai
EulAsii —1990TeW pwublim 1.336 rotfnw
Eiitnir—2025roWflOUutfoon 1,737 mlllton
Male*
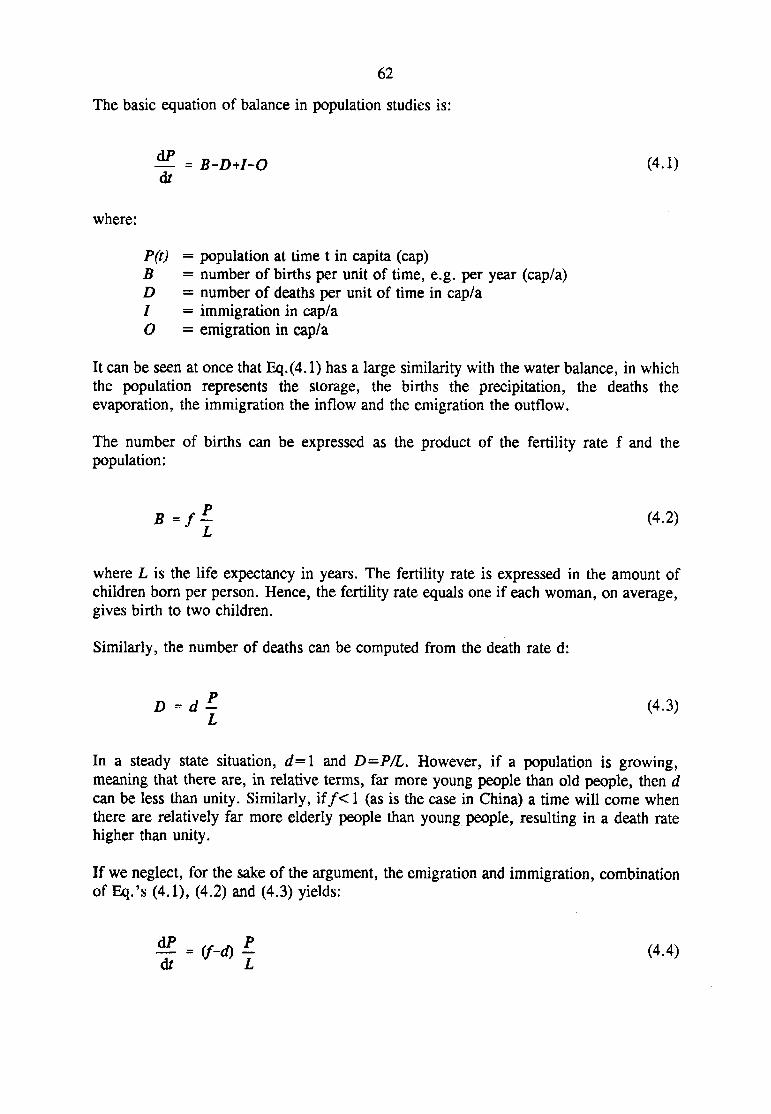
62
The basic equation of balance in population studies is:
— = B-D+I-0 (4.1)d/
where:
P(t) = population at time t in capita (cap)B = number of births per unit of time, e.g. per year (cap/a)D = number of deaths per unit of time in cap/a/ = immigration in cap/aO = emigration in cap/a
It can be seen at once that Eq.(4.1) has a large similarity with the water balance, in whichthe population represents the storage, the births the precipitation, the deaths theevaporation, the immigration the inflow and the emigration the outflow.
The number of births can be expressed as the product of the fertility rate f and thepopulation:
B = f £ (4.2)
where L is the life expectancy in years. The fertility rate is expressed in the amount ofchildren born per person. Hence, the fertility rate equals one if each woman, on average,gives birth to two children.
Similarly, the number of deaths can be computed from the death rate d:
D-d- (4.3)
In a steady state situation, d=\ and D=P/L. However, if a population is growing,meaning that there are, in relative terms, far more young people than old people, then dcan be less than unity. Similarly, i f /< 1 (as is the case in China) a time will come whenthere are relatively far more elderly people than young people, resulting in a death ratehigher than unity.
If we neglect, for the sake of the argument, the emigration and immigration, combinationof Eq.'s (4.1), (4.2) and (4.3) yields:
at L

63
A t = 90
eoAge of people Cyeors}+ t=30 o t=60
t=13O V t=15O
100 120
Fig.4.1 Population distribution over age classes (population pyramid) as a function of time
If / and d are constants, then the solution of Eq.(4.4) is an exponential equation of thetype:
P(t) = (4.5)
If (f-d) > 0, meaning that per capita more children are born than that people die, then thepopulation increases exponentially. Iff=d, the population is constant. In China, where/ = 0 . 5 , this point has not yet been reached. The adjustment to a lowering of the fertilityrate takes time, because the death rate is not equally distributed over the age groups. If/ = 1 , the fertility rate is equal to the replacement rate, which eventually will lead to aconstant population but the time scale for reaching a death rate d equal t o / = 1 is the lifeexpectancy L.
To illustrate this phenomenon, the following example shows what happens if in an initiallystable situation, where/=rf=l, the fertility rate is instantaneously doubled to /=2 at f=0,and where at t=60 years, as a result of government policy, the fertility rate is restored tothe sustainable level of /=rf=l . Figs. 4.1 and 4.2 show the population distribution overage classes and the variation of the total population P over time, respectively. The initialpopulation distribution over age classes (also called population pyramid) at t=0 is stablesince the same amount of people dies and is bom annually. The baby boom then lasts 60years. Subsequently, it takes another 100 years, the lifetime of a person, for the babyboom to disappear completely and for the population to stabilize.
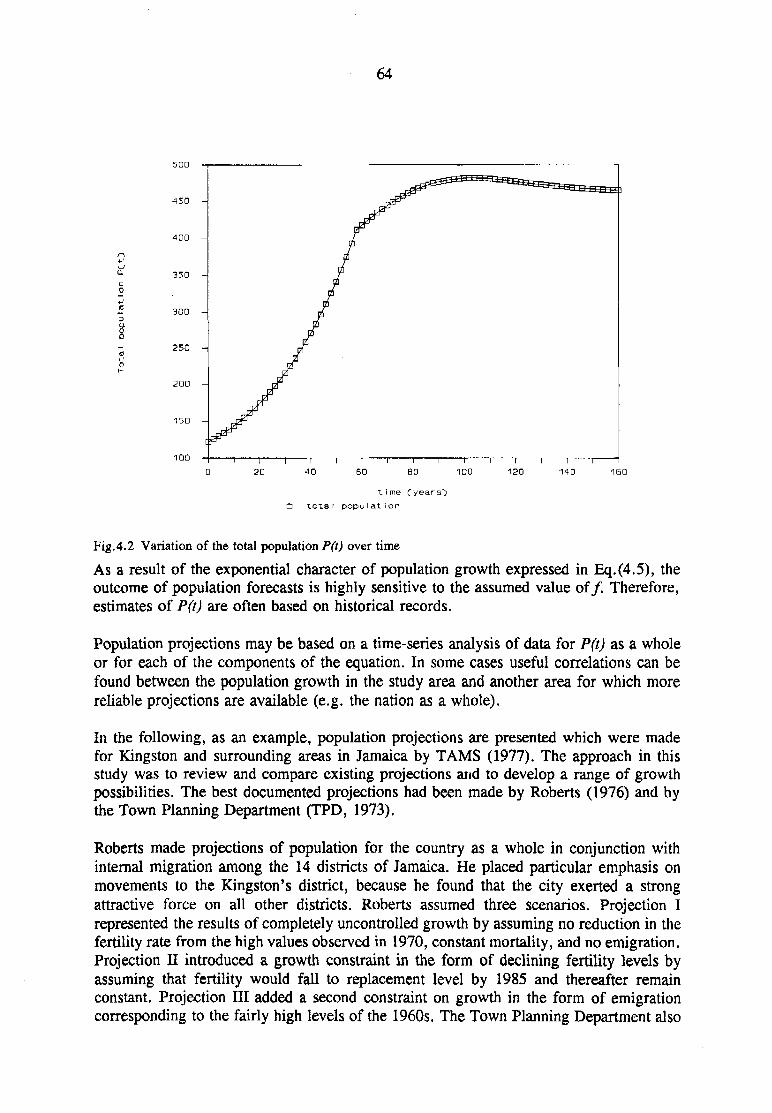
64
500
4S0 -
<4QD -
350 -
300 -
250 -
200 -
100
160
t i met o t s t popu la t ion
Fig.4.2 Variation of the total population P(t) over time
As a result of the exponential character of population growth expressed in Eq.(4.5), theoutcome of population forecasts is highly sensitive to the assumed value of/. Therefore,estimates of P(t) are often based on historical records.
Population projections may be based on a time-series analysis of data for P(t) as a wholeor for each of the components of the equation. In some cases useful correlations can befound between the population growth in the study area and another area for which morereliable projections are available (e.g. the nation as a whole).
In the following, as an example, population projections are presented which were madefor Kingston and surrounding areas in Jamaica by TAMS (1977). The approach in thisstudy was to review and compare existing projections and to develop a range of growthpossibilities. The best documented projections had been made by Roberts (1976) and bythe Town Planning Department (TPD, 1973).
Roberts made projections of population for the country as a whole in conjunction withinternal migration among the 14 districts of Jamaica. He placed particular emphasis onmovements to the Kingston's district, because he found that the city exerted a strongattractive force on all other districts. Roberts assumed three scenarios. Projection Irepresented the results of completely uncontrolled growth by assuming no reduction in thefertility rate from the high values observed in 1970, constant mortality, and no emigration.Projection II introduced a growth constraint in the form of declining fertility levels byassuming that fertility would fall to replacement level by 1985 and thereafter remainconstant. Projection III added a second constraint on growth in the form of emigrationcorresponding to the fairly high levels of the 1960s. The Town Planning Department also
65
1200 -
•S 1000
300
600
90
Fig. 4.3 Population projections for Kingston, Jamaica (from TAMS, 1977; source: Goodman, 1984)
made three projections. Projection I, the highest by the agency, was based on a constantgrowth rate and stable fertility rates. Projection II was the lowest and took account ofdeclining fertility. Projection III was a midrange estimate. The various projections byRoberts and TPD are presented in Fig. 4.3. This figure also shows a historical trendprojection, obtained by graphical extension of the historical growth experienced in theperiod 1960-1974.
An analysis was made to determine whether the densities of population implied by theprojections were reasonable. The high rate of growth implied by Roberts I projection ( adoubling of the population in 16 years) did not appear possible due to a lack of availableopen land space. If Kingston were to reach the densities envisaged in the Roberts I andTPD I projections, there would have to be radical changes in building patterns as well assignificant investments in public high-density housing. The assumptions in the Roberts Iand TPD I projections of constant fertility rate and no emigration were also judgedunrealistic. For these reasons, these projections were not considered to be within the rangeof feasible growth patterns.
For the purpose of studying various water supply options, it was decided to adopt RobertsII projection as the high projection and the TPD II as the low projection. The historicaltrend projection was taken as the "most likely" projection.
This example is not a recipe for demographic projections. Each country and each regionhas characteristics that make it virtually impossible to prescribe one overall methodology.However, the example makes clear that one has to study well all the typical characteristicsof the area and to think well about how realistic certain extrapolations are with respect tothe carrying capacity of the land and the physical infrastructure.

66
1800
§ 160° I£ 1400 |
0 I5 1200 S1 '| 100° I
I "I« 600 S
I I°- 400 Tj
o200
I I T
Water production{— read left ordinate)
- Per capita water consumption(read right ordinatt- -*
Potential
Estimated
Popu, ulation served\ (•- read left ordinate)
PopjUtion of W.C jervice area(*- read left ordinate)
; I I I I 1 I I I I I I J I l I
140
120
100
80
60
40
20
1960 62 64 66 68 1970 72 74 76 78 1980 82 84 86 88 1990 92 94 96Year
Fig. 4.4 Historical and projected water consumption for Water Commission (W.C.) service area,Jamaica, (from TAMS, 1977; source: Goodman, 1984)
Public water supply projection (source: Goodman, 1984).
Projections of public water demand should be based on an analysis of historical demand.In the following, we continue with the study of the water supply needs of Kingston byTAMS (1977), as an example. In this study, it was found convenient to calculate per capitawater demand, and consumption, as the total production divided by the total population,irrespective of the specific use. Such a value differs from those based on water sales.
Fig. 4.4 shows the trends of water production, population, and per capita consumption inthe service area between 1960 and 1976. The figure shows that per capita consumption didnot rise in the later years. This was largely due to the unavailability of water rather thanto static demand. Summer water restrictions were in existence since 1968. In 1975, therewere restrictions during 194 days of the year. It was thus reasonable to assume thatpotential demand was significantly higher than actual demand.
Two projections of per capita demand were made. The first, which gave a potential percapita demand of 100 imperial gallons per day (0.45 m3/d) by the year 2000, was basedon extending the historical trend prior to the imposition of restrictions. It was believedmore reasonable to adopt another estimate which implicitly accounts for such factors aschanging demand patterns already brought about by continued summer restrictions whichresulted in the adoption of measures to conserve water, and some degree of pricesensitivity. This gave an estimate of per capita demand of 90 imperial gallons (0.41 m3/d)by the year 2000, which was applied equally to all consumers in the region. These percapita demands include industrial requirements but not irrigation demand. It was assumedthat existing irrigation projects would continue to be served by their sources of supply, andthat new projects would be served by other supplies.
The projected water demand by 2000 for the total region, assuming "most likely"population growth (see above) would be 0.53 MnvVd. For purposes of sensitivity analysis,
67
demand projections for the entire region were made for the assumed high and low growthrates as well. The implications of these different possibilities lie in the timing of any futurewater supply scheme for the incremental capacity needed, and in the financial returns ofthe project.
The forecasts discussed are based on single projections of overall per capita demand. Thisapproach is reasonable when industrial and irrigation requirements are not too importantcomponents of the total demand. When these are important components, it is advisable toformulate a predictive model incorporating projections for the separate components ofdemand, using sample data for selected activities and estimates of typical requirements.
Irrigation and hydropower projections
The projections of water demands for irrigation, hydropower and other projects very muchdepend on national planning priorities. The need for these projects should be determinedas a function of national objectives and constraints and translated into water demands ona project by project basis.
As part of the policy analysis to be carried out by the national planning authoritiespriorities have to be set in view of the limited resources available (water resources,financial resources, land resources, mineral resources, human resources, etc.). Thedetermination of the water demands of each project is a straightforward exercises to becarried out by the relevant professionals: agricultural engineers, hydro-power engineers,etc.. The lecture Water Using Activities will deal with these water demands in more detail.
A lot of benefits can be gained from improving the efficiency of water use for irrigation.Irrigated agriculture uses 80% of the available fresh water, and the efficiency of this wateruse is very low (about 50%). This means that large quantities of water are wasted.Considerable economies can be realized if agricultural water is used in a more efficientway.
Although, from a water resources point of view, one could argue that losses in agriculturaluse are not always losses to the water resources system, |£ |n i ie large parts of the wasted^ | ^ rc-««ws ^e sy«cm tfirou#h renirn flows rttf groundwater replenishment, a lowefficiency of water use is fflMVPAM number of ways:
• high gross water uses at a certain intake implies that upstream from the intake, anddirectly downstream, less water can be used; a higher efficiency implies that morewater can be allocated upstream;
• the design of the irrigation system is more expensive because the canals and inletworks have to be designed at too high a capacity;
• low efficiencies are related with poor and centralized water management; strivingfor a higher efficiency will improve the management in general;
• return flows always have a poor quality; the cost of treatment of return flows isproportional to the volume of polluted water; a low efficiency results in higherreturn flows, and hence, higher treatment costs.
The FAO and IPTRID, the International Program for Technology Research in Irrigationand Drainage of the World bank realize that enhancing water use efficiency in irrigation

68
is one of the most important things to achieve in the coming years. Research in improvedirrigation technologies is one aspect of enhancing efficiency, but even more important isdemand management.
4.3. Demand Management
At the Dublin Conference on Water and the Environment in 1992, one of the leadingprinciples adopted by the 114 countries, 14 UN organizations and 38 NGO's present wasthat water has an economic value in all its competing uses and should be recognised as aneconomic good.
Supply versus demand
Although the concept of water as an economic good has long been promoted, it is - inpractice - still far from universally shared. Jpmany coafctrteS, *#iter is Still cbnai&ered aIMtfiiK)d, which should be provided at low costs in the amounts and qualities desired.Moreover, water authorities tend to be supply oriented, without considering the actual needfor water by the users. A supply oriented approach supplies water in such quantities asestimated necessary by the water manager and assumes that the user will make proper useof it. Experiences in supply oriented irrigation systems have shown that such systemswaste considerable amounts of water, and similar experience have been gained about theefficiency of public water supply systems.
A demand oriented approach, on the other hand, looks at the real demand for water, whichcan be measured through the willingness of the users to pay for the water. A demandoriented approach works two ways: 1) it urges the producer to efficiently produce goodvalue for money (if he fails to do so, the users will refuse to pay), and 2) it createsawareness among the users that the resource is precious (they have to pay for it). Inaddition, a demand oriented approach allows the water manager to actually influencedemand. In a world where water demands are ever growing, water managers can not justcontinue to supply water without trying to actually influence demand. Besides managingthe supply, e.g. through the building of reservoirs (supply management), they should alsoendeavour to manage the demand.
The activities involved in influencing demand are generally referred to under the title of(jjEftd O^tnayement. Demand management, as is stated in UNDTCD's (1991)contribution to the Dublin Conference on "Legislative and Economic Approaches to WaterDemand management", is probably the fflosf|^K«tantinstft)»tnt that water resources -
have to develop and use during Hie coming dfe;ade.
Demand management is defmed as:
The development and implementation of strategies to influence demand forthe efficient and sustainable use of a scarse resource.
69
The reasons why water managers and decision makers at all levels (national, provincial,local) should try to control demands for water are:
• the use of water is ever increasing, whereas resources are limited;• water resources are deteriorating rapidly, either through over-utilization or
pollution;• the costs of developing new resources are increasing, since the cheapest sources
of water have already been developed;• financial constraints limit investments;• shortages are already occurring worldwide and;• the environmental carrying capacity of water resources systems is limited.
The aim of demand management is:
to safeguard the rights of access to water for future generations,to limit water demands,to ensure equitable distribution,to protect the environment,to maximize the socio-economic output of a unit volume of water, and henceto increase the efficiency of water use.
The character of Demand Management is myiti riiroiplnwry One can not address demandmanagement purely from a technical angle. Of course it is possible to introduce watersaving by technical measures, such as: drip irrigation, leakage control, canal lining etc.But such technical measures always have financial and administrative implications whichbring us to economic, institutional, legal and eventually political aspects. Hence, DemandManagement includes an array of ii
(water conservation, water saving technology, leakage control, cropping),4o (subsidies, tax and price policy, water tariffing),
tive (licenses, regulations, policing, capacity building),l (water law, water rights, fines),
ij)iiiHtiinin1 (i in in raising, communication, education)(operating rules, water allocations), and
(priorities, objectives).
The combination of these instruments, will be different for each individual countrydepending on the physical characteristics, administrative system, and cultural environment.
In managing the demand, decisions should be taken on where, in which sector, and howwater demands can be reduced. Implicitly, there will be cptifcts between competing usersan<jg0gg/0fe will have to be made between the benefits obtained by allocating the waterto different users in the context of the national economy. In this respect the main conflictsare expected to arise between, on the one hand, agricultural use and, on the other hand,industrial and urban use. Already in many parts of the world these conflicts occur andseldom are they solved in a planned fashion. In this respect it is important to note that themarket mechanism is the main motivation for the farmers to take action and that it is alsoconsidered as one of the most important instruments to enhance the water efficiency inurban and industrial water use. Hence economic and macro-economic aspects play a veryimportant role in demand management.
70
IWIttBd management sho«li!^be«fmskiered as oae of the most important components off l l i^^ttlMfies (next to iqMiMtiosai arrangements and ptaptait measures). It entails aset of actions to be taken by the water manager to reduce demand, which include:
• awareness and promotion• education and training• the formulation and application of implementation incentives to influence the
demand for water.
ilfMtftiness raising and promotion are important activities that should be directed to boththe water users and to the politicians. Water users should umtoutand the importance ofwater conservation and should know in which way they can contribute to waterconservation. They should be made aware that water is no free resource any more. It isthe task of water managers, scientific institutes and universities to raise awareness withpoliticians of the impacts that shortage of water can have on the general economy of thecountry and on the well being of the people at large. But even more importantly, theyshould be aware of the potential source of international conflicts that water resourcesentail. Large (potential) international conflicts exist in the river basins of the Rio Grandebetween the USA and Mexico, in the Incomati and Limpopo catchments in SouthernAfrica, in the Euphrates catchment between Turkey, Syria and Iraq, in the Jordancatchment between Syria, Palestine, Jordan and Israel, in the Mekong catchment betweenLaos, Thailand, Cambodia and Vietnam. If we look back into history and study the sourcesof large international conflicts, we see that water has often played an important role, evenat a time that resources were not as scarce as they are today.
is equally important to prepare the next generation of professionals for theimmense problems that they will be facing. Given the present shortage of water, theenormous expected growth of the world population over the coming years and the everincreasing environmental problems, today's professionals will have to prepare the nextgeneration to deal with problems that go far beyond their own experience, and maybe eventheir imagination. Education and training will be mainly the task of universities andinstitutes, but the water managers should also be involved to supply the necessary practicalinput and to enhance on the job training.
Peter Rogers (ISPAN, 1994) stated that demand management consists of four P's:
• preachments, being awareness raising, moral persuasion and threats;• prices;• politics, being concerns for equity;• practices, being technical control mechanisms for water supply and
conservation.
I would like to add a fifth P to that:
• policing, without which demand oriented measures can not be implemented.
71
incentives
Implementation mechanisms are the Wvis with which we implement demand management.These are part of institutional arrangements. An important component of theseimplementation mechanisms are implementation incentives. Implementation incentives fordemand management can be grouped in two main categories (Koudstaal et al., 1992):
• Btiwaomic instruments, which include: charges, subsidies, taxes, andregulations which create markets where water rights and emission rights canbe traded
• hf&imtmmex&s, including for example general quota or individual licencesfor extraction or discharges and ambient water quality standards. Suchregulations are often combined with financial enforcement incentives such asfines and penalties.
Table 4.1 presents a more detailed description of implementation incentives for demandmanagement.
Traditionally, for demand management, government agencies have merely used legalinstruments, applying a command and control approach: direct regulations coupled withsystems of monitoring and sanctioning of non-compliance. However, the general principlesof economic instruments and their importance for integrated management have been widelystudied and accepted as potentially powerful tools. Discussions started about 25 years ago,but there seems to be a general reluctance (political will) to really apply such instruments.It seems that the fear for ateiaiitcative burden is one of the major reasons.
Some general principles can be derived from experiences obtained:
• Charges, fines, or taxes should be quantity-related so that they stimulatedefficient use of water and promote environmentally sound behaviour. Flatrate tariffs or charges related to irrigation area or property value are far lesseffective. Mettriag, however, is essential.
• Until now the application of charges and eomtosmincentives have seldombeen used from a viewpoint of economic efficiency; they serve a financialpurpose but are insufficiently used as instruments to manage water demandor to reduce emissions.
• The legal environment has major impacts on the possibilities for an efficientallocation.
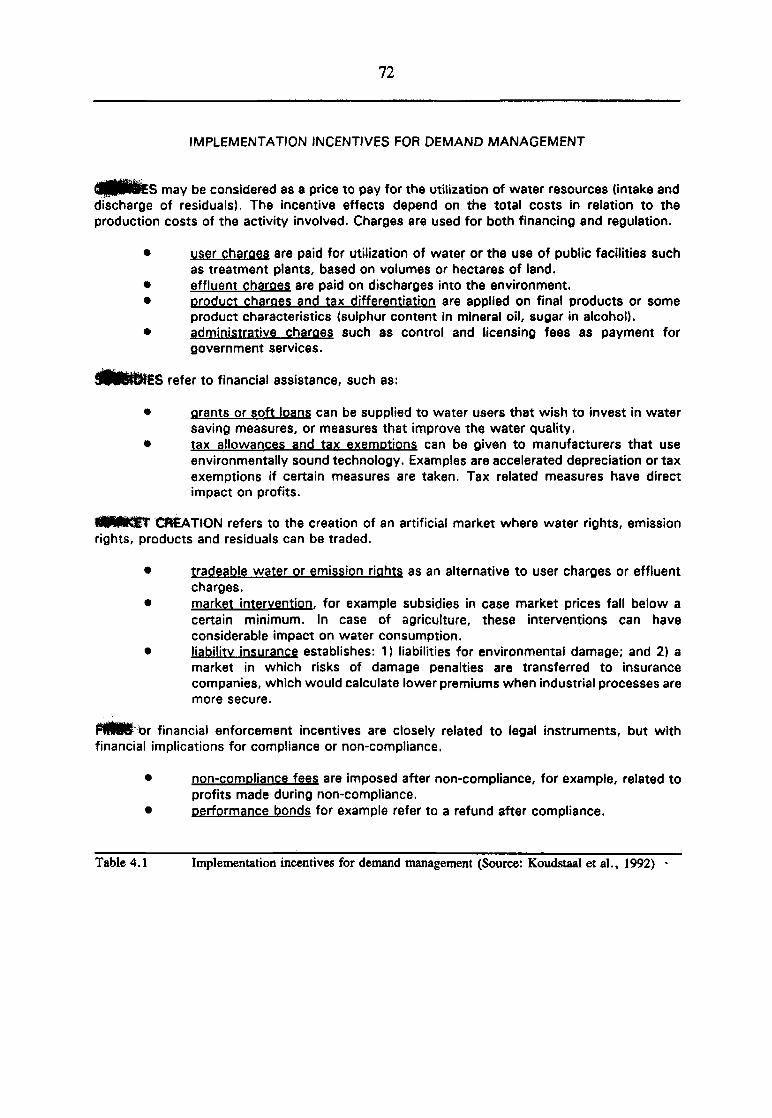
72
IMPLEMENTATION INCENTIVES FOR DEMAND MANAGEMENT
may be considered as a price to pay for the utilization of water resources (intake anddischarge of residuals). The incentive effects depend on the total costs in relation to theproduction costs of the activity involved. Charges are used for both financing and regulation.
• user charges are paid for utilization of water or the use of public facilities suchas treatment plants, based on volumes or hectares of land.
• effluent charges are paid on discharges into the environment.• product charges and tax differentiation are applied on final products or some
product characteristics (sulphur content in mineral oil, sugar in alcohol).• administrative charges such as control and licensing fees as payment for
government services.
S refer to financial assistance, such as:
grants or soft loans can be supplied to water users that wish to invest in watersaving measures, or measures that improve the water quality.tax allowances and tax exemptions can be given to manufacturers that useenvironmentally sound technology. Examples are accelerated depreciation or taxexemptions if certain measures are taken. Tax related measures have directimpact on profits.
' CREATION refers to the creation of an artificial market where water rights, emissionrights, products and residuals can be traded.
• tradeable water or emission rights as an alternative to user charges or effluentcharges.
• market intervention, for example subsidies in case market prices fall below acertain minimum. In case of agriculture, these interventions can haveconsiderable impact on water consumption.
• liability insurance establishes: 1) liabilities for environmental damage; and 2) amarket in which risks of damage penalties are transferred to insurancecompanies, which would calculate lower premiums when industrial processes aremore secure.
or financial enforcement incentives are closely related to legal instruments, but withfinancial implications for compliance or non-compliance.
• non-compliance fees are imposed after non-compliance, for example, related toprofits made during non-compliance.
• performance bonds for example refer to a refund after compliance.
Table 4.1 Implementation incentives for demand management (Source: Koudstaal et al., 1992)
73
Although there still is a strong reluctance with governments to initiate demandmanagement, still the understanding is growing that the application of demand orientedmeasures is crucial in future water resources management (OECD, 1989). The mainprospects and corresponding bottlenecks are:
Application of user and emission flhnges seems still one of the mostpromising measures. In developing countries, application of such charges,which are virtually non-existing, are expected to have both an importantfinancing and regulating effect.In both developed and developing countries, application of economicinstruments may have considerable administrative implications; monitoringof performance; new legislation and regulation; and new agencies or newtasks for existing agencies.Another type of administrative implication may stem from the fact thatshifting from a command and control approach towards economic incentivesimplies deregulation and a reduced direct government involvement. This maybe an official government policy, but it is likely to encounter political andadministrative problems.Application of economic instruments can only be effective if there is apolitical will for policy integration, encompassing all economic sectorsinvolved. For example, charges applied by the water resources manager canonly be effective if they are not counteracted by compensating measures fromthe sectoral agencies involved.
Water Pricing
One of the most topical tools in demand management is wttten fwieing. At the Dublin andRio conferences, as reported in Agenda 21, it has been recognized that water should bemanaged as an economic good, provided water for drinking purposes and other basic needsare made available at prices that are widely affordable locally. Providing water free ofcharge, or heavily subsidized, in the past has led to serious mis-allocations of waterresources, inefficient use and overexploitation.
A good illustration of this problem is the "free water dilemma". If water is for free, waterindustries do not receive sufficient payment for their services. Consequently, they are notable to maintain their systems adequately and, hence, to maintain the quality of theirservices. Consequently the system collapses, people have to drink unsafe water or payexcessive amounts of money to water vendors, while wealthy people receive piped waterdirectly into their houses, for free. S»>tito•>wmam»4&4s9e policy results in rich people
wmimfia free and poor jpepte buying water «i excessive rates or drinking unsafetr.
Water pricing has a number of important consequences, which makes it a key instrumentfor the implementation of demand management:
• increased price reduces demand;• increased price increases supply (firstly, because marginal projects may
become affordable; and secondly, because it becomes attractive to reducelosses);
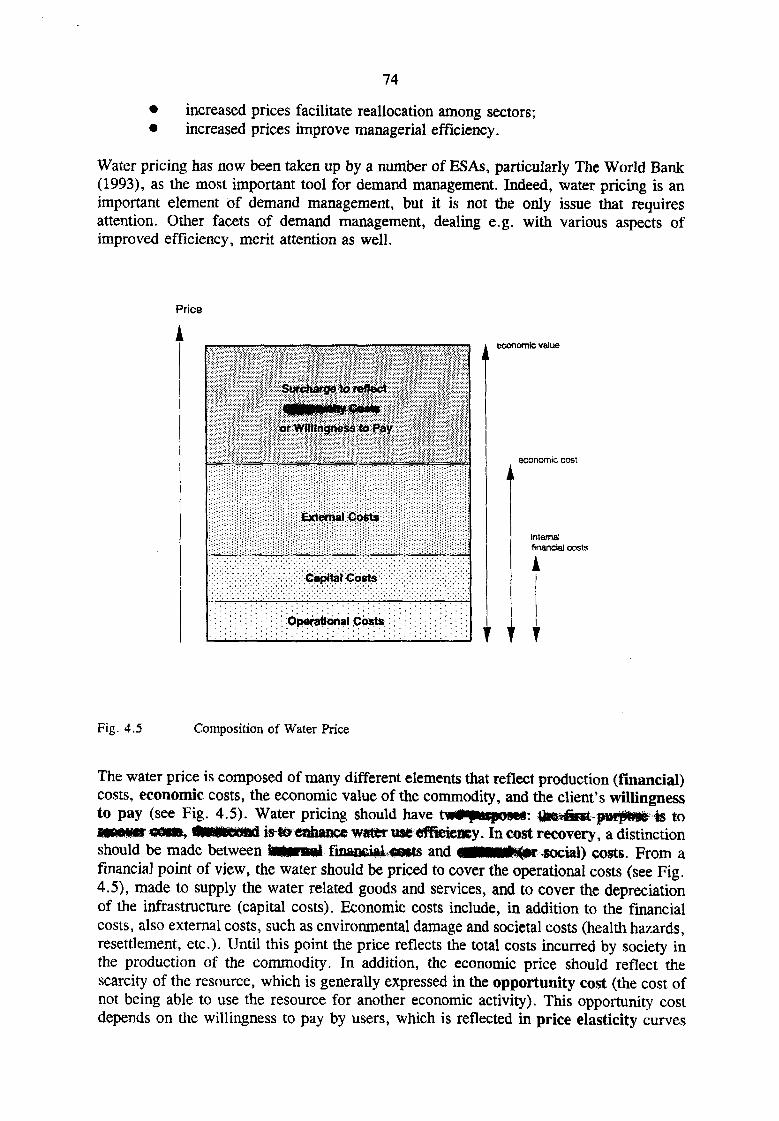
74
• increased prices facilitate reallocation among sectors;• increased prices improve managerial efficiency.
Water pricing has now been taken up by a number of ESAs, particularly The World Bank(1993), as the most important tool for demand management. Indeed, water pricing is animportant element of demand management, but it is not the only issue that requiresattention. Other facets of demand management, dealing e.g. with various aspects ofimproved efficiency, merit attention as well.
Price
Capital Costs
Operational Costs :
economic value
economic cost
Internalfinancial costs
T I T
Fig. 4.5 Composition of Water Price
The water price is composed of many different elements that reflect production (financial)costs, economic costs, the economic value of the commodity, and the client's willingnessto pay (see Fig. 4.5). Water pricing should have tw*f*Bpow«: UK Arst pwt«*»e »s tos««>*«r a w , iftWKOond is to enhance wstfcr use efficiency. In cost recovery, a distinctionshould be made between iaftarml iinaocial costs and «**M*4«r social) costs. From afinancial point of view, the water should be priced to cover the operational costs (see Fig.4.5), made to supply the water related goods and services, and to cover the depreciationof the infrastructure (capital costs). Economic costs include, in addition to the financialcosts, also external costs, such as environmental damage and societal costs (health hazards,resettlement, etc.). Until this point the price reflects the total costs incurred by society inthe production of the commodity. In addition, the economic price should reflect thescarcity of the resource, which is generally expressed in the opportunity cost (the cost ofnot being able to use the resource for another economic activity). This opportunity costdepends on the willingness to pay by users, which is reflected in price elasticity curves
75
(see Section4.4). TMftttMft«M*ttw<Md tkmmMmmm.iomyi*notea«iydetermined.Some users are willing to pay a higher price than others. Since these are often financialrather than economic (societal) considerations, willingness to pay is not always the rightargument to establish the economic price (to prevent that water always goes to the highestbidder. In addition, willingness to pay is dynamic, depending on many parameters whichinclude affordability, scarcity of the resource, and appreciation for the resource. Since allthese parameters are time dependent and can be influenced by external and internal factors,the **ttM*iMM0.pay i* a voUtik #ftramett;r.
Although Fig. 4.5 is useful as an illustration of how the price of water should beestablished to reflect societal costs, recently, water economists at the HfiMti Bank havecome to the conclusion that the water price should not be based on opportunity costs orlong-term marginal costs, but that it should be aflNfeMMe price between zero and the
on (about 2 US$/m3) wi*& «be»M« least reflect the financial price, andsend ewt the message t© users that we are dealing with a precious and finite
OECD recommendations
According to the OECD (1989), the water user should be required to pay the full socialcost of providing water and related services, including treatment and damage costs. In thisrespect all users should be charged: consumptive users, dischargers (polluters), and non-consumptive users.
In most OECD countries, industrial and agricultural sectors are by far the largest waterusers. They are, however, charged only the operation and maintenance costs and not thecapital costs and external costs (see Fig. 4.5). ThesqjaMBMffe therefore heavity subsidisedand the economic and environmental costs of such subsidised use of water services aresubstantial and widespread.
Both surface water and groundwater are used as recipients for waste water discharges. Theconcept that polluters should also have to pay for the cost of water treatment is now widelyaccepted in the case of public sewage treatment, but has not been adopted in othersituations.
There are market incentives and sanctions to modify resource use. The correct price fornatural resources should properly reflect their marginal social rather than operational cost.The resource pricing principle proposes that the price charged for water services shouldbe the full social cost of using resources including capital, operation, maintenance andenvironmental (= external) costs associated with its use. In this respect the followingquestions need to be answered in the near future:
• How should we determine the full social cost with respect to long-termmarginal social costs and external environmental costs?
• How should we identify users (consumptive users, non-consumptive usersand polluters) to which costs should be charged?
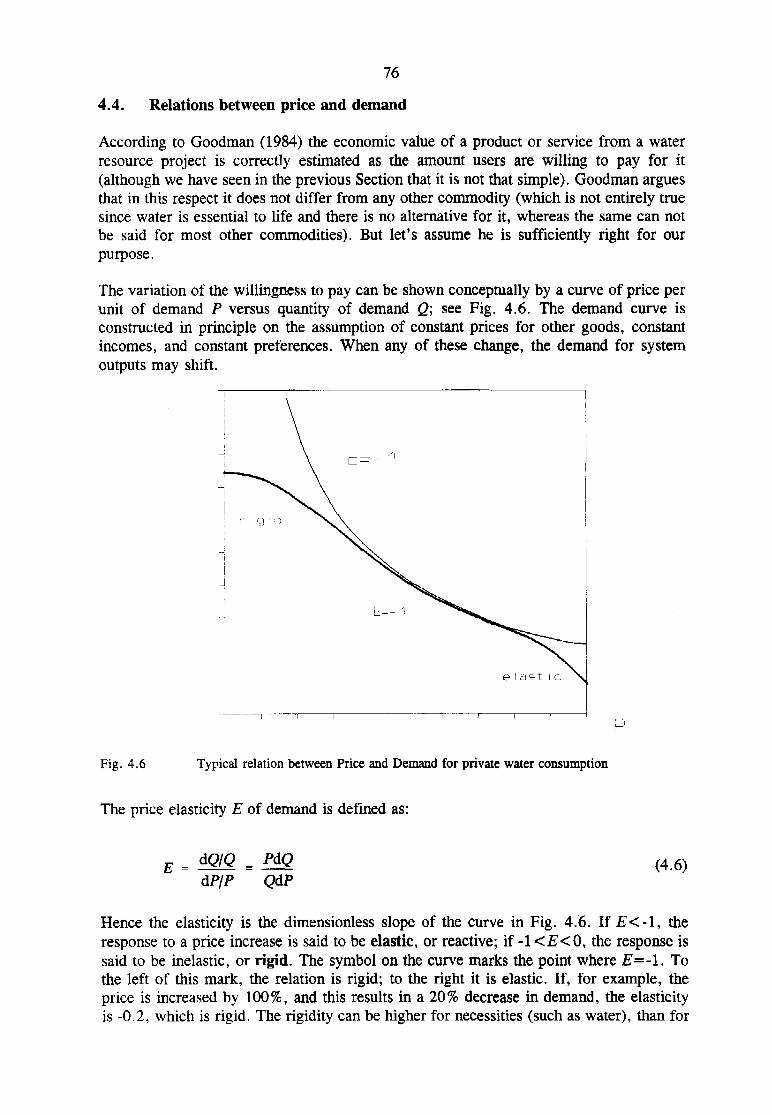
16
4.4. Relations between price and demand
According to Goodman (1984) the economic value of a product or service from a waterresource project is correctly estimated as the amount users are willing to pay for it(although we have seen in the previous Section that it is not that simple). Goodman arguesthat in this respect it does not differ from any other commodity (which is not entirely truesince water is essential to life and there is no alternative for it, whereas the same can notbe said for most other commodities). But let's assume he is sufficiently right for ourpurpose.
The variation of the willingness to pay can be shown conceptually by a curve of price perunit of demand P versus quantity of demand Q; see Fig. 4.6. The demand curve isconstructed in principle on the assumption of constant prices for other goods, constantincomes, and constant preferences. When any of these change, the demand for systemoutputs may shift.
Fig. 4.6 Typical relation between Price and Demand for private water consumption
The price elasticity E of demand is defined as:
dQIQ _ PdQdP/P QdP
(4.6)
Hence the elasticity is the dimensionless slope of the curve in Fig. 4.6. If E<-\, theresponse to a price increase is said to be elastic, or reactive; if -KE<0, the response issaid to be inelastic, or rigid. The symbol on the curve marks the point where E=-\. Tothe left of this mark, the relation is rigid; to the right it is elastic. If, for example, theprice is increased by 100%, and this results in a 20% decrease in demand, the elasticityis -0.2, which is rigid. The rigidity can be higher for necessities (such as water), than for
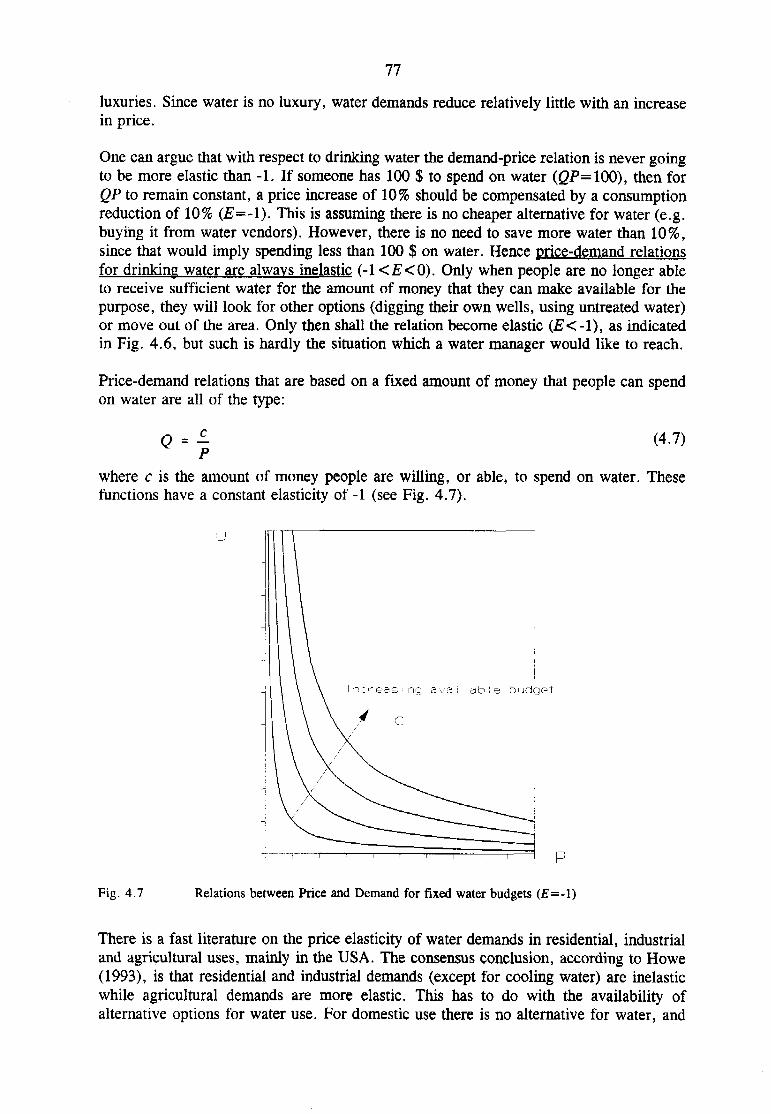
77
luxuries. Since water is no luxury, water demands reduce relatively little with an increasein price.
One can argue that with respect to drinking water the demand-price relation is never goingto be more elastic than -1 . If someone has 100 $ to spend on water (QP= 100), then forQP to remain constant, a price increase of 10% should be compensated by a consumptionreduction of 10% (E=-l). This is assuming there is no cheaper alternative for water (e.g.buying it from water vendors). However, there is no need to save more water than 10%,since that would imply spending less than 100 $ on water. Hence price-demand relationsfor drinking water are always inelastic (-KE<0). Only when people are no longer ableto receive sufficient water for the amount of money that they can make available for thepurpose, they will look for other options (digging their own wells, using untreated water)or move out of the area. Only then shall the relation become elastic ( £ < - l ) , as indicatedin Fig. 4.6, but such is hardly the situation which a water manager would like to reach.
Price-demand relations that are based on a fixed amount of money that people can spendon water are all of the type:
Q = - (4.7)
where c is the amount of money people are willing, or able, to spend on water. Thesefunctions have a constant elasticity of -1 (see Fig. 4.7).
" ! c r e s s ; n q a v a i I a b l e b u d g e t
P
Fig. 4.7 Relations between Price and Demand for fixed water budgets (E=-l)
There is a fast literature on the price elasticity of water demands in residential, industrialand agricultural uses, mainly in the USA. The consensus conclusion, according to Howe(1993), is that residential and industrial demands (except for cooling water) are inelasticwhile agricultural demands are more elastic. This has to do with the availability ofalternative options for water use. For domestic use there is no alternative for water, and

78
people are willing to pay a lot more for the same quantity (rigid). People must haveminimum amounts of water in some form to survive, and there is compelling evidencefrom developing countries all over the world that households often pay extraordinary highprices to water vendors for small amounts of water. In industry and agriculture theelasticity, although still low, is somewhat higher. In arid areas there is no substitute forirrigation or industrial water (leading to low elasticity), but farmers and industrialists caninvest in water saving technology and farmers can change cropping patterns (leading to ahigher elasticity).
Hence, the elasticity, of water consumption is generally low. In water resources terms,domestic water supply is generally underpriced with respect to its real value and demand.Therefore this product is relatively inelastic (rigid) within typical ranges of price. It canbe seen in Fig.4.6 that the demand becomes only more elastic (the curve gets steeper)when the price of the water becomes so high that people can no longer afford treated waterand start looking for other sources.
The demand by certain large industrial water consumers can become elastic when prices,while still modest for domestic water supply, are increased to the point where conservationmeasures and alternatives (e.g. air cooling) become economic. Only then will the pricebecome a demand management tool. Hence, demand management requires a certainelasticity of the price-demand relationship.
4.5. Experiences with water pricing and demand management
Some success has been achieved recently in the Netherlands with solid waste collection.Citizens in Haarlem are charged per container for solid waste disposal. Standard containershave a sticker with a bar-code which is automatically read by the truck as the containeris lifted, weighed and emptied. Citizens are charged per unit weight. Although someadministrators feared that people would dump their waste in other places, these things didnot happen at any noticeable scale. Since people were well informed about the fairness andnecessity of the system, they were willing to accept the measure. As a result the amountof solid waste decreased considerably because people no longer accepted unnecessarywrapping in shops and rather used returnable containers with deposit than disposablecontainers.
Pricing measures have also been quite successful in industry. Since producers keep closewatch over their costs and benefits, an increase in the costs of water, provided theelasticity of the price-demand relation is sufficiently elastic, immediately shifts the balanceto more water efficient technology. Increase in water price or in pollution charges appearsto be effective with institutions that closely monitor their production costs. Industries evenare willing to invest in water saving or pollution reduction technology in anticipation ofprice increases (Healy-Sing, 1994)
In some countries, particularly countries which suffer from severe water scarcity, waterpricing has become a very normal way to regulate demand. For instance in Palestine, onthe West Bank, progressive rates for water tariffs (increasing block rates) are being used.For domestic use, in 1994, the first 10 m3 used per month is charged with 0.9 US$/m3.The following 30 m3 costs 1.3 US$/m3. Consumptions above 40 m3/months are chargedwith 1.5 US$/m3. In the Gaza strip, per 1 January 1995, the water tariffs are the
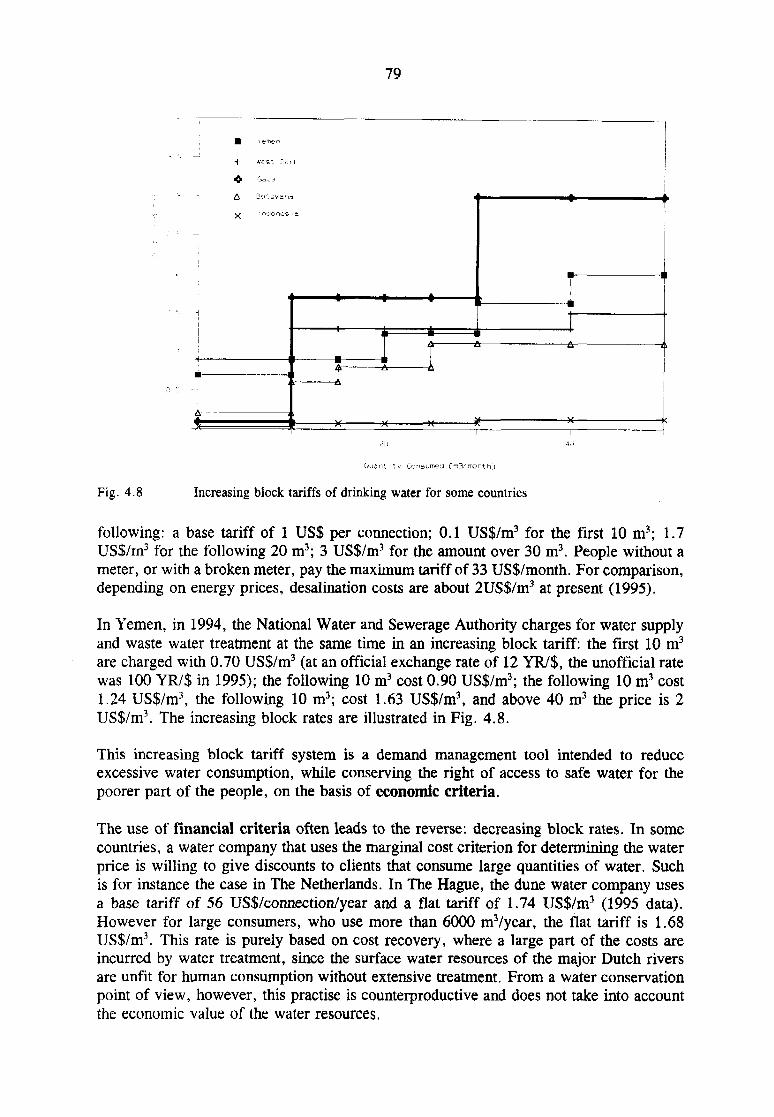
79
• I f rrt.:- ri
X : w - " 1 * s
1
• 1
A ,
^~ "•
,—1 A
i
• —I
I
1
1
1— i 1
1
Fig. 4.8
CJihiinT. i x y Consumed Cm3-'mont h"J
Increasing block tariffs of drinking water for some countries
following: a base tariff of 1 US$ per connection; 0.1 US$/m3 for the first 10 m3; 1.7US$/rn3 for the following 20 m3; 3 US$/m3 for the amount over 30 m3. People without ameter, or with a broken meter, pay the maximum tariff of 33 US$/month. For comparison,depending on energy prices, desalination costs are about 2US$/m3 at present (1995).
In Yemen, in 1994, the National Water and Sewerage Authority charges for water supplyand waste water treatment at the same time in an increasing block tariff: the first 10 m3
are charged with 0.70 US$/m3 (at an official exchange rate of 12 YR/$, the unofficial ratewas 100 YR/$ in 1995); the following 10 m3 cost 0.90 US$/m3; the following 10 m3 cost1.24 US$/m3, the following 10 m3; cost 1.63 US$/m3, and above 40 m3 the price is 2US$/m\ The increasing block rates are illustrated in Fig. 4.8.
This increasing block tariff system is a demand management tool intended to reduceexcessive water consumption, while conserving the right of access to safe water for thepoorer part of the people, on the basis of economic criteria.
The use of financial criteria often leads to the reverse: decreasing block rates. In somecountries, a water company that uses the marginal cost criterion for determining the waterprice is willing to give discounts to clients that consume large quantities of water. Suchis for instance the case in The Netherlands. In The Hague, the dune water company usesa base tariff of 56 US$/connection/year and a flat tariff of 1.74 US$/m3 (1995 data).However for large consumers, who use more than 6000 m3/year, the flat tariff is 1.68US$/m3. This rate is purely based on cost recovery, where a large part of the costs areincurred by water treatment, since the surface water resources of the major Dutch riversare unfit for human consumption without extensive treatment. From a water conservationpoint of view, however, this practise is counterproductive and does not take into accountthe economic value of the water resources.

80
An average family in The Netherlands pays about 250 US$/year on drinking water. Inaddition it is charged 200 US$/year on the treatment of waste water (The Hague, 1995).The consumer receives separate bills for water and waste water. Interesting results can beobtained by combining these bills.
of water and m t e water tariffs
Rogers at a debate on demand versus supply management (ISPAN, 1994) reported on aninteresting experiment of combining water and waste water bills. In the city of Boston, onthe Atlantic Coast, the water tariffs were increased by a factor of 2.2 as a result of thebuilding of a waste water treatment plant for the sewerage system of the city; the costsinvolved were recovered through the drinking water tariff. As a result, against theexpectations of most (supply oriented) water managers, the demand for water reduced from310 million gallons to 245 million gallons. Which is a reduction of 23%! Hence theelasticity of the demand was:
, 2.2-1(
E(245+310)/2
Although according to the definition of elasticity this is still an inelastic value, the 23%reduction of water consumption is certainly not small. For the water authority such ademand reduction is substantial.
Even more impressive results were reported by the World Bank (1993). In the city ofBogor, Indonesia, the expansion of the water supply system appeared so expensive thatdemand management was considered. Water fees were increased by 30%, which resultedin a consumption reduction of 29%; an elasticity of near -1 ! . This action was followed byan awareness and education campaign aimed a the largest consumers, including advises forconsumption reduction and water saving technology. This resulted in yet another 30%reduction.
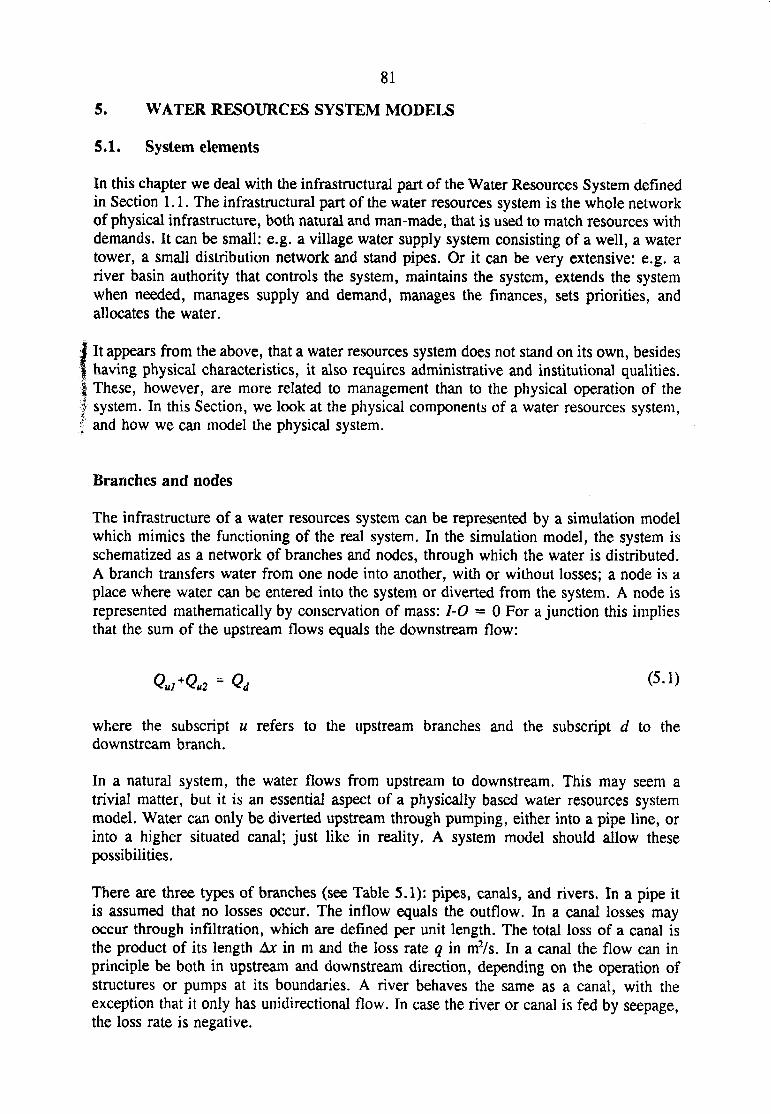
81
5. WATER RESOURCES SYSTEM MODELS
5.1. System elements
In this chapter we deal with the infrastructural part of the Water Resources System definedin Section 1.1. The infrastructural part of the water resources system is the whole networkof physical infrastructure, both natural and man-made, that is used to match resources withdemands. It can be small: e.g. a village water supply system consisting of a well, a watertower, a small distribution network and stand pipes. Or it can be very extensive: e.g. ariver basin authority that controls the system, maintains the system, extends the systemwhen needed, manages supply and demand, manages the finances, sets priorities, andallocates the water.
It appears from the above, that a water resources system does not stand on its own, besideshaving physical characteristics, it also requires administrative and institutional qualities.These, however, are more related to management than to the physical operation of thesystem. In this Section, we look at the physical components of a water resources system,and how we can model the physical system.
Branches and nodes
The infrastructure of a water resources system can be represented by a simulation modelwhich mimics the functioning of the real system. In the simulation model, the system isschematized as a network of branches and nodes, through which the water is distributed.A branch transfers water from one node into another, with or without losses; a node is aplace where water can be entered into the system or diverted from the system. A node isrepresented mathematically by conservation of mass: 1-0 — 0 For a junction this impliesthat the sum of the upstream flows equals the downstream flow:
where the subscript u refers to the upstream branches and the subscript d to thedownstream branch.
In a natural system, the water flows from upstream to downstream. This may seem atrivial matter, but it is an essential aspect of a physically based water resources systemmodel. Water can only be diverted upstream through pumping, either into a pipe line, orinto a higher situated canal; just like in reality. A system model should allow thesepossibilities.
There are three types of branches (see Table 5.1): pipes, canals, and rivers. In a pipe itis assumed that no losses occur. The inflow equals the outflow. In a canal losses mayoccur through infiltration, which are defined per unit length. The total loss of a canal isthe product of its length Ax in m and the loss rate q in m2/s. In a canal the flow can inprinciple be both in upstream and downstream direction, depending on the operation ofstructures or pumps at its boundaries. A river behaves the same as a canal, with theexception that it only has unidirectional flow. In case the river or canal is fed by seepage,the loss rate is negative.
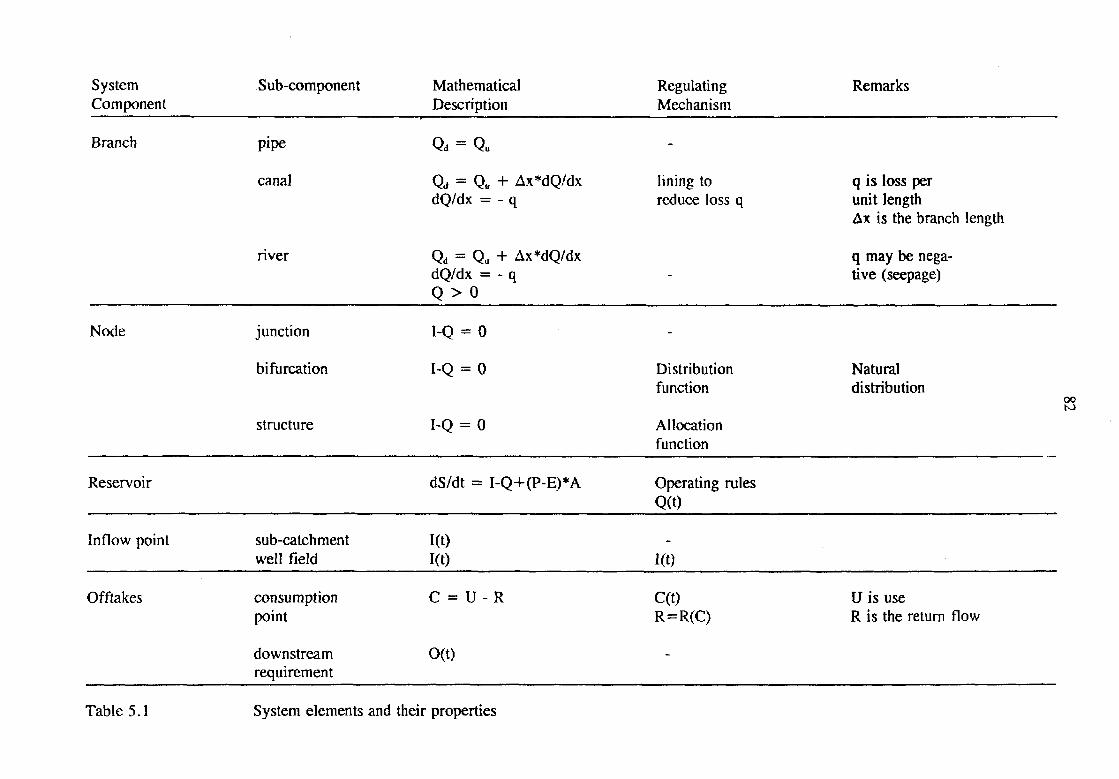
SystemComponent
Sub-component MathematicalDescription
RegulatingMechanism
Remarks
Branch pipe
canal
river
Qd = Qa + Ax*dQ/dxdQ/dx = - q
Qd = Qu + Ax*dQ/dxdQ/dx = - qQ > 0
lining toreduce loss q
q is loss perunit lengthAx is the branch length
q may be nega-tive (seepage)
Node
Offtakes
junction
bifurcation
consumptionpoint
downstreamrequirement
I-Q = 0
I-Q = 0 Distributionfunction
C = U - R
O(t)
C(t)R=R(C)
Naturaldistribution
U is useR is the return flow
oo
Reservoir
Inflow point
structure
sub-catchmentwell field
I-Q = 0
dS/dt =
1(01(0
I-Q+(P-E)*A
Allocationfunction
Operating rulesQ(t)
KO
Table 5.1 System elements and their properties
83
Three types of nodes are distinguished: a junction, a bifurcation and a structure. At eachnode, the inflow / minus the outflow O is zero. A junction is different from other nodesin that at a junction rivers (or canals) meet under gravity, without a possibility forregulation. In a bifurcation, a natural stream splits in two, without the possibility of dayto day regulation. The flow is divided according to the hydraulic properties of the streams.The only way by which the distribution can be manipulated is by physical measures, suchas dredging. If a structure is present in a node, then the water distribution can be managedthrough an allocation function.
Inflow points and water use points
Inflow points are the water sources of the system. They either are natural river sub-catchments or well fields. A well field is manageable, whereas a river sub-catchment isnot.
Finally we come to the elements that represent the water use; the reason why we developthe system. Distinction is made between a consumption point and a downstreamrequirement. At a consumption point, the net water use, the consumption C, is withdrawnfrom the system; it is assumed that the return flow is directly returned to the system.Hence the consumption C equals the difference between the use U and the drainage R:
C(t) = U-R (5-2)
The difference between a water use point and a downstream requirement is that thedownstream requirement is not manageable or negotiable. It is a requirement which iseither met or violated.
Reservoir nodes
Since branches and nodes are elements without storage, we need special elements torepresent storage S. Reservoirs are special nodes where a storage function is available. Thewater balance equation serves as the storage function:
~ = 1-Q+(P-E)A (m3/s) (5.3)At
where A=A(H) is the inundated area which is a function of the topography, derived fromplanimetering. For flood routing purposes, a time scale for reservoir computations is usedin the order of hours to days. At that time scale, local rainfall (F) and evaporation (£) cannot be neglected. However for reservoir yield computations a time scale is used in theorder of weeks to months. For reservoir yield computations evaporation and rainfall cannot be neglected in general. In the following section a simple reservoir model is presentedfor flood routing and for reservoir yield analysis
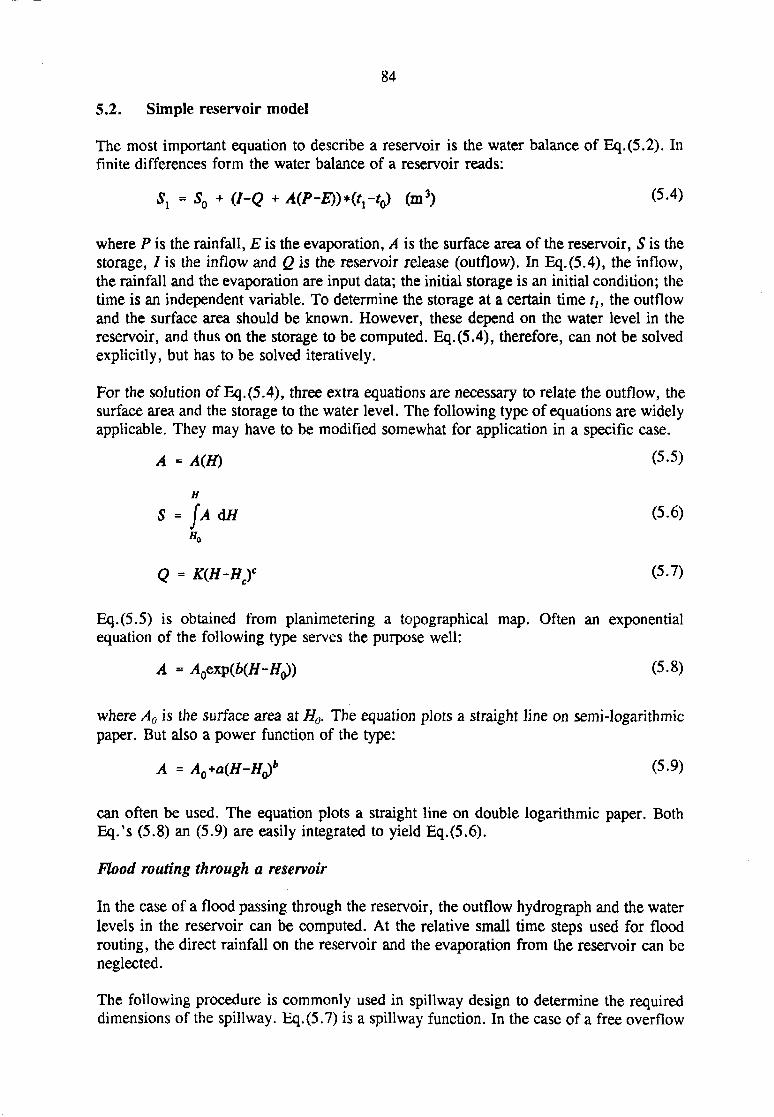
84
5.2. Simple reservoir model
The most important equation to describe a reservoir is the water balance of Eq.(5.2). Infinite differences form the water balance of a reservoir reads:
S1 = So + (/-<? + A(P-E))*(tr*<) (m3) <5'4>
where P is the rainfall, E is the evaporation, A is the surface area of the reservoir, S is thestorage, / is the inflow and Q is the reservoir release (outflow). In Eq.(5.4), the inflow,the rainfall and the evaporation are input data; the initial storage is an initial condition; thetime is an independent variable. To determine the storage at a certain time t,, the outflowand the surface area should be known. However, these depend on the water level in thereservoir, and thus on the storage to be computed. Eq.(5.4), therefore, can not be solvedexplicitly, but has to be solved iteratively.
For the solution of Eq.(5.4), three extra equations are necessary to relate the outflow, thesurface area and the storage to the water level. The following type of equations are widelyapplicable. They may have to be modified somewhat for application in a specific case.
A = A(H) (5-5)
H
= fAdH (5-6)
<? = K(H-HC)C (5.7)
Eq.(5.5) is obtained from planimetering a topographical map. Often an exponentialequation of the following type serves the purpose well:
A = A^xpibiH-HJ) (5.8)
where Ao is the surface area at Ho. The equation plots a straight line on semi-logarithmicpaper. But also a power function of the type:
A = A0*a(H-HJb (5-9)
can often be used. The equation plots a straight line on double logarithmic paper. BothEq.'s (5.8) an (5.9) are easily integrated to yield Eq.(5.6).
Flood routing through a reservoir
In the case of a flood passing through the reservoir, the outflow hydrograph and the waterlevels in the reservoir can be computed. At the relative small time steps used for floodrouting, the direct rainfall on the reservoir and the evaporation from the reservoir can beneglected.
The following procedure is commonly used in spillway design to determine the requireddimensions of the spillway. Eq.(5.7) is a spillway function. In the case of a free overflow

85
spillway, the exponent c= 1.5 and the coefficient K<* 1,5*B, where B is the spillway width;Hc is the crest level of the spillway. The equation can be modified to fit another spillwaytype, if required. The set of eqs.(5.4)-(5.7) can be solved iteratively:
1. Assume a certain spillway design by determining values for K, c and Hc. In mostcases the simulation is started with a full reservoir:
2. In a first approximation, Eq.(5.4) is solved assuming that the outflow Q remainsconstant over the time step: Q=Q(H0) and that the effect of local rainfall andprecipitation can be neglected in relation to the flood flows. The storage thusobtained is the first estimate of the storage S*. The following equation is alsocalled the predictor.
S\ = So
3. On the basis of £*7, }f1 is computed using the inverse of Eq.(5.6):
H\ - H(S\)
4. With this first estimate of H,, the estimate of Sj can be corrected, using thecorrector.
S, = 50 + (M?')*(f r^) (m3)
with Q. =
5. The corresponding reservoir level follows from H} =6. If necessary steps 4 and 5 are repeated with H} instead of H*j until no more
significant change in 5 ; occurs.7. Subsequently, the procedure is repeated in step 2 for the following time step:
S*2 = Sl + (7-<?(/f1))*(/2-r1) (m3)
until the full flood wave has been simulated.8. At the end of the simulation the maximum reservoir level and the maximum
discharge are obtained corresponding to the assumed spillway design.
The iterative procedure described, based on the set of Eqs.(5.4) through (5.7), is easy toperform in a spreadsheet. Figure 5.1 is an example of the output of the spreadsheet modelRESSIMFL.
Two observations can be made from studying Fig. 5.1. Firstly, the inflow and the outflowhydrographs intersect at the point of maximum outflow; and secondly, the volume enclosedby the two curves left of the intersection is equal to the volume enclosed to the right of

86
the intersection (assuming the water level is at the spillway crest at the start of the inflowhydrograph). The former volume is the part of the inflow which is temporarily stored inthe reservoir above the crest of the spillway, the latter volume is the release of that sameamount. Before the point of intersection the storage increases; after the point ofintersection the storage is reduced.
100
90 -
80 -
70 -
10 -
a Des i gn fIood
time [hours]
+ Sp i I f way f Iow
Fig. 5.1 Inflow and outflow hydrograph of a reservoir
That the maximum outflow occurs at the point of intersection can be made clear by thefollowing reasoning. It follows from Eq.(5.3) that (neglecting the effect of rainfall andevaporation):
* - 7 - Qdt
At the point of intersection this results in:
AS
dt= 0
which because 5 = S(H), and BS/dH * 0, results in:
dff
dt= 0

87
Thus the maximum water level in the reservoir occurs when inflow equals outflow. Sincethe outflow Q = Q(H):
6t
the maximum outflow occurs at the maximum water level.
Reservoir yield analysis
In reservoir simulation for yield analysis, the time series of P, E and / are known values.The variation of the storage S over time and the reservoir outflow, or release, Q are theunknown parameters. The reservoir release is composed of the draft, D, being the plannedor envisioned release, and the spill over the spill way, L.
The way the yield analysis is approached is by assuming a certain draft, possibly as afunction of time, D(t), on the basis of which the reservoir simulation is made. The spill,L(t), follows from the reservoir operation.
R i v e r B a s i n S i m u l a t i o n
reservoir storage
t ime [months]Storage varI at Ion
Figure 5.2 Reservoir operating rules (rule curves) and simulated storage variation by the modelWAFLEX
Although, in principle, many different operating rules can be used, most reservoirs followthe basic operating rules of the following example. Figure 5.2 shows three operating rules:
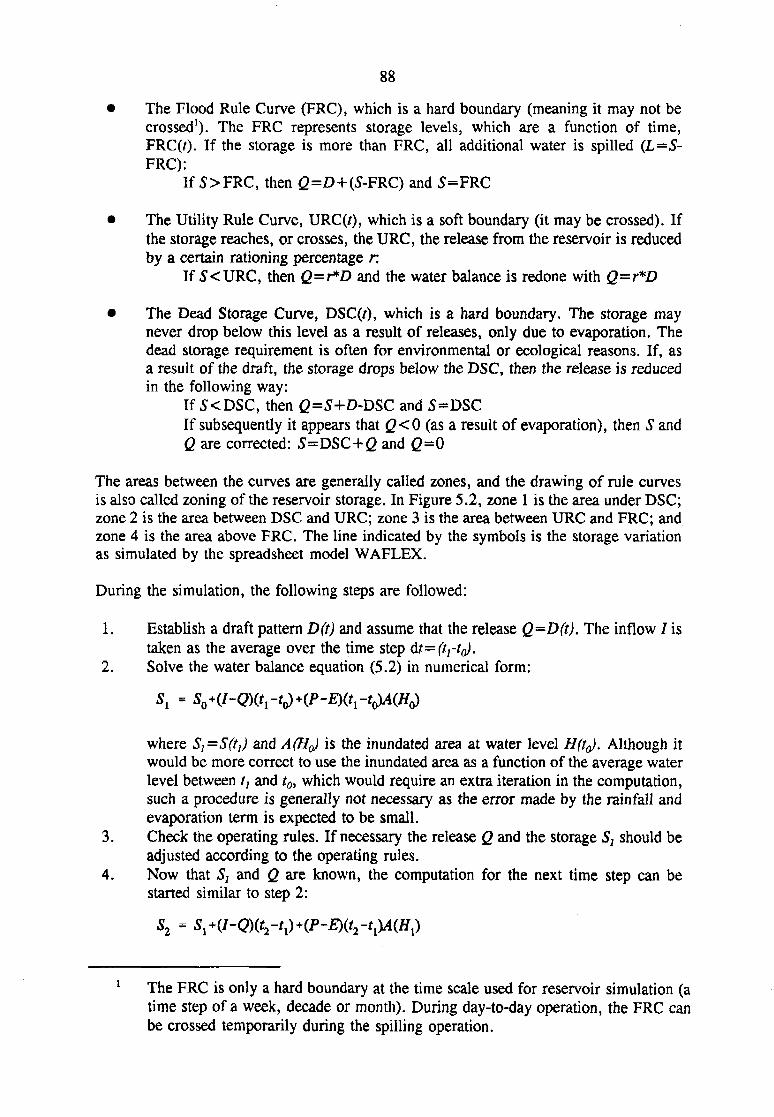
• The Flood Rule Curve (FRC), which is a hard boundary (meaning it may not becrossed1). The FRC represents storage levels, which are a function of time,FRC(0- If the storage is more than FRC, all additional water is spilled (L=5-FRC):
If 5>FRC, then £?=£>+(S-FRC) and S=FRC
• The Utility Rule Curve, URC(/), which is a soft boundary (it may be crossed). Ifthe storage reaches, or crosses, the URC, the release from the reservoir is reducedby a certain rationing percentage r:
If 5<URC, then Q=r*D and the water balance is redone with Q=r*D
• The Dead Storage Curve, DSC(r), which is a hard boundary. The storage maynever drop below this level as a result of releases, only due to evaporation. Thedead storage requirement is often for environmental or ecological reasons. If, asa result of the draft, the storage drops below the DSC, then the release is reducedin the following way:
If 5<DSC, then Q=S+D-DSC and S^DSCIf subsequently it appears that Q<0 (as a result of evaporation), then S andQ are corrected: S=DSC+(> and Q - 0
The areas between the curves are generally called zones, and the drawing of rule curvesis also called zoning of the reservoir storage. In Figure 5.2, zone 1 is the area under DSC;zone 2 is the area between DSC and URC; zone 3 is the area between URC and FRC; andzone 4 is the area above FRC. The line indicated by the symbols is the storage variationas simulated by the spreadsheet model WAFLEX.
During the simulation, the following steps are followed:
1. Establish a draft pattern D(t) and assume that the release Q=D(t). The inflow / istaken as the average over the time step 6t-=(trt^.
2. Solve the water balance equation (5.2) in numerical form:
where Sj=S(ti) and A(Ho) is the inundated area at water level H(t^. Although itwould be more correct to use the inundated area as a function of the average waterlevel between tA and t0, which would require an extra iteration in the computation,such a procedure is generally not necessary as the error made by the rainfall andevaporation term is expected to be small.
3. Check the operating rules. If necessary the release Q and the storage 5, should beadjusted according to the operating rules.
4. Now that Sj and Q are known, the computation for the next time step can bestarted similar to step 2:
1 The FRC is only a hard boundary at the time scale used for reservoir simulation (atime step of a week, decade or month). During day-to-day operation, the FRC canbe crossed temporarily during the spilling operation.
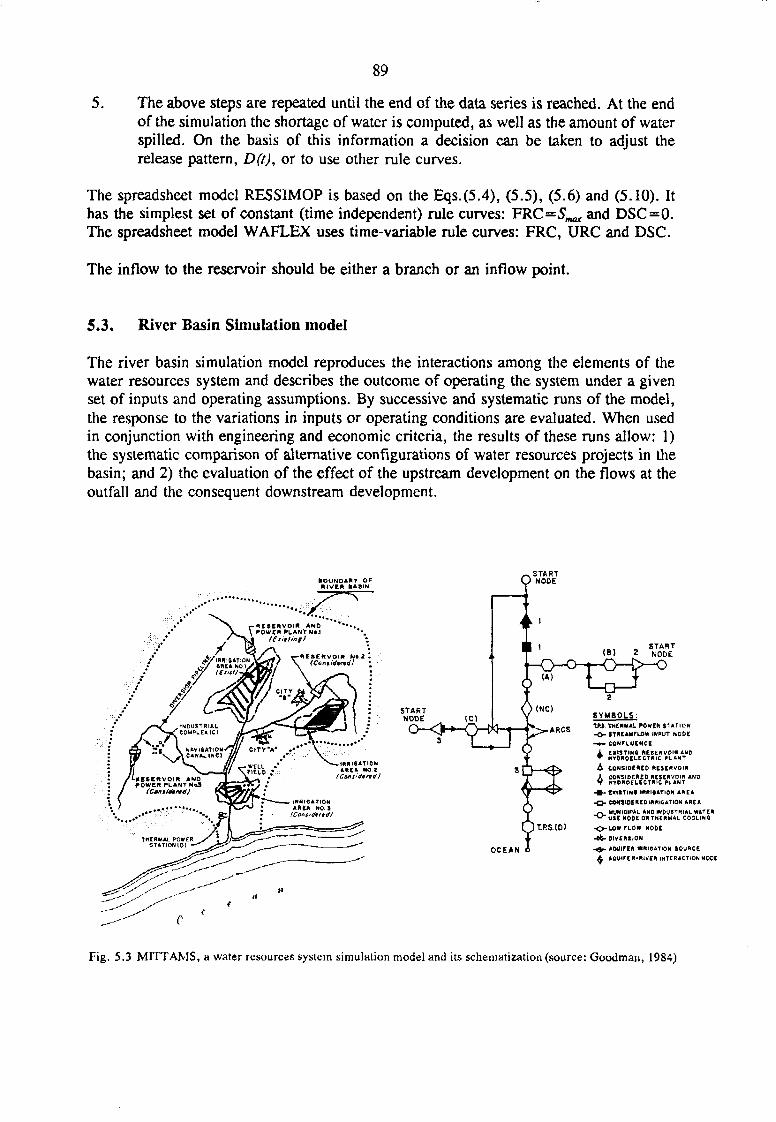
89
5. The above steps are repeated until the end of the data series is reached. At the endof the simulation the shortage of water is computed, as well as the amount of waterspilled. On the basis of this information a decision can be taken to adjust therelease pattern, D(t), or to use other rule curves.
The spreadsheet model RESSIMOP is based on the Eqs.(5.4), (5.5), (5.6) and (5.10). Ithas the simplest set of constant (time independent) rule curves: VRC=Smejc and DSC=0.The spreadsheet model WAFLEX uses time-variable rule curves: FRC, URC and DSC.
The inflow to the reservoir should be either a branch or an inflow point.
5.3. River Basin Simulation model
The river basin simulation model reproduces the interactions among the elements of thewater resources system and describes the outcome of operating the system under a givenset of inputs and operating assumptions. By successive and systematic runs of the model,the response to the variations in inputs or operating conditions are evaluated. When usedin conjunction with engineering and economic criteria, the results of these runs allow: 1)the systematic comparison of alternative configurations of water resources projects in thebasin; and 2) the evaluation of the effect of the upstream development on the flows at theoutfall and the consequent downstream development.
•OUNDAKT OFRIVER »ASIN
START(B) 2 NODE
SYMBOLTJtJ.THERMAL POWER STATION
- O - tTREAMFLOW INPUT NOSE
- * - CONFLUENCE
CONSIDERED RESERVOIRCONSIDERED RESERVOIR ANDHYDROELECTRIC PLANT
-m- EKI1T1N* IRRIGATION *»EA
- D - CONSIDERED AA(GATlON A S £ A
HWiCIPAL AND INDUSTRIAL WATERNODE OR THERMAL COOLING
W NODE
DIVERSION
AQUIFER IRRIGATION SOURCE
AOUIFEK-RIVEH. |HTER*CTtON«ODE
Fig. 5.3 MITTAMS, a water resources system simulation model and its schematization (source: Goodman, 1984)
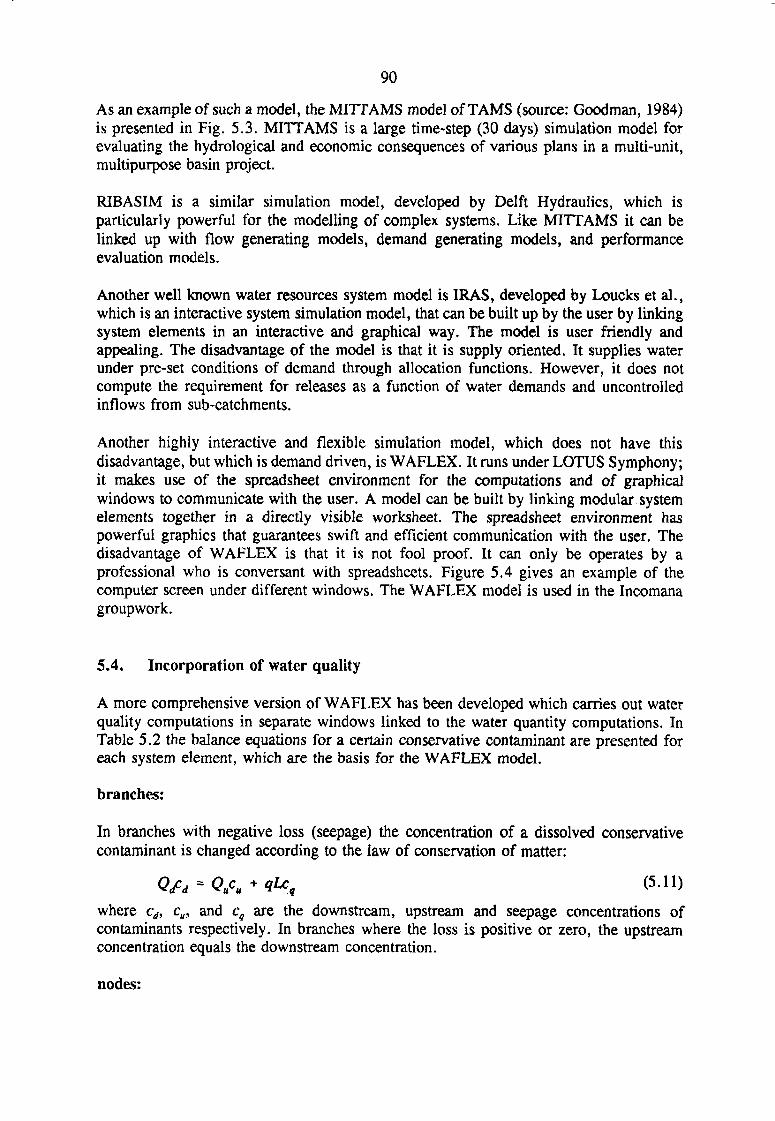
90
As an example of such a model, the MITTAMS model of TAMS (source: Goodman, 1984)is presented in Fig. 5.3. MITTAMS is a large time-step (30 days) simulation model forevaluating the hydrological and economic consequences of various plans in a multi-unit,multipurpose basin project.
RIBASIM is a similar simulation model, developed by Delft Hydraulics, which isparticularly powerful for the modelling of complex systems. Like MITTAMS it can belinked up with flow generating models, demand generating models, and performanceevaluation models.
Another well known water resources system model is IRAS, developed by Loucks et al.,which is an interactive system simulation model, that can be built up by the user by linkingsystem elements in an interactive and graphical way. The model is user friendly andappealing. The disadvantage of the model is that it is supply oriented. It supplies waterunder pre-set conditions of demand through allocation functions. However, it does notcompute the requirement for releases as a function of water demands and uncontrolledinflows from sub-catchments.
Another highly interactive and flexible simulation model, which does not have thisdisadvantage, but which is demand driven, is WAFLEX. It runs under LOTUS Symphony;it makes use of the spreadsheet environment for the computations and of graphicalwindows to communicate with the user. A model can be built by linking modular systemelements together in a directly visible worksheet. The spreadsheet environment haspowerful graphics that guarantees swift and efficient communication with the user. Thedisadvantage of WAFLEX is that it is not fool proof. It can only be operates by aprofessional who is conversant with spreadsheets. Figure 5.4 gives an example of thecomputer screen under different windows. The WAFLEX model is used in the Incomanagroupwork.
5.4. Incorporation of water quality
A more comprehensive version of WAFLEX has been developed which carries out waterquality computations in separate windows linked to the water quantity computations. InTable 5.2 the balance equations for a certain conservative contaminant are presented foreach system element, which are the basis for the WAFLEX model.
branches:
In branches with negative loss (seepage) the concentration of a dissolved conservativecontaminant is changed according to the law of conservation of matter:
where cd, cu, and cq are the downstream, upstream and seepage concentrations ofcontaminants respectively. In branches where the loss is positive or zero, the upstreamconcentration equals the downstream concentration.
nodes:
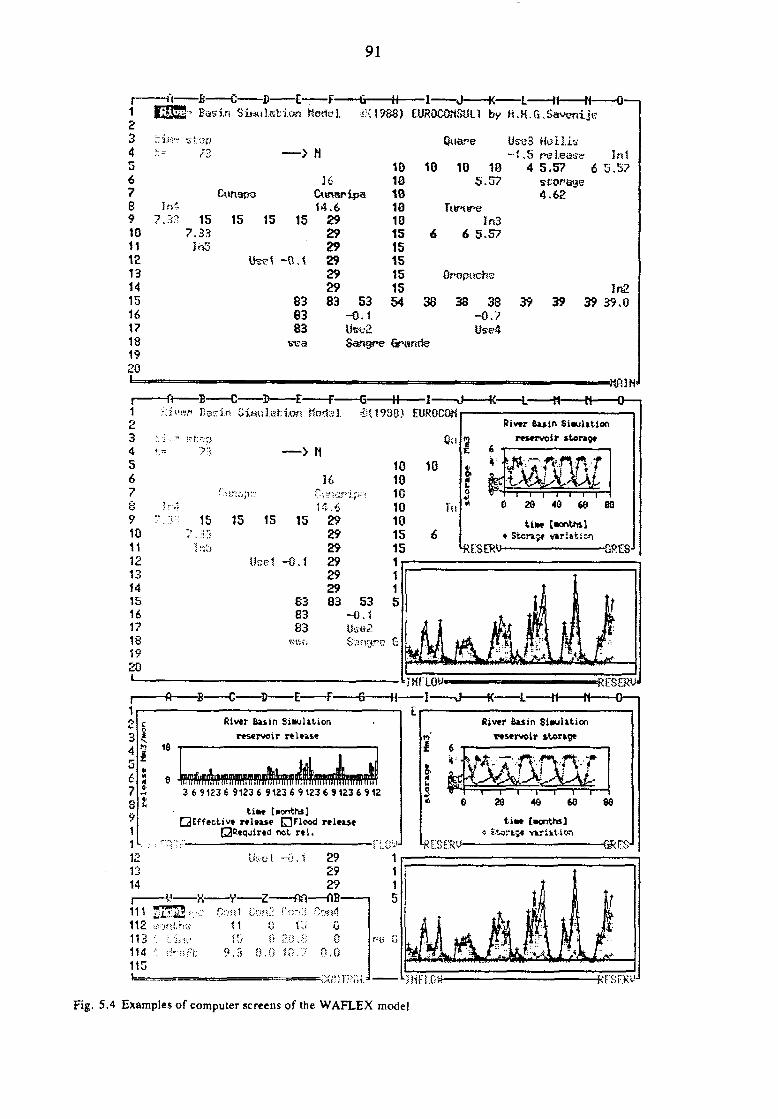
91
1234567891011121314151617181920
-K- - # •
E- Basin SiwilsL ion Hod*?]. S(1988) EUR0COM8ULT by H.H.G.Savenije-H—-o—i
—> N -1
36
7.3? 15.33
15 15 15
-0.1
838383
SE3
29292929292983 53
-0.1
1010101010151515151554
10 10 105.57
Hollis5 release4 5.57 6storage4.62
l.ti5.S7
6 5.57
Oropitche
38 38 39 39 39in2
-0.7
Sangre Grantte
HodsI £(1938) OJROCONRiv»r Butn SiauUtion
mcrvoir storag*
0 20 40 66 8Q
ti«w• Stcnj* v»riition
Rivtr Biiin Siaulitionreservoir release
River Buin Siwulitionreservoir »tor»ge
•oar3 6 9123 6 9123 6 9123 6 9123 6 9123 6
Mae [nonths]• Effective release • Flood release
•Required not r«l.iiM [.onthi]
* s-toraoe
Z flrt (\B
Fig. 5.4 Examples of computer screens of the WAFLEX mode]

92
At nodes where there is a bifurcation or structure, the concentration is constant over thenode. At a junction, however, two discharges with different concentrations of contaminantsmay meet:
reservoirs:
In a reservoir, the contaminant balance is somewhat more complicated. The rate of changeof the quantity of contaminants equals the amount which entered the reservoir minus theamount that was discharged, per unit of time:
= Ic-Oc (5.13)
where c, is the contaminant concentration of the entering water, and c is the concentrationof the reservoir water. Elaboration yields:
dc = -cdS/dl+ICj-Oc 5 < 1 4 j
df S
The value of d£/d/ can be substituted from Eq.(5.3), yielding:
d£ = Kcrc)-c(P-E)IA ( 5 1 5 )
df 5
In case the rainfall balances the evaporation (P=£) and if IIS may be considered constantwith time (not such a valuable assumption, but acceptable for the purpose of illustration),then Eq.(5.15) can be integrated analytically, yielding:
c-ct(5.16)
Hence the cleaning of a reservoir by flushing is an exponential process where the valuec, is only reached asymptotically.
water use points:
At a water consumption point, the contaminant balance reads:
Q - ca(Qm-U)+c£ (5.17)
where cR is the contaminant concentration of the drainage water (return flow). The othersymbols have been defined earlier. If we assume that the drainage water contains all thecontaminants which entered the user's system, then the concentration of the return flowshould be:
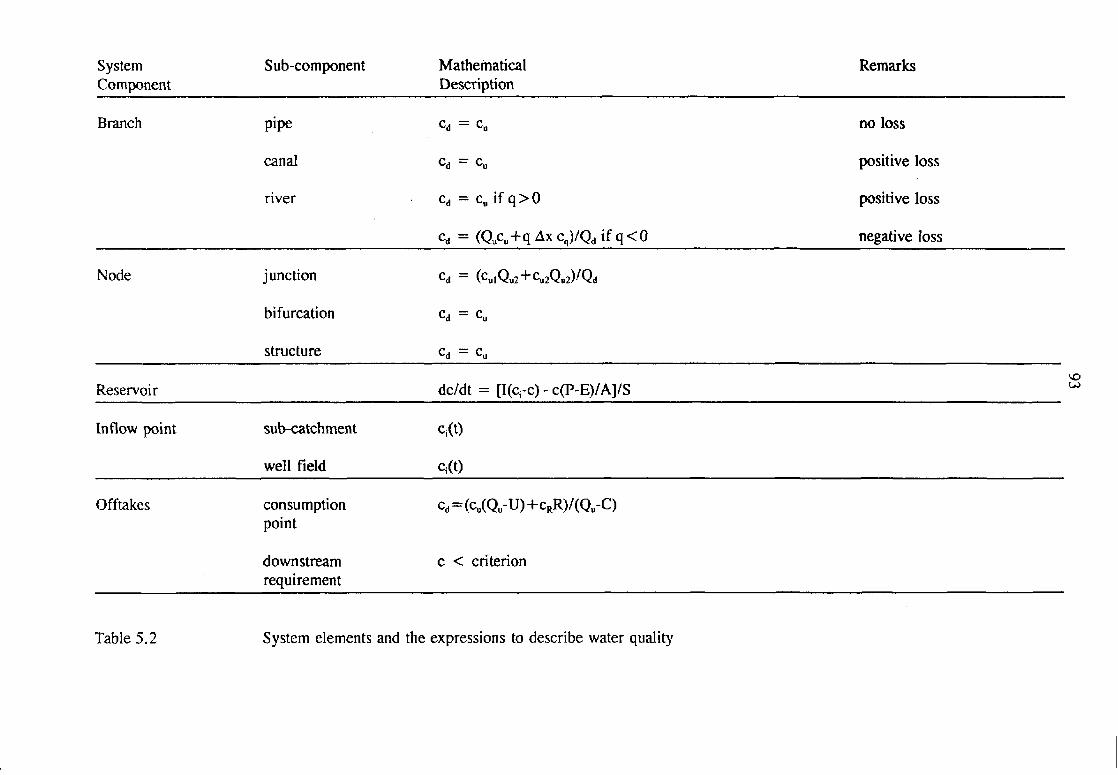
SystemComponent
Sub-component MathematicalDescription
Remarks
Branch pipe
canal
river
cd = cu
cd = cu
cd = cu if q > 0
cd = (Qucu+qAxcq)/Qd ifq<0
no loss
positive loss
positive loss
negative loss
Node junction
bifurcation
structure
= cu
= cu
Reservoir dc/dt = [I(crc) - c(P-E)/A]/S
Inflow point sub-catchment
well field
Ci(D
cf(t)
Offtakes consumptionpoint
downstreamrequirement
cd=(cu(Qu-U)+cRR)/(Qu-C)
c < criterion
Table 5.2 System elements and the expressions to describe water quality
94
c , = - ^ (5-18)
Particularly in the case of irrigation, where the drainage water is supposed to leach theaccumulated salts, this assumption is quite acceptable. In fact, if the return flow R wouldcontain less conservative contaminants (in particular salts) than the withdrawal U, then thesystem would have been wrongly designed, allowing accumulation of salts in the fields,which results in a loss of productivity of the system.
In Fig. 5.5 is an illustration from the QUAFLEX model, which is the water qualitydaughter of WAFLEX
5.5. Integrated water resources system
Now that the system model (such as WAFLEX) incorporates the topographical locationsof the water resources system, taking well into account whether an element lies upstreamor downstream from other elements, the aspect of location, as defined in Section 3.4 hasbeen taken care of.
Since the WAFLEX model both takes into account surface water resources andgroundwater resources in the form of seepage from groundwater and well-fields, itintegrates over the type of the resource.
Moreover, since the QUAFLEX version of WAFLEX incorporates the quality with regardto various contaminants or substances (according to Section 5.4), the simulation modelmay be called an integrated water resources system; such a model is a requirement forintegrated planning.
This brings us to the aspects of integrated water management that we have not yet lookedat: the integration over the relevant sectors of the economy; the integration over thenational objectives and constraints; and the institutional framework. These aspects will bedealt with in the following lectures on Framework for Analysis and ManagementArrangements.
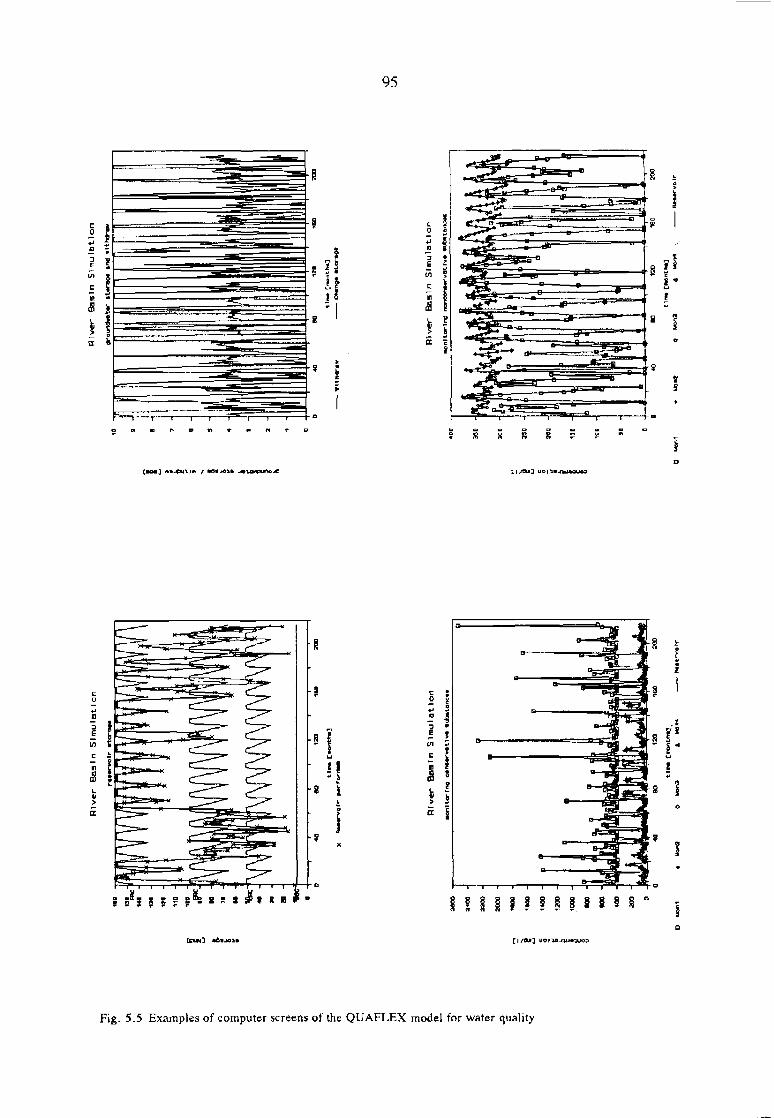
95
! t R R 8
( K M ) MBJCXJDW / W H A M . 4
f ! ! S 1.8 B s s "
Fig. 5.5 Examples of computer screens of the QUAFLEX model for water quality
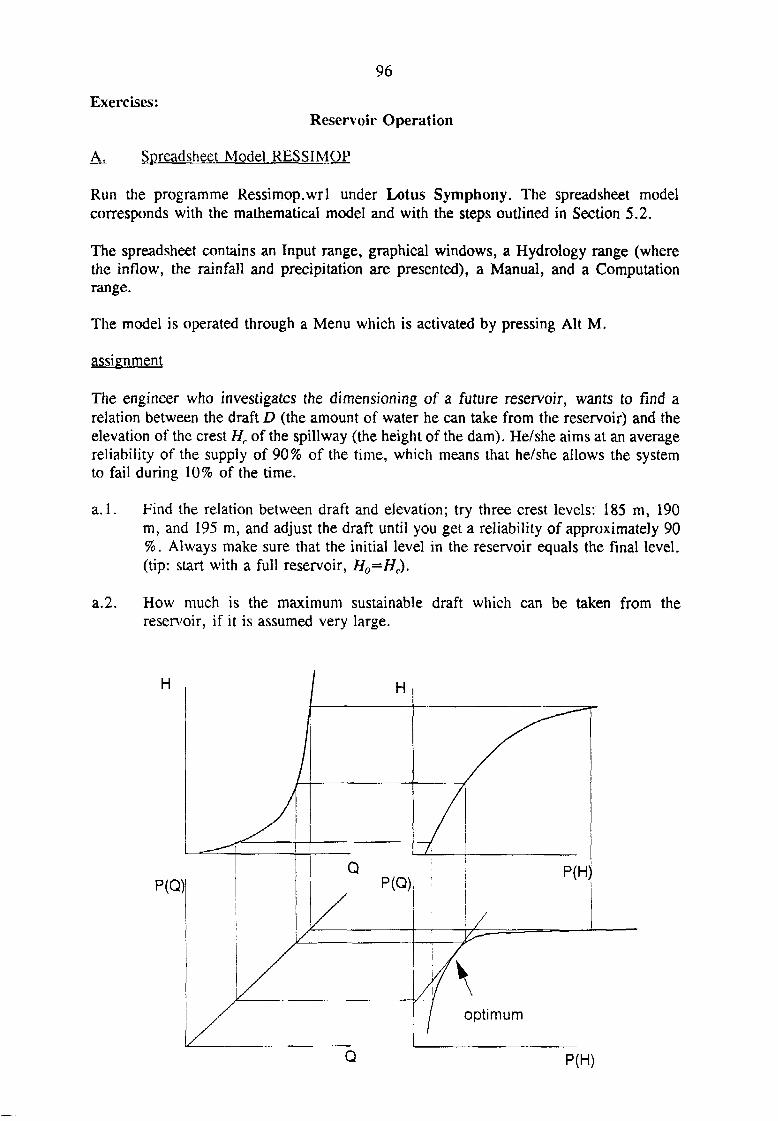
96
Exercises:Reservoir Operation
A. Spreadsheet Model RESSIMOP
Run the programme Ressimop.wri under Lotus Symphony. The spreadsheet modelcorresponds with the mathematical model and with the steps outlined in Section 5.2.
The spreadsheet contains an Input range, graphical windows, a Hydrology range (wherethe inflow, the rainfall and precipitation are presented), a Manual, and a Computationrange.
The model is operated through a Menu which is activated by pressing Alt M.
assignment
The engineer who investigates the dimensioning of a future reservoir, wants to find arelation between the draft D (the amount of water he can take from the reservoir) and theelevation of the crest Hc of the spillway (the height of the dam). He/she aims at an averagereliability of the supply of 90% of the time, which means that he/she allows the systemto fail during 10% of the time.
a. 1. Find the relation between draft and elevation; try three crest levels: 185 m, 190m, and 195 m, and adjust the draft until you get a reliability of approximately 90%. Always make sure that the initial level in the reservoir equals the final level,(tip: start with a full reservoir, HO=HC).
a.2. How much is the maximum sustainable draft which can be taken from thereservoir, if it is assumed very large.
H
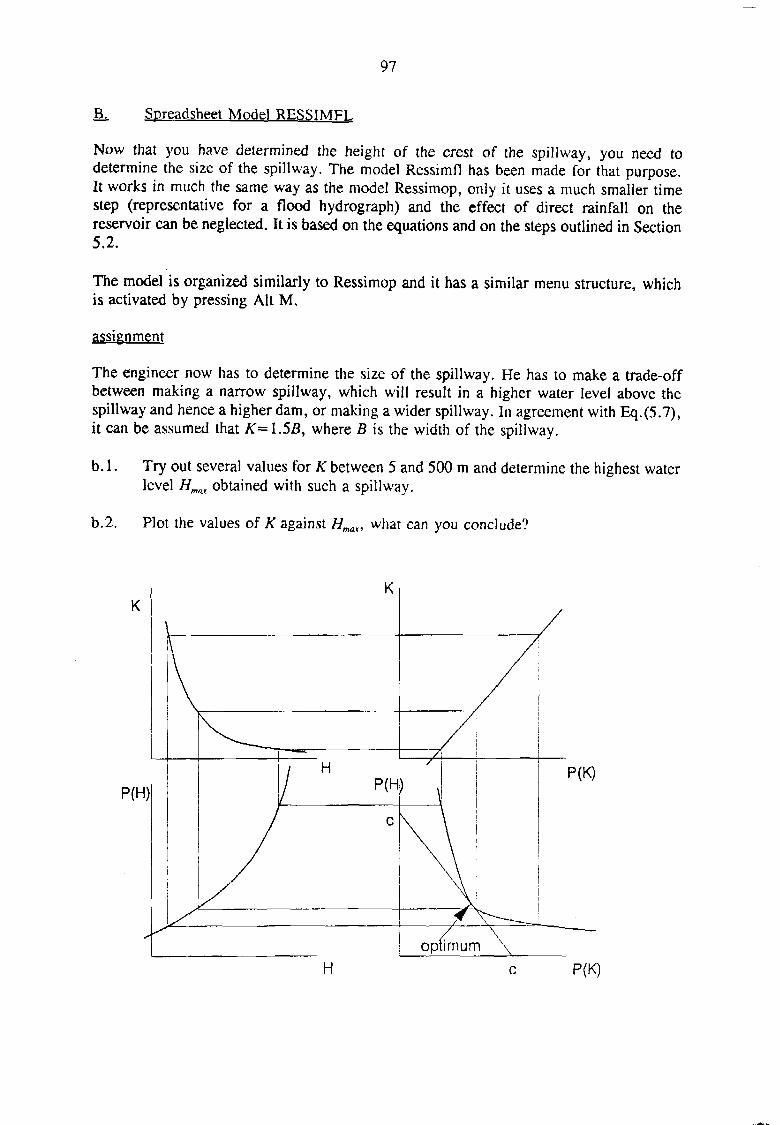
97
B, Spreadsheet Model RESSTMFT.
Now that you have determined the height of the crest of the spillway, you need todetermine the size of the spillway. The model Ressimfl has been made for that purpose.It works in much the same way as the model Ressimop, only it uses a much smaller timestep (representative for a flood hydrograph) and the effect of direct rainfall on thereservoir can be neglected. It is based on the equations and on the steps outlined in Section5.2.
The model is organized similarly to Ressimop and it has a similar menu structure, whichis activated by pressing Alt M.
assignment
The engineer now has to determine the size of the spillway. He has to make a trade-offbetween making a narrow spillway, which will result in a higher water level above thespillway and hence a higher dam, or making a wider spillway. In agreement with Eq.(5.7),it can be assumed that K=\.5B, where B is the width of the spillway.
b. 1. Try out several values for K between 5 and 500 m and determine the highest waterlevel //mat obtained with such a spillway.
b.2. Plot the values of K against Hmat, what can you conclude?
POO

98
Exercise: WAFLEX
The Cunapo catchment in Trinidad has two major tributaries: the Cunapo and theOropuche. In the Quare river, a tributary to the Oropuche, a dam has been built: Hollisdam. It is a small dam in the upper catchment and it serves to supply the capital ofTrinidad, Port of Spain, of water through a pipeline. Also there are several water usersalong the different branches of the river system.
The WAFLEX model simulates this system. There are a number of inflow (IN) andoutflow (USE) points connected to the system. The four major water users are:
• USE1, an off-river pumping irrigation scheme on the Cunapo river;• USE2, an off-river pumping irrigation scheme near Sangre Grande;• USE3, the off-take downstream of Hollis reservoir for the water supply to
Port of Spain;• USE4, an off-river pumping scheme on the Oropuche river.
The off-takes at USE2 and USE3 are under the control of the reservoir, the others haveto rely on unregulated flows.
Hollis reservoir has three operating rule curves:
• The flood rule curve FRC, which is a hard boundary; if the water levelreaches the FRC, all water which enters the reservoir is spilled over the spillway.
• The utility rule curve URC, which is a soft boundary; if the water levelreaches (or crosses) the URC, the release from the reservoir is reduced to acertain rationing percentage.
• The dead storage curve DSC, which is a hard boundary; the water level maynever drop below this level due to releases, only due to evaporation.
In this exercise we are going to try to improve the management of the water resources bymaximizing the outputs of the system under the constraints of preset reliabilities.
1) At Use, the farmers allow a failure of 25%. Find the corresponding amount ofwater they can pump from the river.
2) At USE, a failure of 10% is accepted. Find the corresponding amount that can bewithdrawn from Hollis.
3) If we only take water from Hollis at USE3 during the wet season and take waterfrom ground water resources near the city during the dry season, we can increasethe amount of water taken from Hollis. Adjust the withdrawal pattern from Hollisso that during the first 5 months the requirement is 0, and find the new annualwithdrawal amount that fails in 10% of the time
4) We can increase the reliability of the system, by changing the rationing that takesplace when the level in the dam reaches the Utility Rule Curve (URC). Change therationing to 20% and see what happens.
99
Exercise: Rainfall-Runoff modelling
Spreadsheet Model RAINRU
The spreadsheet programme RAINRUl.wri works under Lotus Symphony. It is based onthe theory explained in Section 3.3. The lecture notes show the case of the Cunapocatchment in Trinidad.
When loaded, the model shows 5 windows, between which one can toggle by pressing theF6 key. To zoom into a window one presses Alt F6. One of the windows (window 3) isnot in use.
The model is governed by a menu which can be activated by pressing Alt M. The option'Input' moves the programme to the Input Screen.
The model is used to find the partial runoff coefficients b, through multiple stepwisebackward regression. Symphony has the multiple regression option in its statisticalpackage.
The following steps are taken:
1. Load Symphony's statistical package by pressing AH A. This should be donebefore the analysis is started.
2. Select the option Threshold from the menu.
3. In the first try, set the threshold in 0 mm/decade.
4. Carry out the multiple regression by selecting the option Regression from themenu.
5. Analyze the explained variance (r2) obtained by increasing the memory of thesystem.
6. Check if an improvement can be obtained by including a threshold, (selectThreshold, increase the threshold, select Regression).
7. Analyze the partial runoff coefficients obtained, try to attribute a physical meaningto them.
8. How can you explain the relatively high value of a?
100
Literature
Alaerts, G.J., T.L. Blair and F.J.A. Hartvelt. 1991. A strategy for Water SectorCapacity Building. Proceedings of the UNDP Symposium, 3-5 June 1991, IHE ReportSeries # 24, IHE, Delft, The Netherlands.
Baumgartner, A., 1972. Water and energy balances of different vegetation covers.Proceedings of the Reading synposium. Publ. no. 94. IASH.
Brown, Lester R., (ed). 1995. State of the World 1995. Earthscan Publications Ltd.,London, UK.
Darcy, H.P.G., 1856. Les fontaine publiques de la ville de Dijon, V. Dalmont, Paris, 647P-
Delli Priscoli, J., 1983. Retraining the Modern Civil Engineer. The Environmentalist,V3, pp 137-146. Elsevier, The Netherlands.
Engelman, R. and P. LeRoy. 1993. Sustainable Water; Population and the Future ofRenewable Water Supplies. Population and Environment Programme. Population ActionInternational, 1120 19th street NW Suite 550, Washington, DC 20036, USA.
FAO. 1993. Technical Consultation on Integrated Rural Water Management, 15-19March 1993, FAO, Rome, Italy.
Gleick, P.H., (ed), 1993. Water in crisis. A guide to the world's fresh water resources.Oxford University Press, Oxford, UK.
Grigg, Neil S., 1985. Water Resources Planning. New York: McGraw Hill
Grigg, Neil S., 1993. New Paradigm for Coordination in Water Industry. Journal ofWater Resources Planning and Management. Vol 119, No 5 pp.572-587. ASCE. USA
Goodman, Alvin S., 1984. Principles of Water Resources Planning. Englewood Cliffs:Prentice-Hall
Healy-Sing, Tomas C , 1994. The impact of water pricing and effluent controls onwater conservation and pollution reduction in industry. MSc Thesis EE 153, IHE,Delft, The Netherlands.
Holy, M., 1982. Irrigation systems and their role in the food crises. ICID bulletin, Vol.31:2.
Hoogendijk, Willem, 1993. The Economic Revolution; towards a sustainable future byfreeing the economy from money-making. International Books, Utrecht, TheNetherlands.
Howe, Charles W., 1993. Water Pricing: An Overview. Water Resources Update. IssueNo 92: Summer 1993. University Council on Water resources, Carbondale, USA.

101
ICPD, 1994. Programme of Action of the United Nations International Conference onPopulation and Development. Cairo, Egypt.
ICWE, International Conference on Water and the Environment. 1992. The DublinStatement and Report of the Conference. 26-31 January 1992, Dublin, Ireland.
IHE. 1994. Water and Environment, key to Africa's Development, ConferenceProceedings, 3-4 June 1993, IHE Report Series #29, IHE, Delft, The Netherlands.
ILA, International Law Association. 1966. Helsinki Rules on the Uses of the Waters ofInternational Rivers, Adopted by the International Law Association in its 52nd conferenceheld in Helsinki on 20 August 1966. The International Law Association, London.
ISPAN, Irrigation Support Project for Asia and the Near East. 1994. Water Strategies forthe Next Century; Supply Augmentation vs. Demand Management. ISPAN TechnicalSupport Center, Arlington, Virginia, USA.
Kern, Dolf, 1994. The carrying capacity concept applied to water resourcesmanagement. Individual study. IHE, Delft.
Koudstaal, R., F.R. Rijsberman and H.H.G. Savenije. 1992. Water and SustainableDevelopment. Proc. Int. Conf. on Water and the Environment. Dublin, 26-31 Jan.Keynote papers 9/1-9/23.
Lettau, H., K. Lettau and L.C.B. Molion. 1979. Amazonia's Hydrologic Cycle and theRole of Atmospheric Recycling in Assessing Deforestation Effects. Monthly WeatherReview, Vol.107, No.3, 227-238. American Meteorological Society.
Mirghani, M.M.O., 1993. Incorporation of People's Participation in Planning andImplementation of Water Resources Projects. MSc. thesis HH.149, IHE, Delft, TheNetherlands.
OECD. 1989. Water Resource Management, Integrated Policies. Organisation forEconomic Co-operation and Development, Paris, France.
Ponting, Clive, 1991. A Green History of the World. London: Penguin books.
Rodda, J.C. and N.C. Matalas, 1987. Water for the future; Hydrology in perspective.Proceedings of the Rome Symposium. IAHS publ. no. 164.
Sahagian, D.L., F.W. Schwartz & D.K. Jacobs, 1994. Direct antropogenic contributionsto sea level rise in the twentieth century. Nature, Vol.367, 6 January 1994, p.54-57.
Savenije, H.H.G., and MJ. Hall, 1994. Climate and Land Use: a FeedbackMechanism?, in IHE report series, nr 29:93-108. Proceedings of the Delft Conference on"Water and Environment: Key to Africa's Development", 3-4 June, 1993, Delft, TheNetherlands.
102
Savenije, H.H.G., 1995a. New definitions for moisture recycling and the relation withland-use changes in the Sahel. Journal of Hydrology, 167:57-78, Elsevier, Amsterdam,The Netherlands.
Savenije, H.H.G., 1995b. The Runoff Coefficient as the Key to Moisture Recycling.Accepted for publication in Journal of Hydrology, Elsevier, Amsterdam, The Netherlands.
TNO-CHO, 1989. Water in The Netherlands. TNO Committee on HydrologicalResearch, Proceedings and Information no. 37.
UNCED, United Nations Conference on Environment and Development. 1992. Agenda21. Chapter 18 Protection on the Quality and Supply of freshwater resources. Volume II.U.N., New York, USA.
UNDP. 1990. Safe Water 2000, The New Delhi Statement, Global Consultation on SafeWater and Sanitation for the 1990s, New Delhi, 10-14 September, 1990. UNDP, NewYork, USA.
UNDTCD (Department of Technical Cooperation for Development) 1991. Legislative andEconomic Approaches to Water Demand Management. New York: United Nations.
UNDTCD (Department of Technical Cooperation for Development) 1991. IntegratedWater Resources Planning. New York: United Nations.
UNDTCD (Department of Technical Cooperation for Development) 1991. WaterManagement since the adoption of the Mar Del Plata action plan: Lessons for the1990s. New York: United Nations.
UNESCO/WMO/ICSU. 1993. The Paris Statement. International Conference onHydrology, Towards the 21st Century; Research and Operational Needs. UNESCO, Paris,22-26 March 1993. (in preparation).
United Nations. 1991. The Law of the Non-navigational Uses of InternationalWatercourses. Draft, International Law Commission, forty-third session, 29 April - 19July 1991. United Nations, New York, USA.
The World Bank. 1993. Water Resources Management, A World Bank Policy Paper.The World Bank. Washington D.C., USA.
WCED, World Commission on Environment and Development, 1987. Our CommonFuture. Report of "the Brundtland Commission". Oxford University Press, Oxford, UK.
103
Annotated Recommended Bibliography
Alaerts, G.J., T.L. Blair and FJ.A. Hartvelt. 1991. A strategy for Water SectorCapacity Building. Proceedings of the UNDP Symposium, 3-5 June 1991, IHE ReportSeries # 24, IHE, Delft, The Netherlands.
The proceedings of the Delft Symposium where the concept of "Water SectorCapacity Building" was brought to the world's attention. It was recognised that themain impedient to sustainable development of water resources is not the technologybut the lack of institutional and professional capacity in combination with anunfavourable policy environment. A strategy is presented for building thiscapacity, including: the creation of an enabling environment with appropriatepolicy and legal frameworks; institutional development, including communityparticipation; and human resources development and strengthening of managerialcapacity.
Brown, Lester R., (ed). 1995. State of the World 1995. Earthscan Publications Ltd.,London, UK.
A report that emphasises, again, the need for policy change to curve unlimitedgrowth scenarios back to sustainable levels of development. In the chapter onNature's Limits, Brown addresses the problems of population growth, depletionof natural resources, and climate change. He asks the question what will limit ourgrowth first: water scarcity, food scarcity or pollution. He thinks food shortagewill be the first physical boundary humanity will meet.
DANIDA, 1991. Copenhagen report. Implementation mechanisms for integrated waterresources development and management. Danida, Ministry of Foreign Affairs. Report fromCopenhagen Informal Consultation, November 11-14, 1991
The conference being a preparatory conference to the Dublin (1992) conferencediscussed most of the issues that were later confirmed by Dublin. The importanceof this document is that it launches two new important concepts: Demand-drivenDevelopment and Management at the Lowest Appropriate Level. Both conceptsproved highly relevant and have found their applications in a number of countries.
Engelman, R. and P. LeRoy. 1993. Sustainable Water; Population and the Future ofRenewable Water Supplies. Population and Environment Programme. Population ActionInternational, 1120 19th street NW Suite 550, Washington, DC 20036, USA.
An excellent awareness raising document, with ample material to illustrate thewater crisis that the world is facing in the coming years. The emphasis of thedocument is on the need for population control to reach sustainable levels of wateruse. It contains a very useful list for all the countires in the world of their percapity water availablity now and in the future.
Gleick, P H . , (ed), 1993. Water in crisis. A guide to the world's fresh water resources.Oxford University Press, Oxford, UK.
A very useful and powerful book to illustrate the crisis that the world will befacing in the coming decades with regard to the availability of fresh waterresources. The book contains lots of detailed information on water issues, waterresources, water quality, water uses and water policy, worldwide. Particularlyinteresting is Glieck's Chapter 9 on Water in the 21st century
104
Grigg, Neil S., 1985. Water Resources Planning. New York: McGraw HillA standard work, addressing water resources planning from an institutional,administrative, financial and economic angle. The book has a large number of casestudies in the USA.
Goodman, Alvin S., 1984. Principles of Water Resources Planning. Englewood Cliffs:Prentice-Hall
Another standard work, addressing engineering, water demand, project evaluation,public involvement, economic and financial analysis, modelling, environmental andsocial impacts, legal and administrative aspects.
Hoogendijk, Willem, 1993. The Economic Revolution; towards a sustainable future byfreeing the economy from money-making. International Books, Utrecht, TheNetherlands.
An interesting book which presents an economic philosophy that goes againsttraditional economic thinking. The author advocates zero growth, eco-taxing,small-scale development, internalising external costs, and limiting the value ofmoney.
ICWE, International Conference on Water and the Environment. 1992. The DublinStatement and Report of the Conference. 26-31 January 1992, Dublin, Ireland.
The most important conference for water managers in the 20th century, whichbrought water higher on the priority list when it comes to reaching sustainablelevels of development. The conference confirmed three important principles: Freshwater is finite and has to be managed in an integrated manner; the participatoryapproach to water resources management; water is an economic good. The keynotepapers contain several highly interesting and relevant documents.
IHE. 1994. Water and Environment, key to Africa's Development, ConferenceProceedings, 3-4 June 1993, IHE Report Series #29, IHE, Delft, The Netherlands.
A follow-up conference to the Earth Summit focusing on the implementation ofAgenda 21 in Africa. Important conclusions were that: water and environment areclosely linked in Africa and that sustainable development can only be reachedthrough appropriate land and water management; regional research and educationalcapacity in the field of water and environment needs to be created andstrengthened; an integrated approach to water and environmental managementshould be adopted including institutional and legal frameworks.
ISP AN, Irrigation Support Project for Asia and the Near East. 1994. Water Strategies forthe Next Century; Supply Augmentation vs. Demand Management. ISP AN TechnicalSupport Center, Arlington, Virginia, USA.
An interesting debate between an advocate for supply management and an advocatefor demand management, bringing out most of the contentious issues related tosustainable development.
Kern, Dolf, 1994. The carrying capacity concept applied to water resourcesmanagement. Individual study. IHE, Delft.
An interesting literature study into current knowledge and practises of carryingcapacity based planning and management.
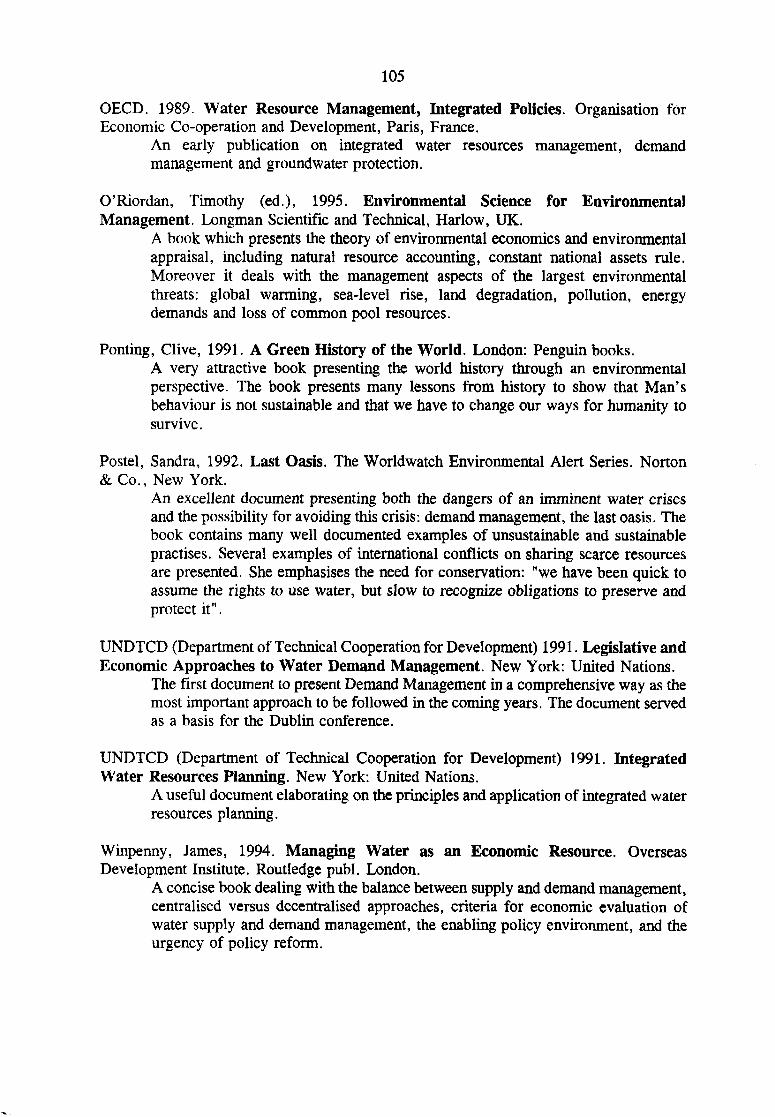
105
OECD. 1989. Water Resource Management, Integrated Policies. Organisation forEconomic Co-operation and Development, Paris, France.
An early publication on integrated water resources management, demandmanagement and groundwater protection.
O'Riordan, Timothy (ed.), 1995. Environmental Science for EnvironmentalManagement. Longman Scientific and Technical, Harlow, UK.
A book which presents the theory of environmental economics and environmentalappraisal, including natural resource accounting, constant national assets rule.Moreover it deals with the management aspects of the largest environmentalthreats: global warming, sea-level rise, land degradation, pollution, energydemands and loss of common pool resources.
Ponting, Clive, 1991. A Green History of the World. London: Penguin books.A very attractive book presenting the world history through an environmentalperspective. The book presents many lessons from history to show that Man'sbehaviour is not sustainable and that we have to change our ways for humanity tosurvive.
Postel, Sandra, 1992. Last Oasis. The Worldwatch Environmental Alert Series. Norton&Co. , New York.
An excellent document presenting both the dangers of an imminent water crisesand the possibility for avoiding this crisis: demand management, the last oasis. Thebook contains many well documented examples of unsustainable and sustainablepractises. Several examples of international conflicts on sharing scarce resourcesare presented. She emphasises the need for conservation: "we have been quick toassume the rights to use water, but slow to recognize obligations to preserve andprotect it".
UNDTCD (Department of Technical Cooperation for Development) 1991. Legislative andEconomic Approaches to Water Demand Management. New York: United Nations.
The first document to present Demand Management in a comprehensive way as themost important approach to be followed in the coming years. The document servedas a basis for the Dublin conference.
UNDTCD (Department of Technical Cooperation for Development) 1991. IntegratedWater Resources Planning. New York: United Nations.
A useful document elaborating on the principles and application of integrated waterresources planning.
Winpenny, James, 1994. Managing Water as an Economic Resource. OverseasDevelopment Institute. Routledge publ. London.
A concise book dealing with the balance between supply and demand management,centralised versus decentralised approaches, criteria for economic evaluation ofwater supply and demand management, the enabling policy environment, and theurgency of policy reform.
106
World Bank. 1993. Water Resources Management, A World Bank Policy Paper. TheWorld Bank. Washington D.C., USA.
One of the most important water resources documents of the century, not becausethe World Bank has it all right, but because this document will continue to guideinternational financing in the water sector for many years. The documentemphasises the need for economic pricing, cost recovery, integrated waterresources management, for management of international river basins,decentralization, privatization, and incorporation of environmental criteria inplanning and management.
WCED, World Commission on Environment and Development, 1987. Our CommonFuture. Report of "the Brundtland Commission". Oxford University Press, Oxford, UK.
The first document to launch the concept of sustainable development world wide.The main focus of the book is on population, food, biodiversity, energy andindustry. However, the word water hardly appears in the document, and when itdoes, it is in relation to urban water supply. The availability of water resourceswas certainly not addressed as one of the main constraints for sustainabledevelopment. Nevertheless, the book is a classic.

P.O. Box 3015 Tel. :+31(0)15 21517152601 DA Delft Fax :+31(0)15 2122921
D E L F T The Netherlands E-mail: [email protected]