water resources of sleeping bear … resources of sleeping bear dunes national lakeshore, michigan...
TRANSCRIPT

WATER RESOURCES OF SLEEPING BEAR DUNES
NATIONAL LAKESHORE, MICHIGAN
By A. H. Handy and J. R. Stark
U.S. GEOLOGICAL SURVEY
Water-Resources Investigations Report 83-4253
Prepared in cooperation with the
NATIONAL PARK SERVICE
Lansing, Michigan 1984
UNITED STATES DEPARTMENT OF THE INTERIOR
WILLIAM P. CLARK, Secretary
GEOLOGICAL SURVEY
Dallas L. Peck, Director
For additional information write to:
District ChiefU.S. Geological Survey6520 Mercantile Way, Suite 5Lansing, Michigan 48910
Copies of this report can be purchased from:
Open-File Services Section Western Distribution Branch U.S. Geological Survey Box 25425, Federal Center Denver, Colorado 80225 Telephone: (303) 234-5888
CONTENTS
PageAbstract -------------------------------------------------------- iIntroduction ---------------------------------------------------- 2
Purpose and scope ------------------------------------------ 5Acknowledgments -------------------------------------------- 5Methods of investigation ----------------------------------- 5
Geology --------------------------------------------------------- 6Recent alluvium and dune sand ------------------------------ 6Glacial deposits ------------------------------------------- 6Bedrock ---------------------------------------------------- 13
Surface Water --------------------------------------------------- 14Lakes ------------------------------------------------------ 14
Lake Michigan ----------------------------------------- 18Streams ---------------------------------------------------- 18
Ground Water ---------------------------------------------------- 19Potentiometric surface ------------------------------------------ 19
Potential yield of aquifers -------------------------------- 22Water use -------------------------------------------------- 22Water quality ---------------------------------------------- 22
Water resources of Manitou Islands ------------------------------ 24North Manitou Island --------------------------------------- 24South Manitou Island --------------------------------------- 25
Conclusions ----------------------------------------------------- 26References ------------------------------------------------------ 27Tables ---------------------------------------------------------- 29
Figures
Page
Figure 1. Location of Sleeping Bear Dunes National Lakeshore --- 22. Park boundary and physical and cultural features ----- 33. Topography of the land surface ----------------------- 44. Distribution of alluvium, dune sand, and glacial
deposits ------------------------------------------- 75. Extent of Port Huron ice advance --------------------- g6. Extent of Greatlakean ice advance -------------------- 97. Glacial processes during Greatlakean advance --------- XQ8. Cross sections showing composition of glacial
deposits ------------------------------------------- n9. Kettles east of Empire ------------------------------- 12
10. Subcropping bedrock formations and altitude ofbedrock surface ------------------------------------ ^3
11. Location of surface- and ground-water sampling anddata-collection sites ------------------------------ 15
12. Lake levels of selected lakes ------------------------ 1513. Potentiometric surface in glacial deposits ----------- 2014. Water levels in shallow well 5 and deep well 6 near
Empire --------------------------------------------- 2115. Specific capacity of wells in glacial deposits ------- 2316. Location of wells drilled on South Manitou Island
in 1982 -------------------------------------------- 25

TABLES
Page
Table 1. Chemical and physical characteristics of lakes -------- 302. Drinking water standards of the U.S. Environmental
Protection Agency ----------------------------------- 173. Discharge of streams flowing through park ------------- 184. Chemical and physical characteristics of streams ------ 325. Chemical and physical characteristics of ground
6. Chemical and physical characteristics of water onNorth and South Manitou Islands --------------------- 37
7. Logs of wells installed on South Manitou Island in
11
DEFINITION OF TERMS
Altitude. Vertical distance of a point or line above or below theNational Geodetic Vertical Datum of 1929. The National Geodetic Vertical Datum of 1929 (NGVD of 1929) is a geodetic datum derived from a general adjustment of the first-order level nets of both the United States and Canada, formerly called mean sea level. International Great Lakes Datum of 1955 (IGLD of 1955) is a vertical control datum used on the Great Lakes system.
Aquifer. A formation, group of formations, or part of a formation tKat contains sufficient saturated permeable material to yield significant quantities of water to wells and springs. It is also called a ground-water reservoir.
Bedrock. Designates consolidated rocks.
Concentration. The weight of dissolved solids or sediment per unit volume of water expressed in milligrams per liter (mg/L) or micrograms per liter (yg/L).
Contour. An imaginary line connecting points of equal altitude,wHether the points are on the land surface, or on a potentiometric or water-table surface.
Ground water. Water that is in the saturated zone from which wells, springs, and ground-water runoff are supplied.
Hydraulic conductivity. The volume of water at the prevailing kinematic viscosity that will move in unit time under a unit hydraulic gradient through a unit area measured at right angles to the direction of flow. In general terms, hydraulic conductivity is the ability of a porous medium to transmit water.
Hydrograph. A graph showing the variations of stage, flow, velocity, discharge, or other aspect of water with aspect to time.
IGLD of 1955. See altitude.
NGVD of 1929. See altitude.
Potentiometric surface. An imaginary surface representing the levels to which water will rise in tightly cased wells. More than one potentiometric surface is required to describe the distribution of head. The water table is a particular potentiometric surface.
Recharge. The process by which water is infiltrated and is added to the zone of saturation. It is also the quantity of water added to the zone of saturation.
111

DEFINITION OF TERMS--Continued
Runoff. That part of precipitation that appears in streams; the water draining from an area. When expressed in inches, it is the depth to which an area would be covered if all the water draining from it in a given period were uniformly distributed on its surface.
Specific capacity. The rate of discharge of water from a well divided by the drawdown of water level within the well.
Specific conductance. A measure of the ability of water to conductan electric current, expressed in micromhos (ymhos) per centimeter at 25°C. Because the specific conductance is related to amount and type of dissolved material, it is used for approximating the dissolved-solids concentration of water. For most natural waters the ratio of dissolved-solids concentration (in milligrams per liter) to specific conductanc (in micromhos) is in the range 0.5 to 0.8.
Subcrop. Consolidated rock directly underlying glacial deposits; would be exposed if all glacial deposits were removed.
Water table. That surface of an unconfined water body at which the pressure is atmospheric. It is defined by levels at which water stands in wells that barely penetrate the water surface.
CONVERSION FACTORS
The inch-pound units used in this report can be converted to the metric (International) system of units as follows:
Multiply inch-pound unit
inchfoot (ft)mile (mi)square mile (mi 2 )gallon per minute (gal/min)gallon per minute per foot
((gal/min)/ft)cubic foot per second (ft 3/s) cubic foot per second per
square mile ((ft3/s)/mi 2 ) micromho per centimeter
(ymho/cm)acre- foot (acre-ft) degree Fahrenheit (°F)
Bv.
25.400.30481.6092.590 -5
6.309 x 10 0.2070
0.02830.01093
1.000
1.233 x 10" 3 ((°F)-32)/U
To obtain metric unit
millimeter (mm)meter (m)kilometer (km)square kilometer (km2 )cubic meter per second (m3/s)liter per second per meter
cubic meter per second (m3/s) cubic meter per second per
square kilometer ((m3/s)/km2 ) micros iemen per centimeter
(yS/cm)cubic hectometer (hm3 ) degree Celsius (°C)
IV

WATER RESOURCES OF SLEEPING BEAR
DUNES NATIONAL LAKESHORE, MICHIGAN
by
A. H. Handy and J. R. Stark
ABSTRACT
Sleeping Bear Dunes National Lakeshore is a water-rich area. It
borders Lake Michigan, and several small streams flow through the park
to the lake. Small lakes are numerous within the park and near its
boundaries. Ground water is available at most places in park and wells
yield as much as 100 gallons per minute.
Water from streams, lakes, wells, and springs is acceptable for
most uses. Dissolved solids range from 35 to 180 mg/L in lakes, from
145 to 214 mg/L in streams and from 136 to 468 mg/L in ground water.
Analyses of samples for pesticides and trace metals indicate that no
pesticides are present in the water, and that concentrations of trace
metals do not exceed U.S. Environmental Protection Agency recommended
drinking-water standards.
Surface and ground water are available in sufficient quantity
in most areas of the park for the development of water supplies for
visitor's centers, campgrounds, picnic areas, and other park facilities

INTRODUCTION
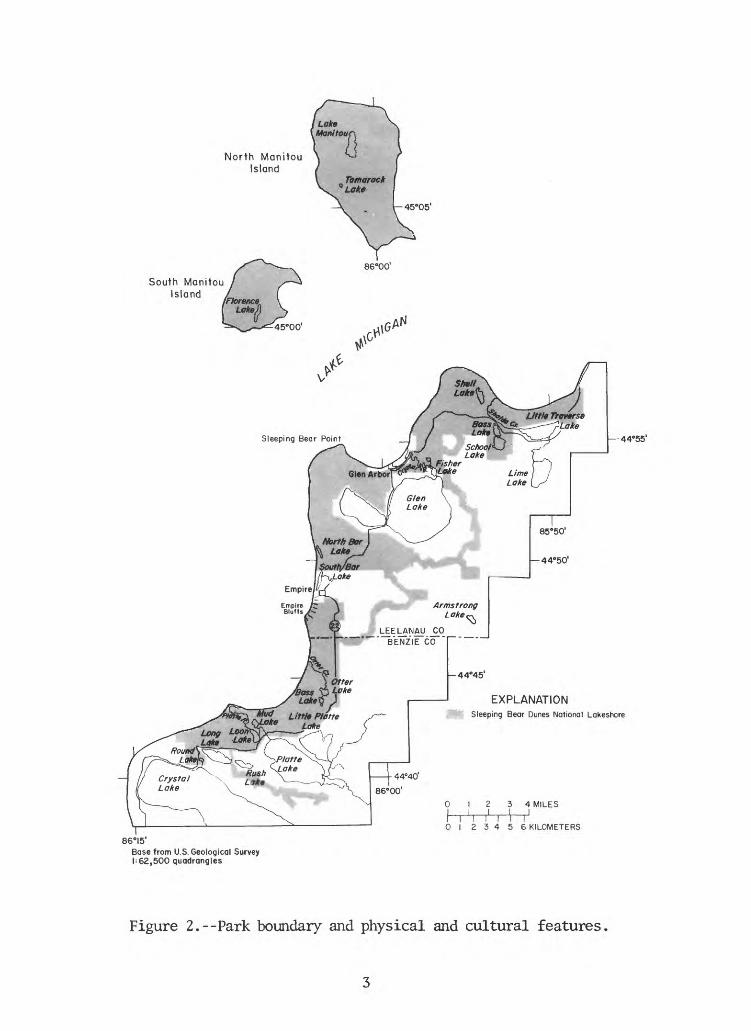
Sleeping Bear Dunes National Lakeshore^ is in the northwest part of Michigan's Lower Peninsula in Benzie and Leelanau Counties (fig. 1); it borders Lake Michigan. Two nearby islands, South Manitou and North Manitou Islands, are part of the park (fig. 2).
Sleeping Bear Dunes National Lakeshore was author ized by the Congress in 1970. This authorization provided for the establishment of boundaries and the purchase of land. Although establishment of the National Park Lakeshore is relatively recent, the area has long been used for recre ation. About 718,000 people will visit the Lakeshore in 1983 and 1,400,000 in the year 2000 according to Park Service estimates (oral communication, 1988).
SUPERIOR
85°
Sleeping Bear Dunes National Lakeshore
o___so MILES0 50 KILOMETERS LAKE
ERIE
Figure 1.--Location of Sleeping Bear Dunes National Lakeshore.
The park takes its name from Sleeping Bear Dune, a landmark that can be seen for miles from many directions. This dune-capped morainal plateau rises as much as 440 feet above Lake Michigan. Throughout much of the park the land surface is quite rolling (fig. 3). From an altitude of 579 feet along the shores of Lake Michigan, the surface forms steep 200- to 300-foot bluffs at several places and rises to an altitude of more than 1,000 feet at a few places. Empire Bluffs at Empire reach a height of 390 feet above the lake. These bluffs are also capped by dunes.
The boundary of the park contains 64 miles of Lake Michigan shore line--31 miles on the mainland, 13 miles on South Manitou Island, and 20 miles on North Manitou Island. In most places, the shoreline is a sand, gravel, or cobble beach.
The park includes inland lakes that are shallow and small. They range in size from 15 acres to 160 acres. Streams include all of Otter Creek, parts of Shalda Creek and Crystal River, and 3 miles of the Platte River from Platte Lake to its mouth.
Commonly referred to as park in this report,
North Manitou Island
South Manitou Island
44C55'
EXPLANATIONSleeping Bear Dunes National Lakeshcre
01234 MILESI I I IT~Irnir
01 23456 KILOMETERS86°I5'
Base from U.S. Geological Survey h62,500 quadrangles
Figure 2.--Park boundary and physical and cultural features

North Manitou Island
South Manitou Island
44°55
EXPLANATION-700-Line of equal altitude of land
surface ; interval is I'/) feet. NGVD of 1929
3 4 MILES J___I
I I I I I I I01 23456 KILOMETERS
86° IS'
Base from U.S. Geological Survey 1=62,500 quadrangles
Figure 3.--Topography of the land surface,

2The average annual precipitation, about 33 inches , is well dis tributed throughout the year. The period May to October receives an average of 57 percent of the total amount. Summer precipitation is mainly in the form of afternoon showers and thundershowers. The average annual temperature is about 45°F. In 1980, the maximum temperature was 85°F in June; the minimum was -6°F in February. Low temperatures of -5°F and -1°F were recorded in 1977 and 1978 (Fred V. Nurnberger, State Climatologist, written communication, 1981).
Purpose and Scope
The purpose of this investigation was to (1) describe general hydrogeologic conditions in the area, and (2) assess the ground- and surface- water resources of Sleeping Bear Dunes National Lakeshore and their potential for future development.
Acknowledgment s
Acknowledgment is made to personnel of the Sleeping Bear Dunes National Lakeshore, National Park Service for their assistance and cooperation. Acknowledgment is also made to R. L. LeuVoy, G. L. Morin, S. J. Rheaume, R. J. Minnerick, and J. C. Failing who assisted in the collection of hydrologic data. Cartographic and art work provided by S. M. Beall.
Methods of Investigation
Ten wells were drilled in the lakeshore area during the project (March 1979 to September 1982). Eight were drilled for public supply and two for monitoring of water levels and water quality. Four of these wells were carefully logged and the geology studied; drillers records are available for the other six wells. Ground water and geologic maps were drawn using data from these and other wells in the area. Water from the new wells, 12 other wells, and 2 springs was analyzed for metals, pesticides, and other constituents. Laboratory analyses of water from lakes and streams were made, as well as field measurements of specific conductance, pH, bicarbonate, carbonate, and dissolved oxygen. Discharge measurements were made each year of the study at the lake outlets and rating curves constructed in order to estimate lowest average 7-day discharge.
2 Climatic data are for the period 1979-81 at the Frankfort weatherstation just southwest of the park.
GEOLOGY
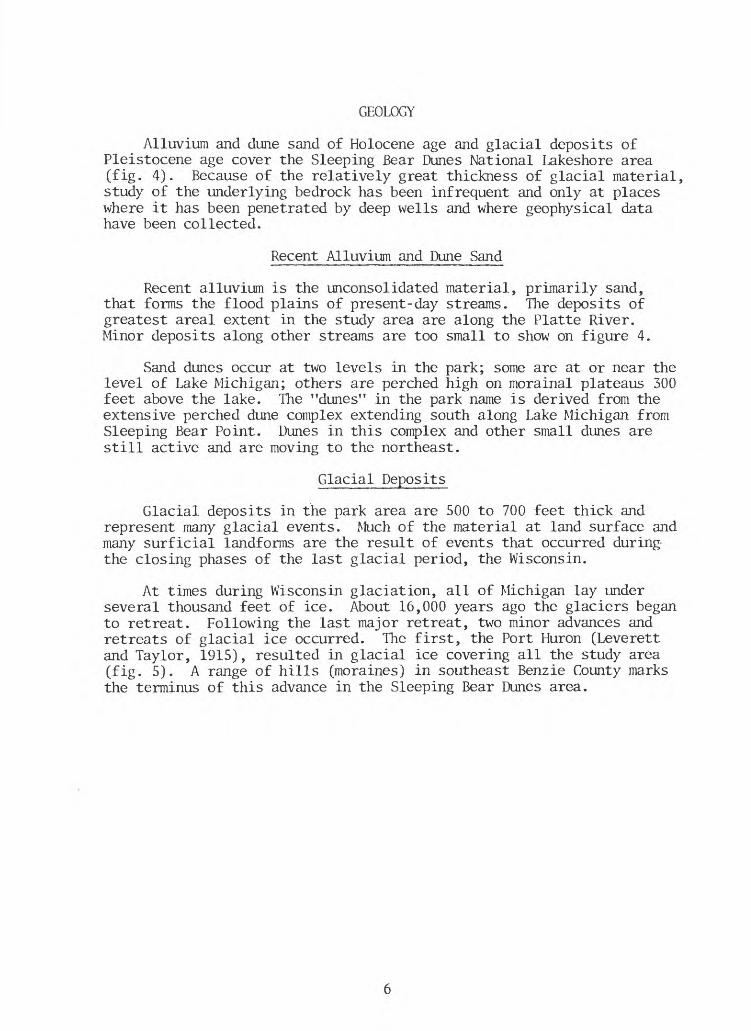
Alluvium and dune sand of Holocene age and glacial deposits of Pleistocene age cover the Sleeping Bear Dunes National Lakeshore area (fig. 4). Because of the relatively great thickness of glacial material, study of the underlying bedrock has been infrequent and only at places where it has been penetrated by deep wells and where geophysical data have been collected.
Recent Alluvium and Dune Sand
Recent alluvium is the unconsolidated material, primarily sand, that forms the flood plains of present-day streams. The deposits of greatest areal extent in the study area are along the Platte River. Minor deposits along other streams are too small to show on figure 4.
Sand dunes occur at two levels in the park; some are at or near the level of Lake Michigan; others are perched high on morainal plateaus 300 feet above the lake. The "dunes" in the park name is derived from the extensive perched dune complex extending south along Lake Michigan from Sleeping Bear Point. Dunes in this complex and other small dunes are still active and are moving to the northeast.
Glacial Deposits
Glacial deposits in the park area are 500 to 700 feet thick and represent many glacial events. Much of the material at land surface and many surficial landforms are the result of events that occurred during the closing phases of the last glacial period, the Wisconsin.
At times during Wisconsin glaciation, all of Michigan lay under several thousand feet of ice. About 16,000 years ago the glaciers began to retreat. Following the last major retreat, two minor advances and retreats of glacial ice occurred. The first, the Port Huron (Leverett and Taylor, 1915), resulted in glacial ice covering all the study area (fig. 5). A range of hills (moraines) in southeast Benzie County marks the terminus of this advance in the Sleeping Bear Dunes area.
North Monitou Island
South Manitou Island
[ M I
[ W I
[ L |
[ G I
[ R |
I D I
44°55'
660I5'
Base from U.S. Geological Survey h62,500 quadrangles
EXPLANATIONMorainol deposit
Outwash
Lakebed deposit
Alluvium, glacial
Alluvium, recent
Dune sand, recent
Deposit contact
Lake Michigan shoreline near end of Wisconsin glacial period
Line of section for figure 8
Figure 4.--Distribution of alluvium, dune sand, and glacial deposits

Sleeping Bear Dunes National Lakeshore
Lake Chicago
0 30 60 MILES I \ r 0 50 100 KILOMETERS
Adapted from Leverett and Toy lor, 1915
Figure 5.--Extent of Port Huron ice advance.
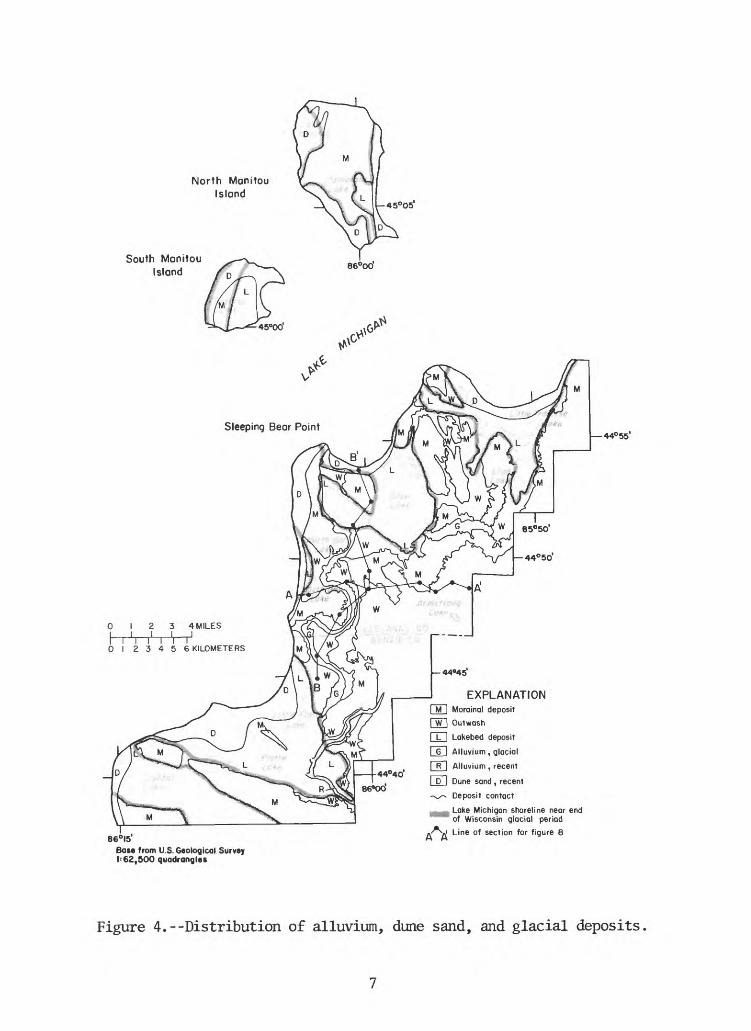
The second minor advance, Greatlakean (Burgis, 1977 and Martin, 1957), covered much of the study area (fig. 6) and was responsible for reshaping many of the landforms in the immediate vicinity of the park. The ice reached a terminus a few miles east of the present Lake Michigan shore, leaving deposits that form most of the hilly areas. As the Greatlakean ice advanced, small lobes of ice funneled into pre-existing lowlands. Glacial processes in these lobes resulted in erosion in the lowlands and deposition between and at the margins of the lobes (fig. 7). The larger lakes in the park area now occupy the lowlands.
Terminal and recessional moraines form the hills in the park area. These moraines consist of a variety of sediment types. The cores of the moraines probably contain material deposited by glacial ice prior to the last two minor ice advances. Draped over this are red, sandy tills deposited during the Greatlakean or Port Huron glaciations, sand and gravel deposited by superglacial streams, and sand deposited by wind.

North ManJJou Island
South Manitou island
44«55*
86*15'Base from U.S. Geological Survey 1-62,500 quadrangles
01 23456 KILOMETERS
Adapted from Martin , 1957
Figure 6.--Extent of Greatlakean ice advance,
Superglociol stream
Deposition
Land surface
Figure 7.--Glacial processes during Greatlakean advance.
Most of the surface of the morainal complex is covered by well-sorted sand. Coarse sand and gravel are exposed in gravel pits along the crests of the moraine. Clay-rich, red till can be seen in some cuts in the flanks of morainal hills. High bluffs along Lake Michigan, including the bluffs upon which Sleeping Bear Dune rests, are formed by recessional moraines. Moraines border parts of most lakes.
A thick unit of sand and gravel outwash forms a relatively flat area east of the morainal area. This outwash, deposited by melt-water streams flowing from the margin of the glacier ice, is greater than 200 feet thick in some areas and is a primary source of water to wells. The composition and relationship of glacial deposits is shown in figure 8.
10

I200-.
1100 -i
1000 -I
900 -J
800 H
t 700 -
600 H
400
1200
\- 1100
\- 1000
EXPLANATION ES Gravel E3 Sandgg Sand and gravel g£ Sand, gravel,and clay E3 Clay or cloy and silt
0 I 2 MILES
0123 KILOMETERS
h 800
k- 700
500
400
I- 1100
h 1000
h-900
^800
k-700
600
\- 500
Figure 8.--Gross sections showing composition o£ glacial deposits (line of section shown on figure 4).
11

Kettles were produced in areas where stagnant ice masses were covered by sand and gravel. A number of kettles occur in the plateau area 3 to 8 miles east of Empire (fig. 9). Some small lakes, such as Armstrong Lake, are kettles that contain water.
R.I4W R.I3W.
T.27N.
Bose from U.S. Geologicol Survey 1:62,500 quadrangle
EXPLANATION 900 Line of equal altitude of land surface;
interval 100feet. NGVD of 1929
I Kettle
I MILE J
I KILOMETER
Figure 9.--Kettles east of Empire.
Final retreat of ice resulted in large variations in the level of water in Lake Michigan. At high levels the lake extended inland flooding some of the land. Lakebeds formed in the inundated areas (fig. 4) and wave-cut cliffs formed along the shoreline. During the final stages, bars developed and landlocked the inundated waters (Calver, 1946) to form most of the present-day lakes. Sleeping Bear Dune was deposited when the level of Lake Michigan held steady at an altitude of about 612 feet.
12

Bedrock
Bedrock is the consolidated rock underlying the glacial deposits. It consists of a thick sequence of layered sedimentary units, primarily sandstone, shale, and limestone. The subcropping bedrock (fig. 10) is the Antrim Shale of Mississippian age and limestone of the Traverse Group of Devonian age (300 to 350 million years old). The eroded bedrock surface is at altitudes ranging from below sea level to 200 feet above.
Little is known about the geologic history of the area during the period between deposition of the Traverse-Antrim formations and the glacial deposits overlying them. The absence of rocks representing this interval suggests that the time was one in which rocks either were not deposited or, if deposited, were subsequently eroded.
North Manitou Island
South Manitou Island
: : : : 44-55'
EXPLANATION
of 1929
Rock formations: dH Traverse G.oup
ED Antrim Shale
D I 2 3 4 MILES
I 01 23456 KILOMETERS
86'I5'
Base fro Altitude of Const
m US Geological Survey I 62,500 quadrangles of bedrock surface from Michigan Department irvation (1938) map
Figure 10.--Subcropping bedrock formation and altitudeof bedrock surface.
13

SURFACE WATER
Lakes
Small lakes are an important aspect of the water resources of Sleeping Bear Dunes Lakeshore; 15 lie within or are adjacent to the park boundary (fig. 2). All lakes are ice covered from January to early April; maximum ice cover occurs in February and March. Ice thicknesses of 20 inches at Crystal Lake and 27 inches at Little Traverse Lake have been recorded (Sleator, 1978). Figure 11 shows sites where water information was collected. Figure 12 shows changes in water levels of selected lakes.
North Bar Lake is unique in that it is separated from Lake Michigan only by a large sand bar. At times, wind and Lake Michigan currents wash out the sand bar and water flows into Lake Michigan. Once flow ceases, the sand bar begins to rebuild. This process was observed near the end of June 1979, during June and July 1980, and near the end of September 1982. The lowest levels in 1980 (fig. 12) occurred during periods when the bar had been washed out. The hydrograph indicates that the sand bar may have washed out at other times during the study. South Bar Lake is similar to North Bar Lake but there is no evidence that the sand bar separating it from Lake Michigan washes out.
The water level of Otter Lake varied only half a foot from spring thaw in May 1979 until it froze over in January 1980. Otter Lake has a small inlet and a small outlet; ground-water inflow is the principal source of water. School Lake has only an outlet and also is ground- water fed. Its level varied about 1 foot during the measurement period 1980-82. Levels of Platte and Glen Lakes varied less than half a foot.
Chemical and physical analyses of water from North Bar, School, and Glen Lakes, and Lake Michigan are shown in table 1.(at back of report). Analyses of water from Manitou and Florence Lakes are shown in table 6 (at back of report). In addition to these analyses, field measurements of specific conductance were made for the lakes listed below.
Specific conductance Number of Lake (ymhos at 25°C) measurements
Loon LakeBass Lake (nr Otter Lake)South Bar LakeBass Lake (nr School Lake)Shell LakeRound LakeRush Lake
289-330294-300310-350210-240220-240300350
3332211
14

North Manitou Island
South Manitou Island
44-55'
EXPLANATION5 Well location and number
8~O Spring location and number
Location and number of discharge measurement site
34 -\- Location and number of lake data collection site
V Location af quality sampling site
86°I5'
Base from U.S. Geological Survey 1:62,500 quadrangles
Figure 11.--Location of surface- and ground-water sampling anddata-collection sites.
15

1.5
1.0
0.5
0
10
I I I I I I I I I I Glen Lake
I n i i i i i i i i i i
i i i i i ii i i i i i i iOtter Lake
I T I I I I II I ! I I I I I I I I I I |I i
Effect of dam built by beavers
iirniiiiiiijir North Bar Lake
1 1 I I i I I I I I I I 1 I I I 1 I I I I I I I I
10
School Lake
I I I iJiF M A MJJ ASOND J FMAMJIJ ASOND JiF M AiM J J A S.O N D JFMAMJ JASOND
1979 1980 1981 1982
YEAR
Figure 12.--Lake levels of selected lakes (dashed line indicates missing record).
16

A comparison of analyses of lake water in table 1 to drinking water standards of the U.S. Environmental Protection Agency (1977a, 1977b) in table 2 indicate that water from lakes is of excellent quality and meets criteria for all constituents in the table. It is frequently hard, however. Concentrations of nutrients and trace metals were low; no pesticides were detected.
Table 2.--Drinking water standards of theU.S. Environmental Protection Agency
(1977a, 1977b)
Constituentor
property
Maximumcontaminant levels
for inorganicchemicals
Secondary maximum contaminant levels
Arsenic (As)
Barium (Ba)
Cadmium (Cd)
Chloride (Cl)
Chromium (Cr)
Color (Units)
Fluoride (F)
Iron (Fe)
Lead (Pb)
Manganese (Mn)
Mercury (Hg)
Nitrate (N03 as N)
pH (Units)
Selenium (Se)
Silver (Ag)
Sulfate (S04 )
Zinc (Zn)
Total dissolved solids
50 yg/L
1,000 yg/L
10 ug/L
50 yg/L
1.4 to 2.4 mg/L
50
2 ug/L
10 mg/L
10 yg/L
50 u/L
250 mg/L
15 units
300 yg/L
50 yg/L
6.5 to 8.5 units
250 mg/L
5,000 yg/L
500 mg/L
17

Lake Michigan
Lake Michigan, which has a surface area of 22,400 square miles and a maximum depth of 923 feet, influences the climate over an extensive area. From 1900 to 1980, the mean water level of Lake Michigan was 579 feet above IGLD of 1955 (U.S. Army Corps of Engineers, 1981). During this investigation, the level ranged from 578.00 in March 1978 to 579.7 in July 1979. Comprehensive data on levels of Lake Michigan are included in reports by Torrey (1976), Beeton and Chandler (1962) and Bell (1980).
Water was collected for chemical analysis from Lake Michigan at site 34, 1 mile west of the end of Esch Road near Empire, Michigan. Samples were obtained at depths of 20, 40, 60, 80, and 100 feet, and composited. The analysis (table 1, at back of report) indicates that the water is similar in most respects to that of inland lakes and streams.
Streams
Platte River, Otter Creek, Crystal River, and Shalda Creek flow through the park to Lake Michigan. Discharge measurements, made at six locations on these streams (fig. 11), are shown in table 3. The
Table 3.--Discharge of streams flowing through park (in cubic feet per second)
Date
May 9, 1979May 10, 1979Aug. 14, 1979Aug. 15, 1979Aug. 16, 1979Aug. 17, 1979Oct. 29, 1979Oct. 30, 1979May 12, 1980May 13, 1980May 14, 1980May 15; 1980Aug. 26, 1980Aug. 27, 1980Aug. 28, 1980May 5, 1981May 7, 1981Oct. 26, 1981Oct. 27, 1981Oct. 28, 1981May 24, 1982May 25, 1982May 26, 1982
04126755 Platte River at M-22 nr Honor
283
179
183
158
119192
160144
04126758 Platte River at
weir on Loon Lake nr Honor
307
186
190
173
122209
156
140
04126765 Otter Creek
at Otter Lake nr Empire
6.84
3.86
4.68
6.14
3.09
1.853.39
5.00
04126767 Otter Creek at
Aral Road nr Empire
21.6
21.1
17.716.4
14.8
13.6
14.9
16.9
04126802 Crystal River nr Glen Arbor
92.0
49.4
54.9
54.1
23.1
78.0
60.2
34.4
04126810 Shalda Creek nr Glen Arbor
54.9
20.0
26.6
28.3
17.1
37.1
20.6
23.1
measurements were used to estimate values for the lowest average 7-day flow for 2- and 10-year recurrence intervals. These low-flow values follow:
18

StreamDrainage
area (mi 2 )
Lowest average 7-day discharge, in ft3/s, for indicatedrecurrence interval,
(in parentheses, (£t3/s)/mi2 )
2-year 10-year
04126755 Platte River atM-22 nr Honor
04126758 Platte River at Weiron Loon Lake nr Honor
04126765 Otter Creek atOtter Lake nr Empire
04126767 Otter Creek atAral Road nr Empire
04126802 Crystal Rivernr Glen Arbor
04126810 Shalda Creeknr Glen Arbor
166
169
1.
9.
42.
33.
2
55
0
8
120
120
3.0
15
30
17
(0.
(0.
(2.
(1.
(0.
(0.
72)
71)
50)
57)
71)
50)
100
100
2.5
14
24
14
(0.
(0.
(2.
(1.
(0.
(0.
60)
59)
08)
47)
57)
41)
Low-flow values are commonly used by planners and managers as indicators of dependable flows for water supplies without need for storage.
The flow of Otter Creek during low-flow conditions seems to be due largely to ground-water inflow. Seepage along the stream bank is evident at several locations and several springs were found during field recon naissance. A comparison of chemical characteristics of water at the mouth of Otter Creek (site 04126767, table 4, at back of report) with those of a spring (site 8, table 5, at back of report) further suggests that this is true.
Platte and Crystal Rivers are also in an area characterized by seeps and springs. Ground-water inflow seems to be a significant component of streamflow throughout the year.
Water of streams in the park area is of excellent quality when compared to U.S. Environmental Protection Agency drinking water standards (table 2). Pesticides were not detected and suspended-sediment concen trations were low. On May 24-26, 1982, sediment concentrations ranged from 3 to 11 mg/L. With the exception of Otter Creek, flow was low at the time of sampling.
GROUND WATER
Potentiometrie Surface
The potentiometric surface (fig. 13) reflects the altitude of the water surface in wells, lakes, and streams. Because of the variety of sources of water-level data used and the complexity of the geology, the potentiometrie surface may reflect several flow systems. Water levels
19

North Monitou Island
South Manitou Island
44°55'
EXPLANATION 750 Line of equal altitude of generalized
potenfiomefric surface; interval is 50 feet NGVD of 1929
3 4 MILES
\ \ I I 01 23456 KILOMETERS
86°I5'
Base from U.S. Geological Survey 1:62,500 quadrangles
Figure 13.--Potentiometric surface in glacial deposits,
20

in two wells, shallow well 5 and deep well 6, were measured either monthly or continuously, with an automatic recorder, during this study. Figure 14 shows that levels in the two wells fluctuated less than 2 feet during the period from August 1980 to August 1982. Water levels in the shallow well are affected more by climatic conditions than are those in the deep, as shown by the high levels in spring. Water levels in both wells gradually declined during the period^of study indicating, because there is no pumpage in the vicinity, a reduction in recharge.
22
23
24
LJ O
oz <_J£3LJ CD
LJ 26L__ 112
CL LJ
iQ. LJQ
113
14
15
Well 5S
I I I I I I I I I I I I I_I i |
I I I I I 1 I I I I I I I I I I I I I I T T |I | I I | I I I | | I
Well 6D
JFMAMJ JASOND1980
JFMAMJJASOND1981
JFMAMJJASOND1982
YEAR
Figure 14.--Water levels in shallow well 5 and deep well 6 near Empire.
The shape of the potentiometric surface is typical of the shape of such surfaces in humid areas with high relief. Ground water flows from recharge areas in the uplands to discharge areas (streams and lakes) in the lowlands. Generally, the depth to water is greater in upland areas than in the lowlands. In the park area the gradient, or slope of the potentiometric surface, ranges from 25 to 50 feet per mile. It is steepest in areas of high surface relief and low hydraulic conductivity (moraines) and is slight in areas of low relief underlain by materials of high hydraulic conductivity (outwash plains).
21

The potentiometric map (fig. 13), in conjunction with a topographic map (fig. 3) of the area, can be used to estimate the depth to water, by subtracting, at any point, the altitude of the potentiometric surface from the altitude of the land surface.
Potential Yield of Aquifers
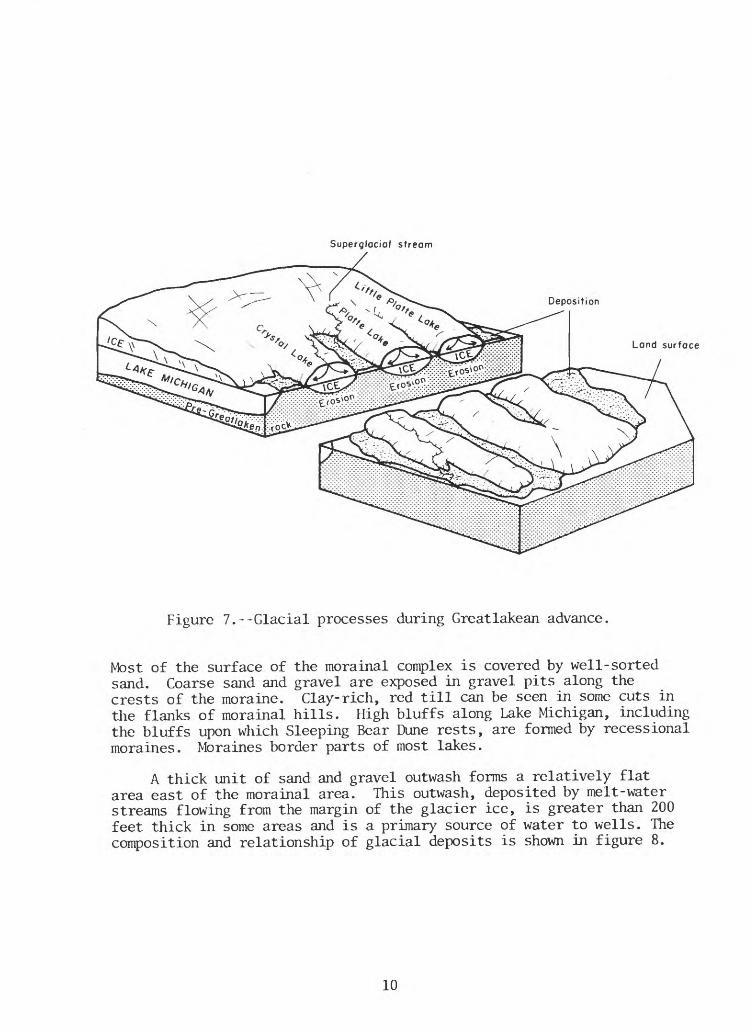
The potential water-yielding abilities of aquifers can be estimated from specific capacity--the discharge of a well divided by drawdown of the water level in wells. Values of specific capacity, as derived from data on driller's records, generally ranged from 50 to less than 1 (gal/min)/ft. High values, indicating areas of high potential well yield, as shown in figure 15, generally are in areas underlain by glacial outwash or lakebed deposits. Low values occur in morainal areas.
Wells 11 and 12 (fig. 11), 87 and 85 feet deep, respectively, were installed in a park campground along Platte River in 1981. Depth to water in both wells was about 17 feet, a few feet above the leveliof nearby lakes. The 6-inch wells have 15-foot screens set at the bottom of the hole and are in glacial deposits consisting primarily of sand and gravel. Well 12 penetrated a 19-foot thick clay unit between 25 and 44 feet below land surface.
Pumping tests at about 100 gal/min were conducted on both wells. Drawdowns were 11.8 ft in well 11 and 13.6 ft in well 12, indicating specific capacities of 7.5 to 8.5 (gal/min)/ft. Because the pumping rate was near the maximum transmitting capacity of the screen, the specific-capacity value may be low. Without nearby observation wells, further evaluation of potential yields was not possible. The data indicate, however, that wells in the sand and gravel aquifers in the park can yield 100 gal/min without difficulty and that wells having larger diameters or longer screens can probably produce 150 gal/min or more.
Water Use
The greatest use of water, excluding recreational use of surface water, is for domestic purposes. This use ranges from 10 to 15 gal/day/ person and is greatest during the summer months when travel through the park is greatest. By the year 2000, about 10,000 people will visit the park daily during the busy season and will use 100,000 to 150,000 gallons of water per day. During a 15-hour use period, this is 110 to 165 gal/min total for the park. Known capacity of wells in several places is at least 100 gals/min and indications are that similar quantities can be obtained in many other areas in the park. Several such wells would be more than adequate for the needs of the park in the year 2000.
Water Quality
The chemical and physical characteristics of water from 10 wells and two springs are given in table 5 (at back of report); their locations are shown in figure 11. Analyses suggest that quality of the water is
22
North Manitou Island
South Manitou Island
Armstrong late*
LEELANAU CO
44°55'
Area of high specific capacities (little or no drawdown ot pumping rates ranging from 10 to 25 gol/min)
3 4 MILES J__ I
I 3456 KILOMETERS
86°I5'
Base from U.S. Geological Survey h62,500 quadrangles
Figure 15.--Specific capacity of wells in glacial deposits,
23

unrelated to well depth. Water having the lowest dissolved-solids concentration occurred near School and Bass Lakes (spring 1 and well 2), near the Village of Empire (wells 5, 6, and 7), and near Otter Creek (spring 8 and well 9). At most locations water is of a calcium bicarbonate type, although at some places substantial amounts of chloride and sulfate occur. Concentrations of trace metals do not exceed levels common in Michigan ground waters. Pesticides were not detected. With the exception of iron in water from well 4, concentrations do not exceed U.S. Environmental Protection Agency drinking-water standards (table 2).
WATER RESOURCES OF MANITOU ISLANDS
North and South Manitou Islands lie 7 to 8 miles north of the mainland. North Manitou, in recent years, has been a corporate farm and deer hunting preserve. It has been closed to public access for about 40 years. South Manitou is the site of a Coast Guard station and light house. Several small farms and summer homes are on the island. South Manitou is open to the public. Geologically, the islands are similar to the mainland. Glacial deposits, at least 300 ft thick, consist primarily of interbedded sand, gravel, and clay.
North Manitou Island
North Manitou has two small, relatively shallow lakes. Manitou Lake has a surface area of 252 acres. Its bottom is sandy and, at places, aquatic weeds are prevalent. Tamarack Lake has a surface area of 9.9 acres; it is shallow and has a mucky, soft bottom. When the bottom is disturbed, decaying organic compounds give off a noticeable odor of hydrogen sulfide. Growth of aquatic weeds and algae is prolific.
Two small streams drain the island. One, the outlet from Manitou Lake, was not flowing when the island was visited in July 1982, although visual evidence suggests that it does flow for at least part of the year. The other, an unnamed creek, flows from a spring just north of Tamarack Lake. On July 27, 1982, the discharge of the creek was 0.23 ft3/s--a flow that may have been increased by the 0.07 inch of rain that fell on the island on the same day.
Three springs (fig. 11), The Spring (site 23), Angell Spring (site 24), and an unnamed spring (site 30), were only seeps in July 1982. According to island residents, however, they were larger in the past. The presence of springs suggests that ground water is available for development of small public supplies. As far as is known, only four wells have been installed on North Manitou Island. Wells were dug at the school house and a farm house abandoned by early settlers. Two other wells, drilled during the past 20 years, provided domestic supplies.
Surface and ground water on North Manitou Island is generally hard (table 6, at back of report), but otherwise of excellent chemical quality; concentrations of dissolved substances did not exceed drinking water standards. Some lake water is reported to have objectionable odor, turbidity, and color, however.
24

South Manitou Island
South Manitou has one lake, Florence Lake, which has no inlet or outlet. It has a surface area of 82.1 acres, a sandy bottom, and a maximum depth of about 26 feet. A comparison of chemical analyses made in 1974-75 by Cannon and Stockwell (1978) with an analysis made during this study (table 6) indicate that the quality of the lake water has not changed appreciably in the past eight years.
Eight wells were installed on South Manitou (fig. 16) in 1982 in an attempt to locate drinking-water supplies. Sand and gravel are abundant (table 7, at back of report) at land surface in the lakebed and dune areas (fig. 4); clay occurs at the surface in the morainal area. Materials in the subsurface vary considerably and in some wells, especially those in or near the morainal area, clay is abundant.
R.I5W.
86°05'
T.3I N
T. 30 N.
EXPLANATIONWell location and Notional Pork Service number. ( Number in parenthesis is number used for quality sampling site in this report)
700 Line of equal altitude of lana surface ; interval is 100 feet. NGVD of 1929
0 I MILE
I II KILOMETER45°00'
Base from U.S. Geological Survey 1 = 62,500 quadrangle
Figure 16.--Location of wells drilled on South Manitou Island in 1982
25

Nine wells on the island were sampled (fig. 11). Dissolved-solids concentrations ranged from 136 mg/L in well 22 to 258 mg/L in well 21. These two wells are less than a quarter-mile apart on the north end of the island. Well 22 is newly drilled and 83 feet deep; well 21 is an old dug pit well about 20 feet deep.
Data indicate that ground water on the island is suitable for drinking although it is likely to be hard at some locations. No unusual chemical characteristics were detected, although water from well 16 had a dissolved-phosphorous concentration higher than common in most ground water.
CONCLUSIONS
Sleeping Bear Dunes National Lakeshore has sufficient supplies of water for present campgrounds and other park facilities. These supplies are also adequate for the forseeable future. Much of the park is underlain by sand and gravel aquifers that can yield at least 100 gal/min of good quality water to properly designed wells. Considering the total require ments for the park in the year 2000--probably no more than 165 gal/min-- several 100 gal/min wells would be more than adequate. Streams, small lakes, and Lake Michigan provide ample water for recreational needs. Lowest average 7-day discharge of streams ranges from 3 ft3/s for Otter Creek to 100 ft3/s for Platte River.
Botli surface water and ground water are of good quality and appear to be suitable for most uses. Dissolved solids range from 35 to 180 mg/L in lakes, from 145 to 214 mg/L in streams, and from 136 to 468 mg/L in ground water. Concentrations of most constituents do not exceed the drinking water standards of the U.S. Environmental Protection Agency.
26

REFERENCES
Beeton, A. M., and Chandler, D. C., 1963, in Frey, D. G., Limnology in North America, Chapter 19, University of Wisconsin Press.
Bell, G. L., 1980, Northern Lake Michigan chemical and physical characteristics data for 1970, NOAA Data Report ERL GLERL-7.
Burgis, W. A., 1977, Late-Wisconsin history of northeastern lower Michigan: unpublished Ph.D. thesis, University of Michigan, 396 p.
Calver, J. L., 1946, The glacial and post-glacial history of the Platte and Crystal Lake Depressions, Benzie County, Michigan: Michigan Geological Survey, Pub. 45, pt II, 69 p.
Cannon, J. E., and Stockwell, J. E., 1978, Limnological investigation of Florence Lake, South Manitou Island, Michigan Tech. Report no. 5, Biological Station, University of Michigan.
Leverett, F., and Taylor, F. B., 1915, The Pleistocene of Indianaand Michigan and the history of the Great Lakes: U.S. Geological Survey Monograph 53, p. 293-314.
Martin, Helen M., 1957, Outline of the geologic history of the Grand Traverse region: Michigan Department of Conservation, Geological Survey Division, 9 p.
Michigan Department of Conservation, 1943, Topographic map of bedrock surface: Geological Survey Division, 1 plate.
Sleator, F. E., 1978, Ice thickness and stratigraphy of nearshore locations of the Great Lakes, NOAA Data Report ERL GIERL-1-1, Ann Arbor, Michigan.
Torrey, M. S., 1976, Environmental status of the Lake Michigan region, vol. 3, Chemistry of Lake Michigan, ANL/ES-40.
U.S. Army Corps of Engineers, 1981, Monthly bulletin of lake levels for the Great Lakes.
U.S. Environmental Protection Agency, 1977a, National interim primary drinking water regulations: U.S. Government Printing Office, 159 p.
----- 1977b, National secondary drinking water regulations: Federal Register, v. 42, no. 62, March 31, 1977, part I, p. 17143-17147.
27
pay*, n

TABLES
29

Table 1.--Chemical and physical characteristics of lakes
Samp ling depth
Date (ft)
Aug. IS, 1979 3.00
May 13, 1980 1.00
Oct. 27, 1981
Aug. 16, 1979 6.00
May 14, 1980 1.00
Oct. 27, 1981
Aug. 17, 1979
May 14, 1980
Oct. 27, 1981
May 15, 1980
Tur- Temper- bid- ature ity (deg C) (NTO)
18.5
10.0
8.0
17.0
11.0
6.0
16.0
9.0
8.5
Site
7.0
Site 31 -
2.0
.90
1.0
Site 32 -
1.0
.65
.50
Site 33
1.0
1.1
.50
34 - Lake
0.80
Nitro- Nitro- Spe- Carbon Alka- Bicar- gen, gen, Phos-
Color cific dioxide, linity, bonate, Car- nitrite nitrate phorus, (Plat- con- dis- field field bonate, dis- dis- dis- inum- duct- solved (mg/L (mg/L field solved solved solved
cobalt ance pH (mg/L as as (mg/L (mg/L (mg/L (mg/L units) (umhos) (units) as C02 ) CaC0 3 ) HC0 3 ) as C0 3 ) as N) as N) as P)
North Bar Lake nr Empire, Michigan (Lat 44°50'07", long 086°03'40")
310 8.3 1.5 149 182 0 0.10 0.21 <r.01
1 335 8.2 1.9 '160 190 0 .01 .44 .01
1 304 8.1 -- -- -- -- <.01 -- .03
School Lake nr Glen Arbor, Michigan (Lat 44°55'12", long 085°53'08")
210 8.8 0.4 126 105 24 '0.01 0.54 <0.01
6 248 8.6 .6 120 140 6 .01 .00 .01
2 234 8.1 -- -- -- -- <.01 -- <.01
- Glen Lake nr Glen Arbor, Michigan (Lat 44°53'31", long 08S°S6'45")
245 8.3 1.3 133 162 0 0.04 0.10 <0.01
0 273 8.1 2.0 130 160 0 .00 .05 .00
1 260 7.9 -- -- -- -- <.01 -- <.01
Michigan 1 mile west of Esch Road, Michigan (Lat 44°46'12", long 086°06'18")
2 _ 265 8.1 1.8 110 140 0 U.OO 0.23 0.01
Cyanide total (mg/L
Date as Cn)
Aug. 15, 1979
May 13, 1980 a. 00
Oct. 27, 1981 <.01
Aug. 16, 1979
May 14, 1980 0.00
Oct. 27, 1981 <.01
Aug. 17, 1979 0.00
May 14. 1S80 .00
Oct. 27, 1981 <.01
Hardness (mg/L as
CaC0 3 )
160
170
170
110
120
120
130
140
130
Hard ness,noncar bonate (mg/L
CaC03 )
Site 31 -
9
14
--
Site 32 -
0
0
Site 33
1
5
--
Solids, Solids,Silica, Magne- Potas- Chlo- Fluo- residue sum of dis- Calcium. sium, Sodium, sium, ride, Sulfate, ride, at 180 consti-solved dis- dis- dis- dis- dis- dis- dis- deg. C, tuents, (mg/L solved solved solved solved solved solved solved dis- dis- as (mg/L (mg/L (mg/L (mg/L (mg/L (mg/L (mg/L solved solved
Si0 2 ) as Ca) as Mg) as Na) as K) as Cl) as SOJ as F) (mg/L) (mg/L)
North Bar Lake nr Empire, Michigan (Lat 44°50'07", long 086°03'40")
2.9 42 13 2.3 0.8 4.9 13 0.1 185
4.4 45 14 2.4 .7 4.7 13 .1 183 180
5.3 43 IS 2.6 .4 4.5 6.8 .1 174 168
School Lake nr Glen Arbor, Michigan (Lat 44°S5'12", long 085°53'08")
5.3 27 9.8 1.5 1.2 3.5 7.2 0.1 130 134
.3 34 9.6 1.6 1.0 3.4 8.1 .1 141 133
9.1 28 12 2.4 1.0 4.6 6.2 .1 146 130
- Glen Lake nr Glen Arbor, Michigan (Lat 44°S3'31", long 08S°S6'4S")
5.4 32 13 2.7 0.6 1.8 11 0.4 139 147
4.7 33 13 2.8 .5 1.6 11 .4 148 146
5.7 32 13 3.2 .2 2.0 7.9 .5 143 143
Site 34 - Ukc Michigan 1 mile west of Rsch Road, Michigan (Lat 44°46'12", long 086°06'18")
May IS, 1980 ').00 130 18 0.9 35 11 5.0 1.0 8.3 21 0.1 155 153
30

Table 1.--Chemical and physical characteristics of lakes--Continued
Arsenic dis solved(Ug/L
Date as As)
Chro- Manga- Sele- , Barium, Cadmium, mium, Copper, Iron, Lead, nese, Mercury, nium, Silver,
dis- dis- dis- dis- dis- dis- dis- dis- dis- dis solved solved solved solved solved solved solved solved solved solved(ug/L (ug/L (ug/L (ug/L (ug/L (ug/L (ug/L (ug/L (ug/L (ug/L
as Ba) as Cd) as Cr) as Cu) as Fe) as Pb) as Mn) as Hg) as Se) as Ag)
Zinc, dis solved (ug/L
as Zn)
Site 31 - North Bar Lake nr Empire, Michigan (Lat 44°50'07", lono 086°03'40")
Aug. 15, 1979 1
May 13, 1980 2
Oct. 27, 1981 2
30 ND ND
30 0 13
20 <1 <1
11 ND <10 <O.S <1 MD
-- 0 0 1 <.l 0 0
7 <1 <1 .2 <1 <1
2
10
<4
Site 32 - School Lake nr Glen Arbor, Michigan (Lat 44°55'12", long 085°53'08")
Aug. 16, 1979 1
May 14, 1980 1
Oct. 27, 1981 3
Aug. 17, 1979 1
May 14, 1980 3
Oct. 27, 1981 2
10 ND <2
20 1 3
20 <1 <1
Site 33 - Glen Lake nr
40 MD ND
30 4 3
30 <1 <1
Site 34 - Lake Michigan 1 mile
1 5 1 <0.5 <1 ND
10 0 2 <.l 0 0
5 1 <1 <.l <1 <1
Glen Arbor, Michigan (Lat 44°53'31", long 085°56'45")
<10 4 <10 <0.5 <1 XD
0 0 0 <.l 3 0
<3 1 <1 <.l <1 <1
west of Esch Road, Michigan (Lat 44°46'12", long 086°06'18")
20
10
<4
3
4
<4
May 15, 1980
31

Table 4.--Chemical and physical characteristics of streams
Date Time
Temper ature
Stream- Color Tur- flow, (plat- bid- instan- inum- ity taneous cobalt (NTU) (ft 3/s) units)
04126755 - Platte River at M-22
Aug. 14, 1979
May 15, 1980
Oct. 28, 1981
Aug. 14, 1979
May 15, 1980
Oct. 28, 1981
Aug. 15, 1979
May 13, 1980
Oct. 26, 1981
0845
1130
0930
1430
1000
1100
0930
1030
1530
18.0
11.5
8.0
04126758 -
19.0
11.0
8.0
04126765
18.0
12.0
9.5
2.0 179
1.0 158 4
1.4 160 3
Platte River at weir on Loon
3.0 186
1.4 173 2
1.6 156 1
- Otter Creek at Otter Lake
5.0 3.86
1.3 6.14 0
1.0 3.39 3
04126767 - Otter Creek at Aral Road
May 12, 1970
Aug. 15, 1979
Aug. 17, 1979
May 12, 1980
Oct. 27, 1981
1100
1200
1130
1100
0900
18.0
15.0
12.0
18.0
4.5 '
16.4
4.0
1.0 21.1
1.5 16.4 0
.50 14.9 4
04126802 - Crystal River nr Glen
Aug. 16, 1979
May 14, 1980
Oct. 27, 1981
1410
1450
1315
19.0
11.0
7.5
1.0 49.4
.40 54.1 0
.50 59.8 1
04126810 - Shalda Creek nr Glen
Aug. 1(>, 1979
May 14, 1980
Oct. 27, 1981
1500
1000
1030
16.0
8.0
6.0
1.0 20.9
.80 28.3 0
1.0 20.6 1
Nitro- Spe- Carbon Alka- Bicar- gen, cific dioxide, linity, bonate, Car- nitrite con- dis- field field bonate, dis- duct- solved (mg/L (mg/L field solved ance pH (mg/L as as (mg/L (mg/L (umhos) (units) as C02 ) CaC0 3 ) HC03 ) as C03 ) as N)
Nitro gen,
nitrate dis solved (mg/L as N)
nr Honor, Michigan (Lat 44°42'39", long 086°07'08")
295
320
281
8.3 1.4 143 174 0 <0.01
3.3 1.6 160 200 0 .01
8.2 -- -- -- -- <.01
0.06
.19
Lake nr Honor, Michigan (Lat 44°43'12", long 086°08'12")
290
330
289
8.3 1.3 -- -- 0 0.01
8.3 1.6 160 200 0 .01
8.2 -- -- -- -- <.01
0.09
.18
nr Empire, Michigan (Lat 44°44'30", long 086°03'40")
280
320
293
8.2 1.7 138 168 0 <0.01
8.2 2.0 160 200 0 .01
8.3 -- -- -- -- <.01
0.19
.43
--
nr Empire, Michigan (Lat 44°45'42", long 086°04'26")
335
345
330
338
Arbor,
260
288
254
Arbor,
320
360
338
7.6 8.4 171 208 0 <0.01
7.6 8.4 172 210 0 <.01
8.1 2.4 160 190 0 .01
7.9 -- -- -- -- <.01
Michigan (Lat 44°54'10", long 085°57'46")
8.4 1.0 131 152 4 <0.01
8.2 1.8 150 180 0 .00
8.0 -- -- -- -- <.01
Michigan (Lat 44°56'48", long 085°53'07")
8.1 2.4 153 186 0 <0.01
7.9 4.0 160 200 0 .00
7.9 -- -- -- -- <-01
0.38
.01
.62
0.02
.04
0.15
.24
32

Table 4.--Chemical and physical characteristics of streams--Continued
Date
Phos- Hard- Silica, Magne- phorus, Hard- ness, dis- Calcium, sium, dis- Cyanide, ness noncar- solved dis- dis solved total (mg/L bonate (mg/L solved solved (mg/L (mg/L as (mg/L as (mg/L (mg/L as P) as Cn) CaC03 ) CaC03 ) Si02 ) as Ca) as Mg)
Sodium, dis solved (mg/L as Na)
04126755 - Platte River at M-22 nr Honor, Michigan (Lat 44°42'39
Aug. 14,
May 15,
Oct. 28,
Aug. 14,
May 15,
Oct. 28,
Aug. 15,
May 13,
Oct. 26,
May 12,
Aug. 15,
Aug. 17,
May 12,
Oct. 27,
Aug. 16,
May 14,
Oct. 27,
Aug. 16,
May 14,
Oct. 27,
1979
1980
1981
1979
1980
1981
1979
1980
1981
1970
1979
1979
1980
1981
1979
1980
1981
1979
1980
1981
<0.01 -- 150 7
.00 0.00 160 0
<.01 <-01 150
04126758 - Platte River at Weir on
<0.01 -- 150 21
.01 0.00 160 0
<-01 <.01 150
04126765 - Otter Creek at Otter
<0.01 -- 140 2
.00 0.00 160 0
.01 <.01 150
04126767 - Otter Creek at Aral
0.01 -- 180 5
170 1
.03 0.00 170 14
<.01 <.01 190
04126802 - Crystal River nr
<0.01 -- 130 0
.00 0.00 140 0
.02 <-01 140
04126810 - Shalda Creek nr
<0.01 -- 170 17
.01 0.00 130 18
.13 <.01 180
2.5
5.6
3.3
Loon
2.4
5.5
3.1
Lake
6.7
6.1
7.4
Road
7.0
7.2
6.9
9.1
Glen
6.1
6.0
5.6
Glen
6.5
6.9
9.2
42
46
41
11
12
12
3.7
4.2
4.2
Potas- Chlo- sium, ride, Sulfate, dis- dis- dis solved solved solved (mg/L (mg/L (mg/L as K) as Cl) as S04 )
Fluo- ride, dis solved (mg/L as F)
Solids, residue at 180 deg. C, dis solved (mg/L)
", long 086°07'08")
0.7
.6
.5
4.4
4.3
4.2
Lake nr Honor, Michigan (Lat 44°43'12", long 086°08'
43
46
40
nr Empire,
38
44
40
nr Empire,
49
48
45
50
11
12
12
Michigan
11
12
13
Michigan
13
13
14
15
Arbor, Michigan (Lat
31
36
33
13
13
13
Arbor, Michigan (Lat
45
50
46
14
14
15
3.6
4.1
4.1
(Lat 44°44
1.8
2.2
2.7
(Lat 44°45
2.2
2.7
2.9
3.5
44°54'10"
2.5
2.9
3.1
44°56'48"
3.3
3.4
4.1
0.7
.6
.5
'30",
0.7
.6
.5
'42",
--
0.6
.5
.6
.3
, long
0.6
.5
.3
, long
0.7
.6
.4
4.4
4.3
4.3
long 086°03'40")
3.2
3.1
3.7
long 086°04'26")
2.8
3.0
2.8
3.1
085°57'46")
1.8
1.7
2.0
085°53'07")
3.8
3.7
3.9
12
11
11
12")
11
11
11
11
11
7.3
14
16
15
12
12
11
7.5
27
26
23
0.2
.2
.2
0.2
.2
.2
0.1
.1
.2
0.2
.2
.3
.3
0.4
.5
.5
0.5
.5
.6
174
180
179
181
179
181
168
173
164
--
206
197
190
200
155
153
145
194
214
203
33

Table 4.--Chemical and physical characteristics of streams--Continued
Date
Solids, sum of consti- Arsenic, tuents, dis- dis- solved solved (ug/L (mg/L) as As)
Chro- Manga- Sele- Barium, Cadmium, mium, Copper, Iron, Lead, nese, Mercury, nium, Silver, dis- dis- dis- dis- dis- dis- dis- dis- dis- dis solved solved solved solved solved solved solved solved solved solved (,ig/L (ug/L (yg/L (yg/L (ug/L (ug/L (ug/L (yg/L (yg/L (yg/L as Ba) as Cd) as Cr) as Cu) as Fe) as Pb) as Mn) as Hg) as Se) as Ag)
Zinc, dis solved
as In)
04126755 - Platte River at M-22 nr Honor, Michigan (Lat 44°42'39", long 086°07'08")
Aug.
May
Oct.
14,
15,
28,
1979
1980
1981
163
183
161
1
3
1
04126758 - Platte
Aug.
May
Oct.
14,
15,
28,
1979
1980
1981
183
165
1
3
1
40 0
30 5
20 3
River at Weir on
30 0
30 3
20 3
04126765 - Otter Creek at Otter
Aug.
May
Oct.
15,
13,
26,
1979
1980
1981
156
180
159
2
1
2
30 0
20 3
20 <1
04126767 - Otter Creek at Aral
May
Aug.
Aug.
May
Oct.
Aug.
May
Oct.
Aug.
May
Oct.
12,
15,
17,
12,
27,
16,
14,
27,
16,
14,
27,
1970
1979
1979
1980
1981
1979
1980
1981
1979
1980
1981
193
194
184
196
150
161
143
199
205
192
1
1
2
04126802 -
1
2
2
04126810
1
2
2
40 0
30 0
30 <1
Crystal River nr
20 <2
40 3
30 <1
Shalda Creek nr
40 <2
30 1
30 <1
0 -- <
3
<1
10 0 1 <0.5 <1 0
0 0 0 <.l 00
5 <1 <1 .1 <1 <1
2
0
<4
Loon Lake nr Honor, Michigan (Lat 44°43'12", long 086°08'12"
0 -- <
3
<1
Lake nr Empire, Michigan
<2 -- <
3
<1
Road nr Empire, Michigan
0
--
4
<1
Glen Arbor, Michigan (Lat
0
3
<1
Glen Arbor, Michigan (Lat
2
2
<1
10 0 1 <O.S <1 0
0 0 1 .1 00
6 1 <1 .1 <1 <1
(Lat 44°44'30", long 086°03'40")
10 0 <10 <0.5 <1 0
1 0 2 <.l 00
9 1 1 .1 <1 <1
(Lat 44°45'42", long 086°04'26")
40 0 4 <0.5 <l 0
10 -- 3
10 0 5 <.l 0 0'
7 <1 3 .1 <1 <1
44°54'10", long 085°57'46")
10 5 1 '0.5 -- 0
0 0 3 <.l 00
5 1 <1 <.l <1 <1
44°56'48", long 085°53'07")
10 <2 3 <O.S <1 0
20 0 6 -.1 0 0
8 1 2 <.l <1 <1
3
9
<4
0
9
<4
3
8
<4
8
20
<4
3
6
<4
34

Table 5.--Chemical and physical characteristics of ground water (Site number: S, spring; all others are wells)
Site number
1,3
2
3
4
5
6
7
8,S
9
10
11
12
Site number
1
2
3
<r5
6
7
8
9
10
11
12
Geologic unit
112GLCL
112G1.CL
112GLCL
112GLCL
112SAND
112SAND
112GLCL
112GLCL
112GLCL
112GLCL
112SAND
112SANU
Phos phorus , dis solved (mg/L as P)
0.03
.01
.03
.01
.01
.01
.01
.01
.01
.01
Dateof
sample
August 27, 1980
August 26, 1980
August 26, 1980
September 25, 1979
May 15, 1980
August 25, 1980
May 15, 1980
August 26, 1980
September 25, 1979
September 26, 1979
September 26, 1979
September 24, 1979
September 1, 1981
November 13, 1981
August 31, 1981
November 12, 1981
Cyanide total (mg/L as Cn)
0.00
.00
.01
.00
.00
.00
.00
.00
.00
.00
<.01
<-01
Depth of
well,
(feet)
46
40
60
60
138
138
220
15
107
87
87
85
85
Hard ness (mg/L as
Cnf0j )
160
170
370
290
170
180
160
150
180
190
180
320
220
200
Temperature(deg C)
14.0
12.0
11.0
9.0
8.0
10.0
8.0
10.0
8.5
8.0
10.0
10.0
9.0
8.5
Hard ness,
noncar- bonate(mg/L
CaCo 3 )
0
220
59
2
18
5
19
0
12
0
170--
Tur- bid-
(NTU)
U.SO
.30
.40
20
.20
.20
.30
.20
1.0
.00
1.0
1.0
1.4
1.1
Silica, dis solved (mg/L as Si0 2 )
4.0
4.5
5.8
11
7.6
8.2
6.4
6.9
11
7.3
9.7
9.2
8.6
7.0
Color (plat inum-
units)
5
6
4
5
0
2
0
5
5
5
5
2
1
<1
Calcium, dis solved (mg/L as Ca)
43
48
99
79
45
45
43
40
49
54
48
83
68
69
Spe cific con- duct-
(umhos)
237
256
806
620
325
293
330
286
335
340
340
670
540
520
Magne sium, dis solved (mg/L as Mg)
12
12
31
22
15
16
13
12
13
14
14
28
11
7.8
pH(units)
7.5
7.7
7.4
7.2
7.7
7.6
7.5
7.4
7.6
7.6
7.5
7.5
8.1
8.5
Sodium, dis solved (mg/L as Na)
1.6
.9
13
28
.9
.9
2.7
2.9
2.2
.9
4.0
4.2
13
15
Carbon dioxide,
dis solved(mg/L
as Co 2 )
6.7
12
28
6.7
7.8
9.6
10
9.5
8.8
11
9.6
Potas - slum, dis solved (mg/L as K)
1.0
.8
1.4
1.3
.4
.5
7.5
8.0
.6
.6
.6
1.0
1.4
1.8
Alka linity, field (mg/Las
CaCo3 )
172
156
231
170
160
160
130
194
180
180
160
Chlo ride, dis solved(m-/L as Cl)
3.4
1.7
170
36
.8
1.7
8.9
9.1
.7
2.6
1.8
62
93
110
Bicar bonate , field (mg/L
HC03 )
210
190
282
210
200
190
180
236
220
220
190--
Sulfate, dis
solved (mg/L as S04 )
8.3
8.8
12
150
8.8
10
11
12
8.8
12
7.2
18
3.7
11
Car bonate , field(mg/L as Co3 )
--
0
0
0
0
0
0
0
0
0
0
0
riuo-ride, dis solved(mg/L as F)
0.1
.1
.2
.6
.1
.2
.1
.1
.7
.1
.2
.1
<.l
<.l
.Nitrogen,
nitrite dis
solved(mg/L as N)
0.00
.00
.01
<.01
.00
.00
.01
<.01
<.01
<.01
--
Solids,residue at 180 deg C dis
solved (mg/L)
156
186
672
466
179
190
189
190
187
197
188
393
4.30
343
Nitrogen,
nitrate dis solved(mg/L as N)
0.00
.05
2.4
.00
.82
1.4
.01
.65
.89
2.0--
Solids,sum of consti - tuents ,
dis solved (mg/L)
181
437
468
186
181
193
180
224
20i
198
308
271
26b
35

Table 5.--Chemical and physical characteristics of ground water--Continued
Site number
1
2
3
4
5
6
7
8
9
10
11
Arsenic, dissolved(ug/L as As)
1
1
1
4
3--
3--
<1
1
2
1
Barium, dissolved(ug/L as Ba)
0
0
0
40
20--
30
30
10
20
20
Cadmium, dissolved(ug/L as Cd)
0
0
0
0
5
1
0
0
0
0
Chro mium, dissolved(ug/L as Cr)
0
1
1
0
1
1
0
0<2
0
Iron, dissolved(ug/L as Fe)
120
70
120
440
0
30
10
10
60<10
30
60
<10
Lead, dis
solved(ug/L as Pb)
2
0
0
2
0
1
0
0
0<2--
Manga nese, dissolved(ug/L as Mn)
10
10
30
100
n10
4
0
20<10
5
6
10
Mercurv, dissolved(ug/L as Hg)
'0.1
<.l
<.l
<.S
'.1
<.l
<.S
<.5
<.5
<.S
Mercury, Sele- total nium, recov- dis-erable solved(ug/L ( ug/L as Hg) as Se)
0
0
1<1
0
<.l
0
<.l
0<1
<1
<1
.2
Silver, dissolved(ug/L as Ag)
0
0
0
0
0
0
0
0
0
0
Zinc, dissolved(ug/L as Zn)
0
110
80
260
3--
120
40
30
9
250
12
36
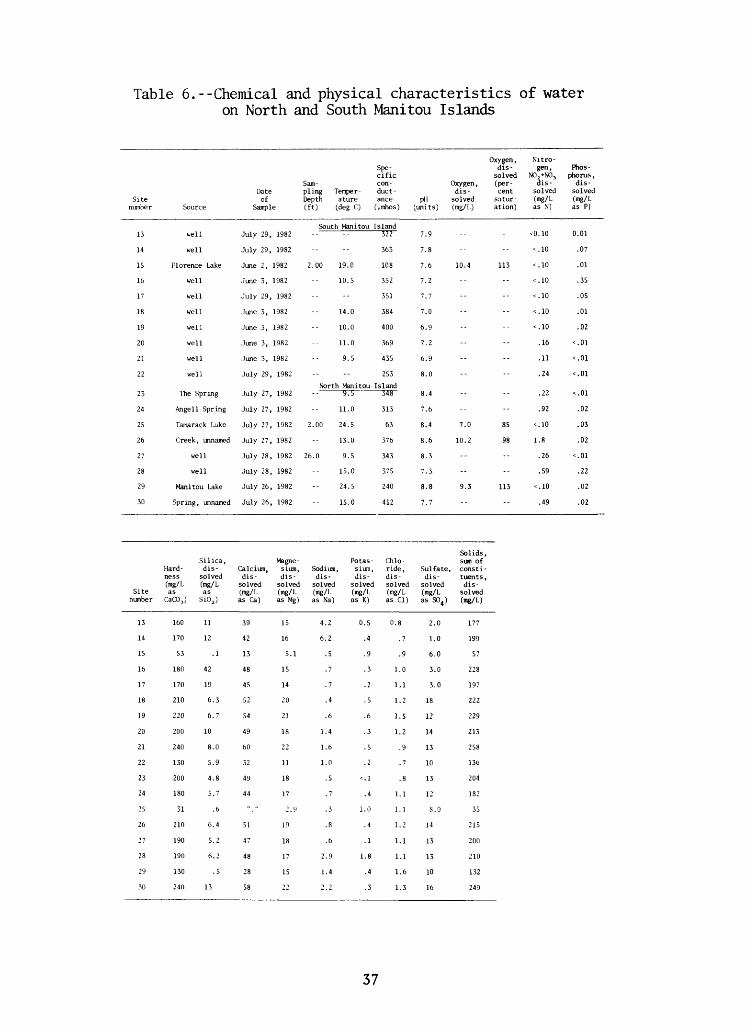
Table 6.--Chemical and physical characteristics of water on North and South Manitou Islands
Site number
13
14
15
16
17
18
19
20
21
22
23
24
25
26
27
28
29
30
Site number
13
14
15
16
17
18
19
20
21
22
23
24
25
26
27
23
29
30
Source
veil
well
Florence Lake
well
well
well
well
well
well
well
The Spring
Angell Spring
Tararack Lake
Creek, unnamed
well
well
Manitou Lake
Spring, unnamed
Silica, Hard- dis- ness solved (mg/L (mg/L as as CaCOJ Si02 )
160 11
170 12
53 .1
180 42
170 19
210 6.3
220 6.7
200 10
240 8.0
130 5.9
200 4.8
180 5.7
31 .6
210 6.4
190 5.2
190 6.2
130 .5
240 13
Oxygen, Nitro- Spe- dis- gen, cific solved N02+N03
Sam- con- Oxygen, (per- dis- Date pling Temper- duct- dis- cent solved of Depth ature ance pH solved satur- (mg/L
Sample (ft) (deg C) (umhos) (units) (mg/L) ation) as N)
South Manitou IslandJuly 29, 1982 -- -- 322
July 29, 1982 -- -- 363
June 2, 1982 2.00 19.0 108
June 3, 1982 -- 10.5 352
July 29, 1982 -- -- 351
June 3, 1982 -- 14.0 384
June 3, 1982 -- 10.0 400
June 3, 1982 -- 11.0 369
June 3, 1982 -- 9.5 435
July 29, 1982 -- -- 253
North Manitou IslandJuly 27, 1982 -- 9.5 348
July 27, 1982 -- 11.0 313
July 27, 1982 2.00 24.5 63
July 27, 1982 -- 13.0 376
July 28, 1982 26.0 9.5 343
July 28, 1982 -- 15.0 375
July 26, 1982 -- 24.5 240
July 26, 1982 -- 15.0 412
Magne- Potas- Chlo- Calcium, sium, Sodium, sium, ride, dis- dis- dis- Jis- dis solved solved solved solved solved (mg/L (mg/L (mg/L (mg/L (mg/L as Ca) as Mg) as Na) as K) as Cl)
39 15 4.2 0.5 0.8
42 16 6.2 .4 .7
13 5.1 .5 .9 .9
48 15 .7 .3 1.0
45 14 .7 .2 1.1
52 20 .4 .5 1.2
54 21 .6 .6 1.5
49 18 1.4 .3 1.2
60 22 1.6 .5 .9
32 11 1.0 .2 .7
49 18 .5 <.l .8
44 17 .7 .4 1.1
2.9 .3 1.0 1.1
51 19 .8 .4 1.2
47 18 .6 .1 1.1
48 17 2.9 1.8 1.1
28 15 1.4 .4 1.6
58 22 2.2 .3 1.3
7.9 -- -- <0.10
7.8 -- -- <.10
7.6 10.4 113 <.10
7.2 -- -- <.10
7.7 -- -- <.10
7.0 -- -- <.10
6.9 -- -- <-10
7.2 -- -- .16
6.9 -- -- .11
8.0 -- -- .24
8.4 -- -- .22
7.6 -- -- .92
8.4 7.0 85 <.10
8.6 10.2 98 1.8
8.3 -- -- .26
7.3 -- -- .59
8.8 9.3 113 <.10
7.7 -- -- .49
Solids, sun of
Sulfate, consti- dis- tuents, solved dis- (rag/L solved as S04 ) (mg/L)
2.0 177
1.0 199
6.0 57
3.0 228
3.0 197
18 222
12 229
14 213
13 258
10 13b
13 204
12 182
8.0 35
14 215
13 200
13 210
10 132
16 249
Phos phorus,
dis solved (mg/L as P)
0.01
.07
.01
.35
.05
.01
.02
<.01
<.01
<.01
.02
.03
.02
<.01
.22
.02
.02
37

Table 1, --Logs of wells installed on South Manitou Island in 1982(from driller's report)
Well 1 (10BCCC) (Altitude ± 610 ft)
Lithology
Sand and gravel Clay, hard, sandy Clay and sand Clay, sandy Sand, clean Sand, dirty
Depth (ft)
0-16 16-105
105-119 119-176 176-184 184-185
(specific capacity =1.8 gal/ft; pumped at 23 gal/min for 3.5 hr)
Well 2 (10BDCC) (Altitude ± 610 ft)
LithologyDepth (ft)
Sand and gravel 0-24 Clay, sandy 24-36 Sand, fine, some pebbles 36-115
(specific capacity - 8.1 gal/ft; pumped at 25 gal/min for 1.4 hr)
Well 3 (9AAAB1) (Altitude ± 605 ft)
Depth Lithology (ft)
Sand and gravel 0-17 Clay, sandy 17-21 Sand, fine 21-42 Sand, fine, silty,
clay lenses 42-84 Clay 84-99 Sand and gravel 99-103 Clay, sand and gravel 103-119 Clay and sand 119-125 Clay, hard, sandy, silty 125-136 Clay, few sandy lenses 17>b-303
(well destroyed; well 3a installed nearby)
Well 3a (9AAAB2) (Altitude ± 605 ft)
Depth Lithology (ft)
Sand and gravel 0-17 Clay, silty, and sand 17-24 Sand, very fine to fine,
trace of clay 24-45 Clay, sandy 45-57 Sand, fine to medium,
trace of clay 57-71 Sand and clay 71-82 Clay 82-95 Clay, sandy, some pebbles 95-103 Sand and gravel, cemented 103-109 Sand, fine, silty, some
gravel and clay 109-113 Sand, fine to medium, some
gravel 113-120 Sand, fine, and gravel,
trace of clay 120-125 (specific capacity =1.3 gal/ft; pumped at 30 gal/min for 3.5 hr)
Well 4 (28DDDD) (Altitude ± 625 ft)
Depth Lithology (ft)
Sand and gravel 0-38 Sand, some clay balls 38-43 Sand and gravel 43-77 Sand and gravel, fewclay balls 77-83
(specific capacity = 3.8 gal/ft; pumped at 12 gal/min for 3.0 hr)
38

Table 7.--Logs of wells installed on South Manitou Island in 1982--Continued
Well 5 (33CDBC1) (Altitude ± 690 ft)
Lithology
Clay, sandyClay, sandy and hardClay, soft
(well destroyed)
Well 5a (33CDBC2) (Altitude ± 690 ft)
Lithology
SoilSand and gravelClay, sandy
sandy; and gravelsome claysandy, hardfine
Clay, Sand, Clay, Sand, Clay
Depth (ft)
0-6969-196196-250
Well 6 (10AABA) (Altitude ± 610 ft)
Lithology
SandSand, fine to medium,
silty; and gravel Sand, fine to medium Sand, fine, silty Sand, silty; and clay
Depth (ft)
0-5
5-4040-5252-117117-120
0,
Depth (ft)
0-10 10-14 14-106
106-167 167-177 177-209 209-237 237-238 2
(specific capacity =5.5 gals/ft; pumped at 60 gal/min for 3.5 hr)
(specific capacity = gal/ft; pumped at 20 gal/min for 4.2 hr)
39