water resourees researeh - infohouseinfohouse.p2ric.org/ref/42/41714.pdf · eratto (1962) and (b)...
TRANSCRIPT

Report No. 242
1 ?
I 7 1
'4rr CONTAMINATION OF THE
I {
METHODOLOGY FOR ASSESSMENT OF
kb UNDERGROUND STORAGE TANKS
Francis A. DiGiano Cass T. Miller
Anne C. Roche Edward D. Wallingford
Department of Environmental Sciences and Engineering University of North Carolina at Chapel Hill
4
November 1988 I CI
Water Resourees Researeh Institute OF THE UNIVERSITY OF NORTH CAROLINA


WRRI-UNC-88-242
METHODOLOGY FOR ASSESSMENT OF ~ ~ N T A M I ~ A T ~ ~ N OF THE UNSATUR4TED ZONE BY LEAKING UNDERGROUND STORAGE Ta4NKS
Rancis A. DiGiano Professor
Cass T. Miller Assistant Professor
Anne C. Roche Research Assistant
Edward D. Wallingford Research Assistant
Department of Environmental Sciences and Engineering The University of North Carolina Chapel Hill, North Carolina 27599
The research on which this pub l i ca t ion i s based was supported by funds provided by the Water Resources Research Institute of The University o f North Carolina.
WRRI Project No. 70057
.

ACKNOWLEDGMENTS
This work was performed within the Department of Environmental Sciences and En-
gineering of the School of Public Health at the University of North Carolina at Chapel Hill.
We wish to thank Dr. Aziz Amoozegar-Fard, from the Soil Science Department of North
Carolina State University, for his cooperation and assistance on the sampling aspects of
this project. ?Ire were fortunate in receiving first-class treatment and excellent coopera-
tion from Marine Corps Base Camp Lejeune-specifically Mr. Robert E. Alexander and
Colonel T. J. Dalzell. The Base contractors deseme thanks for their cooperation as well:
Bert Lea and James Gonzales of Specialized Marine, Inc.; and Richard Catlin of Richard
Catlin & Associates. We are indebted as well to the staff of the Department of Natural
Resources and Community Development-Perry Nelson, Douglas Dixon, Charles Wakild,
and Rick Shiver to name but a few-for their assistance in site location, needs assessment,
and the monitoring well permitting aspects of the project.
.. 11


ABSTRACT
The groundwater resources of the U.S. have been contaminated by a variety of volatile
organic pollutants that include solvents, petroleum products, and pesticides. Groundwa-
ter monitoring and renovation must be founded on the measurement of a contaminant
concentration distribution in the subsurface environment. Many common volatile organic
contaminants typically exist in several phases of the subsurface environment: as a nonaque-
ous phase liquid, as a solute dissolved in the aqueous phase, as a solute volatilized in the
vapor phase, and as a solute sorbed to a solid phase. Determination of a contaminant dis-
tribution in the subsurface environment requires measurement or theoretical computation
of the concentration in each phase--or some combination of the two approaches.
This work focuses on the investigation of three methods for measuring a contaminant
distribution in the subsurface: an ultrasonic, mixed-solvent, solid-core extraction method;
a nitrogen-purge, solid-core extraction method; and a driveable ground-probe, vapor-phase
sampling method. Laboratory results demonstrate the theoretical basis and performance of
each method, while an investigation at a Camp Lejeune site provides a field trial. Method
development and testing are presented in detail for all methods. The results show all
methods to have theoretical appeal. The best results in the field were obtained with the
ultrasonic, mixed-solvent, solid-core extraction method and the driveable ground-probe,
vapor-phase sampling method. Field data results show that concentrations in each phase
may be roughly predicted by assuming equilibrium among all phases.
DISCLAIMER STATEMENT
The contents of this publication do not necessarily reflect the views and policies of
the Department of Interior, nor does mention of trade names or commercial products
constitute their endorsement by the United States Government.
... 111


TABLE OF CONTENTS
.. ACKNOWLEDGMENTS . . . . . . . . . . . . . . . . . . . . . . 11
ABSTRACT . . . . . . . . . . . . . . . . . . . . . . . . . . . . . 111
LIST OF FIGURES . . . . . . . . . . . . . . . . . . . . . . . . . vi
LIST OF TABLES . . . . . . . . . . . . . . . . . . . . . . . . . . VI11
SUMMARY AND CONCLUSIONS . . . . . . . . . . . . . . . . . ix
RECOMMENDATIONS . . . . . . . . . . . . . . . . . . . . . . . xii
...
...
INTRODUCTION . . . . . . . . . . . . . . . . . . . . . . . . . . 1
PREVIOUS RESEARCH . . . . . . . . . . . . . . . . . . . . . . 2 GEKERAL . . . . . . . . . . . . . . . . . . . . . . . . . . . . . 2 EXTRACTION OF CORES . . . . . . . . . . . . . . . . . . . . . . 4 VAPOR-PHASE SAMPLING . . . . . . . . . . . . . . . . . . . . . 7
METHODS . . . . . . . . . . . . . . . . . . . . . . . . . . . . . 15 GENERAL . . . . . . . . . . . . . . . . . . . . . . . . . . . . . 15 DESIGN OF CORE-SAMPLING SYSTEM . . . . . . . . . . . . . . . 15 DESIGN OF VAPOR-PHASE SAMPLING SYSTEM . . . . . . . . . . . 15 EXTRACTION OF SAMPLES . . . . . . . . . . . . . . . . . . . . 17
Core Samples . . . . . . . . . . . . . . . . . . . . . . . . . . . 17 Aqueous Samples . . . . . . . . . . . . . . . . . . . . . . . . . . 21 Activated Carbon Samples . . . . . . . . . . . . . . . . . . . . . 21
h4EASUREMENT OF GASOLINE COMPONENTS . . . . . . . . . . . 21 SELECTION OF TARGET COMPOUNDS . . . . . . . . . . . . . . . - 22 LABORATORY RECOVERY EXPERIMENTS . . . . . . . . . . . . . 27
Recovery of Contaminants from Cores . . . . . . . . . . . . . . . . 27 Activated Carbon Paps . . . . . . . . . . . . . . . . . . . . . . . 28
FIELD INVESTIGATION . . . . . . . . . . . . . . . . . . . . . . 32 SITEDESCRIPTION . . . . . . . . . . . . . . . . . . . . . . . . 32 CORE SAMPLING . . . . . . . . . . . . . . . . . . . . . . . . . 35 VAPOR-PHASE SAMPLING . . . . . . . . . . . . . . . . . . . . . 42
RESULTS . . . . . . . . . . . . . . . . . . . . . . . . . . . . . . 43 LABORATORY RESULTS . . . . . . . . . . . . . . . . . . . . . . 43
Recovery of Contaminants from Cores . . . . . . . . . . . . . . . . 43 Vapor-Sampling Met hod Development . . . . . . . . . . . . . . . . 47
Vapor-Phase Sampling . . . . . . . . . . . . . . . . . . . . . . . 55
FIELD RESULTS . . . . . . . . . . . . . . . . . . . . . . . . . . 51 Core Sampling and Extraction . . . . . . . . . . . . . . . . . . . . 51
iv


Page SOLUTE PARTITIONING . . . . . . . . . . . . . . . . . . . . . 63 REFERENCES . . . . . . . . . . . . . . . . . . . . . . . . . . . 68
V


LIST OF FIGURES
1 . Schematic. macroscopic illustration of a typical low-density NAPL multi-phase system . . . . . . . . . . . . . . . . . . . . . . . . . . . 3
2 . Schematic. microscopic-scale illustration of four-phase system . . . . . . . . 5
3 . Surface flux chamber . . . . . . . . . . . . . . . . . . . . . . . . . . 9
4 . Dow-n-hole flux chamber . . . . . . . . . . . . . . . . . . . . . . . . . 9
5 . Cutaway view of passive dosimeter sampler . . . . . . . . . . . . . . . .
eratto (1962) and (b) by Thorburn et al . (1979) . . . . . . . . . . . . . .
11
6 . Driveable ground-probe (DGP) designs used (a) by Neglia and Fav- 12
7 . Schematic illustration of core sampling procedure . . . . . . . . . . . . . . 8 . Design of the vapor-phase sampling system . . . . . . . . . . . . . . . .
16
18
9 . Ultrasonication solvent extraction procedure . . . . . . . . . . . . . . . . 19
10 . GC/MS total ion chromatogram from vapor-phase sample BB . . . . . . . . 24
25 11 . Comparison of TMP spectrum to library spectnun . . . . . . . . . . . . . 12a . Apparatus for circulating the spiked solution through the core sample
to sorb solutes . . . . . . . . . . . . . . . . . . . . . . . . . . . . . 29
12b . Apparatus to purge sorbed solutes from core sample and concentrate them on activated carbon . . . . . . . . . . . . . . . . . . . . . . . . 29
13 . Laboratory apparatus used to determine the adsorption characteris- tics of the carbon trap . . . . . . . . . . . . . . . . . . . . . . . . .
Carolina . . . . . . . . . . . . . . . . . . . . . . . . . . . . . . . 34
well recovery system . . . . . . . . . . . . . . . . . . . . . . . . . . 36
31
14 . Location of Tarawa Terrace site at Camp Lejeune. Jacksonville. North
15 . Piezometric head distribution resulting from operation of the purge-
16 . Contour map of apparent product thickness measurements collected from the monitoring well network . . . . . . . . . . . . . . . . . . . . . 38
17 . Location of monitoring wells at Tarawa Terrace site at Camp Lejeune. Jacksonville. North Carolina . . . . . . . . . . . . . . . . . . . . . . . 40
18 . Subsurface core sampling scheme . . . . . . . . . . . . . . . . . . . . . 41
49 19 . Effect of storage of carbon trap at .13"C . . . . . . . . . . . . . . . . .
vi


20. Effect of storage of carbon trap at 27°C. . . . . . . . . . . . . . . . . 49
21. Breakthrough curves for target compounds from a gasoline tagor mix- ture. . . . . . . . . . . . . . . . . . . . . . . . . . . . . . . . . 50
22. Comparison of nitrogen purge and ultrasonication analyses for sam- ples collected between 20-21.5 ft below ground surface. . . . . . . . . . . 56
23. Estimated, vapor-phase concentration distribution based on 26 dis- crete measurements and universd kriging interpolation. . . . . . . . . . . 59
24. Toluene concentration as a function of depth for the 4 BB sampling locations. . . . . . . . . . . . . . . . . . . . . . . . . . . . . . 60
25. Octane concentration as a funct,ion of depth for the 4 BB sampling locations. . . . . . . . . . . . . . . . . . . . . . . . . . . . . . . 61
26. Ethylbenzene concentration as a function of depth for the 4 BB sam- pling locations. . . e . . . . . . . . . . . . . . . . . . . - . . . . 61
27. Total m- and p-xylene concentration as a function of depth for the 4 BB sampling locations. . . . . . . . . . . . . . . . . . . . . . . . 62
28. Total 0-xylene concentration as a function of depth for the 4 BB sampling locations. . . . . . . . . . . . . . . . . . . , , . . . . . . 62
29. Relationship between vapor-phases and groundwater concentrations for target compounds (in duplicate) at each monitoring well. Solid linesareequilibrium. . . . . . . . . . . . . . . . . . . . . . . . 66
vii


LIST OF TABLES
1. Major Components of Gasoline Detected by GC/MS Analysis of Va- por-Phase Sample BB. . . . . . . . . . . . . . . . . . . . . . . . . . 23
2. Physical and Chemical Properties of Target Compounds. . . . . . . . . . . 26
3. Camp Lejeune Contamination and Cleanup Event Chronology. . . . . . . . 37
4. Mass-Recovery Results by Ultrasonication. . . . . . . . . . . . . . . . . 44
5. Mass-Recovery Results by Nitrogen Purge. . . . . . . . . , . . . . . . . 46
6. Nitrogen-Purge Mass Recovery from Field Samples. . . . . . . . . . . . . 52
7. Comparison of Target Solute Concentrations and Moisture Content for Samples Analyzed Using the Nitrogen-Purge Method. . . . . . . - . . 54
8. Target Solute Concentrations from Ultrasonic Analysis of 20-g Field Samples Collected at Depth of 21 Feet Below Ground Surface. . . . . . . . 55
9. Comparison of Concentrations from Multiple Ultrasonication Anal- yses Performed on Samples Collected at 20.5 Feet Below Ground Surface. . . . . . . . . . . . . . . . , . . . . . . . . . . . . . . . 57
10. Temporal Variation in Contaminant Concentrations Expressed as Percent Change Between 1 April 1987 and 18 June 1987. . . . . . . . . . . 58
11. Calculation of Fkaction of Target Compound in Vapor Phase Based on Independent Measurements of Vapor Phase and Vapor, Solid, and Aqueous Phases Combined. . . . . . . . . . . e . . . . . . . . . . . 65
... vlll


SUMMARY AND CONCLUSIONS
This research investigated three methods of measuring contamination of the partially
saturated zone by leaking underground fuel tanks. Two of the methods relied upon ob-
taining a soil core from the field. These differed in the method of extract,ion: (1) by
nitrogen purge of the entire core, followed by adsorption-solvent extraction and gas chro-
matographic (GC) analysis and (2) by sonication of a small sub-sample from the core,
followed by solvent extraction and GC analysis. The third method focused on determining
the contaminants present in the vapor phase of the partially saturated zone. This required
use of a driveable ground probe (DGP) and activated carbon trap (to concentrate the
contaminants), followed by solvent extraction and GC analysis. While each of these meth-
ods has been reported in the literature, there is little experience with them. Each has a
number of system parameters that affect performance and their practical implementation
for measuring the extent of subsurface contamination. This research combined laboratory
study of the methods under controlled conditions with field study at the Marine Corps
Base Camp Lejeune.
The soil core procedures required construction of a sampling tube that proved quite
successful to use in the field, while also permitting convenient operation of the nitrogen
purge system upon return to the laboratory. Extensive laboratory investigation was under-
taken to determine the conditions that maximized recovery of a series of target compounds
(toluene, octane, ethylbenzene and m,p xylene) known to be present in gasoline. Recoser-
ies approaching 100% were achieved in the nitrogen purge procedure by: heating the soil
core to 100OC; trapping water exiting the soil core prior to the adsorption step; and using
activated carbon instead of Tenax as the adsorbent. Similar, high recoveries were achieved
in the sonication procedure by: minimizing exposure of the sample to the atmosphere;
using a series of two sonications (each 10 min. at 500 watt power) and extractions. The
sonication procedure was advantageous because it requires far less time than either nitro-
ix


gen purge of the soil core or conventional soxhtet extraction. A comparison of the nitrogen
purge and sonication procedures on field samples taken from the Marine Corps Base Camp
Lejeune showed that the nitrogen-purge procedure gave lower recoveries of gasoline com-
ponents selected as target compounds. One unavoidable problem with nitrogen purging
is variability in hydraulic conductivity of cored sample; this means that uneven nitrogen
purging may result.
The soil core method, regardless of the subsequent sample handling by either nitrogen
purge or sonication, was very useful in mapping the extent of contamination of the sub-
surface ne= leaking underground storage tanks. These contaminants recovered by such a
device can be present in the vapor, solid, or aqueous phases within the core. A theoretical
analysis based on literature d u e s of partition coefficients and some field data suggests
further that the aromatic hydrocarbons are rather uniformly distributed among all three
phases. Thus the effectiveness of clean-up efforts cannot be properly assessed unless the
nature of residual soil contamination is recognized.
The DGP with sorptive trap provides a practical alternative to the commercially
a d a b l e DGP with direct injection of vapor phase into a field GC. Although results may
not be available immediately in the field, the method provides offsetting advantages. It
seems particularly well-suited for use by regional, regulatory offices that may lack crew
experienced in analytical methods and a budget to purchase a field GC. A two-person
crew could easily obtain vapor-phase samples from say 10 to 20 locations in one day and
mail the samples back to a central laboratory for processing; the samples can be stored
(several weeks) without significant loss of analytes. Typical sampling times may be on the
order of 5 or 10 minutes, as demonstrated by laboratory studies of controlled systems and
the results of field tests.
Vapor-phase measurements provided a convenient way to map the extent of con-
tamination from a leaking underground gasoline storage tank at the Camp Lejeune site.
Concentrations of target compounds ranged from 10,000 ug/l to less than 10 ug/l of vapor
X


phase. The highest concentrations were found above the NAPL as was expected. However,
the method W~
the concentrations drop off precipitously. Attempts to relate the vapor-phase concentra-
tions to those in the soil and the groundwater proved difficult. Core concentration, which
included contaminant in the solid, aqueous, and Tapor phases, was about the same regard-
less of whether the sample was taken from within or without the non-aqueous-phase liquid
(NAPL) region. However, the Tapor-phase contribution to the total decreased on either
side of the NAPL region. Although there were exceptions, the data appeared to support
equilibrium partitioning between the vapor and aqueous phases, despite the fact that vapor
o able to show that c ~ ~ t ~ ~ n ~ t j ~ ~ exists well beyond the NAPL,
samples were obtained 10 ft or more above the groundwater. Thus it may be possible to
use Henry’s law and a vapor-phase solute concentration to estimate a groundwater solute
concent ration.


RECOMMENDATIONS
The work summarized in this document suggests several recommendations: some that
are immediately applicable, and some that require additional research. These recommen-
dations may be summarized by:
1. Routine use of the driveable ground-probe method investigated in this research should
be considered by State personnel and consultants, because it is a rapid and economical
method of investigating the distribution of subsurface contamination.
2. The ultrasonic extraction method investigated in this research should be used by State
personnel and consultants for cases where an estimate of total contaminant mass and
distribution in the subsurface is needed.
3. Vapor-phase mass transfer is an important process in the subsurface, which leads to
the distribution of contaminant in all directions from an initial source. This distribu-
tion can result in a substantial mass of solute retained within the partially saturated
zone-complicating source identification and aquifer restoration. This process requires
further investigation at the laboratory, field, and theoretical levels.
4. Additional research is needed to define experimentally and theoretically the signif-
icance of nonequilibrium phase partitioning in the subsurface. It seems likely that
the rate of interphase mass transfer and equilibrium hysteresis axe important areas of
research-areas where advancement can and should be made in order to more accu-
rately predict contaminant movement in the subsurface.
xii


INTRODUCTION
Leaking underground storage tanks are one of the most frequent causes of groundwater
pollution in the United States. For example, a recent survey estimated that more than
75,000 gasoline storage tanks were leaking (Maclay et d., 1985), while many other tanks are
approaching their design life (Sun, 1986). Upon release of gasoline in the subsurface, each
of the many organic components in gasoline is transported by bulk movement and inter-
e transfer (;.e., to the groundwater, soil and vapor); some of these components may
also be' degraded or transformed by either biotic or abiotic processes. The result is a spatial
and temporal distribution of contaminants in the subsurface environment. The challenge
for regulatory agencies and clean-up firms is to obtain and interpret measurements of
this distribution in order to take corrective action. If the proper data are obtained, it is
possible to: e d u a t e the severity of the contamination; rank sites for clean-up priority;
predict future distributions of contami s; and perform risk-assessment analysis.
While the ultimate use of contaminant measurements is to assess the extent of ground-
water contamination, the problem of leaking underground storage tanks begins in the
partially-saturated zone. Thus, measurements of contaminant distribution within this
g the proper conective action provided that convenient e can be worthwhile for
techniques are available.
The objectives of this research were to develop and test two methods for measurement
of organic contaminants in the partially-saturated zone. Th methods involved sampling
and analysis of subsurface cores and vapor withdrawn from the sub-surface. Method
laboratory control experiments and field-scale testing.
his work are: (1) a design and an opera al protocol for a sensitive
vapor-phase sampling probe; (2) a compazison of methods for subsurface core contaminant
extraction-along with an analytical protocol; (3) and a field-scale comparison of the
results from application of both methods.
1

PREVIOUS RESEARCH
GENERAL
The terminology used in this report is somewhat different than that often noted in
the literature. For example, this report will use submrfuce core or simply core samples
to describe samples collected from the subsurface that typically include 3 phases: solid,
aqueous, and vapor. Such samples are frequently called soil cores. Vapor-pha~e or gas-
phase concentration will be used to describe the mass of solute per volume of vapor in
the interstices of the subsurface solid matrix-a quantity which is often termed the soil
gas concentration. The reasons for this divergence are twofold: the common name is a
rnisnomer, because soil is a solid phase and not a gas or vapor phase; and the analysis
performed in this work included samples from the soil zone, from the intermediate zone,
and from locations in excess of 20 ft below ground surface-approaching the phreatic
surface. Therefore, use of the term soil infers an overly restrictive description of the work
performed here and the methods used to perform that work.
A fluid that is immiscible with water is termed a non-aqueous-phase liquid (NAPL).
NAPL’s may be either less dense (e.g. petroleum products) or more dense (e.g. chlorinated
solvents) than water. Consider the spill of a low- density NAPL released into the subsur-
face environment from a leaking underground storage tank, which is illustrated by Figure
1. After release the NAPL moves primarily vertically through the partially-saturated zone
(unsaturated zone) in response to gravity forces. As the NAPL moves vertically: a portion
of the immiscible fluid is retained by capillary forces in the pore spaces (Schwille, 1967); sol-
uble components of the NAPL are transferred to the pore water phase; volatile com
of the NAPL are transferred to the vapor phase; and the NAPL eventually intercepts the
water table and begins migration in the direction of groundwater movement-if a sufficient
volume of NAPL is released.
The above scenario leads to the distribution of contaminants in four phases: the NAPL
2

Figure 1. Schematic, macroscopic illustration of a typical low-density NAPL multi- phase system.
3

phase, the aqueous phase, the vapor phase, and the solid (soil, patially-saturated sands,
&Its, or clays, and aquifer materials) phase. A schematic, microscopic-scale illustration of
a four-phase system is given by Figure 2. The amount and distribution of contaminant in
each phase is an important consideration for eduating and implementing clean-up plans.
A body of literature exists describing the distribution of contaminants among all
phases for a variety of hydrogeological conditions and solute contaminants. A thorough
review of this literature is beyond the scope of this report. Rather, a brief review of two
areas key to this research follows: methods of subsurface core extraction, and methods of
measuring the vapor-phase concentration.
EXTRACTION OF CORES
The measurement of contaminants in a core sample requires the removal of contami-
nants from all phases of the sample: solid, aqueous, and vapor. Therefore, measurement of
present in the sample.
some combination of:
contaminant levels in a subsurface core is a composite measurement of levels in all phases
Methods of contaminant concentration extraction typically rely on
(1) elevated temperature or other sources of energy input to the
system-to encourage desorption, an endothermic process; (2) introduction of an organic
solvent-to concentrate hydrophobic sol
centration of the contaminants of conce
solute mass transfer to the circulated fluid.
(3) circulation of fluid with a small con-
o impose nonequilibrium conditions that yield
Soxhlet extraction is the most widely used solvent extraction method for volatile
organic recovery from solid-phase samples. In this method, a solid sample is placed in a
glass thimble and continuously extracted with an appropriate solvent through a repetitive
closed distillation-condensation process. The usual extraction time in this method is 24-48
hr, providing exhaustive extraction of the sample. However, this lengthy extraction time
is not practical for a large volume of s
Ultrasonication of a natural solids-solvent mixture is another method by which volatile
4

Figure 2. Schematic, microscopic-scde austration of four-phase system.
5

organic compounds can be extracted. Ultrasonication involves the agitation and disruption
of solute particles from the solid phase by means of high frequency sound waves. Johnsen
and Starr (1972) first developed this method for the recovery of pesticides (dieldrin and
heptachlor) from sediments.
Petersen and Freeman (1982) used soxhlet and sonication extraction to extract phtha-
lates from wet and dry subsurface materials. They found low recoveries and high variability
using soxhlet extraction, with dry solid-phase samples yielding better recoveries than ini-
tially wet samples. Sonication extraction gave better recoveries than soxhlet extraction for
both the wet and the dry samples.
Hamilton et d. (1984) investigated soxhlet extraction of hydrocarbons from river
sediments. The extractions were carried out for 48 hr with a solvent mixture (65% methy-
lene chloride and 35% methanol). Recoveries of 97% were reported for total extractable
hydrocarbons.
Laseter et d. (1980) also employed a rap vent extraction method. They obtained
subsurface solid-phase s ampler, added 1 ml of hexane to a 1 g
subsample from the co sample on a vortex mixer for 30 seconds.
on of aromatic and aliphatic hydrocarbons
coveries for this experiment were 92% for the
ons, using soxhlet extraction
nned by extracting the solid-
phase sample with a solvent pair (2:l volume ratio of methylene chloride and methanol,
respectively) six separate times, followed by concentration with a rotary evaporator and a
gentle stream of nitrogen (Grimalt et d., 1984).
for 76 hr with ultrasoni
Jenkins and Grant (1987) performed a comparison study using 2 different solids, 2
different target compounds (trinitrotoluene and trinitrobenzene), 2 different solvents (ace-
tonitrile and methanol), and four different techniques (soxhlet extraction, ultrasonic bath
6

extraction, mechanical shaker extraction, and a homogenization sonicator extraction). The
~ ~ t r ~ o n ~ c a t o ~ bath method was ~ e c o ~ ~ ~ ~ ~ ~ because: more s ples could be processed
at one time, recoveries were comparable with the soxhlet extraction, less time was neces-
s a r y for the extraction procedure, and the water content of the sediments did not seem to
affect the extraction efficiency of this method.
Slater et al. (1983) used a dry purge method of a clayey solid-phase sample to detect
volatile organics. An undisturbed representative sample (800 g) was collected by means
of a split-spoon drive sampler and a hollow-stem, continuous-flight auger. The heated
sample was purged with a 40 cc/min of nitrogen for 20 hr onto an activated carbon trap.
The recoveries for this method ranged from 60-1 10% for freon, 1,1,3-trichloroethylene, and
perchloroethylene. The advantages of this method are: the large sample volume reduces
the effects of small-scale sample heterogeneity; and less handling of the sample is required.
VAPOR-PHASE SAMPLING
The state-of-the-art of vapor-phase sampling is de d in a recent American Petrole-
into the following u m Institute publication (Eklund, 1985). Sampling methods are di
categories:
0 surface flu chambers
0 downhole flux chambers
0 accumulator devices
0 driveable ground probes (DGPs)
While these appear to offer the user a wide choice, none of the methods has been
tested extensively enough to date to establish what may be termed an acceptable stan-
dard procedure. Some have been brought to commercial development but these are ‘‘fist
generation” designs.
A surface flux chamber is shown in Figure 3. A vapor-phase sample is trapped in
the chamber located at the ground surface. The vapor is then passed to a field gas chro-
7

matograph (GC) by purging the chamber with an inert carrier gas. Use of this device
i s reviewed by Eklund in-situ measurement, it simplifies d Schmidt (1983). Being
sample handling greatly thus being fairly rapid. Because augering is not required, it can
be applied to any field condition. However, the main disadvantages axe that only vapor
near the surface can be measured and dilution of the vapor collected by the carrier gas
results in a loss of sensitivity in GC analysis.
Down-hole flux chambers are similar in principle to surface flu chambers but allow
measurement of vapor concentrations for any depth thereby overcoming one disadvantage
of surface flux chambers. The device, as shown in Figure 4, is placed in the ground using
a hollow-stem auger, although a hand auger could also be used for shallow depths. This
method has been used at hazardous waste sites (Evans and Thompson, 1986).
Accumulator devices offer an alternative in-situ method of vapor-phase sampling. The
objective is to eliminate purging of the vapor phase into a GC. Instead, the organic com-
pounds in the vapor phase are concentrated directly onto a sorbent material implanted in
the subsurface. The organic c ounds reach the sorbent material by molecular diffusion.
ndustrial hygiene field, these devices are known as passive dosimeters. In
fact, Kerfoot, et al. (1986) recently reported the use of such commercially available, or-
ganic vapor monitors to measure chloroform in the vapor phase. A cutaway view of the
sampler-manifold assembly is given in Figure 5. The monitor itself is made of activated
carbon; in this application, it was suspended inside a 1-quart metal can at a depth of 1 ft
below the surface. After a 2-wk exposure, the dosimeters were retrieved and extracted for
GC analysis of the organic compounds of interest. The concentration in the vapor phase
is computed from Fick’s Law of steady-state diffusion. Voorhees, et al. (1984) describe
a similar method, differing only in the technique used to desorb the organic compounds
collected on the dosimeter. The sorbent (activated carbon) is coated onto a ferromag-
netic wire, which makes it possible to use Curiepoint desorption mass spectroscopy and
thus eliminates extraction by an organic solvent. This method was used to measure tetra-
8

PL LXICLASS
_ _ _ _ _ _ _ _ - _ _ - - - I
CAS L- 1 6 . L
Figure 3. Surface flux chamber.
0.215 In. in 0.25 in. O U ~ ~ J U C w R k V L C W -‘--I --s G
Figure 4, Down-hole flux chamber,
9

chloroethylene in the vapor phase.
Accumulator devices offer advantages of simplicity, relatively low-cost and suitability
for various site conditions. However, sampling times tend to be quite long (on the order
of weeks) in order to accumulate sufficient mass of organic compounds to detect; this is
because such passive samplers rely on molecular diffusion for vapor-phase collection.
The driveable ground probe (DGP) method is, according to a recent American Petrole-
um Institute report (Eklund, 1985), recommended over all the others. A hollow tube is
hydraulically driven or hammered to a desired depth as illustrated in Figure 6. The tube
has 6 opening(s) at the bottom to allow vapors to enter the tube from the surrounding
media. A pump is used to bring a vapor phase to the surface where a small aliquot (a few
ml) is withdrawn for GC analysis on-site. This method has been used for decades in oil
exploration (Neglia and Favretto, 1962) to detect hydrocarbons at ppm levels.
.
The DGP method has been adapted for various field site investigations (Thorburn et
al., 1979; Colenutt and Davies, 1980; Colenutt and Thorbum, 1980; Lapella and Thomp-
son, 1983; Swallow and Gschwend, 1983; Radian, 1984). Several organic solvents (tri-
cMoroethylene, perchoroethylene and trichloroethane) were measured above a contami-
nated aquifer in Santa Clara, California (Lapella and Thompson, 1983). The amounts
found in the vapor phase were in rough agreement with predictions based on gas-liquid
partitioning coefficients. In another app ation, the areal extent of 2 subsurface petroleum
spills was determined (Evans and Thompson, 1986). In both instances, the total hydrocar-
bon concentration (i.e. the s u m of all the detectable volatile components of the petroleum)
decreased rapidly beyond the edge of the groundwater plume. Thus the hydrocarbons in
the vapor phase originated from volatilization from the non-aqueous-phase layer. Radian
Corporation (1984) reported success in using the method to detect the advancement of a
contaminant plume; however, only the lighter fraction of the gasoline components could
be detected in the vapor phase.
The DGP method has been modified to allow for concentration of organic compounds
10

Figure 5 . Cutaway view of passive dosimeter sampler.

Figure 6. Driveable ground-probe (DGP) designs used (a) by Neglia and Faveratto (1962) and (b) by Thorburn et al. (1979).
12

in the vapor phase (Thorburn et al., 1 ; Colenutt and Davies, 1980; Colenutt and
Thorburn, 1980; SwaIlow and Gschwend, 1983), Instead of withdrawing a vapor-phase
sample for injection into a GC, it is contin ;ously passed through an adsorption trap for a
period of time ranging from minutes to hel IS. The organic compounds are then desorbed
for GC analysis, which is performed in a oratory rather than in the field. The first
report of this approach appeared in 1979 far detection of methane and other gases from
landfill sites (Thorbum et al., 1979). Reports that followed from the same investigators
in 1980 discussed the application to detecraon of other organic compounds at a landfill
site (colenutt and Davies, 1980; Colenutt a d Thorbum, 1980). In each instance, the
adsorbent was activated carbon,
A synthetic, porous polymeric adsorbent (Tenax) has been used instead of activated
carbon for concentration of mpor-phase contaninants above a contaminated aquifer (Swal-
low and Gschwend, 1983). The Tenax trap is desorbed thermally rather than with an
organic solvent. This is accomplished by attaching the trap directly to the inlet port of
a GC and heating it to sweep the organic compounds into the GC column for detection.
This eliminates the interference of a solvent peak and increases sensitivity because there
is no dilution of the organic compounds by the solvent. The disadvantages, however, are
that the hardware to adapt a GC for thermal desorption is expensive and complex; only
one opportunity for analysis is provided (the trap is desorbed completely); thermal de-
composition of some organic compounds may occur; and finally, the sorptive capacity for
Tenax is much less than that of activated carbon for a wide variety of compounds.
While the literature does contain some reports of the DGP method modified to in-
clude a preconcentration step using ;hll adsorption trap, there is little information on its
applicability to detection of gasoline vapors, the specific point of interest in this research.
Moreover, the method is still in the development stage with more work needed on the de-
sign of the DGP itself, verification of the sorptive capacity of the trap for specific organic
compounds, and application to actual field conditions.
13

Preconcentration may not be necessary in many applications because direct injec-
tion offers emu sensitivity* However, direct injection requires use of a fajsdy expensive9
portable GC and a field crew skilled in analytical techniques. On the other hand, pre-
concentration usually means that samples are not analyzed in the field but instead must
be sent back to a laboratory. In addition, preconcentration requires that the adsorption
and desorption characteristics of each compound of interest be known in order to calculate
concentrations correctly. For example, it has been shown that water iapor can decrease
the adsorption of many volatile organic compounds due to competition (Chiou and Shoup,
1985; Tang, 1986). A more detailed comparison of direct injection vs. preconcentration
from the analytical perspective is given by Nunez et al. (1984). In general, quantitative
results obtained by direct injection are not as accurate. This is especially true when an-
alyzing for many compounds in a mixture such as gasoline; less volatile components may
have lower concentrations in the tapor phase and will not be easily detected by direct
injection (Nunez et al., 1984).
14
METHODS,
GENERAL
Methods included design of field equipment for collection of cores and vapor-phase
samples and development of laboratory methods for subsequent analysis of these field
samples. The following sections detail these methods, while discussions of the field site
and application of these monitoring methods in the field are presented in the next chapter.
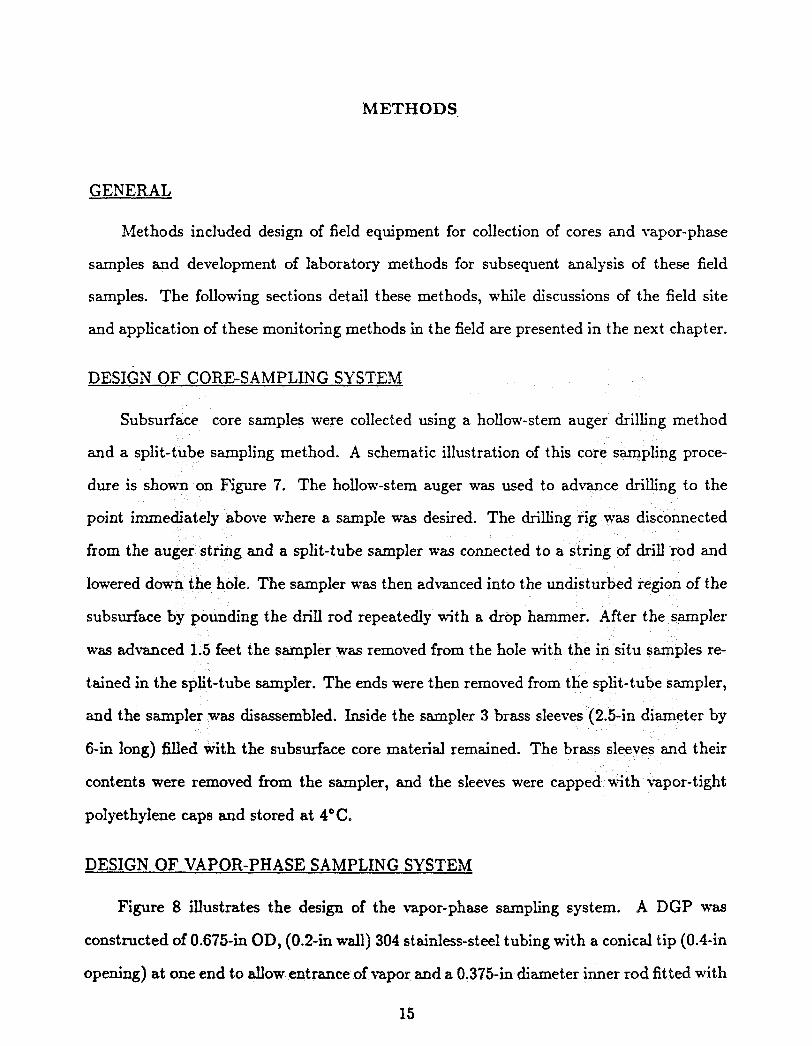
DESIGN OF CORE-SAMPLING SYSTEM
core samples were collected using a hollow-stem auger dril
pling method. A schematic illustration of this core s
Figure '7. The hollow-stem auger was used to
ove where a sample was desired. The drilli
and a split-tube sampler was connected to a
e. The sampler was then advanced into the
g the drill rod repeatedly with a drop h
he sampler was removed from the hole with
sampler. The ends were then removed from t
sassembled. Inside the samples 3 brass
e subsurface core matserial remained.
contents were removed from the sampler, and the sleeves
polyethylene caps and stored at 4°C.
DESIGN OF VAPOR-PHASE SAMPLING SYSTEM
Figure 8 illustrates the design of the vapor-phase sampling system. A DGP was
constructed of 0.675-in OD, (0.2-in wall) 304 stainless-steel tubing with a conical tip (0.4411
opening) at one end to allow entrance of vapor and a 0.375-in diameter inner rod fitted with
15

E X T E N S I O N T O D R O P HAMMER
HOLLOW-STEM FLIGHT AUGER
B R A S S SAMPLINO TUBES
ROD
Figure 7. Schematic ihstration of core sampling procedure.
16

a hardened steel driving point. The probe assembly.was inserted by driving on a hammer
block. Withdrawal of the inner rod left a void space in the media where the driving point
had protruded below the outside tubing, thus giving an opening to the sampling tube that
was not clogged by solid particles. The probe assembly was connected to the tacuum
pump (Thomas Industries Model 115), adsorption traps (two in series) and flow meter
(Dwyer) with 0.125-in diameter, flexible, stainless-steel tubing and appropriate fittings.
The adsorption traps are simply small glass tubes containing a known amount of coconut-
shell activated carbon (Environmental Compliance Corporation); the first adsorption trap
contained 100 mg and the second trap 50 mg. The two trap series was used so that the
ability of the first trap to capture all the vapor-phase contaminants could be ascertained,
i.e., in normal operation, no contaminants wodd be recovere
EXTRACTION OF SAMPLES
Core Samples
om the second trap.
and
1.
2.
3.
4.
The ultrasonication solvent extraction procedure illustrated by Figure 9 was developed
of the following protocol.
ple or subsample was removed &om in $;tu
to the top with water
r sample and placed in a
storing at 4°C to prevent vial-filling the vi
volatilization losses.
At analysis time, the Pierce vial contents were transferred to 250-ml borosilicate cen-
trifuge bottles, and the vial was rinsed t h e e times with 10 ml of acetone. The acetone
rinse was placed in the centrifuge bottle that contained the original sample.
The centrifuge bottle was amended with: 35 g of sodium sulfate-a drying agent; and
100 ml of p e n t m e t h e organic solvent used for extraction. The centrifuge bottle
was then capped with a TeflodR)-lined screw-cap and stirred with a magnetic stirrer
and a Teflon-coated stir-bar for 5 min.
The centrifuge bottle was placed in a water bath equipped with a sonic horn (Tekmar
17

Fjgure 8. Design of the vapor-phase sampling system.
18

ULTRASONICATtQN PROCEDURE
3 x 10 ml acetone transfer to 250 mi centrifuge bottle;
IO0 ml pentane added 35 9, N a p ,
KD APPARATUS
20 g sand, 5 mi water
Sonic hom
bath
centrifuged Kuderna-Danish evaporation
ultrasonicated for ten minutes * for ten minutes
e Reextraction with 100 mi KD evaporation to 5 ml
Figure 9. Ultrasonication solvent extraction procedure.

disruptor hom, 500 watts), and ultrasonicated.for 10 min at full power.
5. The sample was centrifuged (CRU 5008 centrifuge) for 10 min at 899 rpm and 4°C
and the supernatant was decanted into a Kudema-Danish evaporation flask.
6. An additional 100 ml of pentane was added to the centrifuge bottle. The contents
were stirred for 5 min; ultrasonication was performed for 10 min at 500 watts power;
phase separa as accomplishe for 10 min at 2899 rpm; and the
pentane supernatant was added to the original fluid mixture.
ere dried with anhydrous sodium sulfate and evaporated to
method and brought to a 10-ml volume by
oncentrate in a volumetric flask.
8. Extracts (1 pl) were analyzed by capillary gas chro graphy using a 30- m, SPB-1
capillary column. Chromatographic conditions were 33°C (2 min), 4"C/min, 100°C
(3 min). An external c ation curve of the target compounds was used to calculate
percent recoveries.
The second subsurface-sample extraction method investigated was a heated nitrogen
purge of an in situ liner sample. The method consis
1. At analysis time, the polyethylene caps were r
the following protocol.
from the field-collected in d u
chined, brass caps, which were equipped with an o-ring seal, were
f the brass liner.
2. ich was capable of accommo-
dating 4 samples simultaneously. The inlet line was connected to a nitrogen tank,
and the effluent line discharged through two, 150- activated carbon traps to an
exhaust hood. Included i uent line was a s atory funnel that was used to
trap moisture prior to discharge through the activated carbon traps.
3. Extraction was accomplished by adjusting the oven temperature to 100°C and flowing
nitrogen through the sample at the rate of 10 ml/min for a period of 20 hr. t
4. Following the nitrogen purge, the in-line activated carbon traps were removed and
20

each trap was extracted with 2 d of carbon disulfide and the extract was andyzed
by capillary gas chromatography.
Aqueous Samdes
Aqueous samples were collected and stored in 40-ml Pierce vials with minimal head-
space. A volumetric pipette was used to transfer 20 ml of the aqueous sample to a 125-ml
separatory funnel. Three successive liquid-liquid extractions were made with methylene
chloride (volume used depended on initial solute concentration in the aqueous sample),
Each time the aqueous sample was shaken vigorously with the methylene chloride and
the lower methyIene chloride layer WE drained into a sample vial, The final portion of
methylene chloride extract was dried wb:h sodium sulfate. A 1 p1 injection of the methylene
chloride extract was made into a Varimi capillary gas chromatograph, which was equipped
with a flame-ionization detector. A stcc-dard curve of the tazget compounds was run with
each set of aqueous samples, and 1-chj;imdecane RTLS used as an internal standard.
Activated Carbon Samples
The activated carbon traps were extracted in the laboratory using 1 ml of CS2. Two
internal standards (IS), I-chlorooctane and 1-chlorodecane, were added at 35 ppb to the
CS2 stock solvent before use. The purpose of the IS was to quantify the sample injection
volume-giving a more accurate basis for computing target compound concentration as
compared to sample volume estimation from syringe interpolation.
MEASUREMENT OF GASOLINE COMPONENTS
Gasoline components were analyzed using a Varian 3700 high-resolution GC with a
flame ionization detector (FID). Chromatographic separation was achieved on a 30-m,
Supelco SPB-1 fused-silica capillary c ~ i u m n with splitless injection and temperature pro-
gramming: the initial temperature w~~ held at 35°C for 8 minutes, and then programmed
to 175°C at a rate of 6°C per minute, The injector temperature was set at 285°C and the
21

FID was set at 300°C; and the helium carrier gas flow rate was 1.7 ml per min. If hydro-
carbon vapors were not detected by GC analysis, the samples were concentrated under a
gentle stream of nitrogen gas to 0.1 ml and rerun under the same GC conditions.
Field samples required gas chromatography/mass spectroscopy (GC/MS) to provide
a tentative identification of the components of gasoline. The mass spectrometer \vas a VG
Micromass 12-250 quadrapole with a VG 11-250 data system. Electron ionization (EI) was
employed (70 electron volt source potential) with a scan range of 40 to 500 atomic mass
units. Identification was by library spectral matching.
SELECTION OF TARGET COMPOUNDS
Target compounds were chosen on the basis of their predence in gasoline. The per-
centages of the target compounds do vary considerably, depending on the type of gasoline,
the manufacturer, and the season. A group of “target” compounds was selected from
among those identified by the GC/MS library spectral matching procedure. The criteria
for selection were that each compound be present in high concentration and sorb well onto
activated carbon. The latter criterion was necessary because the methodologies for recov-
ery of gasoline components from both the vapor phase and the subsurface solids involved
use of activated carbon at some stage for preconcentration. The drawback to the target
compound approach is that the mass of gasoline in the sample cannot be calculated unless
all components were to be analyzed. Nevertheless, the selection of target compounds is
the only practical way to deal with a mixture that may contain over one-hundred com-
pounds. These target compounds provide “markers” that describe the extent of subsurface
contamination. Standard curves of peak area vs. mass injected for each target compound
were generated. Response factors generated from these curves were used to convert peak
area responses to mass measurements.
Figure 10 is a GC/MS total ion chromatogram for vapor-phase sample BB collected
at Marine Corps Base Camp Lejeune (see section on Site Description for location of sam-
22

ples). Table 1 lists 27 major components that have been identified. Mass spectral analysis
revealed that toluene and an aliphatic hydrocarbon-trimethyl pentane (TMP)-coeluted.
A comparison of the TMP spectrum (Figure 11) to &braxy spectra tentatively identified
this compound as 2,3,3 trimethyl pentane. A chromatographic technique was used to
separate toluene from TMP. Three samples (from locations AA, BB, and W) were re-
analyzed in duplicate, first on a Supelco SPB-1 (non-polar) and then on a J&W Scientific
DB-5 (slightly pofar), 30-meter capilfary column. While toluene and TMP coeluted on the
non-polar column, the retention time of toluene was increased on the slightly polar, DB-5
colum~l due to the slightly polar nature of toluene. Thus the contribution of toluene to the
total was calculated. The chromatographic response factors, which are relative measures
of FID response to a known mass of andyte, were 1.07 and 1.0 for toluene and TMP, re-
spectively (Dietz, 1967) so that peak area response for the two compounds was calculated
with no more than 7% additional error.
Table I. Major Components of Gasoline Detected by GCIMS Analysis of Vapor-Phase i
Sample BB.
1. Hexane 15. 2,3,3-%methyl Pentane 2. 2,2-Dimethyl Pentane 16. Toluene 3. 2-Methyl Hexane 17. 3,3-Dimethyl Hexane 4. 3-Methyl Hexane 18. 2-Methyl Heptane 5. 2,2,4-%methyl Pentane 19. 3,4Dimethyl Hexane 6. 2,ZDimethyl Hexane 20. 3-Methyl Heptane 7. 3-Methyl Hexane 21. 2,P-Dimethyl Hexme 8. 2-Methyl Hexane 22. 2,4,4Trimethyl Hexane 9. 3-Methyl Hexene ' 23. 3,4Dimethyl Octane
10. 1,1,3-Trimethyl Cyclopentane 24. Ethylbenzene 11. 2,sDimethyl Hexane 25. m-Xylene 12. n-Octane 26. pXylene 13. 2,3,4Trimethyl Pentane 27. *Xylene 14, PMethyl Heptane
23

. . . . . . . 77 d 70 0 29 0
Figure 10. GC/MS total ion chromatogram from vapor-phase sample BB.
24

4 6 c U
t o 7 TI1 c.r* Relative Intensities +,
h 0
cs. 4
E 4
m w

The target compounds selected after GC/MS ealysis were: toluene (taken together
with TMP), octane, ethylbenzene, m,p-xylene (taken together), and o- xylene. Their
physical and chemical properties are listed in Table 2. The concentration of each target
compound in the vapor phase, expressed as pg/l of vapor, was calculated by:
W o r cv = &t
where M801 is the solute mass measured by GC analysis; Q is the flow rate of the sampler;
and t is the sampling time. For the core samples, concentrations were computed based on
solute mass measured by gas chromatography normalized by the mass of solid phase after
drying.
Table 2. Physical and Chemical Properties of Target Compounds
Mol Wt .' Boiling' Density' Water Compounds g/mol Pt. "C Log g/ml mg/l
Toluene 92.14 110.6 2.46 0.8669 515.
Octane 14.23 125.7 0.7025 0.06
Et hylbenzene 106.20 136.2 3.15 0.8670 152.
*Xylene 106.17 144.5 3.12 0.8802 175.
m-Xy Iene 106.17 139.1 3.20 0.8642 200.
p-X ylene 106.17 138.3 3.15 0.8611 198.
Weast (1986) Hans& and Leo (1979) Verschueren ( 1983)
26

LABORATORY RECOVERY EXPERIMENTS .
Recoverv of Contaminants from Cores
The extraction methods presented in the previous section were investigated in the
laboratory to determine a theoretical recoveryo The ultrasonication recovery was tested
using the following procedure.
1. The sand to be used in the spiking and recovery experiments was dried overnight at
105°C in an oven.
2. A- 20-g sand sample was placed in a 40-d Pierce vial and hydrated with 5 d of
distilled, deionized water for 1 hr.
3. A target compound stock standard was prepared by adding 5 p1 each of the target
solutes (toluene, octane, ethyl benzene, and o,m,p,-xylenes) to 25 ml of acetone in a
volumetric flask.
4. Three different masses of the target solutes were spiked onto three different hydrated
sand samples by adding 0.5, 1.0, and 1.5 ml of the target stock standard to the
Pierce vials. The vials were then capped with Teflon-lined screw caps and allowed to
equilibrate at 4°C for 16 hr before extraction.
5. Extraction and analysis were performed using the ultrasonication procedure detailed
in the previous section. Comparison ob solute mass added and solute mass measured
by extraction yielded the bases for computation of the theoretical recovery.
The nitrogen-purge method recovery was tested using the following procedure.
sed was dried overnight in an oven at 105°C.
2. The dry sand (about 615 g) was packed into a 2.5-in diameter, 6-in long brass core
and attached to brass inlet and outlet caps.
queous solution was prepared by addin 3.8-g NazBaO7.10 H2O per 1 1 of distilled,
deionized water-giving a 0.1 M borate buffer. The aqueous solution was further
amended by adding 0.5% by weight of sodium azide to the distilled water to prevent
27

microbial degradation of the test compounds. .
4. The prepared aqueous solution was recirculated through the sand column using a
magnetic drive Micropump for 24 hr to hydra
5. A spiked solution was prepared by adding 50 pl of each target solute to 1 1 of the
prepared aqueous solution. The spiked solution was shaken vigorously, and stirred for
30 min to ensure complete dissolution of the target compounds in the water.
6. A 10 ml aliquot of the spiked solution was taken, and liquid-liquid extraction was
performed 3 times using 10 ml portions of methylene chloride each time. Samples were
analyzed by using 1 pl subsamples of the extract and capillary gas chromatography-
yielding a measured initial concentration of each compound.
7. The spiked solution was circulated through the sand column for 48 hr using the set-up
schematically shown by Figure 12 (a). All fittings and tubing in the set-up were either
Teflon or glass to minimize sorption of the target compounds to materials other than
the sand.
8. After a 48-hr period of recirculation, a 10-ml aliquot of the circulated solution was
taken, liquid-liquid extracted with methylene chloride, and analyzed by capillary gas
chromatography-yielding a measure of the final spiked solution concentration. The
difference between the final mass of solutes and the initial mass of solutes was the
theoretical amount of the solutes sorbed to the sand.
9. Core extraction and analysis were performed using the nitrogen purge procedure de-
tailed in the previous section. Comparison of solute mass added and solute mass
measured by extraction yielded the b for computation of the theoretical recovery.
Activated Carbon Raps
The recovery efficiency of the CS2 extraction procedure was detennined for each of
the target compounds sorbed on the carbon traps. The target compounds (76 pg of each)
were injected with a 1O-pl syringe directly into the open end of a carbon trap (containing
150 mg of activated carbon) and allowed to adsorb. After 24 hr, the trap was extracted
28

E
brass core with 600 g soil
flow
Distilled H , 8 spilled with target compounds
Figure 12 (a). -4pparatus for circulating the spiked solution through the core sample to sorb s o h tes.
NITROGEN PURGE EXTRACTION
activated carbon traps
Figure 12 (b). Apparatus to purge sorbed solutes from core sample and concentrate them on activated carbon.
29

with 2-ml of CS2. As a control, the same quantity of target compounds was also injected
directly into 2-ml ontrol were analyzed by
GC as described in a previous section.
Sz. Both the carbon trap extract and t
One of the advantages of g the carbon trap technique for measuring contaminants
in the vapor ph is that samples can b ored before extraction and GC analysis.
However, the possibility of desorption of vol organic compounds during storage was of
concern. The five target compounds were to carbon traps as described for recovery
experiments (desorption into 1 ml of CS2). gh traps were prepared to have duplicates
for analysis after storage periods of 1,3.5,6.5,10, and 15 days at two different temperatures
(-13°C and 27°C).
Figure 13 shows the laboratory experiment devised to determine the sorptive charac-
teristics of the carbon trap (100 mg) used in the field vapor-phase sampler. A vapor was
generated from a 100-ml sample of unleaded gasoline or mixtures of several target com-
pounds by purging with zero-grade air in a 500- ml, glass washing bottle. This simulated
the maximum concentration of target compounds that the trap would be exposed to in
field applications, because the vapors were produced from organic solvents undiluted with
water. The vapor flow was directed to the carbon trap or to a fume hood. Flow rate was
adjusted to match (47 cm3/min) that anticipated for the field sampler. Vapor samples
were taken over time at the exit of the carbon trap using a gas-tight syringe to measure
breakthrough of sorption kinetics are slow or if equilib-
rim adsorptive target compounds could escape the trap
thus giving values of M,ol in Equati at are too low for the actual concentration being
measured. The samples d e am of the trap were injected directly
into the GC for identification by retention time and quantification by standard procedures
for calibration.
30

S Y R I N G E t CARBON YR
VENT
AP
Figure 13. Laboratory apparatus used to determine the adsorption characteristics of the carbon trap.
31

FIELD INVESTIGATION
SITE DESCRIPTION
The study site is a gasoline station located at Camp Lejeune in Onslow County east
of Jacksonville, North Carolina. It is known as the Tarawa Terrace site. The geologic
units that water-supply aquifers in the area are: a surficial unit, the Yorktown formation;
the Castle Hayne formation; the Beaufort formation; and the Peedee formation-units
formed by marine deposition, These and other sedimentary units are about 1,600-ft thick
in total in the Camp Lejeune area and are underlain by a basement complex of igneous
and metamorphic rocks (LeCrand, 1959).
The only sources of fresh groundwater at Camp Lejeune are the surficial unit and the
Castle Hayne formation. The Yorktown formation is not present in the Camp Lejeune
area, and the Beaufort, formations contain salty water there.
The surficial unit is composed of sands of sandy clay and shells. The Castle
Hayne formation is composed of semi- and com -consolidated limestones, shell beds,
sand, and minor amounts of clay. e formation is the most widely used
unit for water supply at Camp Leje thickness exceeds 300 feet in some
areas and typical yields for supply wells are 200-250 gallons per minute (gpm). Specific
capacities of wells drawing from the Castle Hayne range fiom about 18-25 gpm per foot
of drawdown (LeCrand, 1960).
All sediments below the phreatic surface are completely saturated with water. The
phreatic surface lies within 10-20 feet of the land surface in most places and is found in the
sands of the surficial unit. Beds of clay and some marl tend to separate the more permeable
sand and limestone beds w ) that several artesian zones can occur. There is considerable
leakage of water between the zones where a significant hydraulic gradient occurs, due to
the fact that the clayey s are not completely impermeable and are
32

lenticular (LeGrand, 1959). The surficial aquifer unit is well connected with the Castle
Hayne formation.
The channels of the major streams of the area are cut into the surficial and Castle
Hayne units, and the water table and potentiometric surface are both higher than the
stream levels.
groundwater moves through them to the surface streams.
The streams are discharge areas for both these units in this area and
The gasoline station at Camp Lejeune is shown on the Figure 14. The character of
the geologic materials of the Tarawa Terrace area was summarized by LeGrand (1959) as
follows:
e €%om the land surface to a depth of about 50-60 ft, a white io light gray medium-
grained sand is the chief material.
0 Between depths of about 50-S5 ft one or more limestone beds occur. The limestone
varies in degree of hardness and is commonly less than 20-ft thick.
e Sand underlies the limestone zone and extends to a depth of more than 200 ft. The
sand varies from fine to very fine in grain size.
Various well driller reports, geophysical logs, and geologic reports concerning the area
have been collected and interpreted. These materials indicate that a clay layer extends
from the surface to 10-30 ft below the ground surface, followed by a medium-grained
sand mixed with varying amounts of clay, which extends to about 200-ft below ground
surface. A clay layer of approximately 15 ft in thickness is found below the sands. Also,
nconsistent clay stringer is found in the sands at about 95-ft below ground surface.
This lithology is in conflict with that noted above (Legrand, 1959) and will be assumed to
be more representative of conditions at the research site in question.
A soil survey conducted in 1923 indicates that most of the area is overlain by sandy
l o w , with patches of purer sands. The loams consist of at least 45% silts and clays and
extend at least 3-ft below the ground surface throughout the area (Juney et al., 1923).
The consistency of the loams and the amount of asphalt covering the research site suggest
33

Figure 14. Location of Tarawa Terrace site at Camp Lejeune, Jacksonville. North Car- olina.
34

that recharge from precipitation is small in the study area. However, the surficial-Castle
Hayne aquifer syste has been observed to rapidly respond to precipitation events- -
indicating recharge occurs readily in most locations in the Camp Lejeune area (informal
communication, North Carolina Geological Survey, 1988).
In the past, lateral groundwater flow in the surficial and Castle Hayne units in the
area has been controlled by water supply well withdrawals and by the boundary conditions
imposed by Northeast Creek. However, withdrawals from the water supply wells in the
area have been suspended since March 1987.
Discussion of the hydrogeology at the research site shall be restricted to the unconfined
surficial unit, which is most relevant to movement of any contaminants. At the site,
medium-grained sand lies beneath approximately 8 ft of sandy clay and extends to a depth
of at least 6G ft below the land surface (Industrial Maxine Services, 1985).
dwater flow in the surficial unit at the site is currently dominated by the cone
of depression created by a recovery system-shown by Figure 15. However, data collected
before the recovery effort began and during periods of pump shutdown indicate a slight gra-
dient in the southeast direction, toward the discharge area-Northeast Creek. Preliminary
results from aquifer tests performed in the suxficial unit at the site indicate transmissivities
of approximately 7,000 gal/day/ft (Industrial Maxine Services, 19S5).
The chronology of groundwater contamination and cleanup events at the Camp Leje-
une Tarawa Terrace site are summarized in Table 3. Figure 16 shows a contour map of
apparent product thickness measurements collected from the monitoring well network.
CORE SAMPLING
Subsurface core samples were collected during June 1987 when 16 additional moni-
toring wells were installed at the Tarawa Terrace site by private contract. The location
of these wells is depicted by Figure 17. Subsurface core samples were collected during the
drilling process according to a scheme shown by Figure 18. The sampling was accomplished
35

Data co l l ec ted 4 May 1987. mean sea leve l .
Contour interval in feet above
1 North a Monitoring Well
0' 30'
[-7 Scale:
Figure 15. Piezometric head distribution resulting from operation of the purge-well re- covery system.
36

Table 3. Camp Lejeune Contamination and Cleanup Event Chronology
Period
e Late 1940’s-1950’~
e 1950’s-Present
e 21 September 1985
e Late September 1985
0 January 9986
e 17 January 1986
e July 1986
e 23 July 1986
e September 1986-Present
e 10 December 1986
e December 1986-Present
e May 1987
Event
Gas station built and underground gasoline tanks installed.
Small leaks of product may occur.
4,400 gallon loss of premium unleaded gasoline occurs.
Leaking tank taken out of service.
Recovery system and 11 monitoring wells installed.
Recovery system begins operation. Monitoring of water lev- els and product thickness
Testing of recovered product reveals the product.
3,000 gallons and is taken
Recovery system continues to operate but with numerous periods of system shutdown due to equipment failures.
Remaining two underground gasoline tanks (unleaded) tested for leaks. No leaks are found in tanks, but delivery pipes from tanks to gasoline dispensers are found to be leaking.
onitoring wells begins.
Gas station closed to customers permanently.
All underground storage tanks excavated, and removed from the site.
37

Data c o l l e c t e d 4 May 1987. Contour in terva l i n f e e t of product th ickness .
Figure 16. Contour map of apparent product thickness measurements collected from the monitoring well network.
38

using the following procedure.
I, A hollow-stem, c ~ n t ~ ~ ~ ~ ~ s - ~ ~ h t auger w w used to drill to the desired depth.
2. A set of 3 brass sleeves (2.5-in diameter by 6-in long) was inserted into the sampler,
and the sampler was assembled by screwing the ends in place.
3. The split-spoon sampler was inserted into the hole and hammered down 1.5 ft into the
virgin material and removed. This yielded 3, 6-in long cores of subsurface material.
4. At each of the 16 locations sampled, one set of samples was obtained at 10-11.5 ft
below the ground surface by this procedure, and a s nd set of samples collected at
20-21.5 ft. These locations were selected to provid ange of depths that was above
the phreatic surface yet below the overlying clay layer. For each set of samples, the
upper two brass cores were immediately capped (intact) with polyethylene caps and
stored on ice. They were extracted at a later date in the laboratory by the nitrogen
purge method discussed in the laboratory methods section.
5. The lead core sampl e deepest sample-was used to collect three 20- to 50-g
subsamples. These subsamples were transferred to 40-ml Pierce vials. In order to
minimize volatilization losses, the vials containing the subsamples were filled with
distilled water so that there was no headspace, tightly capped, and stored on ice
for subsequent extraction by the ultrasonication method discussed in the laboratory
method section.
6. At wells A6, A7, and A9, 11 subsamples were taken from the bottom brass sleeve
in order to statistically evaluate the variability of the field samples analyzed by the
ultrasonication method.
Precautions were taken in the field to prevent cross contamination and loss of analyte.
AI1 glassware was acid washed, rinsed repeatedly with distilled water and dried at 105°C
before being used in the field. The brass sleeves and polyethylene caps were also washed
with hot water, distilled water, and dried at 105°C before use.
Several efforts were made to prevent cross contamination and volatilization losses.
39

Figure 17. Location of monitoring wells at Tarawa Terrace site at Camp Lejeune, Jack- sonville, North Carolina.
4 0

TARAWA TERRACE SAMPLING SCHEME FOR GASOLINE COMPONENTS IN AQUIFER MATERIAL
INTACT AND CAPPED FOR N 2 PURGE EXTRACTION. ICE%) LABELLED AS
.6" ' lNTACT AND CAPPED
FOR N 2 PURGE XTRACTION. ICED. LABELLED AS
U 0 L VIALS, TOPPED
WATER.tCEB. LAELLED A S ( . W u # ) 2 7 A
(WELL+)21 C
* OFF WKH DISTllLED
(WEUJC) 21B
Figure 18. Subsurface core sampling scheme.
41

Methylene chloride was used to rinse the split-spoon core sampler between sampling points
to further avoid cross contamination. The ultrasonication subsamples were topped off with
distilled water to prevent volatilization losses. Goodman (1985) had reported up to 95%
loss of PCE by storing the solids samples in a closed jw over a 1-wk period. However,
storing the spiked solid samples in an aqueous media and refrigerating showed no recovery
losses of volatile organic compounds over a period of 10 days. Samples were stored on ice
as soon as possible after eval from the aquifer.
VAPOR-PHASE SAMPLING
Sampling began by augering a 1 1/8-in pilot ole to 1.5 ft above the intended sampling
depth. The DGP was then'dropped into the hole and hammered the remaining distance.
After removing the inner rod and connecting to the sampling assembly, a flow rate of 47
cm3/min was used to collect a vapor sample. Sampling times during this investigation
s allowing for collection of from 2351,410 cm3 of vapor. The
traps were capped to await desorption and GC analysis in the laboratory. To prevent carry
over of contaminants from one sample to the next, the probe was rinsed with acetone after
each use and then purged with ambient air for 1-2 minutes. A total of 26 locations was
general area of the site as shown in Figure 17.
42

RESULTS.
LABORATORY RESULTS
Recoven of Contaminants from Cores
The h d protocol for the ultrasonication method outlined in the methods section and
shown schematically in Figure 9 was the result of the three slightly different laboratory
procedures investigated. A brief review of the recovery results from the initial and final
designs along with a description of the method evoIution is summarized below.
The initial ultrasonicat ion recovery experiments performed were extracted once with
combinations. Samples of 20 g of sand, which had been dried at 105°C
overnight were rehydrated with 5 ml of distilled water and spiked with the target com-
pound stock standard at levels of 8.5 pg/ml, 17 pg/ml, and 34 pg/ml. Recovery efficiency
was determined by computing mass recovered through C analysis-using an external
Calibration curve of the target compounds--and comparing to solute mass injected. The
external calibration curve w a s run with each set of standards and typically yielded corre-
lation coefficients of >0.999.
tion experiments U-I and U-PI used milar procedure-a 1:l acetone:pen-
ure, and 50% of maximum output of the 508 watt ultrasonic horn for
U-I, while 100% of maximum output was used for U-2. The results are listed in Table 4.
Due to low recoveries in experiments U-I and U-11, experiment U-111 used a 1:l ace-
tone:methylene chloride solvent pair in an attempt to increase the recovery of the target
compounds. The results are given in Table 4 and show that recoveries for this solvent pair
were much lower than the recoveries achieved with the acetone:pentane solvent pair.
The low solubility of octane in water (0.6 mg/l) and its high vapor pressure may have
accounted for the consistently lower recovery of this compound compared to the other
43

Table 4. Mass-Recovery Results by Ultrasonication
Spike Experiment Compound Concentration (mg/l) Recovery (%)
u-I Toluene 8.6 32 17.3 41 34.6 49
Octane 7.1 34 17.1 17 28.2 24
Et hylbenzene 8.6 27 17.3 50 34.6 49
m,p-Xylene 8.8 35 17.6 35.2
61 60
*Xylene 8.8 49 17.6 67 35.2 60
U- Toluene 7.3 28 Octane 9.1 16 Ethylbenzene 17.3 21 m,p-Xylene 17.6 25 *Xylene 17.6 37
u-I11 Toluene 17.3 26 Octane 19.1 9 Ethylbenzene 17.3 25
17.6 25 17.6 25
Toluene 87 106
Octane 111 53
17.3 83
17.6 113
Ethylbenzene 8.6 111
m,p-Xylene 8.8 101
44

target compounds. However, volatilization losses of the target compounds from the open
centrifuge bottle during the ultrasonication psoced
During experiments U-I, U-11, and U-111, the sonic horn was lowered directly into the
open sample in the centrifuge bottle, in order to provide greater contact with the sand-
solvent slurry. For experiment U-N, the acetone:pentane solvent pair was used, but the
ratio of acetone:pentane was changed to 3:lO. The sand was extracted an additional time
with 100 ml of pentane, and the centrifuge bottles were Teflon-stoppered, and placed in a
water bath equipped with a sonic horn-rather t h m direct open sonic disruption. Samples
were r& in duplicate, and the percent recoveries are shown in Table 4.
It is evident from the increased recoveries in experiment U-N that the changes in
the procedure reduced the loss of the target compounds. Sealing the samples reduced
volatilization losses, and placing the samples in an ultrasonication bath equipped with
a sonic horn, at 100% maximum output (500 watts) increased the number of samples
processed at one time from one to six. This modification alleviated concerns about the
sonic horn spreading contamination from sample to sample.
The development of the nitrogen purge protocol outlined in the laboratory methods
section followed a four-step evolution, similar to the ultrasonication procedure. In experi-
ment N-I, the final solution concentrations contained twice as much contaminant mass as
the initial solution after recirculating through the sand column for 48 hrs (see Figure 12
for description of apparatus). The target compounds had been spiked into the water at
50 p g / d (well below their solubility limit, except for octane). The initial spiked water
sample was taken after the 30 min stirring period. The data indicate that dissolution of the
target compounds took longer than the half-hour stirring period. The results are shown
in Table 5.
In experiment N-11, the initial solution was stirred for 1 hr before an aliquot was taken
€or analysis. A series of three activated carbon traps was added to the effluent of the purge
apparatus to determine if solute breakthrough was occurring. The results shown in Table
45

5. Mass-Recovery Results by Nitrogen Purge
Experiment Compound Phase Mass ( p g ) Phase Mass (pg) Recovered
N-I Toluene 26,918 48,677 - 2,180 _.
Octane 24,744 46,101 - 12,554 - m ,p- Xylene 23,148 19,980 3,168 1,177 37 0-X ylene 70,230 67,260 2,970 2,700 91
N-I1 29,640 23,350 6,290 4 84 8 19,990 17,900 2,090 629 30
o-Xylene 23,660 20,430 384 12
N-I11 Toluene 26,530 19,824 6,800 5,714 84 % Et hylbenzene 15,252 14,831 42 I 4,048 __.
m,p-Xylene 17,730 17,597 133 4,953 - o-Xylene 19,790 19,007 783 4,858 -
N-IV Toluene 32,846 23,075 9,771 10,099 103 Octane 900 < DL 900 612 , 68 Et hylbenzene 30,378 20,020 10,358 8,931 86 m,p-Xylene 33,244 21,324 11,920 10,676 87 o-Xylene 34,327 23,876 10,451 10,128 97

5 indicate that recoveries from this experiment were low. However, most of the solute was
retained on the first carbon trap and no target compounds were found on the third carbon
trap. Apparently, breakthrough was not responsible for the losses. The carbon traps were
wet from collected interstitial pore water from the sand core.
Even though no solute was measured on the third carbon trap, it was thought that
perhaps water was competing with the target compounds for sorptive sites on the traps, A
mixed train, consisting of two Tenax adsorbent traps, followed by three actitated carbon
traps, was employed in experiment N-111. Also, a heating tape was wrapped around the
brass core. The
data shown in Table 3 indicate recoveries greater than the mass added, except in the
case of toluene. Possibly, contamination of the glassware resulted in an artificially high
concentration. In any case, heating the sand core improved the desorption process. An
extraction was made of a 30-g sample of the smd after purging by the ultrasonication
method and only 0.18-1% of the target compounds remained on the sand.
It was operated at 60°C for the duration of the purge experiment.
The procedure for nitrogen purge experiment N-W was modified from experiment
N-111 in regard to aqueous sample preparation, heating tape temperature, and moisture
trapping. The initial aqueous solution was shaken vigorously for 10 min after spiking the
target solutes. The solution pvas then stirred for 10 min with a magnetic stirrer. The
temperature of the heating tape was raised to 1Bg)"C, and a separatory funnel was added
between the sand core and the carbon traps. The carbon traps had been chosen over
the Tenax tubes since most of the target compounds collected in experiment N-I1 had
passed through the Tenax tubes, and onto the carbon traps. Also, the Tenax tubes are
more expensive than the activated carbon tubes. The results of experiment N-IV shown
in Table 5 demonstrate the excellent recovery d e v e d with the find design.
Vapor-Samdinn Method Development
All of the target compounds were recovered in controlled experiments with solvent
47

extraction efficiencies approaching 100%. Therefore, no correction was necessary for mass
detected by 66: dtes solvent extraction.
The effect of carbon trap storage at -13°C and 27°C on recovery of the 5 target
compounds is shown in Figures 19 and 20, respectively. The mass (ng) of each target
compound measured after solvent extraction and injection into the GC did not change
appreciably over 15 days of carbon trap storage at either temperature.
Figure 21 shows the breakthrough of toluene, benzene and xylenes (0-, m- and p-)
present in gasoline. The concentration scale is normalized by the feed concentration, Co,
as determined at the start of the experiment. The ordering of adsorbability is apparent
from the shape and position of the breakthrough curves. Similar behavior was noted
when vapors from these compounds were generated using pure solvents instead of gasoline.
Toluene and benzene axe much more poorly adsorbed than the xylenes. Displacement
of weakly adsorbed components is apparent but further interpretation of the shape of the
cuxves is impossible because Co was not constant over time. The evidence for this anomaly
is the failure of the benzene and toluene breakthrough curves to reach C/Co = 1 as must
occur when sorptive capacity is exhausted. The results nevertheless suggested that the
best target compounds were xylenes because these did not breakthrough the trap in 40
min of sampling; toluene can also be measured accurately if sampling time is limited to
about 10 min.
The detection limit of the procedure was estimated to be 0.04 ppbv (parts per billion
by volume) based on a fiow rate of 47 cm3/minute and a sampling time of 30 min (the GC
detection limit is assumed to be 0.5 ng). This compares to 5 ppbv reported by Kerfoot
(1987) in vapor-phase sampling of chloroform using the direct injection technique. Evans
and Thompson (1986) reported a much lower detection limit (0.01 ppbv) for direct injection
(2-mI sample) of gasoline components; however, this requires a GC capable of measuring
70 picograms of the compound, a very low value for ensuring p
for petroleum hydrocarbons solute mixtures.
48

A 0
1 9 - 18 -
3 16 - 15 - 14 - 1 3 - 12 d’ 1 1 - 10 - 9 -
8 - 7 -
8 -
s - 4 -
S - 2 - 1 -
El
0 0
I I I I I I I I I I I 1 1 I
0
16 - 15 - 14 - 1 3 - 12 -’ 1 1 - 1 0 - 9 - 8 - 7 -
6 - 5 - 4 -
S - 2 - 1 -
0
8 0 c 0 0
LEGEND
Toluene 0 n-Octane A Ethylbenzene +- m,p-Xylene
o ! I 1 I I I I 1 I I 1 I I I I 1
4 6 8 10 12 1 4 16 0 2
Time - h a y
Figure 19. Effect of storage of carbon trap at -13°C.
LEGEND
(J Toluene/ TMP 4) n-Octane A Ethylbenzene + m,p-Xylene
Figure 20. Effect of storage of carbon trap at 27°C.
49

c/co 2
1 8
1.a. 1.7
1.8
1 .Is
1.4
1 3
1.2 1.1
1
0 .9
O B 0.7
0 .6
0 5
0 . 4
0.3
0.2
0 . 1
0
0 20 4 0 60
Time - mlnutes
Figure 21. Breakthrough curves for target compounds fiom a gasoline vapor mixture.
50

FIELD RESULTS
Core Sampling and Extraction
Core smples were taken from 16 horizontal locations shown on Figure 17 where mon-
it.oring wells were installed (Al-A16). At each horizontal location samples were collected
from 10-11.5 ft and 20-21.5 ft below ground surface. However, due to the large number
of samples collected and the analytical effort ievolved in sample analysis, the analyses
performed were concentrated on wells closest to the leaking underground tank area-wells
A6 to'A13. Since many of the samples collected at 10 ft contained a significant portion of
clay, analytical preference was given to the 20 ft samples.
The target compound concentration results (pg/kg) of the nitrogen purge extractions
are shown in Table 6. It was anticipated (based on the laboratory study experiments) that
the nitrogen purge samples at 10, 10.5 and 20, 20.5 ft respectively would be replicates,
which could be compared to the ultrasonication results from the corresponding well and
depth. In addition, it was expected that the nitrogen purge samples would yield a more
representative measure of solute concentrations because of the large sample size. This was
not found to be the case. The duration of the 6eld sample collection, subsequent storage
for about 30 days, microbial degradation, and Volatilization of the target compounds were
attributed to the lower concentration obtained.
In general, target compound concentratiom increased slightly with a lower depth in
the aquifer, except where clay in the sample confounded the nitrogen purge method, or
where the split-spoon sampler delivered a core which was less than full. In the latter case,
volatilization losses are the most likely explanation for the low concentrations observed.
Although it was expected that the most heavily contaminated s
tained from wells A6, A7 and A9, it is possible that co tration around
those wells was reduced by the recovery system, which lies closest to A6, A7 and A9. As
can be noted from Table 6, target compound concentration levels dropped of€ to below
51

Table 6. Nitrogen-Purge Mass Recovery nom Field Samples
Depth To1 u ene Octane Ethylbenzene m,p-Xylene Well (ft) (Crglkg) (trglkg) (Crglkg) (Clg/kg)
06 10.0 8.5 1.4 2.2 10.5 12.3 <DL 0.9 9.0 20.0 24.5 1.1 3.1 9.4 20.5 55.1 1.8 3.6 28.3
07 10.5 2.4 1 .o <DL 3.7 20.0 54.5 1.5 4.6 30.3 20.5 7.4 1.8 0.6 6.8
08 10.0 28.3 0.6 1.0 7.4 20.0 18.0 <DL 0.8 5.5 20.5 36.6 <DL 2.4 15.3
09 10.5 4.2 <DL <DL 8.3 20.0 <DL <DL <DL 5.3 20.5 .9 <DL 1.3 10.2
09A 10.0 2.1 <DL 0.6 6.6 10.5 12.2 <DL 0.4 7.2 20.0 2.2 <DL <DL 10.8 20.5 7.5 <DL 0.4 7.4
10 20.0 66.8 1 .o 3.5 19.8 20.5 46.2 1.2 4.2 24.4
11 20.0 11.6 <DL <DL 6.5 20.5 83.7 1.2 7.3 9.8
12 20.0 21.7 1.3 5.3 42.4 20.5 57.5 <DL 3.8 19.8
13 20 .o 0.9 1.3 13.7 20.5 0.8 .3
14 .O 0.4 <DL 15.0 20.5 1.8 <DL <DL 7.3
15 20.0 L <DL 3.3
52

detection levels at a distance of 70-90 ft &om the site of the leaking underground tanks
(A14, A15, and A16).
During the extraction of the sample cores by the nitrogen purge method, the sample
water collected in a separatory funnel, which was placed in line between the sample core
oven and the carbon traps. In this way, most of the moisture associated with each discrete
core was trapped, and measured at the conclusion of the extraction. Table 7 charts the
volume of water present in each core analyzed and the corresponding target compound
concentrations. These results generally indicate that as the moisture content increased, so
did the concentrations of toluene md mpxylenes. Octane and ethylbenzene were below
detection levels in many cases.
Table 8 lists the results of the 20-50 g subsamples which were extracted by the ultra-
sonication method. In the cases where 8-11 subsamples were taken, the mean was used as
the target compound concentration (uglkg) for that location. According to these results
the maximum target c ound concentrations are around A6, A7, A8, and A9 and start
to drop off to the southeast of those wells.
If the ultrasonication method concentration data are compared with the nitrogen purge
data, it is evident that the concentrations were within the same order of magnitude, but
the nitrogen purge concentrations were generally lower. Also significant is that the points
at which the highest contaminant concentrations occurred were different. The maxima
points would probably have been in more agreement had not clay caused a problem with
wells A7 and A9 nitrogen purge samples. Figure 22 shows a comparison of the results for
the two extraction methods for analyses performed on samples coUected between 20-21.5
ft below ground surface.
In an effort to determine the precision of the ultrasonication extraction method at the
field scale, 8-11 subsamples from the 21 ft sample were taken from A6, A7, and A9. The
sample results from A6 were widely variable due to water contamination of the ultrasonic
solvent-solvent extraction process and resultant analyte losses and emulsions. However,
53

Table 7. Comparison of Target Solute Concentrations and Moisture Content for Sam- ples Analyzed Using the Nitrogen-Purge Method
Sample Water Toluene Octane m,p-X ylene Well Depth (ft) Content (ml) (pg/kg) (pg/kg) ( P d k d
06 10.0 33 8.5 0.8 2.2 10.5 42 12.3 <DL 9.0 20.0 40 4.5 1.1 9.4 20.5 60 5.1 1.8 28.3
- - - 07 10.0 115 10.5 75 2.4 1 .o 3.7 20.0 60 54.5 1.4 30.4 20.5 48 7.4 1.8 6.8
09 10.5 25 4.4 <DL 8.3 20.0 10 <DL <DL 5.3 20.5 40 14.9 <DL 10.2
09A 10.0 63 2.1 <DL 6.6 10.5 50 12.2 <DL 7.2 20.0 - 2.2 <DL 10.8 20.5 28 7.5 0.6 7.4
14 20.0 33 2.4 0.6 15.0 20.5 10 1.8 <DL 7.3
DL Detectable Limit
the results fiom A7 and A9 were more informative and are shown in Table 9. Toluene,
ethylbenzene, and m,p-xylene, vaxied approximately 10% from the mean concentrations of
the samples that were analyzed, indicating that the ultrasonication method of extraction is
a reliable procedure for analyzing volatile organic analytes fiom natural solids, even after
a storage period of about 45 days. The octane concentration results were more variable in
these same samples, and octaxie’s high volatility is a possible explanation of the variability.
54

Table 8, Target Solute Concentrations fiom Ultrasonic Analysis of 20-g Field Samples Collected at Depth of 21 Feet Below Ground Surface
-~
06 32.5 82.8 <DL 24.2
07 23.2 86.4 17.4 105.2
08 50.8 23.6 <DL <DL 09 60.2 97.4 <DL 205.4
09.5 31.2 88.5 12.4 35.8
10 37.4 84.0 <DL 76.45
12 19.3 52.7 '88.1' <DL
13 24.8 39.5 168.4 28.0
14 <DL <DL <DL '132.0" 15 10.9 60.0 <DL <DL
DL Detectable Limit " Potential Interference
Vapor-Phase Sampling
The tip of DGP was ven below the clay layer to obtain vapor samples; depths
ranged from 6.5-11.5 ft. The vapor concentrations of each target compound were added
together to produce a utotd" concentration for mapping the extent of contamination at
the site.
The contour Iines of "total" vapor concentration, expressed in logarithmic units ob
t compounds per liter of vapor, axe presented in Figure 23. Contour lines
were obtained by interpolating the total concentration data obtained at each of 26 sampling
locations (sampling Iocations are shown on Figure 23), using a commercial universal k@ng
and plotting that assumes zb linear variogram (Surfer, Golden Software). Data presented
55

2.8
2.4
2.0
7.6
1.2
0.8
0.4
0.0
2 -0.4 -0.40 0.0 0.4 0.8 1.2 1.6 2.0 2.4 2.8
Ultrasonication, Log concentration (ug/kg)
Figure 22. Comparison of nitrogen purge and ultrasonication analyses for samples col- lected between 20-21.5 ft below ground surface.

Table 9. Comparison of Concentrations €+om Multiple Ultrasonication Analyses Per- formed on Samples Collected at 20.5 Feet Below Ground Surface.
-~
Toluene Qctane Ethylbenzese m,p-Xylene Sample (tcglkg) ( d k d (Pg/kg) (f%/kg)
. US721a 24.6 126.8 17.0 112.6 US721b 25.6 96.4 13.3 - US721e 24.2 72.8 19.7 104.6 US721f 28.4 78.6 13.9 96.3 US721g 22.5 89.4 14.3 97.2 US721i 19.5 74.4 16.9 112.1 US721j 21.8 78.8 15.1 104.5 US721k 18.9 74.2 15.9 108.8
23.2 86.4 15.8 105.1 U 2.9 17.1 2.1 6.1 - z
US921a us921c US921d US921e US921f us921g US921h US921i US921k US9211
59.7 74.7 57.3 57.2 60.3 57.1 66.8 63.6 52.3 57.7
59.2 124.4 100.9 90.5 112.1 86.2 121.6 87.0 61.8 130.0
<DL <DL <DL <DL <DL <DL <DL <DL <DL <DL
187.3 170.3 215.4 186.7 139.7 123.5 231.7 248.6 182.9 173.1
60.2 97.4 - 190.9 B 6.3 23.7 - 30.6 - 5
DL Detectable t
57

in Figure 23 were obtained on three different sampling days over four months, so there is
10, samples taken from several locations at the beginning and end of the study did show
variations in concentration of individual target compound concentrations ranging from -74-
+349%. In addition to experimental emor of the sampling method, the recovery operation
and movement of the NAPL may have influenced these results. The fact that the contours
were in a circular pattern suggests idhence from the cone of depression created by the
recovery wells.
Tabie 10. Temporal Variation in Contaminant Concentrations Expressed as Percent Change Between 1 April 1987 and 18 June 1987
~~ -~~ -~ ~
Sample Location Toluene Octane Ethylbenzene m,p-Xylene *Xylene
~~ ~~
C -22% -30% -23% -4% +22%
D +43% -74% -65% +343% -1% F +4% +122% +SO% +95% +39%
While there is some error in time averaging of the target compound concentrations,
the contour intervals in Figure 23 are broad enough to still have meaning. These contours
ions ranging from 10,000 pg/l near the un und storage tank to less
than 10 pg/l of vapor about 150 ft away &om the tank. The area of Figure 23 shows
the region where a NAPL layer exists on top of the phreatic surface-as interpolated from
measurements taken from nine monitoring wells-lies within the region of highest vapor-
phase solute concentration. High vapor-phase concentration was expected here due to
vertical diffusion of gasoline components from the NAPL. As important, however, was the
measured amount of gasoline-origin solutes found in the vapor-phase in regions beyond the
58

Figure 23. Estimated, vapor-phase concentration distribution based OR 26 discrete mea- surements and universal kriging interpolation.
59

NAPL. This could be due to: (1) horizontal diffusion of vapor and (2) vertical diffusion
from contaminated groundwater,
Evidence for vertical diffusion of vapor is presented in Figures 24-27. A series of four
sampling hoIes, designated collectively as BB in Figure 23, was drilled within a 6-ft diam-
eter. Measurements of toluene (Figure 24), octane (Figure 25), ethlybenzene (Figure 26),
m,p xylene (Figure 27) and 0- xylene (Figure 28) were then made at three different depths
at each hoIe. There was considerable variability in concentration among the four sampling
her explanation for this pattern,
however, is that more biodegrad
0 8 10 '2 .. . .
oeptn- fret
Figure 24. Toluene concentration BS a function of depth for the 4 BB sampling locations.
60

Octane
SI RD- 2 o R D - 4
0 RD- 1
Figure 25. Octane concentration as a function of depth for the 4 BB sampling locations.
2.0
28
26
24
22
20
H 1 8 ?E : 98
3 12
. V 14 z
a 10
Figure 26. Ethylbenzene concentration as a function of depth for the 4 BB sampling locations.
61

m,p-Xylene . ,
+ u RD- 2
0 ED-4 0 R D - 2
- lRP3 eg:1
0 RD- I: om-2 / 0 R D - I
g R D - 3 RD- 4
0 RD- 1
I I I I I
* 70
- 10 1s - 18 - 17 - 16 - 13 - 14 7
50
10
1 0
0
o R D - 2 RD- 4 B RD-2
13 - 12 11 - 10 -
B - 8 -
. ? -
5 - a -
4 -
Figure 27. I m- and p-xylene concentration as a function of depth for the 3 BB ling locations.
0-Xylene
3 - t - 1 -
0
li
0 Rb-1
I I 1 I I
RD-3
RD- I
a RO-4 . .
6 a 10 12
oeptn- faat
Figure 28. Total o-xylene concentration as a function of depth for the 4 BB sampling locations.
62

SOLUTE PARTITIONING
Notions of equilibrium partitioning can be used: to assess the distribution of the
target solute among the phases present-vapor, aqueous, and solid; and to compare the
results obtained from core total-mass measurements to vapor-phase measurements. Such
evaluations require information about the relative fractions (mass and volume) of each
phase, the assumption of equilibrium among phases, and knowledge of the equilibrium
partition coefficients between phases. It can be shown that two solute partition coeffi-
cients ‘are sufficient to predict the equilibrium phase distribution. A possible choice for
these coefficients is Henry’s constant ta describe aqueous-vapor phase equilibrium, and an
aqueous-solid phase partition coefficient. The former is readily available in the literature,
while the latter requires measurement or reliance on relatively rough empirical methods of
prediction.
An analysis of the fraction of each ta.rget compound found in the vapor-phase is given
in Table 11. These fractions were calculated &om vapor-phase and combined solid-, vapor-
and aqueous-phase measurements taken at locations MW3, MW7, and MW8 that are
shown in Figure 23. The mass of any target compound in the vapor phase is:
(2)
where Cv is the concentration (pg/M3) in the mpor phase; eul %he fraction of voids filled
with vapor phase (0.24 has been estimated based on field measurements); and VT is the
total unit volume of solid, vapor and aqueous phases (1 M3 assumed in Table 11). The
total mass, MT) in all three phases is calculated &om measurement of mass in the soil
sample:
63

where CT is the concentration (pglkg) of the target compound per dry weight of soil; pa,
the density of dry soil (2.65 g/cm3) and e? the void fraction (estimated as 0.35 from field
measurements). Thus, the fraction, F, of target compound found in the vapor phase is:
The maximum possible value of F is unity when all of the target compound is in the
vapor phase. However, Table 11 shows that four values larger than unity were obtained.
These -anomalous values occurred because F is calculated from two independent experi-
mental measurements-one of the vapor phase directly and the other of the soil sample
(including the vapor phase). The value of F for any given target compound was highest
at M w 3 , which is located within the NAPL region; MW7 and MW8 are both outside the
NAPL region. However, the amount of each contaminant found in the soil samples yias
about the same, regardless of the sampling location. This suggests that while the vapor
phase may contain the largest fraction of the contaminant within an existing NAPL, it
does not rule out the presence of contaminants in the solid and aqueous phases outside the
NAPL.
The distribution of target compounds between vapor phase and underlying ground
water at these Same sampling locations is given in Figure 29. Henry’s law describes the
equilibrium distribution as:
C, = KHC, (4)
where C, is the ground-water solute concentration; K H , the Henry’s constant; and Cv, is
as defined previously. Logarithmic transformation gives:
64

- - e - " -
" 5 ..
!
. C .
65

a.J VI 0 r; n,
;s 3 a
Toluene/TMP 0 Ethylbenzene A m,p-Xylenes 0 +Xylene
MW8
MW 8
MW8 0 MW8 1 I
I I I 1 I 1 1 1 i I I 1 1 1 1 1 1 1 i 1 I 1 I l l l l 1 I 1 I I I 1 ' 1
1 10. IO 10 10 Ground Water Concentration (ug/l water)
Figure 29. Relationship between vapor-phase and groundwater concentrations for target compounds (in duplicate) at each monitoring well. Solid lines are equilibrium predictions based on Henry's law.
66

The solid lines in Figure 29 are the resulting predictions of this relationship for each of
the target compounds using literature d u e s of KH ( L p
Duplicate measurements of ground- water solute concentration were made for each vapor
phase solute concentration measurement. Most of the data were fairly close to equilibrium
predictions, although the logarithmic scdes in Figure 29 may distort the extent of agree-
ment in some instances. The most notable discrepancies from equilibrium predictions were
for ethylbenzene (at MW7), m,p xylene (at MW8) and o-xylene (at MW7). As shown in
Figure 23, these monitoring wells were located
within the NAPL region.
6’7

REFERENCES
Chiou, C.T. and T.D. Shoup (1985), Soil Sorption of Organic Vapors and Effects of Hu- midity on Sorptive Mechanism and Capacity, Environmental Science & Technology, Vol. 19, pp. 1196-1200.
Colenutt, B.A. and D.N. Davies (1980), The Sampling and Chromatographic Analysis of Organic Vapours in Landfill Sites, International Journal of Environmental Analytical Chemistry, Vol. 7, pp.223-
Colenutt, B.A. and S. Thorbum (1980), Optimization of a Gas Stripping Concentration Technique for Pace Organic Water Pollutants, International Journal of Environmental Analytical Chemistry, Vol. 7, pp. 231.
Dietz, W.A. (1967), Response Factors for Gas Chromatographic Analyses, Journal of G a s Chromatography, Fe b N ary.
Eklund, B.M. and C.E. Schmidt (1983), Review of Soil Gas Sampling Techniques, In: Soil Gas Sampling Techniques of Chemicals for Exposure Assessment, Radian Corporation, Interim Report, EPA-EMSL 68-02-3513, Work Assignment 32.
EkIund, B. M. (1985), Detection of Hydrocarbons in Groundwater by Analysis of Shallow Soil Gas Vapor, American Petroleum Institute Publication Number 4394.
Evans, O.D. and G.M. Thompson (1986), Field and Interpretation Techniques for Delineat- ing Subsurface Petroleum Hydrocarbon Spills Using Soil Gas Analysis. In the Proceedings of the NWWA/API Conference on Petroleum Hydrocarbons and Organic Chemicals in Groundwater-Prevention, Detection and Restoration, Houston, Texas, November 12-14, pp. 444-455.
Goodman, N. L. (1985), Evaluation of Methodology for Analysis of Organic Contaminants in Soil, Master of Science Technical Report, University of North Carolina at Chapel Hill.
Grimalt, J. C., C. M d , and J. Albaighks (1984), Analyses of Hydrocarbons in Aquatic Sediments, International Journal of Environmental Analytical Chemistry, Vol. 18, pp. 183- 194.
Hamilton, S.E., T.S. Bates, and J.D. Cline (1984), Sources and Transport of Hydrocarbons in the Green-Buwanish River, Washington, Environmental Science & Technology, Vol. 18(2), pp. 72-79.
Hansch, C. and A. J. Leo (1979), Substituent Constants for Correlation Analysis in Chem- istry and Biology, Wiley-Interscience, NY, 339 pp.
68
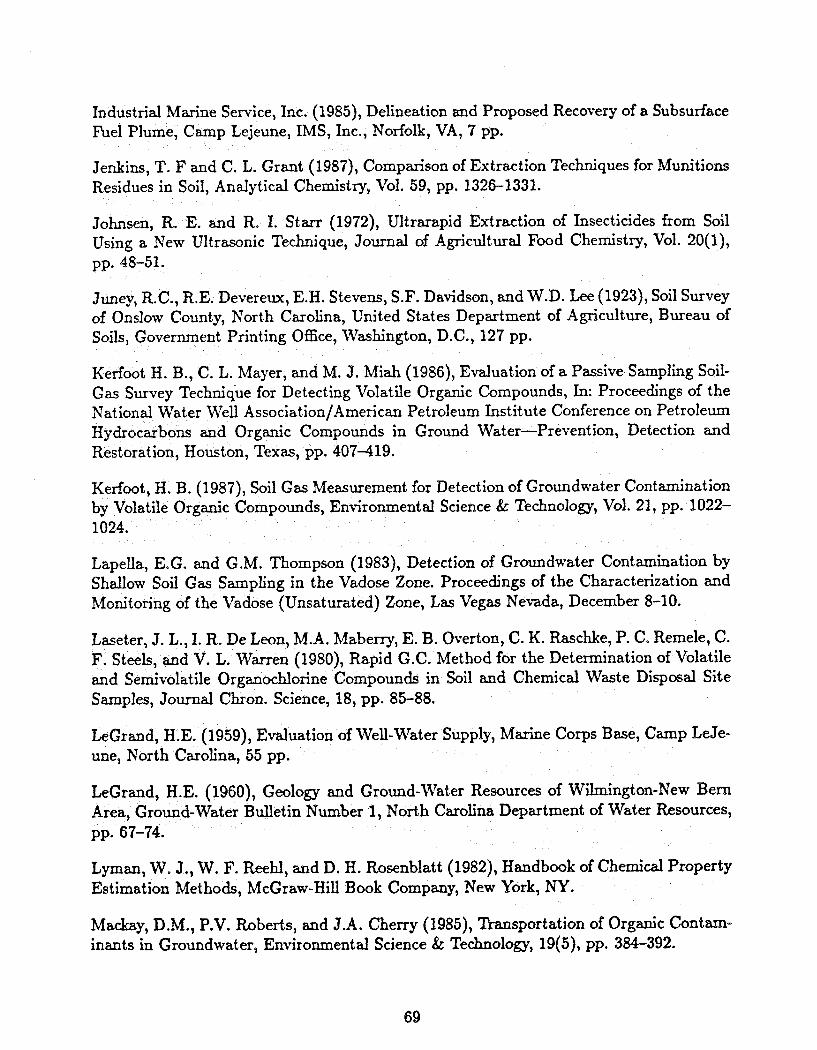
Industrial Marine Semice, Inc. (1985), Delineation and Proposed Recovery of a Subsurf'ace Fuel Plume, Camp Lejeune, IMS, Inc., Norfolk, VA, 7 pp.
Jenkins, T. F and C. L. Grant (1987), Comparison of Extraction Techniques for Munitions Residues in Soil, Analytical Chemistry, Vol. 59, pp. 1326-1331.
Johnsen, R. E. and R. I. Starr (1972), Ultrarapid Extraction of Insecticides from Soil Using a New Ultrasonic Technique, Journd of Agricultural Food Chemistry, Vol. 20(1), pp. 48-51.
Juney, R.C., R.E. Deverewc, E.H. Stevens, S.F. Davidson, and W.D. Lee (1923), Soil Survey of Onslow County, North Carolina, United States Department of Agriculture, Bureau of Soils, Government Printing Office, Washington, D.C., 127 pp.
Kerfoot H. B., C. L. Mayer, and M. 9. Miah (1986), Evaluation of a Passive Sampling Soil- Gas Survey Technique for Detecting Volatile Organic Compounds, In: Proceedings of the National Water M7ell Association/American Petroleum Institute Conference on Petroleum HY d Organic Compounds in Ground Water-Prevention, Detection and Restoration, Houston, Texas, pp. 407-419.
Kerfoot, H. B. (1987), Soil Gas Measurement for Detection of Groundwater Contamination Organic Compounds, Environmental Science & Technology, Vol. 21, pp. 1022-
Lapella, E.G. and G.M. Thompson (1983), Detection of Groundwater Contamination by Shdlow Soil Gas Sampling in the Vadose Zone. Proceedings of the Characterization and Monitoring of the Vadose (Unsaturated) Zone, Las Vegas Nevada, December 8-10.
Laseter, J. L., I. R. De Leon, M.A. Mabeny, E. B. Overton, C. K. Raschke, P. C. Remele, C. F. Steels, and V. L. Wanen (1980), Rapid G.C. Method for the Determination of Volatile and Semivolatile Organochlorine Compounds in Soil and Chemical Waste Disposal Site Samples, Journal Chon. Science, 18, pp. 85-88.
LeGrand, H.E. (1959), Eduat ion of Well-Water Supply, Marine Corps Base, Camp LeYe- une, North Carolina, 55 pp.
Grand, H.E. (1960), Geology and Ground-Water Resources of Wilmington-New Bern Ground-Water Bulletin Number 1, North Carolina Department of Water Resources, -74.
Lyman, W. J., W. F. Reehl, and D. H. Rosenblatt (1982), Handbook of Chemical Property Estimation Methods, McGraw-Hill Book Company, New York, NY.
Madray, D.M., P.V. Roberts, and J.A. Cherry (1985), Tkansportation of Organic Contam- inants in Groundwater, Environmental Science & Technology, 19(5), pp. 384-392.
69

Neglia, S. and L. Faveratto (1962), Study on an Analytical Method for the Execution of Surface Geochemical Prospecting for Petroleum and Natural Gas, Proceedings of the International Meeting on Advances in Organic Geochemistry, hfilan, Italy. Vol. 15 pp. 285-295.
Nunez, A.J., L.F. Gonzalez, and J. Jan& (1984), Preconcentration of Headspace Volatiles for 'Ikace Organic Analysis by Gas Chromatography, Journal of Chromatography, Vol. 209, pp. 128-163.
Petersen, J. C. and D. H. fieeman (1982), Method Validation of GC-MS-SIM Analysis of PthaIates, International Journal of Environmental Analytical Chemistry, Vol. 12, pp. 277-291.
Radian Corporation (1984), Soil Gas Sampling Techniques of Chemicals for Exposure Assessment, Bonifay Spill Site Data Volume. EPA-EMSL 68-02-3513, Work Assignment 32.
Schwille, F. (1967), Petroleum Contamination of the Subsoil-A Hydrological Problem, The Joint Problems of the Oil and Water Industries, P. Hepple, ed., Institute of Petroleum, London, 1967, pp. 23-54.
Sfater, J.P., F.R. Mclaren, D. Christenson, and D. Dineen (1983), Sampfing and Analysis of Soil for Volatile Organic Compounds: I. Methodology Components, Proceedings of the RTWWA/US-EPA Conference on the Characterization and Monitoring of Vadose Zone, pp. 623-58.
Sun, M. (1986), Ground Water Ills: Many Diagnoses, Few Remedies, Science, Vol. 232 pp. 1490-1493, June 20.
Swallow, J.A. and P.M. Gschwend (1983), Volatilization of Organic Compounds from Un- confined Aquifers. Proceedings of the 3rd National Symposium on Aquifer Restoration and Groundwater Monitoring, Columbus, Ohio, May 25-27, pp. 327-333.
Tang, S. (1986), Predicting Equilibria for Gas-Phase Adsorption of Volatile Organic Com- pounds: The Impact of Relative Humidity and Multi-Component Interations, Master The- sis, Michigan Technological University.
Thorburn, S., B.A. Colenutt, and S.G. D ass (1979), The Sampling and Gas Chro- matographic Analysis of Gases from Landfill Sites, International Journal of Environmental Analytical Chemistry, Vol. 6 pp. 245-254.
Verschueren, K. (1983), Handbook of Environmental Data on Organic Chemicals, Van Nostrand Reinhold Company, NY.
70

Voorhees, K. J., J. C. Hickey, and R W. Klusman (1984), Analysis of Ground Water Con- tamination by a New Surface Static Trapping/Mass Spectroscopy Technique, Analytical Chemistry, Vol. 56, pp. 2602-2604.
Weast, R. C., ed. (1986), CRC Handbook on Chemistry and Physics, 67th Edition, CRC Press, Inc., Boca Raton, FL.
71