water safety data; what are the figures telling us? holly henderson rospa research manager and...
Post on 19-Dec-2015
215 views
TRANSCRIPT

Water safety data; what are the figures telling us?
Holly Henderson
RoSPA Research Manager and Postgraduate of the
Department of Public Health and Epidemiology, University of Birmingham

Statistics Overview:• Accidental injury is a leading cause of death
and disability and by 2020 injury will be the largest single reason for the loss of healthy human life years (WHO 2001; Towner 2001).
• Drowning is the second leading cause of unintentional injury mortality globally behind road traffic injuries.
• WHO (2002) estimates globally that there are almost half a million drownings annually
• Global Fatality Rate of 7.4 per 100, 000• Historically the UK has published a drowning
fatality rate of 1.0 per 100,000


What new research has occurred in 2004?
• SAPC and the University of Strathclyde: Scottish Water Based Accidents: The development of an accurate database
• University of Wales College of Medicine: A retrospective study of childhood swimming pool drowning deaths in the UK and abroad
• SWIM Group: Bath Seat Study• University of Birmingham: An investigation into
the epidemiological surveillance of inland water incidents in the UK
• RYA: Entrapment Study

Scottish Water Based Fatalities: The Development of and accurate database
• Retrospective data collected from 1997 – 2003
• Four Data Sources• Data includes suicides, homicides, coastal,
offshore, inland and domestic fatalities• Number of Notifications – 1490 fatalities• Total after data linkage – 1116 fatalities• New data collected 2.5 times more fatalities
than previously known

SAPC and University of Strathclyde Results (1)
Year RoSPA / RLSS Database
SAPC Database
2003 67 165 (est.)
2002 66 173
2001 63 161
2000 64 156
1999 86 157
1998 93 182
1997 66 160
Mean 72 165

SAPC and University of Strathclyde Results (2)
0
2040
60
80
100120
140
160
1997 1998 1999 2000 2001 2002
Year
Num
ber
of d
row
ning
s
Male
Female
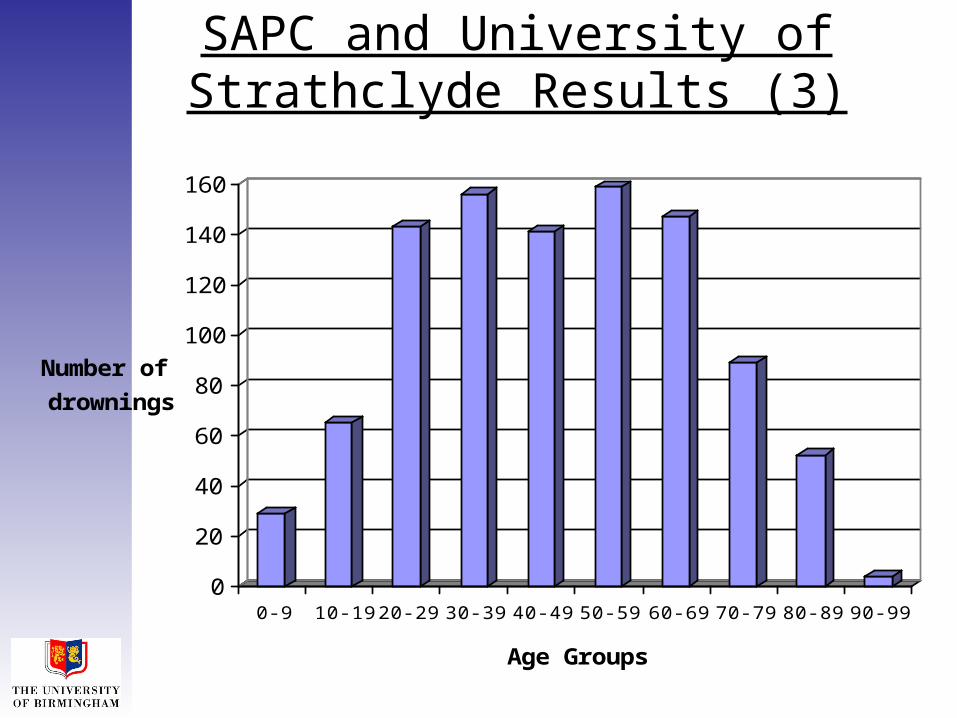
SAPC and University of Strathclyde Results (3)
0
20
40
60
80
100
120
140
160
Number of
drownings
0-9 10-19 20-29 30-39 40-49 50-59 60-69 70-79 80-89 90-99
Age Groups

SAPC and University of Strathclyde Results (4)
0
20
40
60
80
100
120
Number ofDrownings
Jan Feb Mar April May June July Aug Sept Oct Nov Dec
Month

Research Summary
• Over 100 additional drownings reported annually• Males accounted for 80.5%• Age groups of concern: 35 – 39 (8.6%) and 55-59
(8.3%)• Drownings peaked in August (10%)• 58.3% of fatalities at inland water locations• 33.4% land based activities, 27.7 on the water• Fishing accounted for 19.3%• 13.3% of fatalities in the Highlands Region• 34.1% intent undetermined, 26.1% no information
available• New rate of 3.2 per 100,000

A retrospective study of childhood swimming pool drownings in the UK
and Abroad
• Data sourced from 1993 – 2003
• Domestic, Private and Public Pools
• Total of 137 children (under 15) died
• 69.3% Males
• Average age 6.1 years
• Average of 12 per year
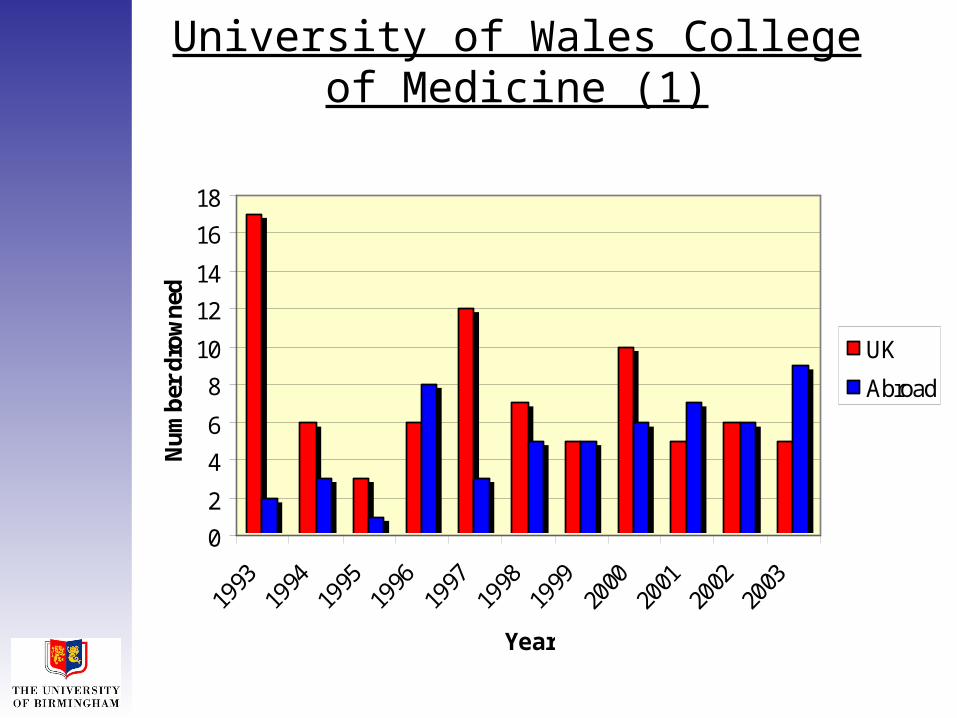
University of Wales College of Medicine (1)
0
2
4
6
8
10
12
14
16
18
Year
Nu
mb
er d
row
ned
UK
Abroad

University of Wales College of Medicine (2)
0
24
68
10
1214
1618
20
Month
Num
ber
drow
ned
UK
Abroad
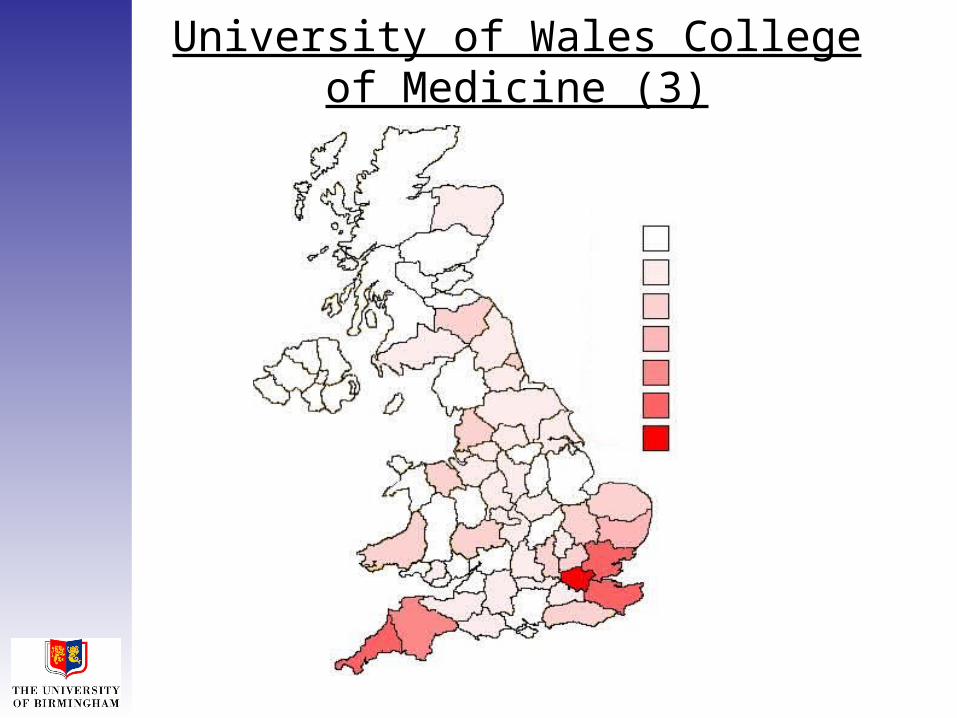
University of Wales College of Medicine (3)

University of Wales College of Medicine (4)
USA13%
France13%Spain
22%
Spanish Islands
25%
Other27%

Research Summary:
• Drowning in the UK:
– Starting to decline but age increasing
– Managing of Health and Safety of Swimming Pools
– Overhaul of Pool Life guarding
– Child Admissions Policy
• Drowning Abroad:
– On the increase
– Exposure
– ANEC Research 2005

Drowning of babies in bath seats:
• Children under the age of two
• Case Study of drowning and near drowning episodes from 1989 – 2003
• All males (n = 6)
• 5 under a year old
• Bath seats appear to give a false sense of security to parents
• Further research required to look at and address exposure to risk

An Investigation into the Epidemiological Surveillance of Inland
Water Incidents in the UK
• 2545 notifications• 2068 isolated incidents• Related to 2743 people• 89.4% (2453) rescued, 10.6% (290) died• 79.0% involved were male (7.6 per 100, 000)• 88.9% who died were male (0.9 per 100, 000)• Males had a 7.6 fold increased risk of dying at
an inland water location in the UK• Males had a 3.9 fold increased risk in needing
rescue at an inland water location in the UK
Gender and Age - Survivability
• Adults accounted for 80.8% of involvement and 88.6% of fatalities
• Teenagers had the highest population based rate of involvement (8.1 per 100, 000)
• Once involved in an inland water incident males were twice as likely to die
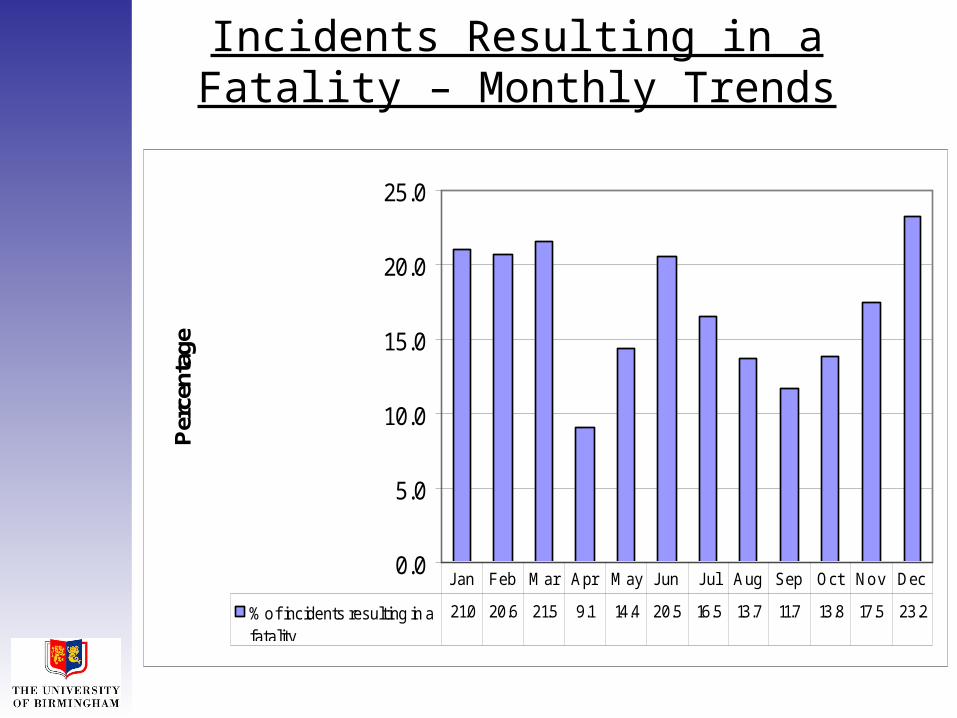
Incidents Resulting in a Fatality – Monthly Trends
0.0
5.0
10.0
15.0
20.0
25.0P
erce
ntag
e
% of incidents resulting in afatality
21.0 20.6 21.5 9.1 14.4 20.5 16.5 13.7 11.7 13.8 17.5 23.2
J an Feb Mar Apr May J un J ul Aug Sep Oct Nov Dec

Incident Start Time and Month by the Number of People Involved
00:0
0
01:0
0
02:0
0
03:0
0
04:0
0
05:0
0
06:0
0
07:0
0
08:0
0
09:0
0
10:0
0
11:0
0
12:0
0
13:0
0
14:0
0
15:0
0
16:0
0
17:0
0
18:0
0
19:0
0
20:0
0
21:0
0
22:0
0
23:0
0
JAN
FEB
MAR
APR
MAY
JUN
JUL
AUG
SEP
OCT
NOV
DEC
Time
Month
1-31 31-61 61-91

Incidents Resulting in a Fatality – Day of Week Trends
0.0
5.0
10.0
15.0
20.0
25.0%
% of incidents resultingin a Fatality
9.0 8.3 20.7 17.0 15.7 14.2 20.0
Sat Sun Mon Tue Wed Thu Fri
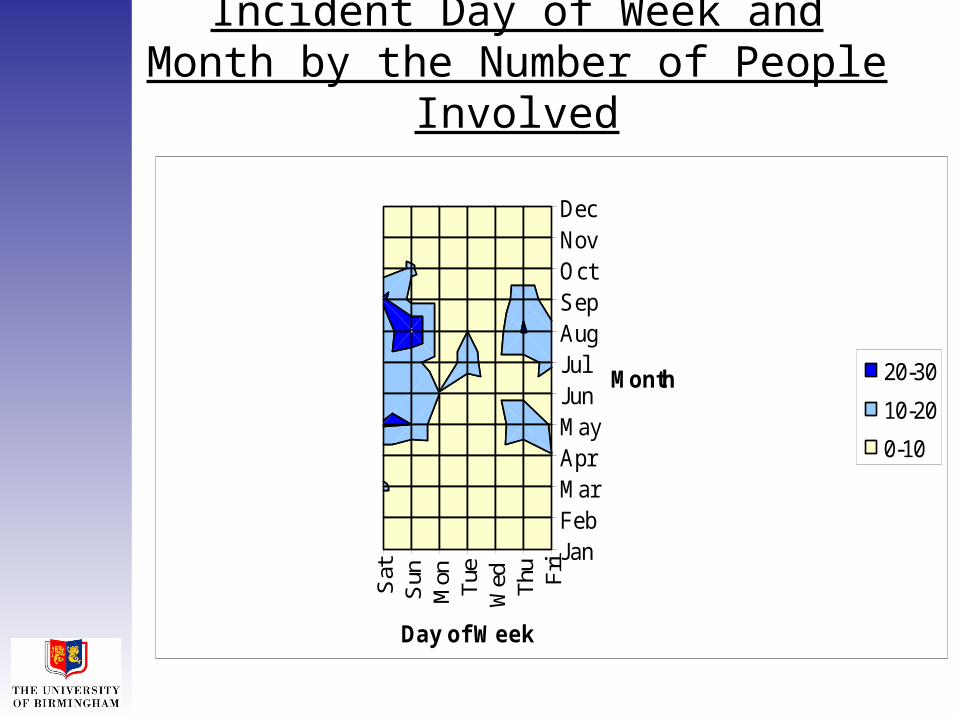
Incident Day of Week and Month by the Number of People Involved
Sat
Sun
Mon Tu
eW
ed Thu
Fri Jan
FebMarAprMayJunJulAug SepOctNovDec
Day of Week
Month 20-30
10-20
0-10
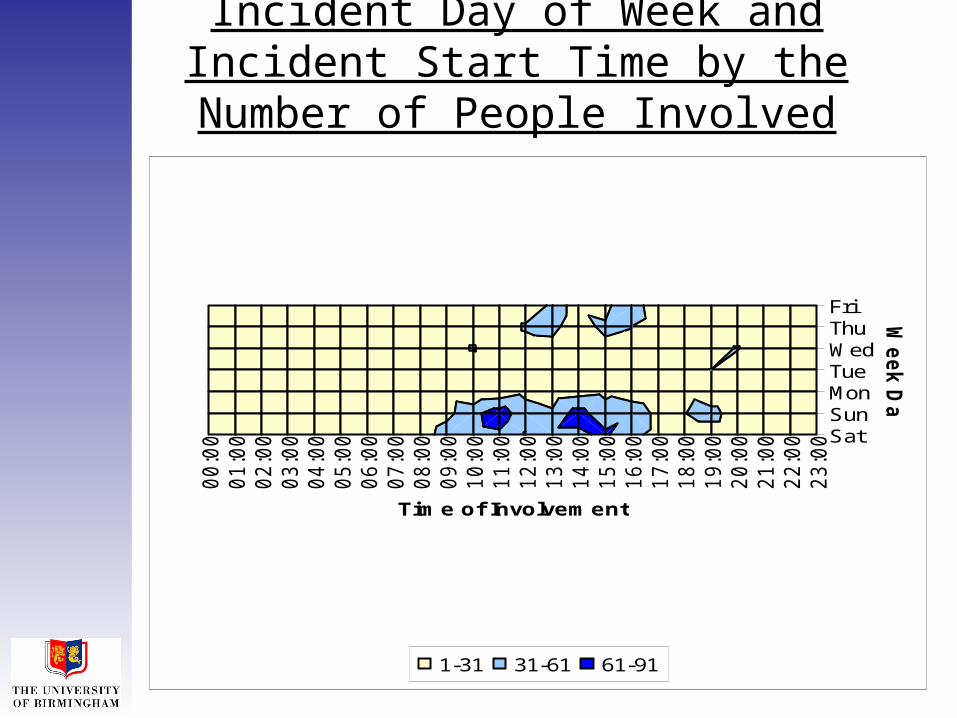
Incident Day of Week and Incident Start Time by the Number of People Involved
00:0
0
01:0
0
02:0
0
03:0
0
04:0
0
05:0
0
06:0
0
07:0
0
08:0
0
09:0
0
10:0
0
11:0
0
12:0
0
13:0
0
14:0
0
15:0
0
16:0
0
17:0
0
18:0
0
19:0
0
20:0
0
21:0
0
22:0
0
23:0
0 SatSunMonTueWedThuFri
Time of Involvement
Week D
ay
1-31 31-61 61-91

By Location
0
200
400
600
800
1000
1200
1400
1600
1800
Moving Water(River Stream)
Enclosed (LakeLough Loch)
Canal Ex Industrial(Quarry Pit etc)
Location
Num
ber
Incidents
People

By Activity
0 200 400 600 800 1000
BlankBoating
Row ing - SportOther
Not know nAngling
Involuntary AccessVoluntary Accees
Motor VehicleCommercial Fishing
Danger of Drow ningDiving
CanoeingClimbingAir CraftA
ctiv
ity
Number of People

Multivariate Analysis:
• Predictive model used by NHS and Public Health Specialists
• Considers factors associated and predictors• Model predicted 98.8% of outcomes of the
research
• LOGODDS = -1.827 – 0.590 * AGR (2) – 1.627 * AGR (3) – 1.474 * WKD (6) – 1.837* WKD (5) – 0.093 * WKD (4) - 0.016 * WKD (3) – 0.049 * WKD (2) – 0.599 GEN (1) + 1.655 * LT (2) + 3.968 * LT (1)

Research Summary:
• First time incident data analysed for the UK• Use of descriptive epidemiology• Capture Recapture Analysis (n = 228)• New use of relative risk, odds ratios and
multivariate analysis• Creates a new population based rate for
inland waters in the UK • Identification of Population most at risk• Provides a baseline for prevention and
intervention strategies through education and resource deployment

Entrapment Study:
• Study started in 2003
– Due to the public concern regarding the risk of getting trapped in inverted or partially inverted dinghy
– Well publicised “near misses”
• Process
– Logging entrapment incidents (Web Report)
– Discussions with major dinghy manufacturers
– Air gap tests
– Rescue Techniques
– Methods of Prevention

Incident Records:
• 44 incidents logged during 2003 and 2004
• 41% of these reported incidents were serious and a potential threat to life
• Biggest risk results from complete inversion of the boat with the sailor tangled or stuck underneath
• Probability of inversion occurring unaffected by conditions
• Major Factor - Speed of Inversion– Depends on design
– Capsizing to windward whilst sailing downwind
NWSF Information Group
Aim:• To bring together in one place, information and
research about incidents, casualties and fatalities in water
• Improve the quality of information and data available enabling it, for the first time, to develop strategies and policies based on statistics, analysis and research
Objectives:• To encourage the gathering, monitoring and
evaluation of drowning/incident data and relevant research
• To assess the need for intervention • To assess the need for better information and data
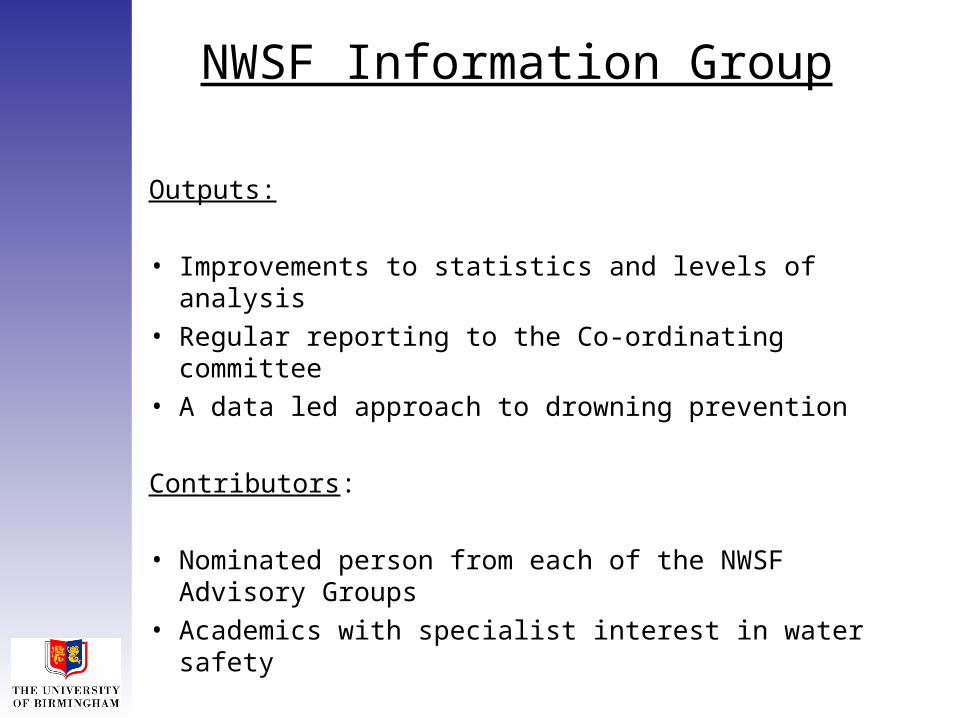
NWSF Information Group
Outputs:
• Improvements to statistics and levels of analysis• Regular reporting to the Co-ordinating committee• A data led approach to drowning prevention
Contributors:
• Nominated person from each of the NWSF Advisory Groups
• Academics with specialist interest in water safety

Finally:• Each of the research projects has brought new
valid and credible knowledge into the water safety community
• Collecting data routinely and the appropriate analysis is key to success– Organisational understanding of data and
statistical analysis– Dataset Development– Data Linkage Strategy– Reporting Mechanisms– Population based and risk based analysis– Development of a Hierarchy of Evidence
• The NWSF Information Group will help co-ordinate and facilitate research like this in the future