water scenarios for the danube river basin: future ... · assumptions and scenarios were defined...
TRANSCRIPT

1
Water scenarios for the Danube River Basin: future challenges and preparedness
EUR 30016 EN
A foresight study to inform
water management in the
Danube River Basin
Alberto Pistocchi, Laurent Bontoux,
Sara Rafael Almeida 2020

2
2018
This publication is a Science for Policy report by the Joint Research Centre (JRC), the European Commission’s science and knowledge service. It aims to provide evidence-based scientific support to the European policymaking process. The scientific output expressed does not imply a policy position of the European Commission. Neither the European Commission nor any
person acting on behalf of the Commission is responsible for the use that might be made of this publication. For information on the methodology and quality underlying the data used in this publication for which the source is neither Eurostat nor other Commission services, users should contact the referenced source. The designations employed and the presentation of
material on the maps do not imply the expression of any opinion whatsoever on the part of the European Union concerning the legal status of any country, territory, city or area or of its authorities, or concerning the delimitation of its frontiers or boundaries.
Contact information
Name: Alberto Pistocchi
Address: via E.Fermi 2749 – Ispra, Italy
E-mail: [email protected]
Tel.: +390332783658
EU Science Hub https://ec.europa.eu/jrc
JRC115635
EUR 30016 EN
PDF ISBN 978-92-76-14177-8 ISSN 1831-9424 doi:10.2760/134358
Luxembourg: Publications Office of the European Union, 2020
© European Union, 2020
The reuse policy of the European Commission is implemented by the Commission Decision 2011/833/EU of 12 December 2011 on the reuse of Commission documents (OJ L 330, 14.12.2011, p. 39). Except otherwise noted, the reuse of this
document is authorised under the Creative Commons Attribution 4.0 International (CC BY 4.0) licence (https://creativecommons.org/licenses/by/4.0/). This means that reuse is allowed provided appropriate credit is given and any changes are indicated. For any use or reproduction of photos or other material that is not owned by the EU, permission must
be sought directly from the copyright holders. All content © European Union, 2020
How to cite this report: Author(s), Pistocchi, A., Bontoux, L., Rafael Almeida, S., Water scenarios for the Danube River Basin: future challenges and preparedness. A foresight study to inform water management in the Danube River Basin; Luxembourg:
Publications Office of the European Union, 2020, ISBN 978-92-76-14177-8, doi:10.2760/134358, JRC115635.
All images © European Union, 2020, except Cover Image by Džoko Stach from Pixabay
Title Water scenarios for the Danube River Basin: future challenges and preparedness. A foresight study to inform
water management in the Danube River Basin
Abstract
We present the outcomes of a foresight study aimed at identifying the emerging challenges for water management
in the Danube region, considering a set of possible future socioeconomic and political scenarios. For each scenario,
we analyse the possible implications for key water management issues (wastewater treatment, diffuse pollution
and hydromorphological alteration). Based on this analysis, we identify possible no-regret actions to adopt in the
Danube region in order to improve water management in the long-term, along the three main lines:
1) Developing effective communities.
2) Basin-wide integration of the management of certain issues.
3) Bringing nature protection to the core of strategies.
Sharing and strengthening capacity at various levels of water management is a precondition to avoid
marginalization and impoverishment of regions within the Danube. Education of the youth in schools and
universities (including through student exchanges and harmonization of educational programmes) is essential to
create a more ecologically aware society.

3
"It is an emergency.
In order to survive as a species we need to define our utopia (…)
We have to imagine something that doesn't exist carve intentionally into the future
and demand space for hope (…)
let's imagine a world where nature and technology collaborate and make a song about it
(…) then move into it
(…) imagine a future and be in it."
Björk
Utopia Tour, 2018

4
Table of contents
Executive summary ............................................................................................ 7
List of abbreviations ......................................................................................... 12
1. Introduction ............................................................................................ 13
2. Setting the scene ..................................................................................... 16
2.1 Socioeconomic signals from the Danube countries ........................................ 16
2.2 Demography and land use ......................................................................... 18
2.3 Water resources and their use ................................................................... 18
2.4 Climate scenarios and implications for water resources ................................. 24
3. River basin management and policy making in the Danube region .................. 26
3.1 Policy and regulatory basis ........................................................................ 26
3.2 Status of water bodies .............................................................................. 26
3.3 Significant Water Management Issues ......................................................... 26
Organic pollution from point sources ............................................................. 27
Nutrients from point and diffuse sources ........................................................ 27
Hazardous substances from point and diffuse sources...................................... 28
Hydromorphological alterations..................................................................... 28
3.4 Objectives and measures of the DRBMP ...................................................... 28
4. Scenarios ................................................................................................ 29
4.1 Scenario 1 - Large scale coherence ............................................................ 32
Trajectories ................................................................................................ 33
Challenges ................................................................................................. 33
4.2 Scenario 2 - Tailor-made solutions ............................................................. 34
Trajectories ................................................................................................ 35
Challenges ................................................................................................. 35
4.3 Scenario 3 - Multinationals rule .................................................................. 36
Trajectories ................................................................................................ 37
Challenges ................................................................................................. 37
4.4 Scenario 4 - Small-scale interventions ........................................................ 39
Trajectories ................................................................................................ 40
Challenges ................................................................................................. 40
5. Implications of the scenarios for the Danube River Basin Management Plan ..... 42
5.1 Challenges for wastewater treatment: too small, too complex or only for the rich?
................................................................................................................... 42
5.2 Challenges with diffuse pollution: who cares? .............................................. 43
5.3 Challenges with hydromorphological water habitat restoration: good to have, but
just a little .................................................................................................... 45
6. Actions to improve long-term water management in the Danube River Basin ... 46
6.1 Developing effective communities .............................................................. 47

5
6.2 Basin-wide integration .............................................................................. 49
6.3 Nature conservation ............................................................................. 51
7. Development of capacities ......................................................................... 53
8. Concluding remarks .................................................................................. 57
References ...................................................................................................... 59
Annex 1 – Summary of the Danube EU Member States' socioeconomic conditions
(European Semester 2017) and shares of GDP accounted for by agriculture and industry
...................................................................................................................... 61
Annex 2 – Shares of employment in the Nomenclature of Territorial Units for Statistics
2 (NUTS2) regions in the Danube river basin ....................................................... 69
Annex 3 –Global Innovation Index (GII) and Environmental Performance Index (EPI) in
the Danube Countries, 2016 .............................................................................. 71
List of figures ................................................................................................... 77
List of tables .................................................................................................... 78

6
Acknowledgements
This report is based on reflections initiated at a workshop held in Budapest at the end of
October 2016, further described in Bontoux et al., 20181. All workshop participants are
gratefully acknowledged for their generous contribution.
JRC colleagues Bernd Gawlik and Ad de Roo are particularly acknowledged for their
contribution to the preparation of the workshop and for providing background knowledge
on water management and the quantitative simulation of scenarios of water resources in
the Danube region2, respectively.
The work is part of the JRC support to the European Strategy for the Danube Region
(EUSDR), under the “Danube Water Nexus” flagship cluster of activities. The definition of
scenarios (section 4 of this report) derives from a MSc thesis of Mr Augustin Gallot-Lavallee
at the Imperial College, London, in collaboration with the JRC. We wish to thank Augustin
for his contribution to this work.
The analysis of this report was developed mainly during the year 2017, and the starting
assumptions and scenarios were defined during 2016. Although the work does not
necessarily reflect a number of socioeconomic and geopolitical developments occurred in
the region, and Europe in general, in more recent times, the Authors have made all
possible efforts to keep the narrative up-to-date. Therefore, it is deemed that the
recommendations drawn from this work may retain their validity even under other
scenarios that may emerge in the near future.
We would also like to thank Lorenzo Benini from the European Environment Agency (EEA),
as well as JRC colleagues Fabio Farinosi and Julian Wilson, for reviewing this report and
providing very useful comments and suggestions.
Authors
This report was prepared by Alberto Pistocchi, Laurent Bontoux and Sara Rafael Almeida
of the JRC.
1http://publications.jrc.ec.europa.eu/repository/bitstream/JRC114803/jrc114803_danube_worksho
p_flash_report_online_final.pdf 2 A full report on this assessment can be found in Bisselink et al., 2018:
https://ec.europa.eu/jrc/en/publication/impact-changing-climate-land-use-and-water-usage-water-resources-danube-river-basin

7
Executive summary
Managing water resources effectively is not only vital to a sustainable development of the
European Union, but must also be at the core of the regional development agenda in all
its aspects.
The management of water resources cuts across the European Union Strategy for the
Danube Region (EUSDR), as it affects, and is affected by the societal, environmental,
economic, geopolitical and industrial dimensions of a river basin as complex as the
Danube’s.
This complexity creates strategic and policy challenges that are difficult to address. It
requires the mobilisation of knowledge from many sources and its integration into a
coherent understanding of the Danube River Basin system. The objective of this exercise
was to combine quantitative data with a qualitative foresight approach to explore possible
emerging issues and the associated threats and opportunities, propose actions to address
them and formulate recommendations for the future management of water resources in
the Danube River Basin.
Evidence on the Danube River Basin
Socioeconomic conditions of the Danube region:
The Danube region shows strong diversity in economic conditions, with EU Member States
generally in better economic conditions than countries which are not members. Member
States in the Upper Danube have markedly stronger economies than Lower Danube
countries.
Industry represents an important share of GDP for all Danube countries except Bosnia-
Herzegovina. Agriculture usually accounts for much less and tends to be inversely
correlated with GDP per capita.
The various EU regions within the Danube river basin have a share of employment in the
public administration of around 20%, with Hungary slightly above and Romania slightly
below.
Globally, the region is not an innovation leader, with the exception of Germany and, to an
extent, Austria. The business conditions in the region show some difficulties, related inter
alia to corruption.
Demographic projections based on current trends suggest that the Lower Danube may
witness a generalized reduction of population, with a stronger effect in non-EU Member
States. This trend is likely to be accompanied by a systematic ageing, where all EU Member
States of the Danube region expected to have 50% or more of their population above 65
years old by 2070.
Water resources in the Danube region:
The economic sector accounting for the largest share of water use is energy production
(44%). Domestic water use accounts for 13%, industry for 17% and food production
(agriculture and livestock) for 26%.
Water availability has important implications for navigation on the Danube River, as
transport is significantly affected by water levels. Evidence shows a connection between
water levels and transport prices, thus impacting the total volume of goods transported
and the degree of use of the available transport capacity.
About 50% of the surface water bodies do not achieve good water quality status yet, and
are unlikely to achieve it by 2021. The same can be said for some groundwater bodies.

8
The three significant water management issues (SWMIs) in the Danube are organic
pollution, nutrients and hydromorphological alterations. Chemical pollution is also a SWMI,
but knowledge about this issue is still building up.
According to the Danube River Basin Management Plan (DRBMP), untreated wastewater
represents 64% of the total biochemical oxygen demand (BOD) discharge in the Danube
river basin. Industry contributes with additional organic pollution in the order of 10% of
the urban wastewater pollution.
Nutrients come primarily from urban wastewater and agriculture. For nitrogen, agriculture
accounts for about 80% of the loads, while for phosphorus it accounts for about 2/3 of the
total.
Point source pollution from organic matter and nutrients will be addressed through the
gradual equipment with appropriate wastewater treatment systems; for industrial
emissions, standards of “best available techniques” will be applied insofar as possible.
Diffuse pollution from agriculture is expected to decrease thanks to the implementation of
the European Nitrates Directive.
Hydromorphological alterations in the stream network mainly pertain to morphology (river
depth and width variation, riparian zone and substrate), river continuity (presence of
barriers) and hydrology (hydro-peaking, impoundment, abstractions). The DRBMP has
adopted a prioritization of stream barriers for the restoration of river connectivity
necessary to fish migration.
Compared to organic pollution and nutrients, pollution from hazardous substances is still
largely unknown due to significant knowledge gaps at the Danube-wide scale. The pollution
reduction measures to be implemented are essentially left to the individual Member States
compliant with the European legislation in place. Areas of action include the adequate
management of pesticides; application of sewage sludge in agriculture; industrial and
urban point sources.
Four scenarios to 2040
The DRBMP embraces a vision of gradual diffusion of good water management based on
the implementation of the EU water legislation. This vision rests on the assumption of a
stable engagement of policies throughout the region. However, different socioeconomic
and geopolitical drivers may affect the effectiveness, or even the persistence of water
policies as stipulated by this vision.
We have imagined four possible, albeit extreme, socioeconomic and political scenarios
under which we tried to identify emerging challenges for the management of the river
basin. These scenarios were discussed with a group of experts from the region, convened
at a workshop organized on purpose. The different scenarios, briefly described below,
reflect different trajectories along the following dimensions:
- Financing (preference for large or small projects);
- Economic redistribution and solidarity;
- National governance, government efficiency;
- Community engagement;
- Capacity, knowledge, innovation;
- Entrepreneurial initiative; and
- Societal responsiveness, awareness, participation.
Scenario 1 “Large scale coherence” benefits from a good level of technology and
infrastructure but carries risks of low societal engagement; all regions are on a level
playing field but competition between centre and peripheries may still exist. It is a scenario

9
with strong reliance on technology, large infrastructure leaning towards “grey” rather than
“green”, strong urbanization and an accelerated depopulation of rural areas.
Scenario 2 “Tailor made solutions” relies less on technology and infrastructure, but
suggests better societal engagement; collaboration among regions; smart specialization
may unroll but do not emerge automatically. It is a scenario with smaller and greener
infrastructure, with a much higher degree of rural development. It stipulates an active role
of communities and the responsibilization of people both as citizens and as consumers.
Scenario 3 “Multinationals rule” reveals an emergence of the supply chains as a key
organizer of the economy, with weakened role of the government and society. Supply
chains trigger tug-of-war competition among cities, regions and countries. Technology and
infrastructure are mostly controlled by large corporations. National governments are de
facto conditioned by the rules imposed by the global supply chains. The fate of cities is
strongly inked to their status as supply chain nodes, and rural areas are de facto subject
to intensive, industrialized agriculture, or outright abandoned.
Scenario 4 “Small scale interventions” shows a trajectory away from globalization, with
nation-states turning inward and relying on a more local, less dynamic economy. In this
scenario, technology and infrastructure are less developed, but society is more responsive
although not necessarily more capable to drive decisions. It is a scenario of nation-states
in a multipolar world, with urban and rural development limited by the capacity, wealth
and attractiveness of each country and region.
Under each scenario, we have elicited possible challenges for water management and,
particularly, for the three categories of measures (wastewater treatment, agricultural
diffuse pollution and mitigation of hydromorphological alterations) foreseen in the RBMP
to tackle the SWMIs. The challenges are summarized in the following table.
Scenario Wastewater Diffuse pollution (agriculture)
Hydromorphology
1 - Large scale coherence
Large WWTPs too
complex to
manage locally?
Decentralized
plants too small for
funding?
Lack of
enforcement
capacity?
Rebound effect of
high-productivity
agriculture ?
Competitive
agendas (e.g.
hydropower,
navigation) limiting
restoration only to
iconic sites?
2 – Taylor-made solutions
Difficult to finance
ambitious
advanced
treatment plants
(e.g.
pharmaceuticals) ?
Risk of „race to the
bottom“?
Ambitious projects
(e.g. dam removal)
difficult to finance?
3 – Multinationals rule
Worsening of
scenario 1
Industrialization of
agriculture?
Lacking motivation
of investors?
4 – Small scale interventions
Worsening of
scenario 2
Between scenario
2 and scenario 3
Lack of basin-wide
perspective?

10
Key recommendations
Drawing in part on the outcomes of discussions with experts at the workshop, we identify
possible ways to address the abovementioned challenges. In particular, we propose three
main areas for actions to improve long-term water management in the Danube River
Basin:
1) Effective and empowered communities may buffer the impacts of centralized
decision making, mitigate the harshness of competition in the global supply chains and
voice their needs more audibly. When communities hold important decision powers, their
capacity to look forward and face sustainability challenges is stronger.
2) Basin-wide integration is a cross-cutting need of the economy of the Danube, due
to the dependency of the various economies on shared water resources. Measures to
ensure continuation of basin-wide management of certain issues are needed irrespective
of how the society and economy will evolve. Addressing regional disparities by harmonizing
planning and implementation, investments are public or private and regardless of their
scale. Strengthen Danube River Basin management - acting according to an overarching
water management plan at the scale of the whole basin would also maximise coherence
of actions by all actors along the river and would generate the most synergies.
3) Bringing nature protection to the core of strategies helps escaping the
inefficiencies of “impair-then-repair” cycles, by shaping more robust and sustainable
solutions and focusing investments on the integrated promotion of the quality of life.
Climate change is projected to reduce the availability of water resources and quantitative
models identify a trend of increasing floods induced by climate change. To cope with these
conditions, robust nature-based solutions may take even higher importance. Increased
policy coherence and integration, taking into account the strong links that water
management has with other policies (e.g. industrial, tourism, transport, energy) and
recognising the benefit of acting at the scale of the whole river basin, may substantially
increase synergies and reduce trade-offs. This would offer a large advantage on the road
towards sustainable development.
Sharing and strengthening capacity, meant in cultural, technical and financial terms,
is a precondition to avoid marginalization and impoverishment of regions within the
Danube. Education of the youth in schools and universities (including through student
exchanges and harmonization of educational programmes) is essential to create a more
ecologically aware society.
The Danube region shows strengths and weaknesses, opportunities and threats for
the development of the above areas for action. Among the strengths, all countries are on
a (more or less steady) path to structural reforms, have relatively good environmental
performances and can benefit from the synergies with global or regional leaders under
several technological and organizational dimensions. This provides favourable conditions
for capacity building/knowledge transfer.
Another strength is the still relatively high abundance of pristine natural environment, and
the relatively low impact of agricultural activities in the lower river basin. This provides
ample opportunities for the development of green economic activities, also considering
that forest areas are generally stable if not expanding, while the population tends to
concentrate in urban centres.
Most of the Danube countries have a large public sector, which may be a strength when
planning public and community actions, although it may revert to a weakness if
bureaucracies take a conservative attitude and resist innovation. Re-valueing their large
public sector appears an opportunity for all countries but requires dedicated investments.
The relatively poor innovation performance may be a weakness for most countries,
although there are signals of vitality in certain innovative sectors in the region.
Agriculture in the region does not contribute enough to the gross domestic product,
suggesting a weakness due to the limited value of agricultural production. However, access
to a large and stable market such as the EU offers apparent opportunities particularly for
tourism and specialized agricultural production. Small farmers and their families may

11
develop typical products with high added value and marketability that can benefit from
the Protected Designation of Origin and other EU quality labels. The regions can support
this by attracting tourism from elsewhere, deploying good public transport and logistics
infrastructure, cultivating capacity for better agricultural management, etc.
Rural tourism to diversify sources of income might both benefit from environmental
improvements, and become a driver of further ecological transition due to the demand for
high quality organic produce, calling for a reduction of pesticide use and the adoption of
agro-ecological practices. These opportunities seem to be underexploited for now, with the
region still lagging behind the EU top players in the field in spite of assets such as a
relatively well preserved and varied agricultural landscape.
An overall threat in the region is the apparent ageing of population and the trend of
depopulation, particularly in lower Danube countries. If policies to counter these trends
are not put in place, societies may soon become very different and their capacity to plan
any development may be undermined.
Equally dangerous threats come from rising inequality in most Danube societies, and
particularly in the lower Danube, and corruption, which has shown to correlate well with
the difficulties of doing business. Foreign investors and the EU partner Member States may
have aligned interests in combatting both phenomena in order to secure a better business
environment and a higher overall prosperity in the region.
Finally, significant opportunities come from the European structural funds, the existence
of frameworks for the development of transboundary investments, and the relative ease
of access to financing through financial institutions.

12
List of abbreviations
Best Available Techniques (BAT)
Biochemical Oxygen Demand (BOD)
Chemical Oxygen Demand (COD)
Common Agricultural Policy (CAP)
Danube Flood Risk Management Plan (DFRMP)
Danube River Basin Management Plan (DRBMP)
Entrepreneurial Discovery Process (EDP)
Environmental Impact Assessment (EIA)
Environmental Impact Bonds (EIBs)
European Commission (EC)
European Investment Bank (EIB)
European Pollution Release and Transfer Register (E-PRTR)
European Union (EU)
European Union Strategy for the Danube Region (EUSDR)
Floods Directive, 60/2007/EC (FD)
Framework Agreement for the Sava River Basin (FASRB)
Global Innovation Index (GII)
Gross Domestic Product (GDP)
Integrated Pest Management (IPM)
International Commission for the Protection of the Danube River (ICPDR)
International Sava River Basin Commission (ISBRC)
Joint Research Centre (JRC)
Nederlandse Waterschaps Bank (NWB)
Nomenclature of Territorial Units for Statistics 2 (NUTS2)
Pay-for-Success (PFS)
Significant Water Management Issues (SWMIs)
Small and Medium-sized Entreprise (SME)
Sustainable Development Goal (SDG)
Trans-European Networks - Transport (TEN-T)
Water Framework Directive, 60/2000/EC (WFD)

13
1. Introduction
We live in times of unprecedented global instability3. The European Union (EU) faces
challenges related to severe geopolitical crises in the eastern and southern neighborhoods,
as well as the emergence in most Member States of political movements promoting the
restoration of sovereign nation-states and borders, and a loosening of European ties.
These have sprouted on the wave of the economic and financial crisis since 2007, hardened
by immigration (viewed by many as a threat to the welfare state and employment) and
terrorism. Immigration alone is recognized to be among the main motivations for British
citizens to vote for the United Kingdom to leave the EU, in June 20164.
In these times of crisis and change, the EU is often perceived as not fully capable of
delivering on the protection, security and well-being of its citizens in fields such as
employment, welfare, territorial cohesion and development. This calls into question the
EU’s own legitimacy. Yet, the EU represents a major source of financing for most of the
economic sectors in the Member States and the European funds are an important asset,
particularly for the development of macro-regions spanning borders between Member
States and less favoured areas5. This fact alone illustrates the value for Member States
and regions to cooperate in the EU context. But EU funding alone may not deliver all the
benefits of transnational collaboration, face to the many strategic challenges ahead,
affecting the economy and society at broad.
The European Union has launched “macro-regional strategies”. Its aims were nurturing
regional transboundary projects, developing better national policies while incorporating EU
concerns, “making more with less” by sharing budgets and pursuing value-for-money
initiatives in times of budget restrictions, promoting greater integration and coordination,
tackling inequalities and promoting cohesion in the macro-regions, stimulating multi-level
governance and finally enhancing cooperation with neighboring countries6.
The European Union Strategy for the Danube Region (EUSDR)7 is one of the EU macro-
regional strategies and is built on 4 pillars - “connecting the region”, “protecting the
environment”, “strengthening the region”, and “building prosperity” - for which 12 priority
areas of action are organized (Figure 1). The EUSDR is backed by the Interreg VB fund of
the “Danube Transnational Programme”8.
The protection of water resources is a cross-cutting aspect of the EUSDR, as water
management affects, and is affected by, many societal, environmental, economic,
geopolitical, and industrial dimensions of a system as complex as the Danube river basin.
As such, the Danube is a very instructive case for other macro-regional strategies in
Europe. Water resources management has more generally been identified as a key
3 Foreign Policy interview with Z.Brzezinski, July 2014: http://foreignpolicy.com/2014/07/21/a-
time-of-unprecedented-instability/ 4 See e.g. https://www.euractiv.com/section/uk-europe/news/immigration-top-concern-for-brexit-voters/ 5 See e.g. https://cohesiondata.ec.europa.eu/funds 6COM(2013) 468 final: Report From The Commission To The European Parliament, The Council, The European Economic And Social Committee And The Committee Of The Regions Concerning The Added Value Of Macro-Regional Strategies {Swd(2013) 233 Final} 7 http://www.danube-region.eu/ 8 http://www.interreg-danube.eu/

14
contribution to "smart, inclusive and sustainable growth"9, and needs to inform the agenda
of regional development in a pervasive, cross-cutting way10.
Figure 1 – The EUSDR pillars and priority areas (www.danube-region.eu)
In the context of the JRC's scientific support to the Danube strategy, the Danube Water
Nexus Flagship cluster of activities has generated input to decision-makers and managers
in the region about the future of water resources availability and the main aspects of water
quality by developing quantitative simulation models. These are a valuable tool to
understand the main drivers and possible evolution of water resources, under the impact
of climate and land use change or different levels of water demand and consumption. The
analysis presented here complements quantitative modelling by analysing mid-term water
scenarios taking into account how the full context may evolve, in order to identify the
possible relevant factors driving pressures on water bodies, and the corresponding threats
and opportunities for the future updates of the river basin management plan.
In this report, we present a foresight exercise11 on possible emerging issues,
associated threats and opportunities for the Danube river basin, and we propose
possible actions to address them. The study harnesses the knowledge of a group of
policy-makers, academics and business representatives from the Danube region convened
at a workshop held in Budapest in October 201612, who were prompted to elaborate on
the possible evolution of water management in the Danube region under a set of extreme,
broad socioeconomic and political scenarios.
9 “Developing efficient water management goes hand in hand with fostering innovation and knowledge (smart growth) […]. Working towards ensuring availability of good quality water for all users contributes to the sustainable growth of the EU […]. Finally, efficient water management can help bring about inclusive growth, fostering a high-employment economy while delivering economic, social and territorial cohesion” (http://europa.eu/rapid/press-release_MEMO-12-
866_en.htm) 10 See the “Blueprint to safeguard Europe’s water resources”: http://ec.europa.eu/environment/water/blueprint/index_en.htm 11 “Foresight is the disciplined exploration of alternative futures. Policy makers use
foresight techniques and conduct studies to explore different scenarios in a structured way
to confront complex challenges and help create a better future.”
(https://ec.europa.eu/info/research-and-innovation/strategy/support-policy-
making/support-eu-research-and-innovation-policy-making/foresight_en) 12 Details on the workshop may be found in Bontoux et al., 2018.
http://publications.jrc.ec.europa.eu/repository/bitstream/JRC114803/jrc114803_danube_workshop_flash_report_online_final.pdf

15
Informed by quantitative hydrological modelling of the implications of socio-economic,
land use and climate change and the qualitative narratives of the scenarios, this report
discusses the challenges to water management that can be anticipated in the Danube river
basin. Subsequently, the report identifies areas where attention should be focused in order
to be prepared for these challenges.
While this report builds extensively on the workshop, the wealth of considerations
emerging from the discussion was further elaborated in a relatively free way. Hence, the
report cannot be regarded as the proceedings of the workshop itself but is meant to be an
autonomous contribution.
The report is organized as follows. Section 2 sets the scene by recalling evidence on the
socioeconomic conditions of the Danube region, as well as on the availability and use of
water resources and their trends following climate and land use change. Section 3 provides
an overview of the Danube river basin management context and the significant water
management issues to be addressed.
Section 4 describes the scenarios that have been designed to define possible
socioeconomic trajectories of the region until 2040, and elaborates on the workshop’s
outcomes to identify what each trajectory may imply for water resources.
On the basis of the scenario discussion, Section 5 summarizes the challenges emerging
under the different scenarios. These may help identifying key factors hampering or
undermining the effectiveness of the Joint Programme of Measures Implementing the
Danube River Basin Management Plan13 (DRBMP).
Finally, Section 6 elaborates recommendations on possible areas for actions to improve
long-term water management in the Danube River Basin.
13 https://www.icpdr.org/main/activities-projects/implementation-drbm-plan

16
2. Setting the scene
The Danube Region covers parts of nine EU Member States (Germany, Austria, Hungary,
Czech Republic, Slovak Republic, Slovenia, Croatia, Bulgaria and Romania) and five non-
EU countries (Serbia, Bosnia and Herzegovina, Montenegro, Ukraine and Moldova).
2.1 Socioeconomic signals from the Danube countries
The Danube countries show very diverse economic conditions. EU Member States are
generally in better economic conditions than non-members. Furthermore, Member States
in the Upper Danube have markedly stronger economies than Lower Danube countries.
The European Semester process14 sheds light on the general conditions of Member
States’ economies and provides a picture of the Danube countries. The Country reports
for the year 2017 highlight the following features (See Annex 1):
- In 2016, the region shows higher growth than the rest of Europe and
unemployment is decreasing, although the quality of jobs is often poor (e.g. due
to part-time or temporary work). Significant gaps persist e.g. related to gender.
- Most countries have engaged structural reforms with diverse intensity and
effectiveness. A general economic convergence can be observed but is unequal.
- Inequality and risks of exclusion emerge across the whole region, although in
different forms: the capacity of governments in the Lower Danube to provide social
protection is weak and poverty is an issue, whereas inequality in the Upper Danube
tends to take the form of a relative difficulty of access to certain opportunities (e.g.
higher education).
- The gaps in wealth among countries are mirrored in governance, the delivery of
public services and capacity of the public administration to manage investments,
with Upper Danube countries achieving a usually higher efficiency.
Figure 2 – Ease of Doing Business Rankings for 2017, World Bank. The rankings are on a range 1
(best conditions) to 190 (worst conditions in the World). The sum of rankings highlights the contribution of the different criteria to the final judgment on the ease of doing business in a country (Kosovo reported as per the original data). http://www.doingbusiness.org/rankings
14 https://ec.europa.eu/info/strategy/european-semester_en

17
Non-EU Member States seem to align with these general trends and are the worst-off
countries of the region in many respects. The Danube countries show a clear trend of
increasing difficulty for doing business (Figure 2) when moving from the Upper Danube
(Germany and Austria ranking among the World top 20) towards the lower Danube15. Non-
EU countries show worse 'doing business conditions' than EU countries.
The issues driving ease of doing business depend on the country. Starting a business
may require more complex procedures in wealthier countries, while the enforcement of
“business rules” (protection of minority investors, resolving insolvency, enforcing
contracts) tends to weaken from Upper to Lower Danube countries and from EU to non-
EU countries. The same applies to administrative procedures (e.g. getting an electricity
connection, paying taxes, obtaining a construction permit). Public sector corruption is
reported as an issue in many countries with a correlation of the corruption perception
index (CPI)16 with GDP per capita (Figure 3). Corruption is perceived as decreasing over
in the last 5 years in all countries except Hungary and Bosnia-Herzegovina. A clear
correlation emerges also between CPI and ease of doing business.
Figure 3 – Corruption Perception Index (CPI) 2012-16. Danube countries (Kosovo reported as per the original data). Higher values indicate lower perceived corruption. The graph also plots the GDP
15 We refer to the popular “Ease of doing business” index developed by the World Bank. Further details available at http://www.doingbusiness.org 16 The CPI reflects the perception of corruption in the public sector; further details can be found at: https://www.transparency.org/research/cpi/overview

18
per capita in 2013 (in US$) from the Danube river basin mabagement plan (DRBMP), 2015 update
(table 22). http://www.transparency.org/news/feature/corruption_perceptions_index_2016
Industry accounts for a large share of GDP for all Danube countries except Bosnia-
Herzegovina; much less agriculture (Figure 15) which tends to be inversely correlated with
GDP per capita. In Moldova, the Danube country with the lowest GDP per capita,
agriculture accounts for almost 30% of GDP.
Regarding employment (see Annex 2), the EU regions within the Danube river basin have
a share of employment in public administration of around 20% (Hungary slightly above,
Romania slightly below). The employment share of agriculture is usually much below 10%
(and frequently less than 5%) with Romanian regions and Vzhodna Slovenija at higher
levels; the employment share of industry reaches 30% in the most industrialized regions
such as Czech Republic and Hungary with a good diversification of the sector across the
Danube region. The tertiary sector is dominant (services and public administration), at
around 60% or more, except in some regions of Romania..
Globally, the region does not excel in innovation, with the exception of Germany and, to
a lesser extent, Austria. It also has a relatively good environmental performance although
it tends to lag slightly behind other European regions (see Annex 3 for further details).
Finally, the Danube countries have some typical agricultural products (Figure 6), although
they generally lag behind the top EU players in this field. Germany is a partial exception
in this regard.
2.2 Demography and land use
The Danube region is losing population and this trend is expected to continue. According
to European Commission projections (Figure 5), Romania, Bulgaria and Croatia will lose
between 20 and 30% of their 2016 population by 2070 (between 5 and 10% for all other
countries). Only Austria is expected to gain almost 20% on top of its 2016 population. This
suggests that the Lower Danube will witness a generalized population reduction, expected
to be worse for non-EU countries. This trend is accompanied by a systematic ageing, with
all Danube EU Member States having 50% or more of their population aged 65 years or
older by 2070 and 20% or more above 80 years old (Figure 7).
Bisselink et al., 2018, present projections of urban and forest land use, indicating a clear
urbanization trend (mostly +10 to 20%, but a 147% increase in Montenegro!). Moldova
and Ukraine are expected to have almost no increase. The expected growth of forest areas
is quite divergent, with only Serbia and Bosnia-Herzegovina projected to witness a small
decrease (Figure 8).
2.3 Water resources and their use
A large part of the surface and ground water in the Danube region is generated in the
Upper Danube, especially in the western and southern subbasins in Germany and Austria
(Karabulut et al., 2016). For example, Austria, with 10% of the basin area, has 25% of
the water provisioning capacity while, Romania, with 29% of the area, only has 17% of
the capacity. Water use, on the other hand, occurs mainly in the valleys and downstream
plains (Figure 7 and Figure 8), shared between energy production (44%), agriculture and
livestock (26%), industry (17%) and domestic water use (13%) (see Figure 9).
Water availability has also important implications for navigation on the Danube river
(Scholten and Rothstein, 2016). Data reveal a complex but clear connection between water
levels and transport prices, impacting the volume of goods transported and other related
aspects (such as the shift from large ships to a larger number of smaller ships when levels
are low). Every 10 cm decrease in water level at a reference location results in a 0.6%
decrease in capacity utilization (approximately 1700 t). This can be limited to some extent
by switching to smaller ships, adaptating the shape and materials of ships, or engaging in
hydraulic engineering works, thereby impacting river hydromorphology.
19
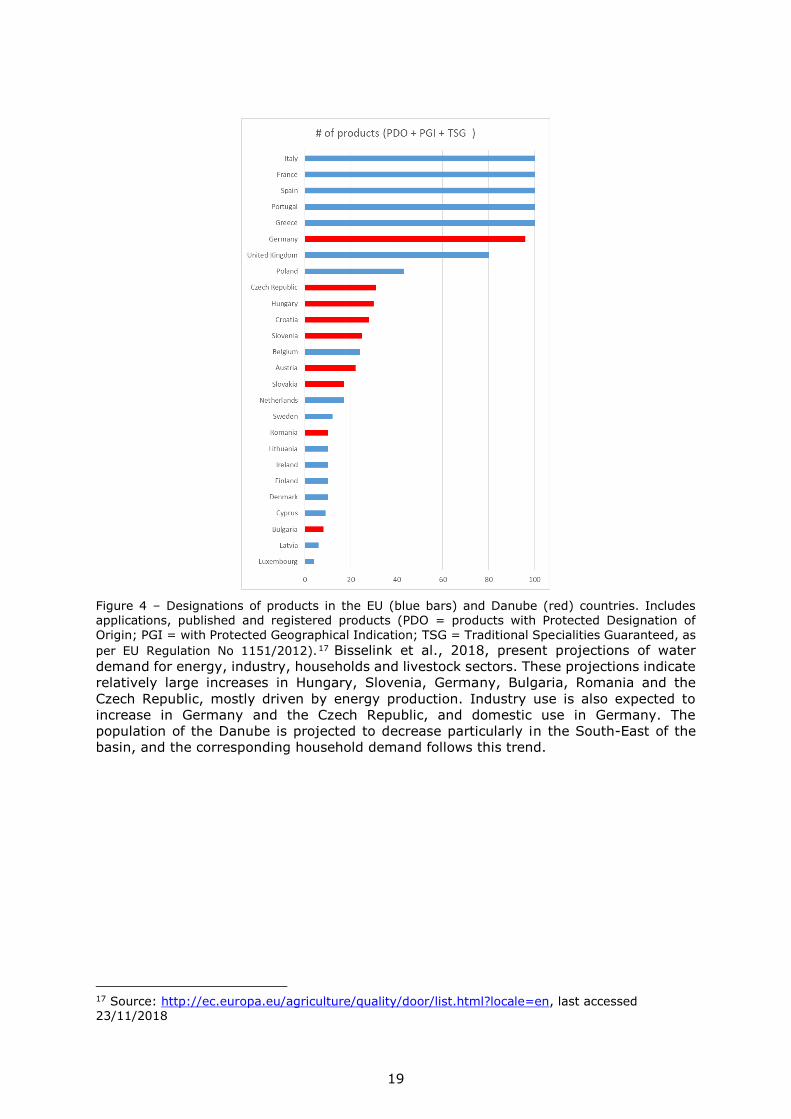
Figure 4 – Designations of products in the EU (blue bars) and Danube (red) countries. Includes
applications, published and registered products (PDO = products with Protected Designation of
Origin; PGI = with Protected Geographical Indication; TSG = Traditional Specialities Guaranteed, as
per EU Regulation No 1151/2012).17 Bisselink et al., 2018, present projections of water
demand for energy, industry, households and livestock sectors. These projections indicate
relatively large increases in Hungary, Slovenia, Germany, Bulgaria, Romania and the
Czech Republic, mostly driven by energy production. Industry use is also expected to
increase in Germany and the Czech Republic, and domestic use in Germany. The
population of the Danube is projected to decrease particularly in the South-East of the
basin, and the corresponding household demand follows this trend.
17 Source: http://ec.europa.eu/agriculture/quality/door/list.html?locale=en, last accessed 23/11/2018

20
A
B
C
Figure 5 – projected demographic evolution for the EU Danube countries. Source: EC, 2018. A: trends in total population; B: % population above 65 years; C: above 80 years. “2016” indicate the most recent data, “change” is difference between 2016 and 2070.

21
Figure 6 – current and projected urban (above) and forested (below) land use in the Danube. From Bisselink et al., 2018, reused under Decision 2011/833/EU.

22
Figure 7 – Renewable water in the Danube river basin estimated by the model SWAT. From Karabulut et al., 2016 (http://dx.doi.org/10.1016/j.ecoser.2015.08.002) under CC BY NC ND license

23
Figure 8 – Water provisioning for different uses in the Danube river basin. From Karabulut et al., 2016 (http://dx.doi.org/10.1016/j.ecoser.2015.08.002) under CC BY NC ND license
Figure 9 – Share of demand among the different uses in the Danube river basin. From Karabulut et
al., 2016 (http://dx.doi.org/10.1016/j.ecoser.2015.08.002) under CC BY NC ND license

24
2.4 Climate scenarios and implications for water resources
Climate change is expected to significantly affect the water cycle in the Danube. Climate
models lead us to expect a general increase in temperature with increasing precipitations
in the north of the basin, less precipitations in the south (possibly variations in the order
of 70 mm/year), and a narrow, less impacted, transition zone (Pistocchi et al., 2015).
Mean annual temperatures could go up by 5°C, especially in the south-east. Most model
projections seem to agree on a decrease in the number of days per year with precipitation
>0.1 mm (by about 10% in the southern and eastern Danube basin) (ibid.) and an increase
in the number of days with precipitation above 20 mm (ibid.). This suggests that the
hydrological cycle might experience more or longer dry periods and more intense
precipitation events.
A B
C D
Figure 10 – Change in mean annual surplus
(precipitation - evapotranspiration) using the
Budyko model discussed in Pistocchi et al.,
2015. A: median under RCP 4.5 scenario18; B:
median under RCP 8.5 scenario; C: minimum
under RCP 8.5 scenario; D: maximum under
RCP 8.5 scenario
Observed river water temperature increases in the Tisza and Danube rivers between 1950
and 2010 and observations that the period of ice formation on the Danube in Hungary has
shortened from the whole winter at the end of the XIXth century, to only a part of the
month of January around year 2000 confirm these general trends. There are also
18 RCP=Representative concentration pathway. RCP 4.5 represents a moderate change of
climate due to reduction of greenhouse gas emissions; RCP 8.5 represents a more severe
climate change with lesser reduction of emissions. See Pistocchi et al., 2015, and Bisselink
et al., 2018, for additional details.

25
suggestions that soil moisture could follow a decreasing trend over the XXth century
(Pistocchi et al., 2015).
The estimates of evapotranspiration presented in Pistocchi et al., 2015 can be interpreted
in terms of changes in mean annual water surplus, i.e. precipitation in excess of
evapotranspiration, across the river network (Figure 10). Usually, climate projections
indicate an increase in annual water surplus, except in the southernmost edge of the river
basin (Figure 10 A, B, D), implying less water availability for economic uses there.
However, the most pessimistic climate scenarios predict significantly lower water
availability for most of the Danube (Figure 10 C).
This analysis is confirmed by a more recent and comprehensive simulation of water
resources in the Danube considering projections of land use and water demand under two
climate change scenarios, one based on an increase in mean global air temperature of 2°C
and one corresponding to the IPCC RCP 8.5 scenario (Bisselink et al., 2018). In these
simulations, while most of the Danube is projected to have higher average streamflow
during winter (December-February), the picture is unclear in the other seasons, indicating
that an increasing scarcity of water resources may not be excluded (Figure 13). Another
conclusion of this work is that the impact of change in land use and water demand on
water availability is likely to be very small compared to that of climate change in the
Danube region. The analysis highlights that climate change can be expected to reduce
water availability and increase water stress for the eastern and southern part of the river
basin, particularly during summer.
Figure 11 - Impact of 2 degree climate change on mean seasonal streamflow, as compared
to the 1981-2010 climate. The green colour indicates rivers where the uncertainty in the
results is large. From Bisselink et al., 2018, reused under Decision 2011/833/EU.

26
3. River basin management and policy making in the
Danube region
3.1 Policy and regulatory basis
The Danube River Protection Convention 19 is the legal instrument regulating the
cooperation of the contracting parties on the management of waters in the Danube River
Basin (DRB). It involves 15 parties, including the European Union (through the European
Commission) and its executive body - the International Commission for the Protection of
the Danube River (ICPDR)20 - in charge of the Danube River Basin Management Plan
(DRBMP21) and of the Danube Flood Risk Management Plan (DFRMP). These plans must
respect the European Water Framework Directive (WFD, 60/2000/EC) and the Floods
Directive (FD, 60/2007/EC).
The DRMBP is organized at three levels: a “roof level” (part A) providing an overview at
the scale of the whole basin, and national/sub-national levels (parts B and C) addressing
specific issues of local interest and implementing in practice the measures agreed-upon at
the “roof level”. Part A of the plan (hereinafter simply named the DRBMP) concerns the 61
surface water bodies identified on the Danube river, the 699 surface water bodies of the
tributaries (with a catchment area of more than 4000 km2), 6 lakes, 6 transitional and 5
coastal water bodies, and the 11 transboundary groundwater bodies of basin-wide
importance.
Within the Danube river basin, the basin of the large Sava tributary is managed under the
coordination of the International Sava River Basin Commission (ISRBC)22 in the context of
the Framework Agreement on the Sava River Basin (FASRB) among the riparian countries
of Slovenia, Bosnia-Herzegovina, Croatia and Serbia.
3.2 Status of water bodies
About 40% of the length of the Danube basin streams is designated as heavily modified
water bodies and 3% as artificial. 69% of the Danube river alone is heavily modified, and
similar figures apply to major tributaries (Sava, Prut, Olt and Tisza). The ecological
status (or potential) of rivers is unknown for almost 10% of the stream network length;
it is good or above for only about a quarter of the length, and less than good in the other
cases. Good ecological status is usually found in the Carpathians, Dinarides (Sava and
tributaries) and Alps (mainly in tributaries Mur, Drau, Lech and Isar). The judgments on
the ecological status are still not completely harmonized due to incomplete data or
methods not fully compliant with the WFD in some countries.
The chemical status is not good in about 20% of the total length and, in water bodies
representing 18% of the total length, the environmental quality standards for mercury in
biota are not met (no information for the rest). Problem areas are in the Danube upstream
of Ulm, from Serbia to the junction with the Danube-Black Sea canal in Romania, in most
Czech tributaries, throughout the Tisza basin and in the lower Sava.
The status of groundwater bodies of transboundary importance is generally good, with
some groundwater bodies at risk of poor status with caveats due to significant
heterogeneities in aquifer conditions or to knowledge gaps.
3.3 Significant Water Management Issues
The DRBMP addresses nutrient, organic and hazardous chemical pollution and
hydromorphological alterations.
19 https://www.icpdr.org/main/icpdr/danube-river-protection-convention 20 https://www.icpdr.org/ 21 The documents of the DRBMP are accessible at https://www.icpdr.org/main/activities-
projects/river-basin-management 22 http://www.savacommission.org/

27
Organic pollution from point sources
Organic pollution results primarily from discharges of poorly treated or untreated
wastewater. Collected, untreated wastewater represents 64% of the total biochemical
oxygen demand (BOD) discharge in the Danube river basin23. These situations occur
predominantly in Serbia (more than 60% of the load), and in sizable proportions in
Slovenia, Croatia, Bosnia-Herzegovina, Montenegro, Romania and Bulgaria. While Ukraine
and Moldova do not treat most of their wastewater (>70% and >80% respectively), they
also don't collect it. The contributions to BOD discharge from Germany, Austria, the Czech
Republic, Slovakia and Hungary seem to be marginal as virtually 100% of their wastewater
is treated. When wastewater is collected, the only possible solution is wastewater
treatment at the end of the pipe which poses issues with investment, operation and
maintenance costs and expertise required.
The organic pollution load from industry 24 adds in the order of 10% to the urban
wastewater pollution, and almost half of it comes from Austria, mainly by the waste and
industrial waste water management sector. Most of the rest comes from Romania, Slovakia
and Germany in approximately equal shares (mostly from chemical and wood and paper
industries), followed by Hungary and Bulgaria. All other countries have much smaller
contributions.
Nutrients from point and diffuse sources
In the case of nitrogen, diffuse emissions dominate (>80%), while for phosphorus the
share is approximately 2/3, with 1/3 from urban wastewater. Atmospheric deposition is
only significant for nitrogen, and comparable with industrial emissions, but still much less
than urban waste water. Urban runoff accounts for a bit more than 10% of diffuse
emissions for nitrogen, and almost 30% for phosphorus. Table 1 summarizes the
contributions of point and diffuse sources to nutrient pollution in the DRB.
Sources Total N (tonnes/year) Total P (tonnes/year)
Urban waste water 88081 12402
Industry 7324 224
Diffuse emissions 497352 25555
Atmospheric Deposition 12309 301
Table 1 – sources of nutrient pollution in the DRB (data from ICPDR, 2015).
With reference to urban wastewater, Slovenia, Croatia, Bosnia-Herzegovina,
Montenegro and Serbia contribute unit loads of nitrogen (tonnes/year per population
equivalent) 50% to 100% higher than the other Danube countries, and for phosphorus
about 2 to 4 times those of the other countries. In absolute terms, nitrogen emissions are
largest in Romania and Serbia (about 20% each), followed by Germany (about 15%),
Austria and Hungary (about 10% each). For phosphorus, Romania and Serbia account for
almost half of the total (20% and 27% respectively). In general Lower Danube countries
account for comparatively higher shares and Germany and Austria for lower shares,
reflecting the different levels of treatment (especially tertiary treatment).
For rural diffuse emissions, nitrogen unit contributions from Germany (>15 kg/ha per
year) are significantly higher than for Slovenia (> 10 kg/ha per year), Austria, Czech
23 ICPDR, 2015, Table 3 and Figure 8. 24 ICPDR, 2015, refers to emissions from the industrial plants reporting to the European Pollutoin Release and Transfer Register (E-PRTR), covering larger facilities of selected sectors. The picture
may therefore be incomplete and underestimate the total load, as smaller facilities and facilities in non-covered countries are not counted.

28
Republic, Slovakia and Croatia (in the range 5-10 kg/ha per year). The other countries
have contributions per hectare of about 5 kg/year or less. The relative entity of emissions
is similar when referred to phosphorus.
Hazardous substances from point and diffuse sources
Pollution from hazardous substances is still wrapped in considerable uncertainty due to
significant knowledge gaps. For 33 chemicals or groups of chemicals reported in the
European Pollution Release and Transfer Register (E-PRTR) it is possible to track emissions
from the different industrial activities (Annex 4 of the DRBMP 25 ). For the priority
substances of Directive 2013/39/EU, the EU Danube countries have completed or are
developing inventories of emissions.
Hydromorphological alterations
The DRBMP relies on an extensive knowledge of hydromorphological alterations in the river
basin based on morphology (e.g. river depth and width variation), river continuity
(presence of barriers) and hydrology (e.g. abstractions) and on an analysis of the degree
of connection of floodplains and wetlands with the stream network. Only about 10-45% of
it is classified as near natural or slightly altered (depending on the countries).
Barriers are mostly hydropower generation dams, followed by flood protection and water
supply. Few, particularly in Hungary and Romania, are associated with navigation. A
relatively large number of barriers are of unknown origin in Germany and Austria. More
than a half of the barriers are not passable by fish. The Iron Gates (RS, RO), Gabcikovo
reservoir (SK) and dam chains in Austria and Bavaria are the main habitat discontinuities
in the Danube.
The DRBMP devotes particular attention to the connection of floodplains and wetlands with
the main river, considering that less than 19% of the XIXth century floodplains are still
functional. About 70,000 ha of wetlands and floodplains with a potential for reconnection
exist in Romania, followed by Ukraine, Moldova and Serbia with about 43,000, 33,000 and
26,000 ha respectively.
Among hydrological alterations, hydropeaking, i.e. the release of water pulses to increase
hydroelectric power production at hydroelectric dams is reported particularly in Austria
and Germany. Oscillations above 1 m/day are also reported in Hungary, Croatia and
Montenegro. Impoundments affect approximately 12% of the length of rivers considered,
and those corresponding to the main longitudinal discontinuities (Iron Gates, Gabcikovo
and the Austrian and Bavarian dam chains) are clearly the most important. The DRBMP
identifies 144 abstractions causing significant alterations on the Danube in Germany,
Hungary, Slovakia (the Gabcikovo bypass canal) and Bulgaria. Significant abstractions on
tributaries are also identified in Austria and Romania. The main reasons for these
abstractions are hydropower and, less frequently, irrigation, while domestic supply and
power plant cooling.
The DRBMP identifies 39 future infrastructure projects with a potential to affect the status
of water bodies. Many, mostly located on the Danube river itself, relate to navigation, less
frequently to flood protection (in Bavaria) and in four cases to hydropower generation (in
Montenegro, at the Slovenia-Croatia border and in Ukraine).
3.4 Objectives and measures of the DRBMP
The DRBMP acknowledges that half of the water bodies not yet achieving good status will
not achieve it by 2021. In 3% of the cases (along the Iskar and Yantra rivers in Bulgaria,
and Olt in Romania) less stringent objectives need to be set anyway. The same applies to
some groundwater bodies. It also indicates general measures to address so-called
25 The Danube River Basin District Management Plan (DRBMP) – Update 2015
https://www.icpdr.org/main/sites/default/files/nodes/documents/drbmp-update2015-
annexes.pdf

29
"Significant Water Management Issues" (SWMIs), i.e.organic, nutrient and chemical
pollution, alteration of river continuity, floodplain/wetland connection and flow regime.
Point source pollution from organic matter and nutrients will be addressed through the
gradual equipment of human settlements with appropriate wastewater treatment systems.
For industrial emissions, “Best Available Techniques” will be applied as far as possible; the
reference targets are those set in the European Urban Wastewater Treatment Directive26
and Industrial Emission Directive 27
Diffuse pollution from agriculture is expected to decrease thanks to the implementation
of the European Nitrates Directive (ND)28, requiring to reduce nutrient losses, and to the
adoption of good agricultural practices, the latter driven by European financial incentives
under the Common Agricultural Policy (CAP).
The DRBMP pursues a “mid-term” and a “vision” scenario where urban wastewater is
increasingly treated at tertiary level for all plants serving 10,000 population-equivalents
(PE) or more. Plants between 2,000 and 10,000 PE should be equipped with secondary
treatment and smaller plants should have appropriate decentralized levels of treatment.
For nutrients, in addition to adequate wastewater treatment, the “vision” scenario
corresponds to sustainable agricultural development (with surpluses of N limited to 25
kg/ha per year except for Germany, with 50 kg/ha/year, erosion control for sloping
catchments and the establishment of riparian buffer strips in hilly sub-catchments.
Chemical pollution is by far less understood and remains an area of further investigation.
The measures to be implemented are essentially left to the individual Member States in
compliance with the European legislation in place. Key areas of action include:
- Pesticides –EU Member States must implement national action plans according to
the Sustainable Use of Pesticides Directive, and must prescribe integrated pest
management (IPM) as the standard practice in agriculture;
- Application of sewage sludge in agriculture – Member States must comply with
criteria, standards and restrictions set out in the Sewage Sludge Directive29;
- Industrial point sources - besides application of the Best Available Techniques (BAT)
for nutrients and organic pollution, facilities are subject to the Industrial Accidents
(Seveso)30 and Mining Waste31 Directives where applicable;
- Urban point sources - for some chemicals, implementing the Urban Wastewater
Treatment Directive may abate pollution significantly, although many other
chemicals would require a tertiary or more stringent level of treatment.
The DRBMP has also prioritized stream barriers for the restoration of river connectivity for
fish migration. Besides taking stock of measures necessary to address morphological
alterations at various scales, it highlights the need to reconnect wetlands and floodplains
larger than 500 ha to the river whenever possible as a measure of Danube-wide
importance. For what concerns the alteration of flow regimes, the plan notes that
measures have been included in river basin management plans at country level,
acknowledging that these measures are expected to yield Danube-wide benefits.
4. Scenarios
In order to explore and understand the implications of possible societal, political and
economic developments in the Danube, we designed four possible, albeit extreme,
26 http://ec.europa.eu/environment/water/water-urbanwaste/index_en.html 27 http://ec.europa.eu/environment/industry/stationary/ied/legislation.htm 28 http://ec.europa.eu/environment/water/water-nitrates/index_en.html 29 http://ec.europa.eu/environment/waste/sludge/ 30 http://ec.europa.eu/environment/seveso/ 31 http://ec.europa.eu/environment/waste/mining/index.htm

30
socioeconomic and political scenarios32 with a time horizon of 2040, a roughly 25 year (one
generation) perspective. Under these scenarios, we tried to identify emerging challenges
for the management of the river basin.
How different were things 25 years ago? To get a sense of this time perspective, let’s
recall how different things were in 1992. The Soviet Union had collapsed recently and the
internet was making its debut. The British pound and the Italian lira were expelled from
the European Exchange Rate Mechanism. The Danube river basin was home to a very
different geopolitical set up from today. In 1992, Yugoslavia ceased to exist and
Czechoslovakia still existed. The Yugoslav wars and the Kosovo war a few years later
redefined countries and borders as we know them today. While China had embarked on
its industrialisation and had started opening to the world, Hong Kong was still British (until
1997). Furthermore, the 1990s represented continuing social liberalization in most
countries. Finally, the European Union itself was being born (the Maastricht Treaty was
signed in 1992). On the technology front, personal computers started to become popular
and Microsoft launched Windows 3.1. Apple produced its first laptop: the MacIntosh Power
Book, a clunky grey object with very little autonomy compared to today's laptops. Mobile
phones were on the horizon, but few people used one. Internet was not yet present in
everyday life and emails were not known to the public.
The four scenarios were created following a classic deductive scenario making
methodology (the “2-axes method” 33 ). After extensive brainstorming and based on
previous experience from work in the Danube river basin, we selected 'Decision-making
context' and 'Intervention mode' as the two axes to build the scenario logic:
'Decision-making context' relates to the overarching driver in the political-economic
world and to the cooperation level. It ranges from 'Euro-cooperation' to 'Local
perspectives.'
- Under 'Euro-cooperation' all countries in the Danube river basin would collaborate
extensively, trying to find common, mutually beneficial solutions. In this context,
countries would be ready to make concessions for the greater good of the river basin. - Under 'Local perspectives' countries in the Danube region would focus on themselves
and compete with each other, each trying to maximise their own development, with
limited regional or European cooperation.
'Intervention mode' relates to the perspective taken to deal with investments. This axis
does not infer anything regarding the overall level of investment, which can be similar at
both ends, but the way investments are made differs. 'Intervention mode' ranges from
'Large scale infrastructure' to 'Targeted interventions.'
- 'Large scale infrastructure' means that countries and companies concentrate their
investments on few large scale projects that can be trans-national. - 'Targeted interventions' means that investment is carried out in many small scale
and local projects.
Figure 14 illustrates the scenario logics, which led to a partition into four extreme scenarios
whose proposed titles are displayed. Albeit deliberately extreme, these scenarios represent
possible endpoints (by 2040) of trajectories starting from today's conditions. Their
characteristics are briefly outlined below.
32 The scenarios used for this work were initially developed in the MSc thesis of Mr Augustin Gallot-Lavallee, The use of scenarios in water futures planning applied to the Danube River Basin, Centre
for Environmental Policy, Faculty of Natural Sciences, Imperial College London, 2016. 33 http://forlearn.jrc.ec.europa.eu/guide/2_scoping/meth_scenario.htm

31
Figure 12 - axes used for the definition of the scenarios
Scenario 1 “Large scale coherence” corresponds to a good level of technology and
infrastructure, but carries risks of low societal engagement. All regions are on a level
playing field but competition between centre and peripheries may still exist. It is a scenario
with strong reliance on technology, large infrastructure leaning towards “grey” rather than
“green”, strong urbanization and an accelerated depopulation of rural areas.
Scenario 2 “Tailor made solutions” may cater for less technology and infrastructure,
but better societal engagement. Collaboration among regions and smart specialization may
unroll but do not emerge automatically. It is a scenario which relies on behaviours, smaller
and greener infrastructure, with a much higher degree of rural development.
Scenario 3 “Multinationals rule” reveals an emergence of the supply chains as a key
organizer of the economy, with weakened role of the government and society. Supply
chains trigger tug-of-war competition among cities, regions and countries. Technology and
infrastructure are easily mobilized by large corporations. National governments are de
facto conditioned by the rules imposed by the global supply chains. Cities form and dissolve
as supply chain nodes and rural areas are de facto abandoned or subject to intensive,
industrialized agriculture.
Scenario 4 “Small scale interventions” shows a lower degree of globalization, with
nation-states turning more inward and a slowly developing economy. In this scenario,
technology and infrastructure are less developed, but society is more responsive although
not necessarily more capable to drive decisions. It is a scenario of nation-states in a
multipolar world, with urban and rural development limited by the capacity, wealth and
attractiveness of the different countries and regions.
The four scenarios reflect different trajectories along the following dimensions:
- Type of financing (preference for large or small projects);
INTERVENTION MODE
DEC
ISIO
N M
AK
ING
C
ON
TEX
T
Local perspectives
Euro-cooperation
Targeted interventions Large scale infrastructure
Scenario 1
Large scale coherence Scenario 2
Tailor-made solutions
Scenario 3
Multinationals rule
Scenario 4
Small scale interventions

32
- Economic redistribution and solidarity;
- National governance, government efficiency;
- Community engagement;
- Capacity, knowledge, innovation;
- Entrepreneurial initiative; and
- Societal responsiveness, awareness, participation.
In the following sub-sections, we discuss each scenario more in depth, examine inherent
challenges and elaborate on the required preparedness. The scenarios were discussed with
a group of experts from the region, convened at a workshop organized on purpose34, which
helped refining the initial assumptions and the characterization of trajectories under each
scenario.
4.1 Scenario 1 - Large scale coherence
In this scenario, the European Union does not just remain a single market, but strengthens
political, social and economic integration significantly. It represents a further development
of “Scenario 5: Doing much more together” in the European Commission’s White Paper on
the Future of Europe35.
The political centre ("Brussels") has a capacity to plan and fund directly investments at a
large scale across Europe. Member States devolve significant powers to the Union. Signals
in the direction of Euro-cooperation can be seen in the pleas for a stronger Union e.g. in
European Commission President Juncker’s State of the Union Address 201736, or French
President Macron’s “Discours de la Sorbonne”37 as well as in initiatives such as the looming
intensified cooperation between Germany and France, potentially open to other EU
Member States38.
A new EU treaty has been adopted, and social protection accrues to EU competences - a
basic social protection package is extended to all EU citizens. The EU budget gains a large
level of autonomy thanks to new “own resources,” reducing the traditional bargaining
among Member States around the multi-annual financial perspectives. Concerns linked to
the remaining divergences among Member States lead to a reinforcement of the structural
funds and redistribution mechanisms, and strong cooperation fostered by the EU helps
lower Danube countries catch up with upper Danube peers. Efforts are made to reduce
unemployment and inequality. Controlled and managed immigration from non-EU
countries mitigates a rapidly ageing population.
Coordination makes the EU stronger on the international scene: it has put its own house
in order and has reduced its dependency on raw materials and energy sources from other
areas of the world. Thanks to the EU's internal strength and coherence, its diplomacy is
strong and pushes its core values on global issues. Nationalism has subsided and people
feel more European, live in big cities and benefit from an overall flourishing economy. EU
level coordination of investments optimizes the development of large scale infrastructure,
many of them connected to the Trans-European Transport Networks (TEN-T)39, renewable
energy generation and its efficient distribution across the EU, in a fully achieved Energy
34 See, for further details on the workshop, Bontoux et al., 2018.
http://publications.jrc.ec.europa.eu/repository/bitstream/JRC114803/jrc114803_danube_workshop_flash_report_online_final.pdf 35COM(2017)2025: https://ec.europa.eu/commission/sites/beta-
political/files/white_paper_on_the_future_of_europe_en.pdf 36 http://europa.eu/rapid/press-release_SPEECH-17-3165_en.htm 37 http://www.elysee.fr/declarations/article/initiative-pour-l-europe-discours-d-emmanuel-macron-pour-une-europe-souveraine-unie-democratique/ 38 See e.g. https://www.ifri.org/sites/default/files/atoms/files/edito_vers_un_nouveau_traite_de_lelysee_avril
_2018.pdf 39 See e.g. http://www.connectingeu.eu/documents/Delivering_TEN_T.pdf

33
Union40, with a strong cooperation among countries. Large companies work in publicly
funded projects, with high labour and environmental protection standards enforced directly
by the EU.
Trajectories
Under this scenario, the socioeconomic environment of the Danube is believed to evolve
along the following trajectory:
- Financing (preference for large or small projects): mainly centralized and favoring large
projects.
- Economic redistribution and solidarity: there is an efficient mechanism of redistribution
across the EU.
- National governance, government efficiency: the central government is strong and
efficient.
- Community engagement: local community ties are weak.
- Capacity, knowledge, innovation: overall high capacity and knowledge, concentrated
in the “centres” away from “peripheries”.
- Entrepreneurial initiative: usually low. The economy is driven by large corporations.
- Societal responsiveness, awareness, participation: usually low.
Challenges
Lower Citizens’ commitment to environmental stewardship hinders the
effectiveness of measures relying on good behaviors. While the EU is strong
internally, its uniform top-down approach can be stifling for diversity and local democracy.
Centrally designed solutions are sometimes not optimally adapted to local circumstances.
The EU leans towards paternalism and both societal initiative and entrepreneurship are
depressed. Local interests cannot be voiced sufficiently, and are de facto not protected
when not apparently in line with the broad strategies designed at the central level. This
may cause deresponsibilization of the citizens and weaken their participation to the
stewardship of environmental resources. For instance, technological standards may rise,
but measures relying on responsibilization towards correct behaviours may be less
successful (e.g., home taps and flushes have high water efficiency standards, but people
tend to not take up responsible consumer attitudes, such as water saving).
A more selective agenda is influenced by powerful lobbies, choking bottom-up
innovation. A tendency in the centralization and uniformation of decisions, with reduced
entrepreneurship, tends to limit the capacity to invent innovative solutions and spread
good practices. Moreover, while protecting the immediate well-being of citizens, European
policies can be more easily influenced by large and powerful organizations, such as
corporations or NGOs, causing a bias towards the values they promote. For instance,
energy security and mitigation of climate change may push for actions potentially
damaging biodiversity, such as large hydropower schemes particularly in the Western
Balkans and other areas with still significant development potential.
In agriculture, competitiveness and food security may weigh more in the EU agenda than
environmental sustainability, leading to e.g., large investments in irrigation and water
reuse schemes coping with climate change, but little improvement on the side of diffuse
pollution and loss of biodiversity despite pleas for efficient fertilization and integrated pest
management. This may be of concern particularly for the Lower Danube basin, where
agricultural land still receives relatively low nutrient and pesticide inputs but has prospects
of expanding business and is a key European reserve. An energy and ecological transition
may be more difficult under a centralized strategy where investments are planned on
40 https://ec.europa.eu/commission/priorities/energy-union-and-climate_en

34
schemes favouring large plants over distributed generation, and maintaining a role for gas
supplies instead of pushing for bold decarbonization41.
Low priority is given to measures yielding community benefits at local scale.
Actions that need local political endorsement pushed by citizens’ support are less likely to
be taken up. In the implementation of the Water Framework Directive, for instance, while
pollution control at point sources is effectively enacted and pollution improves broadly
insofar as it depends on technical measures, hydromorphological restoration also leading
to local benefits (e.g. amenity and recreation) is often downplayed as a lower priority vis-
à-vis other investments.
Infrastructure is well managed in the “centre” but “peripheries” are at risk. The
situation is exacerbated by the drain of competences from the “peripheries” to the
“centre,” which further reduces the capacity of local communities to define and voice their
own agendas. This may cause difficulties in the operation and maintenance of complex
infrastructure especially in some regions, uncovering lack of robustness of technical large
scale solutions. For instance, under this scenario it would be possible to build large,
cutting-edge wastewater treatment schemes, but some communities might fall short of
properly managing them, or at least of reaping the additional benefits besides sanitation.
4.2 Scenario 2 - Tailor-made solutions
In this scenario we assume that the European Union becomes stronger (as in the previous
scenario), but its mode of action is less top-down (more subsidiarity).
Regions and cities gain autonomy and have more responsibility for the implementation of
strategies and investments. It is a “Europe of regions,” where nation-states give in to
territorial associations, sharing not only language or pre-EU history, but also economic
and environmental interests and sometimes culture and local governance. In this scenario,
regional shared agendas (gesellschaft) influence a feeling of regional community
(gemeinschaft) and, vice versa, regional identities more rooted in geography than in
national belonging stimulate the design of shared agendas.
In fact, Europe has had a strong regional or urban basis for most of its history. The Roman
Empire was essentially an area of self-governed cities under an umbrella authority
ensuring uniformity of the legal base, military protection and the security and effectiveness
of trade and supplies (Price and Thonemann, 2010). In the following centuries, cities and
regions engaged in harsh conflicts (e.g. the fights among medieval Italian Comuni) and in
alliances (e.g. the Hanseatic cities or the United Provinces of the Netherlands). This
occurred sometimes under overarching authorities (such as the Habsburg rule in the upper
Danube until World War I), but always on a regional basis until the emergence of nation-
states in the XIXth century.
More recently, the strengthening of European ties has unleashed aspirations for regional
autonomy throughout Europe – Scotland, Flanders and Catalonia being prominent
examples. These and other regions have sought self-government and autonomy from the
national government, while never questioning their European Union membership and, on
the contrary, supporting a strengthened role for the EU (e.g. in defense and foreign policy).
In this scenario, the EU acts as an overarching political body guaranteeing homogeneous
and safe conditions to develop interaction among regions (“incubator”). Some regions
have already experienced this situation in the past years, including Northern Ireland and
the Republic of Ireland, and Austria’s Land Tirol and Italy’s Südtirol.
The EU remains a single integrated market with a redistribution of funds between richer
and poorer regions so as to ensure more uniformity in the conditions of citizenship.
41 As an example of concerned voices over low prioritization of energy and ecological transition in
the EU budget, see https://www.euractiv.com/section/energy/opinion/eu-budget-wheres-the-climate-and-environment/

35
However, investments happen at a local scale, following decisions taken at regional or city
level. Reinforced powers of the regional level eventually deflate the nationalist waves
across the EU. An EU system is adopted in health care and social security, an area close
to the everyday concerns of EU citizens. Tax and pension systems are similar for all EU
Member States.
Strong regions may organize a very collaborative local economy, with many innovative
small private players acting locally or regionally in an open source spirit. Micro-investment
can be fully harnessed and the public sector can still be strong through services. Local
economies may stimulate short material loops and local currencies42. Coordination at EU
level works well thanks to community level instruments and key principles are respected;
However, a large degree of autonomy means that policies are implemented with flexibility
using specific solutions adapted to local circumstances and success or failure depend very
much on local conditions. Some regions are likely to become more successful than others,
with the possibility of economic migration across regions and a tendency for large cities in
successful regions to keep growing. More marginal and weaker regions may undergo brain
drain and loss of capacity and competence along with emigration to the advantage of more
attractive regions.
EU diplomacy on global issues pushes its core values but the EU's more circular economy
and shorter material loops have decreased its clout in international trade.
Trajectories
Under this scenario, the socioeconomic environment of the Danube is imagined to evolve
along the following trajectory:
- Financing (preference for large or small projects): financing is managed regionally and
favors small scale projects.
- Economic redistribution and solidarity: efficient redistribution and solidarity
mechanisms are in place.
- National governance, government efficiency: the central government is efficient but
has limited responsibility; regional governments are efficient.
- Community engagement: generally high.
- Capacity, knowledge, innovation: generally high and distributed in all regions.
- Entrepreneurial initiative: high.
- Societal responsiveness, awareness, participation: high.
Challenges
Difficulties in addressing basin-wide priorities. While ensuring uniformity of internal
rules and a common foreign policy, the context is not automatically favourable to regional
coordination as regions are empowered to address local problems. This may reflect
negatively in the targeting of real basin-wide priorities, with the better-off regions
achieving excellent environmental standards and those less well-off still struggling. Some
regions would be able to invest even in lower-priority actions, while others might fall short
of addressing even top issues due to lack of capacity or funding. Long-range environmental
issues (which are ubiquitous in Danube river basin management) requiring a large-scale
coordinated approach, especially regarding flood control, pollution and fish ecology, may
not be effectively developed by regions without a strong overarching coordination.
Duplication of efforts and races to the bottom. Lack of coordination may also increase
the potential for competition among regions and duplication of efforts. The degree to which
regions push environmental protection versus short-term economic activities may be
expected to vary in spite of common EU standards and political decision makers in regions
will often come to terms with the need to ensure prosperity in the short run at the expenses
42 Such as the “Bristol pound” contributing to this city being awarded the title of Europe’s green
capital in 2015. See https://en.wikipedia.or?g/wiki/Bristol_Pound

36
of sustainability in the long run in order to secure votes. Some regions may lower
environmental standards in the hope to attract investments.
Solutions too small for large problems. Investments are predominantly local, small,
lacking scale. Therefore, it may be difficult to trigger disruptive developments, making
Europe dependent on foreign innovation leaders. Projects requiring massive investments,
and sometimes guarantees such as public finance-backed reinsurance43, may become
difficult to implement or even impractical. In the water management sector, for instance,
this may result in difficulties to develop or upgrade wastewater treatment in large
agglomerations, to create large wastewater reuse projects and irrigation schemes, to
adapt to climate change by strongly expanding water storage capacity and to engage in
river restoration projects affecting large parts of the stream network.
4.3 Scenario 3 - Multinationals rule
In this scenario we assume that the EU gives up on the process of an ever closer political
union but wishes to preserve the Single Market. While the latter is essential to preserve
Europe’s economic relevance in a globalized world, the EU Member States have separate
and sometimes diverging or even conflicting agendas. The issues on which the EU
maintains an effective action relate mainly to standardization and ensuring uniform rules
across the Single Market. This corresponds to an elaboration upon “Scenario 2: Nothing
but the Single Market” in the European Commission’s White Paper on the Future of
Europe44. The difficulties in agreeing on a bolder common political project among EU
democracies after the 2007 crisis, coupled to the emergence of sovereignist political
movements across the EU may be indicative of this scenario.
With increased policy competences under a new subsidiarity regime, Member States may
be lobbied by multinational corporations. These corporations can also influence the public
through social (and other) media. Global supply chains are the main organizing structure
of the economy: multinationals promote the development of infrastructure (e.g., for the
transport and distribution of energy, telecommunications, large scale freight and industrial
ports, inland navigation, high speed trains and hyper-connected megacities) required for
a global market of goods and services. Countries, regions and cities struggle and compete
to be part of the “supply chain world”, upon which their success critically depends (Khanna,
2016). While the stronger and more knowledge-based EU economies remain core nodes
and house their own multinationals, the less advanced economies depend on direct foreign
investment45 and are more exposed to the impact of an increasing volatility of the assets
(ibid.).
While economically stronger countries maintain decent standards in public services,
education and welfare, poorer countries struggle. There, multinational corporations impose
the conditions required by their operations and supply chains. Besides infrastructure, they
support public services and education in so far as to ensure labour productivity and engage
in social protection to control social anger and opposition to the liberal economic order46.
43 A case in point is the Thames Tideway Supersewer (https://www.tideway.london) designed to
reduce combined sewer overflows in the river across London. Its exceptionally high costs and complexity of the undertaking would make low-probability risks non-reinsurable without a public
guarantee. 44 https://ec.europa.eu/commission/white-paper-future-europe_en 45 A significant debate in this respect has risen around the plan for a Belgrade-Budapest high speed railway, to be developed through Chinese investments. See e.g.
https://www.forbes.com/sites/wadeshepard/2017/02/25/another-silk-road-fiasco-chinas-belgrade-to-budapest-high-speed-rail-line-is-probed-by-brussels/#2a1cfa123c00 and https://www.forbes.com/sites/salvatorebabones/2017/11/27/chinas-bid-to-buy-eastern-europe-on-the-cheap-the-161-group/#4ba3d6b83467. 46 These are the grounds of Bismarck’s Staatssozialismus in end-XIX Century Germany, considered
as the origin of the modern welfare state. See e.g.
https://en.wikipedia.org/wiki/State_Socialism_(Germany)

37
Fiscal dumping enacted by poorer countries to attract the supply chains triggers a vicious
circle putting public services under pressure. Industrial automation leads to increasing
losses of low-qualified jobs and further pushes migration towards richer countries and
larger, more connected cities.
While the EU’s own budget is reduced compared to today, the European Investment Bank
(EIB) and other European financial institutions support investments in large infrastructure.
This opens opportunities mostly for large companies, often resorting to local
subcontractors only for less qualified tasks.
The Common Agricultural Policy (CAP) is also downsized and agriculture turns ever more
into a market-based business strongly influenced by seed, agrochemical and food
conglomerates. With climate change affecting water availability, irrigation water turns into
an expensive commodity supplied by large industrial companies. International investors
grab significant swaths of the best crop lands to engage in intensive production,
particularly in the Eastern plains of the region, where cereal crops for food and fodder are
very profitable. Small farmers cannot compete with large agribusiness, and many small
farmland owners are forced to sell their property and move to the city to make their living.
The EU remains a key market for the global economy with an overall high demand for
goods and services, but does not have a strong geopolitical influence. The Danube remains
at the forefront of external European borders, while the process of enlargement is virtually
stopped and the Western Balkans remain outside the EU. Migration pressure from the
Middle East, Africa and Central Asia towards Upper Danube countries is still strong and the
lower Danube is a transit region. Individual countries enact their own migration policies,
thus fuelling political tensions among EU countries.
Trajectories
Under this scenario, the socioeconomic environment of the Danube is imagined to evolve
along the following trajectory:
- Financing (preference for large or small projects): multinationals and investment banks
are the main actors, and favor large scale investments instrumental to the global
supply chains.
- Economic redistribution and solidarity: generally low.
- National governance, government efficiency: generally weak.
- Community engagement: generally low.
- Capacity, knowledge, innovation: concentrated in nodes of the global supply chains.
- Entrepreneurial initiative: generally low.
- Societal responsiveness, awareness, participation: generally low.
Challenges A world of grey infrastructure? In this scenario, the game is led essentially by large
companies. This generally implies that technologies and infrastructure are well developed
and the water sector is highly industrialized. Water management relies on engineering
measures while nature-based solutions exploiting ecosystem services are less extensively
exploited because they yield no or limited revenues to investors. For example, artificial
flood defences tend to be preferred to floodplain reconnection or large industrial
wastewater treatment plants are preferred to natural treatment systems. Technologies
enable pollution reduction and resource efficiency improvements, but they also induce
rebound effects as they promote increased use of the same resources. All aspects of water
and environmental management that rely on people’s awareness of good practices (e.g.
water-saving household behaviour or not disposing pharmaceuticals down the drain) are
difficult to be brought forward. Investments are targeted towards maximizing corporate
revenues and not necessarily towards applying the most cost-effective solutions for the
environment. For example, engineered flood defences might be oversized and not
designed to minimize impacts on floodplains and vegetation. In other cases, centralized

38
wastewater treatment with large development of sewage networks would always take
precedence over decentralized systems and nature-based solutions. Moreover, while the
contracts for the construction of large facilities may be profitable for large companies, their
maintenance and operation may be much less profitable, which can turn them into
expensive “white elephant” installations.
Hard times for nature? Local communities become less relevant due to the break down
of the relationship between cities and their countryside. While city centres improve and
house the headquarters of the economy, peripheries and the hinterland fall prey to urban
decay, with less and worse public services. Ecological protection and restoration are only
implemented where they serve the real estate, tourism or recreation industries. However,
people continue to aspire to a “green” lifestyle. Therefore, the demand for nature
conservation is still strong, but from a much more utilitarian perspective. Ecosystem
services such as recreation in natural water bodies tend to either be marketed (e.g. by
privatizing riparian land and access to lakes and beaches) or surrogated by artificial
landscapes (e.g. green urban areas or landscaped swimming pools). The lack of
investment in multifunctional water management solutions such as public green
infrastructure in cities deepens the hiatus between human communities and water
ecosystems. Ecological conditions improve significantly in marginal and mountainous areas
of the Lower Danube where insufficient land productivity hinders investments in large scale
farming and land is abandoned47. Exodus from poorer regions may allow the countryside
to recover a certain degree of naturalness but forests in the plains of the Lower Danube
are often turned to productive farmland. Navigation is still important, both for freight and
for tourist cruises, which creates a demand for maintenance and development of
infrastructure with associated ecological impacts on the Danube river system.
As an illustration, when the competent authorities lack capacity to establish and enforce
appropriate permitting conditions for hydropower plants (which can apply in poorer
countries, a fortiori when these compete to attract investments), they may be unable to
impose adequate mitigation and compensation measures during administrative procedures
such as the Environmental Impact Assessment (EIA) of projects.
Water privatization? The management of the water cycle, from supply to wastewater
treatment, is operated under full cost recovery, explicitly excluding state intervention and
limiting the government’s action to regulation. This leads to a takeover of the water
services by large companies, weakening the democratic control of water management (as
for how tariffs are calculated, how vulnerable groups are protected, etc) in those countries
where the government does not possess adequate technical expertise and where politics
are more permeable to corruption. In principle, national governments must ensure control
of the management of public services. However, companies may have the capacity to
make their interests prevail: in this case, contrary to the assumptions of neo-liberal
economic thinking, tariffs tend to increase, the quality and coverage of services tends to
decrease, especially where the quality of institutions is lower and government corruption
is higher. Under this scenario, water metering, pricing and trading are the most common
tools used to promote water use efficiency under resource constraints. Controlling and
charging for water use may lead to significant reductions in industrial, energy and public
water use. However, experience has shown rebound effects (water uses tend to increase
despite higher use efficiency, e.g. in irrigation: Li and Zhao 2018).
Weaker citizens’ stewardship for water. Public perceptions of water as a natural
resource, public service or commodity may also have an impact on behaviours, particularly
regarding water consumption and saving. The EU Water Framework Directive
(2000/60/EC), in its Article 9, requires that Member States ensure the implementation of
47 An extreme, but informative example of what could happen to ecosystems just through land abandonment is the ecological succession in the post-nuclear disaster Chernobyl (Ukraine): wildlife has bounced back to quasi-pristine conditions, although the impacts of radiation on the different
populations and ecosystems remain debated. See http://www.bbc.com/earth/story/20160421-the-chernobyl-exclusion-zone-is-arguably-a-nature-reserve.

39
pricing policies that provide an incentive to use water efficiently. Article 9 also requires
cost-recovery (including environmental and resource costs) for water services, taking into
account the 'polluter pays' principle. People collaborate less in what is a more competitive
and unequal society. Individuals tend to care less for the environment if this does not
generate a direct personal benefit. Therefore, public participation and engagement become
generally weaker, triggering a vicious circle. Low awareness and proactivity of citizens and
communities generates low societal control of policy decisions and low accountability of
the decision-makers, which can cause an overall reduction of resources, particularly for
environmental management.
Basin-wide priorities slip out of the agenda. The consistent, integrated management
of water resources at the river basin scale is no longer in the agenda. The focus is on
ensuring water availability to the nodes of the global supply chains that need it as a critical
asset for their operation, irrespective of downstream and transboundary impacts.
4.4 Scenario 4 - Small-scale interventions The previous scenario of continuing and undisturbed globalization has been sometimes
judged less likely compared to that of a more multipolar world, with Europe being one of
the poles48. In this scenario, we imagine European countries as part of a less global world,
a European Union weakened by the unleashing of nationalism and Euro-skeptical forces,
and political perspectives becoming increasingly national. It is the EU "à la carte"49,
operating more according to the intergovernmental method (direct negotiations among
Member States) than the community method (within the Treaties). EU action is reduced
to the lowest common denominator. The general trend is of more inward looking
perspectives. The weaker EU framework gives space to Member States to negotiate
political and commercial agreements with foreign countries50 bypassing de facto the EU
level. As a result, the international standing of the EU weakens, and the rapid development
of other economies such as India or China gradually dwarves the EU economies.
The consequence of these weakened EU ties is a smaller integrated market and more
competition between Member States. A reduced EU clout has also reduced the ability and
desire to redistribute funds from rich to poor countries. EU funding is limited to selected
initiatives and Member States have a large leeway in deciding how to use them. Large EU
scale projects have been practically abandoned.
National and regional governments want to steer industrial development and attract
investments from large companies, but also want investments to generate employment
locally. Succeeding in this depends essentially on the attractiveness of a country’s business
environment, including know-how, infrastructure, public services, fiscal and administrative
burden and corruption. Moreover, the scale of individual countries may be too small to
finance effective research and development and keep the pace of global innovation. While
some regions and countries remain strong and compete successfully at global level, many
others decline. In the Danube river basin, only a few regions remain successful. This
weakens both the private sector and the capacity of governments to resort to debt to
finance public investments. In this context, unemployment grows.
48 These are the storylines proposed in two reports by the Credit Suisse Research Institute, “Getting over globalization”, 2017: http://publications.credit-
suisse.com/tasks/render/file/index.cfm?fileid=BCD82CF0-CF9D-A6CB-BF7ED9C29DD02CB1; and “The end of globalization or a more multi-polar world”, 2015: http://publications.credit-suisse.com/tasks/render/file/index.cfm?fileid=EE7A6A5D-D9D5-6204-E9E6BB426B47D054 49 “[…] A non-uniform method of European integration which allows EU countries to select policies, as if from a menu, and involve themselves fully in those policies. The EU would still have a minimum number of common objectives. However, different countries would integrate at different levels (variable geometry) or at different speeds (multi-speed). Europe ‘à la carte’ is already a reality with some countries being part of the eurozone and others not.” http://eur-lex.europa.eu/summary/glossary/europe_a_la_carte.html 50 A looming model of this kind may be seen in the China-Central and Eastern European Countries Cooperation (http://www.china-ceec.org/eng/)

40
Investors from both rich European countries and from outside Europe grab highly
productive land in poorer countries and snatch contracts for public works or concessions
for financially attractive public services. Poorer countries and regions cannot support the
development of local business. Many companies disappear or reduce their ambitions, while
agriculture remains a relatively healthy sector, attracting new employment. There is a
mushrooming of micro-enterprises as people try to make a living for themselves. National
governments make efforts to favour the procurement of national products. This leads to
many market restrictions and breeds unemployment. The brain drain from poor to rich
countries reinforces inequalities across the EU. The lower Danube countries see their
population decrease. Underfunded social services and national education systems show
signs of disruption.
The civil society is generally able to pressure the government, and public participation in
national and regional politics is quite broad. The social fabric is resilient: increased poverty
and the reinforcement of national identities stimulate local connections. However,
solidarity develops more in the poor than in the rich regions. In the former, lifestyles
become simpler and there is less consumerism. This does not necessarily stem from higher
environmental awareness, which has decreased in poor regions, but green options often
prevail as they are more affordable. This is the case, particularly, for urban agriculture
and the re-greening of abandoned industrial sites51. Also, thanks to new technologies,
renewable energies allow access to electricity and are generally developed at the level of
small plants. Hydropower, particularly, grows almost exclusively through micro-plants,
while larger plants are only operated by the few large enterprises remaining on the market.
Large scale technological innovation is on the decline as people and small companies look
for cheap small scale solutions.
Trajectories
Under this scenario, the socioeconomic environment of the Danube is imagined to evolve
along the following trajectory:
- Financing (preference for large or small projects): national governments manage public
expenditure programmes and seek partnerships with foreign investors.
- Economic redistribution and solidarity: national governments strive to keep a
redistribution policy but are limited by their spending capacity.
- National governance, government efficiency: varies, depending on countries.
- Community engagement: varies, depending on countries.
- Capacity, knowledge, innovation: varies, depending on countries.
- Entrepreneurial initiative: generally high.
- Societal responsiveness, awareness, participation: varies, depending on countries.
Challenges The countryside is relatively healthy but urban areas are under pressure.
Environmental impacts tend to decrease in less populated regions, where the demand for
resources is less concentrated and it is possible to manage waste through nature-based
solutions (e.g. constructed wetlands to treat wastewater, or composting of municipal
waste). On the contrary, lack of capacity to develop technological solutions and to fund
the operation of complex treatment plants hampers waste and wastewater management
in large cities, leading to increased environmental degradation.
A prisoner’s dilemma: blunt instruments against long-range issues. Resource
consumption decreases in general, due to more limited economic activities. In richer
regions, local environmental management is still at high standards but there is far less
concern for the effects of externalities and the transfer of pollution to other regions, or the
51As in the case of post-industrial Detroit - e.g. http://www.miufi.org/america-s-first-urban-agrihood

41
depletion of resources at global scale. The systematic allocation of resources within a
national logic may lead to inefficiencies and lead to overall higher environmental impacts.
For example, one country might decide to build a water intake on a river, even if its value
added is largely exceeded by the negative impacts on navigation downstream, which could
be borne by other countries. Climate change mitigation cannot be effectively pursued. In
this scenario, we are facing a kind of prisoner's dilemma52: while everyone benefits from
the overall good quality of the Danube River, single actors might want to benefit
proportionally more to everyone's detriment.
Poverty traps in environmental management. The general closure of national
economies, favouring local against international suppliers of services and goods, may
reduce the potential for innovation, reduce the scope for economies of scale and take up
of good practices. Smaller and poorer countries and regions may find difficulties in
investing in environmental services, thus further reducing their attractiveness in a vicious
circle. This vicious circle may have ripple effects on richer countries and regions affected
by less stable and wealthy neighbours.
52 See e.g. https://plato.stanford.edu/entries/prisoner-dilemma/

42
5. Implications of the scenarios for the Danube River Basin
Management Plan
Discussion with the experts convened at the workshop, on the implications of the four
scenarios, enabled us to identify emerging challenges relevant to water management. The
DRBMP rests on measures that can be classified in three broad categories: wastewater
treatment, agricultural diffuse pollution, and hydromorphological alterations. In the
following table, we summarize the challenges that we identified for the implementation of
measures. These challenges are further discussed with reference to each category of
measures.
Scenario Wastewater treatment
Agricultural diffuse pollution
Hydromorphological alterations
1 - Large scale coherence
Large WWTPs too complex to manage locally?
Decentralized plants too small for funding?
Lack of enforcement capacity?
Rebound effect of high-productivity agriculture ?
Competitive agendas (e.g. hydropower, navigation) limiting restoration only to iconic sites?
2 – Taylor-made solutions
Difficult to finance ambitious advanced treatment plants (e.g. pharmaceuticals) ?
Risk of race to the bottom?
Ambitious projects (e.g. dam removal) difficult to finance?
3 – Multinationals rule
Worsening of scenario 1 Industrialization of agriculture?
Lacking motivation of investors?
4 – Small scale interventions
Worsening of scenario 2 Between scenario 2 and scenario 3
Lack of basin-wide perspective?
Table 2 – Summary of the challenges anticipated for water management under the 4 scenarios.
5.1 Challenges for wastewater treatment: too small, too complex or only for the rich?
Under scenarios favouring small-scale investments, there may be a shortage of
investments in sufficiently large plants enabling to tackle emerging issues such as energy
and materials recovery or the treatment of hazardous chemicals. On the contrary,
scenarios favouring large-scale investments may generate situations where large and
complex plants do not match the actual operation capacity available in the different
regions. Scenarios 3 and 4 may generate situations where wastewater treatment, in itself
an expensive public service, turns unaffordable for the poorest segments of society.

43
The DRBMP stipulates a stable programme of financing and implementing wastewater
treatment. However, the European Court of Auditors 53 has already stressed that the
implementation of the Urban Wastewater Treatment Directive proved difficult and slower
than planned (see box below). In each of the abovementioned scenarios, there are threats
that wastewater treatment advances less than stipulated by the plan.
Main findings of the European Court of Auditors on wastewater treatment in the
Danube:
- The European Regional Development Fund spending during the 2007‑2013 programme
period played a key role in bringing forward wastewater collection and treatment but was
not sufficient to meet the deadlines on waste water treatment.
- The funds available under the programme were absorbed slowly and the indicators in
the operational programmes do not allow reconciliation with the progress achieved in
implementing the Directive.
- Around one third of the urban wastewater treatment plants co-financed by the EU were
oversized (even when taking into account planned future connections).
- All of the wastewater treatment plants examined handled the sludge appropriately,
except for one Member State. However, binding requirements on pollutants for all sludge
uses were missing.
- The attained degree of financial sustainability of EU co‑financed infrastructure was not
fully satisfactory.
Under Scenario 1 “Large scale coherence,” a centralistic approach prioritizing large
infrastructural investments may lead to effective construction of plants, but may run short
of competence to manage plants in some regions. In certain areas of the Danube, where
centralized wastewater treatment plants are not economically feasible due to the high cost
of collecting sparse rural settlements, there may be a lack of capacity to ensure a correct
implementation of decentralized plants and individual appropriate systems in smaller
agglomerations.
Under Scenario 2 “Tailor made solutions,” large investments required e.g. to treat
emerging contaminants in existing wastewater treatment plants, or to remove combined
sewer overflows in large urban areas would be more difficult due to the generally smaller
scale of action. On the contrary, decentralized plants are expected to receive more
attention. Securing large budgets for wastewater treatment plants will be generally a
challenge. Similar considerations apply also to mining sites, contaminated sites and
industrial emissions.
Scenario 3 “Multinationals rule” presents a worsening of the same trends of Scenario
1, while Scenario 4 “Small-scale interventions” a worsening of Scenario 2. Contrary
to Scenarios 1 and 2, these cannot count on the buffering and redistribution capacity of
European cohesion funding. Therefore wastewater treatment is only affordable where it
pays off.
5.2 Challenges with diffuse pollution: who cares? Under the different scenarios, tackling diffuse pollution may be hampered by lack of public
engagement and political endorsement, failure to value what it delivers, or reliance on
impair-then-repair technological fixes (Vörösmarty et al. 2010).
53 Special Report EU‑funding of urban waste water treatment plants in the Danube river
basin: further efforts needed in helping Member States to achieve EU waste water policy
objectives, European Court of Auditors, Luxembourg: Publications Office of the European Union, 2015 https://www.eca.europa.eu/Lists/ECADocuments/SR15_02/SR_DANUBE_RIVER_EN.pdf

44
The plan stipulates a broad uptake of good agricultural practices concerning nutrients and
pesticides (although the latter are not presently identified as a significant water
management issue). Pollution associated with urban drainage is not specifically addressed.
However, the European Court of Auditors54 has already found that Member States are not
applying the Nitrates Directive to full potential nor are they planning much beyond “basic
measures” of the WFD, with Nitrate action plans lacking ambition and a difficulty to
establish and enforce standards for agricultural practices effectively reducing nutrient
pollution.
Impair-then-repair: the environmental Kuznets’ curve. The environmental Kuznets
curve is a hypothetical relationship between environmental degradation and income (or
GDP) per capita according to which pollution emissions and other human impacts on the
environment would increase in the early stages of economic growth. Beyond some level
of income or GDP per capita, though, the trend would reverse so that, at high income
levels, economic growth would lead to environmental improvements. This would impy that
environmental impacts (such as pollution emissions per capita) are a bell-shaped function
of GDP per capita (Figure 13).55
Figure 13 – an environmental Kuznets’ curve.Source: Wikipedia, reused under the Creative
Commons Attribution (CC-BY) 3.0 License.
Vörösmarty et al., 2010, point at the extreme inefficiency of this impair-then-repair
process, arguably to be avoided through “green growth” as a more efficient alternative:
indeed, the apparent local environmental improvement referred to by this model is often
the result of increased energy use through end of pipe technologies locally (with the known
climate change consequences) and transfer of dirty activities to poorer countries thanks
to "free trade" (operating at lower environmental standards elswhere) rather than a true
improvement.
Any society not incorporating from the onset a wise management of the environment in
its economic strategy, when reaching a certain level of well-being is bound to face a
54ECA Special report no 23/2015: Water quality in the Danube river basin: progress in implementing the water framework directive but still some way to go. https://www.eca.europa.eu/Lists/ECADocuments/SR15_23/SR_DANUBE_PROGRESS_EN.pdf 55 Http://oxfordre.com/environmentalscience/view/10.1093/acrefore/9780199389414.00
1.0001/acrefore-9780199389414-e-401
45
problematic choice between investing in impact mitigation (highly inefficient) or
transferring impacts elsewhere (not sustainable and unfair).
Generally speaking, 'diffuse pollution' can be characterized as pollution without a well-
identified individual responsible, in contrast with 'point pollution' which is attributable to a
liable subject. Diffuse pollution results rather from a multitude of individual behaviours,
and it can only be tackled by modifying those behaviours. Traditional instruments to tackle
this include economic incentives and the enforcement of prohibitions.
The centralistic setup of Scenario 1 “Large scale coherence” may lack appropriate capacity
to enforce prohibitions at the local scale, and may consequently need to rely on economic
incentives. A highly centralized management of the Common Agricultural Policy (CAP), for
instance, may be ideal to reward farmers under a strict condition of compliance with good
agricultural practices. At the same time, the large scale of investments under this scenario
may favour agricultural productivity and competitiveness over sustainability, causing a
rebound effect in fertilizer use due to higher quantities applied in spite of compliance with
good practices.
Scenario 2 “Tailor-made solutions” seems the most favorable to tackle diffuse pollution
particularly from agriculture. A higher circularity of the economy may favor recovery of
nutrients from wastewater and a higher overall fertilizer use efficiency.
Scenario 3 “Multinationals rule” is the most at risk that agricultural practices align with
standards of high productivity, with a possibility that nutrient pollution increases.
Scenario 4 “Small scale interventions” may positively evolve as Scenario 2, but may also
give way to land grabbing by large multinationals in the poorer countries.
5.3 Challenges with hydromorphological restoration: good to have, but just a little
In the different scenarios, hydromorphological alterations may be perceived as less
important than water quality and quantity due to the fact that their impacts to the economy
are less immediate. The commodification of water ecosystem services may justify e.g.
river or floodplain restoration only at sites with a high scenic, touristic or recreational
value. In other circumsances the alternative of grey infrastructure to cope e.g. with flood
hazards may be preferred and there may be difficulties in the coordinated management of
river morphology (e.g. for flood protection and sediment supply) due to lack of
transboundary cooperation.
Under Scenario 1, lobbies may push competitive agendas (such as hydropower and
navigation), while river preservation or restoration may be limited only to the best sites in
terms of natural and scenic richness.
Under Scenario 2, restoration projects may lack scale and ambitious projects (such as dam
removal or large scale floodplain reconnection) may be difficult to finance. Moreover,
certain regions may be tempted by a “race to the bottom” and accept exemptions to
hydromorphological quality objectives in the name of economic development.
Under Scenario 3, hydromorphological restoration may attract limited interest by investors
in the absence of a bold and stable funding mechanism. On the contrary, the reasons of
the global supply chains may tend to push for logistics (hence possibly navigation and
anyway infrastructure in the floodplains) eventually conflicting with habitat restoration
goals.
Under Scenario 4, governments may fail to identify common objectives for large scale
coordinated actions (e.g. for flood mitigation or fish migration) and hydromorphological
restoration unrolls at the local level where conditions may be favourable, but fails to
upscale to mainstream practice.

46
6. Actions to improve long-term water management in the
Danube River Basin
The four scenarios examined above are built on a centralization/decentralization axis, and
an axis of reliance on large infrastructure/local solutions. These axes do not necessarily
have a “positive” and a “negative” extreme. On the contrary, all extremes have some
drawback requiring anticipation and mitigation. We may argue that balancing mechanisms
that help maintain a mid-way trajectory could be most beneficial to water management in
the region.
Balancing mechanisms between centralization and decentralization include empowered
local communities (preventing the excesses of central decision making), and basin-wide
integration of water management (preventing inconsistency of decisions and conflicts
among upstream and downstream regions).
Water management has a technical side, usually catered for by specialists, but also a
community side, increasingly recognized as a key component for its success (Pistocchi,
2018, 2019). This has to do with the capacity of people to realize the benefits they can
receive from good water management and to steer the water management agenda
accordingly through solutions that best meet local needs, possibly delivering multiple
benefits. Under scenario 1 (large scale-coherence) and scenario 3 (multinationals rule)
decision making is centralized and communities are possibly ousted from their steering
role. Under scenario 2 (taylor-made solutions) and scenario 4 (small scale interventions),
communities may on the contrary be a key actor and need to be effective. Effective
communities may buffer the impacts of centralized decision making (see Scenario 1),
mitigate the harshness of competition in the global supply chains (Scenario 3), and voice
their needs more audibly (Scenario 4). When communities hold important decision powers
(Scenario 2), their capacity to look forward and face sustainability challenges is stronger.
Basin-wide integration is a crosscutting need of the economy of the Danube, due to the
dependency of the various economies on shared water resources, particularly in sectors
such as such as tourism, inland fisheries, navigation, energy, etc. Continuity of basin-wide
water resources management is therefore necessary irrespective of how the society and
economy will evolve, and has been a subject of political concern well before the
establishment of the ICPDR 56 . The harmonization of social, political and economic
conditions in the whole Danube basin may help create the conditions for a broadened
market, including for water services; the strengthening of political and economic bonds
among Danube countries may support peaceful and collaborative management of
resources under all scenarios. Basin-wide organizations and initiatives, including the
ICPDR and the EUSDR with associated funding mechanisms, are pivotal for capacity
building, knowledge transfer and financing of investments of basin-wide interest.
In order to strike a balance between large and small infrastructure investments, the
appetite of investors for large engineering works can be moderated by making investments
in nature conservation and nature-based solutions attractive.
Nature conservation is a precondition to halt biodiversity loss, and is acknowledged to be
a prime goal of water management. Bringing nature protection to the core of strategies
helps escaping the inefficiencies of “impair-then-repair” cycles often triggered under
technology-reliant Scenario 1 and Scenario 3, by shaping more robust and sustainable
solutions and focusing investments on the integrated promotion of the quality of life. Under
less technological Scenario 2 and Scenario 4, nature-based solutions appear more
affordable and fit the scale of decision making more efficiently. Finally, climate change is
projected to reduce availability of water resources, particularly in summer and for the
lower Danube. Moreover, models identify a trend of increasing floods under climate change
56 For a succinct history of the international agreements for the management of the
Danube river since the XIXth century, see e.g.
https://en.wikipedia.org/wiki/Commissions_of_the_Danube_River
47
(see §2). To cope with these conditions, robust nature-based solutions may take even
higher importance to increase resilience.
We argue that communities, basin-wide integration and nature conservation are three
main areas for actions useful under all scenarios to improve long-term water management
in the Danube River Basin. We suggest that coordinated actions in these three areas may
substantially strengthen the possibility to effectively implement the Danube river basin
management plan and to keep pace with its vision.
Translating these areas of action into concrete policy recommendations requires further
elaboration. In the following, we illustrate some possible lines of development. Some
require initiatives at higher (EU or global) level but many could be considered for
implementation in the Danube also as a frontrunner or pilot for other areas in the EU.
6.1 Developing effective communities
Policy-making and governance: empowering the work of communities. A
governance model suggested by some as a good example of community-based water
management is that of the Dutch Water Authorities57. These are steered by an elected
governing board with representatives of all stakeholders (residents, farmers, business,
owners of natural areas) and are responsible for flood protection, water quality and
quantity control, groundwater protection and other management activities. They have an
independent budget and a dedicated financial institution – the Nederlandse Waterschaps
Bank (NWB). This structure may enhance people's participation to decisions on water,
stimulate networking and the formation of alliances among different stakeholders,
eventually supporting the creation of win-win solutions delivering multiple benefits. A
strong feeling of community can foster new models of economic development valueing the
local natural capital, including water. Good water management has clear potential to
support tourism and recreation58, improve quality of life and attract economic activities.
The Dutch model could be suggested for implementation at the scale of aggregates of
municipalities (e.g. counties, provinces or smaller sub-basins) throughout the Danube.
Beyond GDP and the ecological transition: the role of communities
Degrowth and post-development theory59 are gaining ground in economics and provide
increasing arguments to orient real-world policy making.
Gross domestic product (GDP) is a well-established indicator used to determine the health
of a country's economy by placing monetary value on all goods and services produced
over a specific period. Nonetheless, more and more attention is being given to the
development of aspects that are more inclusive of environmental and social aspects of
progress60 such as the stock and quality of natural resources (e.g. forests, minerals,
agricultural land) and human development (e.g. education, earnings, health).
In a world increasingly characterised by fast environmental change, uncertainty and
political instability, the paradigmatic model of consumerism and other market-based
solutions is being challenged. The detrimental consequences for the environment, social
fabric and the economy of a consumption based economic model are giving rise to new
manifestations of ecological transitions largely moved by communities. Dion, 2015 and the
57 https://www.dutchwaterauthorities.com/wp-content/uploads/2015/05/Water-Governance-The-Dutch-Water-Authority-Model1.pdf 58 Switzerland features a strong public support for clean rivers also based on their recreational use.
See e.g. https://www.limmatschwimmen.ch/ 59 https://en.wikipedia.org/wiki/Postdevelopment_theory 60 At the level of international institutions, several intiatives exist namely the Beyond GDP initiative, at the European Commisison (http://ec.europa.eu/environment/beyond_gdp/index_en.html ) and the Wealth Accounting
approach, at The World Bank (http://www.worldbank.org/en/news/feature/2018/01/30/moving-beyond-gdp-to-look-at-the-world-through-the-lens-of-wealth ).

48
documentary Demain, 201561 showcase concrete examples of solutions from 10 countries
to environmental and social challenges in agriculture, energy, economy, education and
governance based on a bottom-up approach. Having a rather optimistic outlook, the
documentary reveals cities that produce their own food and energy, zero-waste systems,
business people and towns creating their own currency to prevent speculation and the
appropriation of wealth, citizens rewriting their own constitution and pioneering
educational systems.
Well-functioning communities are the natural context where collaborative voluntary
agreements, such as river contracts, can be developed. These are voluntary agreements
in the form of contracts among public and private actors in a river basin, defining concerted
actions aimed at improving the conditions of rivers while securing economic activities (see
e.g. Scaduto, 2016). River contracts are a well established part of the French river basin
management processes since the 1980s and are spreading in several European countries,
including Belgium, Spain and Italy, as a potentially good practice to bring together actors
and share responsibilities around concrete river basin management problems. The
strengthening of communities is a way to promote collective action which is found to be
often effective in delivering public goods and environmental benefits particularly in
agriculture (OECD, 2013).
Embedding water in the political agenda of communities. Cities create critical
challenges in water management. In view of the ongoing trends in climate change and
urbanization, they must increase water resilience, secure water quality and quantity. This
requires a long-term commitment of the administrators beyond their specific political
mandate and partisan positions. In the context of climate adaptation and renewable
energy, the Covenant of mayors 62 has attracted considerable attention as a way to
stimulate the uptake of commitment and good practices at community level. This action
could be expanded to cover water management. One example in this direction comes from
the city of Malmö63.
Promoting healthy lifestyles and a culture of living well within environmental
limits. Stronger communities may facilitate the emergence of more circularity by
stimulating local recovery, reuse and recycling of resources. In particular, this requires
strengthening environmental awareness including sustainable food habits based on diets
with more local products and generally more frugal and environmentally friendly consumer
behaviours. Promotion of healthy lifestyles, including outdoor recreation and sports, can
be an effective instrument to support an agenda of river restoration, e.g. with cycling
paths and cyclo-tourism along the rivers.
Promoting healthy lifestyles and outdoor life: a focus on rivers and cycling.
The Danube cycle path runs from the river's source in Germany down to the Black Sea
(about 2,900 km). It provides cycling holidays opportunities from leisurely paced cycling
to road cycling. It is a spacious cycle path, perfect for solo travellers, families and bigger
groups of cyclists (https://www.danube-cycle-path.com).
Progetto VENTO is a cyclotouristic project along the river Po in Italy. With 700 km of
bike paths, it plans to be the longest in the country. Its vision is to connect a large territory
and regenerate it by reviving economy, identity, dignity, social connections etc.
(http://www.progetto.vento.polimi.it/tracciato.html).
EuroVelo is the European Cyclists Federation's cycle route network, managed in
cooperation with national and regional partners. It incorporates cycle routes into a single
European network of 15 bike routes extending over 45,000 km across Austria, France,
Germany, Hungary, Serbia, Slovakia, Switzerland and the UK. It is planned to reach
61 https://www.demain-lefilm.com/en 62 https://www.eumayors.eu/ 63https://malmo.se/Nice-to-know-about-Malmo/Sustainable-Malmo-/Climate-change--Energy/Climate-adaptation.html

49
70,000 km when completed. The international status of the routes helps with garnering
funds and political support for continuing construction (http://www.eurovelo.org/).
The Social Biking project (S-b) is an internet based intervention project, coordinated
by the European Commission’s Joint Research Centre, aimed at motivating European
citizens to be more physically active and to use more environmentally sustainable forms
of transport. Designed to collect data on biking and social networks and identify the most
efficient social-based incentives for physical activity, the project uses a tracking app for
bikers, the BikePrints app, which allows users to form interactive groups and track their
rides to earn jointly points and prizes (https://socialbiking.jrc.ec.europa.eu).
Looming cross-sectoral alliances to create win-win solutions. While investments
typically respond to sectoral agendas (e.g., energy, agriculture, transport, industrial
production, public healthcare), communities may be the place where relationships between
sectors in the economy are strengthened by recognizing the win-win opportunities of
collaboration. For instance, agribusiness may be conflicting with tourism due to the water
quality impairment caused by fertilizers. However, combining the sustainability of
agriculture with the quality of the landscape can be powerfully attractive for the branding
of local products and instrumental for shifting the value of production from mere bulk value
to quality (also thanks to a raised awareness on dietary health and responsible
consumption).
An obvious example of a possible alliance is flood protection through natural wetlands and
floodplain reconnection, which can be linked to regional tourism and recreation.
In drinking water supply, alliances among water utilities and farmers have proven effective
in the case of Munich (Grolleau and McCann, 2012), where farmers in the Mangfall valley
have been involved in payment schemes to protect drinking water sources.
The Water for Life and Sustainability Fund in the Cauca Valley of Colombia64 highlights the
use of Natural Capital Project tools in the development of water funds. The Water for Life
and Sustainability fund grew out of a programme originally implemented in the Cauca
Valley in the 1980s as part of a national watershed management strategy. In 2015, it
included 20 sub-watersheds along the eastern slopes of the Cauca Valley. In addition to
sustainable agricultural water supplies, the objectives of the fund include biodiversity
conservation and improved living conditions in participating communities.
6.2 Basin-wide integration
Strengthening the economic sectors more closely related to healthy rivers.
Expanding the economic relevance of the activities that rely on overall good status of the
whole river basin is one way to reduce conflicts about transboundary issues. The negative
effects expected under this scenario may be mitigated if the economic activities of any
country depend significantly on the overall good state of the environment in a broad
region. This may be the case of environmental tourism and the bio-economy, such as
inland fisheries, where good conditions of riverine ecosystems in the whole river basin are
in the interest of all due to the need of fish to migrate both upstream and downstream.
Similarly, the interest of all operators involved in international navigation for a continuous
operation along the whole Danube may stimulate the adoption of appropriate restoration
measures aimed at reducing conflicts and securing support from other stakeholders.
Strengthening pluralism through networking. It is essential that policies
underpinning investments benefit from intensive consultations with the broadest possible
relevant instances of society in order to secure appropriate means to address river basin
management issues. For example, if the lobby of the renewable energy sector is strong, it
64https://www.naturalcapitalproject.org/wp-content/uploads/2015/11/WaterFund_Case_Study_Cauca_22Sep2015_eng.pdf

50
is likely that the arguments of climate change mitigation and energy security (pushing e.g.
for hydropower development) take precedence over those of nature protection (pushing
e.g. for river hydromorphological restoration). In order to ensure that all issues are tabled
with adequate voice, basin-wide networks of stakeholders should be encouraged to form
and participate to the Danube institutions. Often such networks may involve very different
sectors of society and the economy, benefitting from certain initiatives from different
points of view. For instance, beneficiaries of nature conservation initiatives may include
citizens (recreation and health benefits from access to green areas), tourism, the real
estate market witnessing property price rises connected to green areas, the angling sector
and inland fisheries. Actors from these areas may be more or less fragmented, but they
need to be ready to defend their interests at a centralized level. Therefore it is important
to strengthen networks such as associations of citizens or sectorial organizations of
entreprises. Networking is also a vehicle to generalise access to competences and
capacities.
Entreprises with a capacity to operate beyond their doorstep. Policies entailing
large scale investments may be effectively harnessed to implement transnational
measures. A stronger European cooperation scenario would guarantee less friction in
targeting investments where actually needed, with less or no constraints due to the
variations in the legal and regulatory context among countries. This would also help reduce
inequalities within the Danube region in terms of capacity to invest in environmental
protection. A critical aspect towards distributing opportunities among countries and
regions is the size and capacity of entreprises to operate beyond borders. This requires a
critical mass which could be achieved through targeted mergers and acquisitions. Also
under a scenario where the global supply chains play a strong role, an important aspect
of preparedness lies in promoting the capacity of local economic actors by upscaling their
activities to compete in the market and to be organized to take action at the formal level
(for example, in the form of court cases). This is the case of, for instance, cooperatives of
farmers which negotiate sale prices of their produce or purchasing conditions of fertilizers,
pesticides, irrigation water, etc. Consortia can also be established with different sectors to
promote innovative business models (e.g. agricultural production with treated wastewater
reuse). Consortia of small companies or farmers may be able to negotiate access
conditions also to the regional navigation infrastructure of the Danube (organization of
harbours, logistics etc.).
Stepping up transboundary investments in river basin management. Another
aspect of critical importance is the interconnection among countries in terms of
infrastructures on the model of energy transmission and oil/gas pipelines. Developing
transboundary infrastructure for flood protection and water storage to adapt to climate
change may help nudge countries to adopt a more balanced transboundary river basin
management. A general issue for the Danube may be the reduced capacity of the river to
support navigation due to decreasing water levels projected under climate change
(Scholten and Rothstein, 2017). This calls for specific and coordinated adaptation of the
navigation sector. The inclusion of sustainability criteria in the public procurement of
infrastructure (e.g. through requirements on infrastructure sustainability certification65),
may speed up the environmental assessment and approval of infrastructural projects.
Sustainability criteria may effectively nudge towards more green and multi-functional
solutions wherever appropriate.
Boosting the green economy. The technological transition to higher resource efficiency
and energy and materials recovery from waste plays an essential role in the narrative of
response to climate change, pollution and resources consumption, and the associated
risks. As global demand for (and prices of) raw materials increase, technologies need to
evolve quickly and “green” investments (e.g. in renewable energies or resource efficiency)
are expected to become more profitable. This should push the industry strongly towards
a circular economy and help reduce certain environmental impacts. A process of “green
65 For instance, BREEAM/CEEQUAL: http://www.ceequal.com/; ENVISION:
https://sustainableinfrastructure.org/
51
re-industrialization” linked to more flexible manufacturing technologies may be easier to
generalize to the poorer regions.
However, the green/circular economy must be already stimulated today, particularly by
committing European legislation (e.g. by setting high recovery/recycling targets, high
wastewater treatment and reuse standards, high levies on primary raw materials etc.) and
broadening the scope of green procurement. The business sector seems responsive. For
example, the World Economic Forum’s website66 shows an abundance of references to the
circular economy and sustainability, opening prospects that public-private partnerships
might become more effective due to the increasing alignment of interests between public
and private actors. However, this still requires adequate market signals.
A reinforced role for international financial institutions. Securing resources to
maintain a competitive environment remains critical, if only to provide high level education
and training, build the required infrastructures or invest in top notch Research &
Development. Even if the EU might not have the means to provide enough financial support
to all, organisations such as the European Investment Bank (EIB) may still make lending
capacity available. Reinforcing them might be an effective way to cope with lack of
investment capacity. The EU’s financial institutions already make some technical and
administrative capacity available to manage the practical aspects of project appraisal,
monitoring and accounting and promote active transboundary cooperation67. This could
take place even if the EU lacks capacity to manage conflicts between Member States which
would be addressed at the inter-governmental level. Macro-regional institutions such as
the ICPDR might play a useful role in these cases.
6.3 Nature conservation
Making green infrastructure investments attractive. The attractiveness of
investments in nature-based solutions should be increased by developing mechanisms of
payment for ecosystem services (e.g. Hejnowicz et al., 2014). With such mechanisms, the
financial sector could find suitable conditions for capital remuneration from investments in
nature conservation and restoration (e.g. floodplains and wetland reconnection, river
restoration, afforestation, etc.) at large scale. The combined push of nature conservation
investments and tourism could offset the current attractiveness of hydropower
development in relatively pristine river basins, e.g. in the Western Balkans, stimulating
the hydropower industry to include ecological aspects when optimizing hydropower plant
siting. Experiences of financial investments in the natural capital exist, through
mechanisms such as environmental impact bonds68: “Like a typical municipal bond, an
Environmental Impact Bond (EIB) provides up-front capital from private investors for
environmental projects. Unlike municipal bonds, it embeds a Pay-for-Success (PFS)
approach that conditions payback to investors on project performance, which could be
used to pilot or scale a new environmental program or intervention. In its most basic form,
investors participating in a Pay-for-Success model pay the up-front costs for implementing
these environmental projects. Following construction and evaluation, the payor – the
public agency or private institution that benefits from these solutions – repays investors
an amount linked to achievement of agreed-upon outcomes of the program.” 69
66 https://www.weforum.org/ 67 In particular, though the JASPERS technical assistance partnership:
http://www.eib.org/en/products/advising/jaspers/index.htm 68 https://www.edf.org/blog/2017/07/14/environmental-impact-bonds-next-big-thing-green-investments 69 https://www.edf.org/ecosystems/environmental-impact-bonds-financing-wetlands-
restoration

52
One example where EIBs are applied is the reduction of stormwater pollution loads in the
Chesapeake Bay Area (US)70. Another example of a mechanism developed to finance
wetland and riparian areas protection is that of “mitigation banks”71 developed under the
supervision of the US Army Corps of Engineers: “A mitigation bank is an agreement
between a regulatory agency or agencies (state, federal, or local) and a sponsor which can
be a public agency, non-profit organization, or private entity. In a banking instrument, the
mitigation sponsor agrees to provide compensation that will be initiated before credits are
approved for release by an Interagency Review Team. These credits can then be purchased
or used by permittees instead of providing permittee-responsible compensatory mitigation
required under the Corps or a state or local aquatic resource regulatory program. The
sponsor does a large, ecologically meaningful project for which it can charge the public
per credit or deduct credits if it is a single-user bank for an entity such as a state
department of transportation.”72
Arguably, adaptation to climate change cannot be based on traditional engineering
measures alone. This opens opportunities to finance nature-based solutions and to
preserve ecosystems for the services they provide. Public expenditure on ecosystems may
attract the financial sector and make “green bonds” increasingly a standard form of
investment for many private and institutional investors, but requires a clear and stable
commitment of public money. Ecosystem management may also stimulate the creation of
jobs which are necessarily “local,” and can compensate the loss of attractiveness of
traditional economic activities that become less profitable.
The potential for the development of a green infrastructure at European scale has been
analysed in the past, highlighting several opportunities throughout the region73.
Natural water retention measures in cities and agriculture. Urban land take and soil
sealing have visible direct impacts on water (Pistocchi, 2017) as well as collateral impacts
on such factors as urban microclimate, energy demand for cooling and air pollution. Urban
greening, i.e. the restoration of green areas in cities, is a form of natural water retention
measure and may provide multiple benefits. It is usually associated to the amenity of the
urban landscape, making it a win-win strategic option for urban management (Pistocchi et
al., 2017). In agriculture, maintaining riparian buffers at current levels is expected to
secure a reduction of sediment yields and associated pollution of about 8%, while taking
only about 2% of the basin’s land (Vigiak et al., 2016). Usually, the preservation of
vegetated buffers around agricultural fields is expected to yield benefits for pollinators,
protection of water bodies from pesticides and filtering of sediments and nutrients, while
preserving yields. It is increasingly endorsed in environmental stewardship programmes
including from large agrochemical business74. In many cases, intensive agriculture may
significantly reduce its impacts merely by more careful use of production means, such as
fertilizers, suggesting that nature and human activities may be reconciled to a large extent
through smarter practices. It is worth mentioning that the European Commission
maintains a clearinghouse of natural water retention measures, in support to river basin
planning75.
70 http://www.cbf.org/how-we-save-the-bay/programs-initiatives/environmental-impact-
bonds.html 71 https://www.forbes.com/sites/ashoka/2014/04/25/how-private-capital-is-restoring-u-
s-wetlands/#6fc6bb35e83f 72 https://www.nae.usace.army.mil/Missions/Regulatory/Mitigation/MitigationBanks/ 73 Exploring nature-based solutions. The role of green infrastructure in mitigating the
impacts of weather- and climate change-related natural hazards
https://www.eea.europa.eu/publications/exploring-nature-based-solutions-2014 74 See e.g. Syngenta:
https://www.syngenta.ca/docs/Buffer_Brochure_EngCanada_2013.pdf 75 Nwrm.eu

53
7. Development of capacities
Widespread capacity, meant in cultural, technical and financial terms, is a precondition to
avoid marginalization and impoverishment of regions within the Danube. Education of the
youth in schools and universities is essential to create a more ecologically aware society.
Under Scenario 1, peripheries capable to interact with the centre on equal grounds are a
precondition to ensure large scale policies and investments that meet local needs. Under
Scenario 3, regions with good and complementary specializations may become more
attractive in synergism than if they were isolated. Under Scenario 2, complementary and
smart specialization, based on local milieus, supports the virtuous circles of the
collaboration among strong regions under the umbrella of a protective Union. In Scenario
4, capacity may provide the necessary elements of resilience to revert to more limited
economies (such as at national scale).
The Danube region shows a large variation of capacities among countries, between rural
and urban areas and among regions, with large opportunities for the exchange of
experiences and transfer of knowledge.
Capacity building and smart specialization. Capacity building usually requires a
combination of measures implemented by multiple actors, including the education system,
universities, professional organizations and enterprises. The European Union promotes a
Smart Specialization Strategy in order to minimize competition and maximize synergism
among regions.
Smart specialization.
“Conceived within the reformed Cohesion Policy of the European Commission, Smart
Specialisation is a place-based approach characterised by the identification of strategic
areas for intervention based both on the analysis of the strengths and potential of the
economy and on an Entrepreneurial Discovery Process with wide stakeholder involvement.
It is outward-looking and embraces a broad view of innovation including but certainly not
limited to technology-driven approaches, supported by effective monitoring mechanisms.
[…] A strategy for smart specialisation should be designed around the following key
principles:
• Smart specialisation […] builds on the assets and resources available to regions and
Member States and on their specific socio-economic challenges in order to identify unique
opportunities for development and growth;
• To have a strategy means to make choices for investment. Member States and regions
ought to support only a limited number of well-identified priorities for knowledge-based
investments and/or clusters. Specialisation means focusing on competitive strengths and
realistic growth potentials supported by a critical mass of activity and entrepreneurial
resources;
• Setting priorities should not be a top-down, picking-the-winner process. It should be an
inclusive process of stakeholders’ involvement centred on “entrepreneurial discovery” that
is an interactive process in which market forces and the private sector are discovering and
producing information about new activities, and the government assesses the outcomes
and empowers those actors most capable of realizing this potential;
• The strategy should embrace a broad view of innovation, supporting technological as
well as practice-based and social innovation. This would allow each region and Member
State to shape policy choices according to their unique socio-economic conditions;
• Finally, a good strategy must include a sound monitoring and evaluation system as well
as a revision mechanism for updating the strategic choices.” 76
Partnership agreements and twinnings among regions and economic sectors may further
enhance the effectiveness of smart specialization and help creating a collaborative
76 http://s3platform.jrc.ec.europa.eu/what-is-smart-specialisation-

54
industrial ecosystem in the Danube. Knowledge and capacity may be effectively shared
also through public-public partnerships in the field of water management77.
Consolidate the financial sustainability of water management. An essential
component of capacity is the ability to plan and implement investments. There are now
ample possibilities for financing but effective funding is still limited by the capacity of water
users to pay back. In order to ensure the sustainability of lending capital for water
management development, it is essential that water is priced correctly. Therefore, water
pricing should be established as early as possible, balancing the political need to keep
water affordable for everyone and the capacity to invest. Appropriately priced water is a
precondition in any environmental impact bond initiative aimed at creating equitable
conditions to achieve sustainable management of water and sanitation for all (Sustainable
Development Goal Number 678).
Along with “putting the right price tag for water,” water utility companies need to learn to
deliver value-for-money services, which may require structural changes in the organization
particularly in cases where the management may be driven more by political decisions
than by customer satisfaction signals.
Stimulate high-level education, research and innovation in water management
in all Danube countries. There is a broad need to secure state-of-the-art higher
education in the field of water management. While the region has longstanding tradition
in water science and engineering, the history of the late XXth century has caused a
divergence between Upper and Lower Danube countries, further exacerbated by a
significant brain drain in the last decades only partly countered by recent EU research and
education programmes. This trend needs to be reversed, e.g. through broader
collaboration within EU scientific networks and the promotion of Lower Danube cases as
international case studies.
Strong enforcement mechanisms for rules on the application of fertilizers, including
checks on, and economic incentives for farmers, may stimulate both recovery of nutrients
and agricultural efficiency, yielding both economic and environmental benefits. Cap-and-
trade mechanisms applied to nutrient use may play a role in this respect.
Policy responses to diffuse pollution.
Market-based policy instruments have been proposed to manage diffuse pollution. The
Lake Taupo region in New Zealand is an example of a market to exchange nitrogen
emission allowances initially allocated to farmers on the basis of appropriate criteria. In
2011, the regional government introduced (1) a cap on nitrogen emission levels within the
Lake Taupo catchment; (2) the establishment of the Taupo nitrogen market; and (3) the
formation of the Lake Taupo Protection Trust to fund the initiative. This policy experiment
is thought to be unique in the world79. Although the long lag time of the watershed does
not allow appreciating environmental benefits to date, the programme is proving
successful in retiring emission allowances steadily from the market.
The National Network on Water Quality Trading (USA)80 works collaboratively to advance
water quality trading as a strategy to achieve clean water goals. Here, point sources can
purchase pollution reductions created by land managers using conservation practices. This
trading started with 18 organizations in 2013 and reflects the diversity found in most
emerging trading programmes in the country, including agriculture, wastewater and
77 See, for example, https://www.tni.org/files/download/pupinwater.pdf 78 Sustainable Development Goals, United Nations, 2015
https://sustainabledevelopment.un.org/sdg6 79 OECD, 2015. The Lake Taupo Nitrogen Market in New Zealand: Lessons in
environmental policy reform. https://www.oecd-ilibrary.org/docserver/5jrtg1l3p9mr-
en.pdf?expires=1542807231&id=id&accname=guest&checksum=A4FC531052456E634A
95A5D1F16EC85A 80 http://willamettepartnership.org/water-quality-trading/national-network/

55
stormwater utilities, environmental groups, regulatory agencies, and practitioners
delivering water quality trading programmes.
An extensive discussion of various policy options to manage diffuse pollution efficiently is
presented in a recent OECD report81.
Stimulate innovation for the recovery of energy, nutrients and water from
wastewater treatment plants. Making wastewater treatment a more attractive business
as a pivot of the circular economy requires the development of markets for water reuse,
nutrient recovery and energy recovery from wastewater. Valorization of biogas from
sludge digestion, for instance, may be stimulated through appropriate feed-in electric
tariffs or preferential mechanisms to dispatch bio-methane through gas distribution
networks. These conditions would also facilitate synergies between sludge digestion and
municipal/industrial organic waste digestion in a single plant for a given area. Explicit (e.g.
restrictive primary or secondary legislation) or implicit (e.g. more complex authorization
procedures) legal barriers to water reuse and the recovery of nutrients should be removed
as far as possible. Nutrients recovered from wastewater (e.g. struvite) could replace in
part synthetic mineral fertilizers.
81 OECD (2017), Diffuse Pollution, Degraded Waters: Emerging Policy Solutions, OECD Studies on Water, OECD Publishing, Paris, https://doi.org/10.1787/9789264269064-en
http://www.oecd.org/environment/resources/Diffuse-Pollution-Degraded-Waters-Policy-Highlights.pdf

56
Win-win solutions for the management of agricultural pollution. Fertilizers are a
cost for agriculture and their production often requires a lot of energy (Ramirez and
Worrell, 2006). Hence, reducing fertilizer use can help achieve the agenda of the EU
climate action.
Udias et al., 2016, show how the reduction of mineral fertilizer use in the Upper Danube
may represent a win-win option to reduce pollution while not affecting crop yields or
farmers’ incomes. They show how optimized nitrogen management reduces pollution
significantly, indicating that technical options exist to reduce nutrient pollution without
economic prejudice.
Figure 14 - Average monthly N-NO3 concentration (mgN/L) for a 15-year simulation
period in the Upper Danube Basin under current conditions (top), optimized fertilization
(middle) and optimized fertilization and wastewater treatment plant upgrade (bottom).
From Udias et al., 2016 (doi:10.3390/w8090371) under CC-BY license.

57
8. Concluding remarks
The Danube region shows strengths and weaknesses, opportunities and threats for the
development of the above areas for action. Among the strengths, all countries are on a
(more or less steady) path to structural reforms pushed by either the European Semester
process (for Member States - see Annex 1) or the convergence with the EU in the
perspective of accession (for the Western Balkans) or association (for Ukraine and, in the
future, possibly Moldova). Danube countries also have relatively good environmental
performances (see Annex 3) and can benefit from the synergies with global (Germany,
Austria) or regional (e.g. Czech Republic, Slovenia) leaders under several technological
and organizational dimensions. This provides favourable conditions for capacity
building/knowledge transfer in the region also through the development of projects of joint
interest.
Another strength of the region is the still relatively high abundance of pristine natural
environment, and the relatively low impact of agricultural activities in the lower river basin.
This provides ample opportunities for the development of green economic activities, also
considering that forest areas are generally stable if not expanding, while the population
tends to concentrate in urban centres (Figure 6).
Most of the Danube countries have a large public sector (around 20% of employment, see
Annex 2) which may be a strength when planning public and community actions, although
it may revert to a weakness if bureaucracies take a conservative attitude and resist
innovation. Re-valueing their large public sector appears an opportunity for all countries
but requires dedicated investments. The relatively poor innovation performance (Annex 3)
may be a weakness for most countries, although there are signals of vitality in certain
innovative sectors in the region (Figure 19 to Figure 24).
Agriculture in the region does not contribute enough to the gross domestic product,
suggesting a weakness due to the limited value of agricultural production. However, access
to a large and stable market such as the EU offers apparent opportunities particularly for
tourism and specialized agricultural production. Small farmers and their families may
develop typical products with high added value and marketability that can benefit from
the Protected Designation of Origin and other EU quality labels. The regions can support
this by attracting tourism from elsewhere, deploying good public transport and logistics
infrastructure, cultivating capacity for better agricultural management, etc.
Rural tourism to diversify sources of income might both benefit from environmental
improvements, and become a driver of further ecological transition due to the demand for
high quality organic produce, calling for a reduction of pesticide use and the adoption of
agro-ecological practices. These opportunities seem to be underexploited for now, with the
region still lagging behind the EU top players in the field in spite of assets such as a
relatively well preserved and varied agricultural landscape.
An overall threat in the region is the apparent ageing of population and the trend of
depopulation, particularly in countries needing the most to develop from the current
conditions (all lower Danube countries). If policies to counter these trends are not put in
place, societies may soon become very different and their capacity to plan any
development may be undermined.
Equally dangerous threats come from rising inequality in most Danube societies, and
particularly in the lower Danube (see Annex 1), and corruption, which has shown to
correlate well with the difficulties of doing business (see §2). Foreign investors and the EU
partner Member States may have aligned interests in combatting both phenomena in order
to secure a better business environment and a higher overall prosperity in the region.
Finally, significant opportunities come from the European structural funds, the existence
of frameworks for the development of transboundary investments (the EUSDR and Danube
Transboundary Interreg Programme 82), and the relative ease of access to financing
82 http://www.interreg-danube.eu/

58
through the EIB or the European Bank for Reconstruction and Development and other
financial institutions. In order to keep momentum with the European integration project,
it is important to raise awareness of the benefits brought by the EU in the Danube
economies.

59
References
[Bisselink et al., 2018] Bisselink, B., Bernhard, J., Gelati, E., Adamovic, M., Jacobs, C.,
Mentaschi, L., Lavalle, C. and De Roo, A., Impact of a changing climate, land use, and
water usage on water resources in the Danube river basin, EUR 29228 EN, Publications
Office of the European Union, Luxembourg, 2018, ISBN 978-92-79- 85889-5,
doi:10.2760/89828, JRC111817
[European Commission, 2018] European Commission, Directorate-General for Economic
and Financial Affairs. The 2018 Ageing Report. Underlying Assumptions and Projection
Methodologies. European economy Institutional Paper 065, 2018.
https://ec.europa.eu/info/sites/info/files/economy-finance/ip065_en.pdf
[Grolleau and McCann, 2012] Grolleau, Gilles, and Laura M.J.McCann, Designing
watershed programs to pay farmers for water quality services: Case studies of Munich
and New York City, Ecological Economics, Volume 76, April 2012, Pages 87-94,
https://doi.org/10.1016/j.ecolecon.2012.02.006
[Hejnowicz et al., 2014] Hejnowicz, Adam P., David G. Raffaelli, Murray A. Rudd, and
Piran CL White. "Evaluating the outcomes of payments for ecosystem services
programmes using a capital asset framework." Ecosystem Services 9 (2014): 83-97
[Karabulut et al., 2016] Karabulut, Armağan, Benis N. Egoh, Denis Lanzanova, Bruna
Grizzetti, Giovanni Bidoglio, Liliana Pagliero, Fayçal Bouraoui, Alberto Aloe, Arnaud
Reynaud, Joachim Maes, Ine Vandecasteele, Sarah Mubareka, Mapping water provisioning
services to support the ecosystem–water–food–energy nexus in the Danube river basin,
Ecosystem Services, Volume 17, February 2016, Pages 278-292, ISSN 2212-0416,
http://dx.doi.org/10.1016/j.ecoser.2015.08.002.
[Khanna, 2016] Khanna, P., 2016. Connectography: Mapping the Future of Global
Civilization. Random House Publishing Group, 496 pp ISBN-13:9780812988550.
[Li and Zhao, 2018] Li, Haoyang, and Jinhua Zhao. "Rebound effects of new irrigation
technologies: The role of water rights." American Journal of Agricultural Economics 100,
no. 3 (2018): 786-808.
[OECD, 2013] OECD, Providing Agri-environmental Public Goods through Collective
Action, 2013. OECD Publishing, Paris, https://doi.org/10.1787/9789264197213-en.
[Pistocchi et al., 2015] Pistocchi A, Beck H, Bisselink B, Gelati E, Lavalle C, Feher J.
Water scenarios for the Danube River Basin: Elements for the assessment of the Danube
agriculture-energy-water nexus. EUR 27700. Luxembourg (Luxembourg): Publications
Office of the European Union; 2015. JRC99843 http://dx.doi.org/10.2788/375680
[Pistocchi, 2018] Pistocchi, A., Chapter 20 - An Integrated Perspective of Multiple
Stressors in River Ecosystems From the Catchment to the Continental Scale. In Multiple
Stressors in River Ecosystems,Editor(s): Sergi Sabater, Arturo Elosegi, Ralf Ludwig,
Elsevier, 2019, Pages 353-374, ISBN 9780128117132, https://doi.org/10.1016/B978-0-
12-811713-2.00020-0.
[Pistocchi, 2019] Pistocchi, A., The Water Framework Directive: a tale of rivers and
people. Environmental Science and Policy (under review), 2019
[Pistocchi, 2017] Pistocchi, A., Hydrological Impact of Soil Sealing and Urban Land Take.
In Gardi, C. (ed.) Urban Expansion, Land Cover and Soil Ecosystem Services, Routledge
EarthScan, Taylor and Francis, 2017
[Pistocchi et al., 2017] Pistocchi, A., Grizzetti, B., Zalewski, M., Gawlik, B., Bidoglio, G.,
Nature-Based Solutions For Urban Water Management. In Paracchini, M.L., Zingari, P.C.,
Blasi, C. (eds) Reconnecting natural and cultural capital - Contributions from science and
policy. 2017 https://publications.europa.eu/en/publication-detail/-/publication/6a0efd09-
0d4d-11e8-966a-01aa75ed71a1/prodSystem-cellar/language-en/format-PDF

60
[Price and Thonemann, 2010] Price, S., Thonemann, P., The birth of classical Europe. A
history from Troy to Augustine. Allen Lane/Penguin, London, 2010.
[Ramírez and Worrell, 2006]Ramírez, C.A. , Worrell, E., Feeding fossil fuels to the soil:
An analysis of energy embedded and technological learning in the fertilizer industry,
Resources, Conservation and Recycling, Volume 46, Issue 1, 2006, Pages 75-93,
https://doi.org/10.1016/j.resconrec.2005.06.004
[Scaduto, 2016] Scaduto, M.L., River contracts and interated water management in
Europe. Springer, 2016
[Scholten and Rothstein, 2017] Scholten, A., Rothstein, B., Navigation on the Danube -
Limitations by low water levels and their impacts. JRC technical reports, 2017.
http://publications.jrc.ec.europa.eu/repository/handle/JRC104224
[Udias et al., 2016] Udias, Angel, Anna Malagò, Marco Pastori, Olga Vigiak, Arnaud
Reynaud, Francisco Javier Elorza and Faycal Bouraoui. Identifying Efficient Nitrate
Reduction Strategies in the Upper Danube. Water 2016, 8(9), 371;
http://dx.doi.org/10.3390/w8090371.
[Vigiak et al., 2016] Vigiak, O., Malagó, A., Bouraoui, F., Grizzetti, B., Weissteiner, C.J.,
Pastori, M., Impact of current riparian land on sediment retention in the Danube River
Basin, Sustainability of Water Quality and Ecology, Volume 8, 2016, Pages 30-49,
https://doi.org/10.1016/j.swaqe.2016.08.001.
[Vorosmarty et al., 2010] Vorosmarty, C.J. , P.B. McIntyre, M.O. Gessner, D. Dudgeon,
A. Prusevich, P. Green, S. Glidden, S.E. Bunn, C.A. Sullivan, C. Reidy Liermann, and P.M.
Davies. Global threats to human water security and river biodiversity. Nature 467, 555-
561 (30 September 2010) https://dx.doi.org/10.1038/nature09440
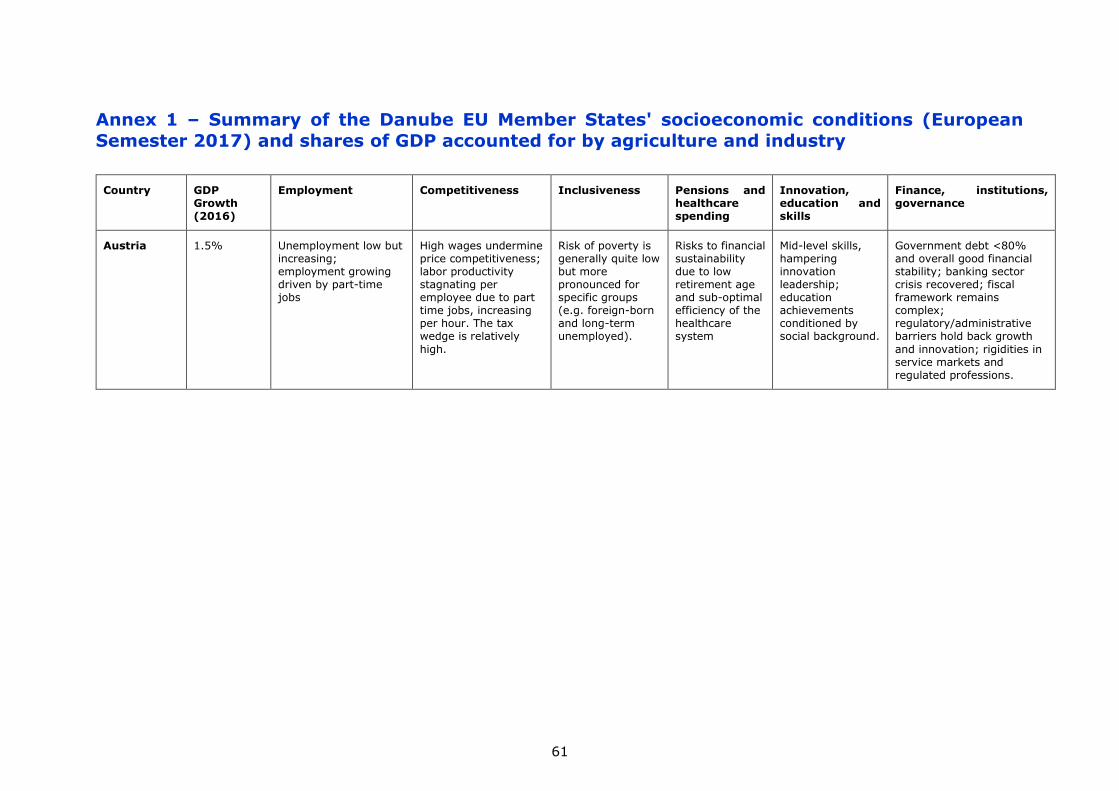
61
Annex 1 – Summary of the Danube EU Member States' socioeconomic conditions (European
Semester 2017) and shares of GDP accounted for by agriculture and industry
Country GDP Growth (2016)
Employment Competitiveness Inclusiveness Pensions and healthcare spending
Innovation, education and skills
Finance, institutions, governance
Austria 1.5% Unemployment low but increasing; employment growing driven by part-time jobs
High wages undermine price competitiveness; labor productivity stagnating per employee due to part time jobs, increasing per hour. The tax wedge is relatively
high.
Risk of poverty is generally quite low but more pronounced for specific groups (e.g. foreign-born and long-term unemployed).
Risks to financial sustainability due to low retirement age and sub-optimal efficiency of the healthcare system
Mid-level skills, hampering innovation leadership; education achievements conditioned by social background.
Government debt <80% and overall good financial stability; banking sector crisis recovered; fiscal framework remains complex; regulatory/administrative barriers hold back growth
and innovation; rigidities in service markets and regulated professions.

62
Country GDP Growth (2016)
Employment Competitiveness Inclusiveness Pensions and healthcare spending
Innovation, education and skills
Finance, institutions, governance
Bulgaria 3.3% Unemployment is decreasing and is below EU average. However, high inactivity rates and
long-term unemployment are still an issue. Active labor market policies are not sufficiently targeted to the young and long-term unemployed. Undeclared work has high incidence. Services for employment are increasing but show limited effectiveness.
Private consumption drives growth. The rise of wages does not seem to have impacts on competitiveness.
The shadow economy remains a key challenge.
Income convergence towards the EU levels continues but the gap
persists. Income inequality is at very high levels. Poverty is still to be properly addressed. Roma people appear disadvantaged in the access to services including education.
The risk of poverty affects a high share of people, particularly among the elder, children, Roma and in rural areas.
Public healthcare spending is low compared to EU levels. Out-of-
pocket payments limit access to the services. Medicals emigrating represent almost 90% of the yearly medical graduates, limiting the supply of qualified workforce in the sector.
Early school leaving is still an issue, while some progress is being made on tertiary
education targets. Insufficient provision of quality education persists. Funding for education is low compared to the EU levels. Reforms are ongoing.
The perception of corruption, weak institutions and an unstable legal framework affect the business environment.
The efficiency of public procurement remains low, and so is for the efficiency of spending.
The insolvency framework is still in need of reform. Judges training and courts capacity remain an issue.
Access to finance for the SMEs is difficult although expected to improve thanks to recent initiatives.
The robustness of the banking sector has increased, but some institutions (including one systemic bank) require further attention. Issues arise with unsound business practices such as related-party lending and investment in the banking and insurance sectors.

63
Country GDP Growth (2016)
Employment Competitiveness Inclusiveness Pensions and healthcare spending
Innovation, education and skills
Finance, institutions, governance
Croatia 2.8% Among the lowest employment rates in the EU. Unemployment above 12%, mitigated by part-time and
temporary jobs, but still very high for the young and long-term. Low job opportunities have stimulated migration outflows.
Productivity lags behind that of regional peers, particularly in state-owned entreprises. Productive
investment is low.
The regulatory environment for service providers is restrictive.
Levels of poverty and social exclusion, hardened by fragmented and
opaque social protection which may result ineffective and not fair. Women are often driven out of the labor market.
The system appears ineffective and not sustainable in the long term.
The adequacy of pensions is low and creates poverty risks for the elder.
Workforce underskilled pending educationa system reforms.
Effective public services are hampered by fragmented public administration.
Access to finance is still difficult, especially for
SMEs.
Czech Republic
2.4% Among lowest unemployment rates in the EU (4%); employment growing in the last years but expected to slow down, also due to demographic constraints.
Investments discouraged by high administrative burden. R&D investment increasing. Business/research cooperation is still problematic.
One of the least unequal societies in Europe. Inclusiveness of compulsory education still a challenge for certain social groups.
Risk to financial sustainability; the fiscal framework is one of the weakest in the EU
Investments in R&D on track towards Europe 2020 targets.
Corrupion is being addressed but remains a key issue. Administrative simplification is progressing. Public procurement reveals inefficiencies. Fiscal non-compliance is still an issue requiring simplification.
Germany 1.9% Overall good labor market, but high incidence of part-time jobs and limited incentive for second earners. Population ageing may limit labor supply in the mid term.
Private domestic investment not at full potential, relatively low public investment. Growth fuelled by domestic demand growth. Labor taxation remains relatively high.
The strong economic performance does not benefit all layers of society equally. Relative poverty and exclusion indicators increase.
Investments needed in electricity networks and broadband connections. Service sector investments hampered by regulatory barriers.
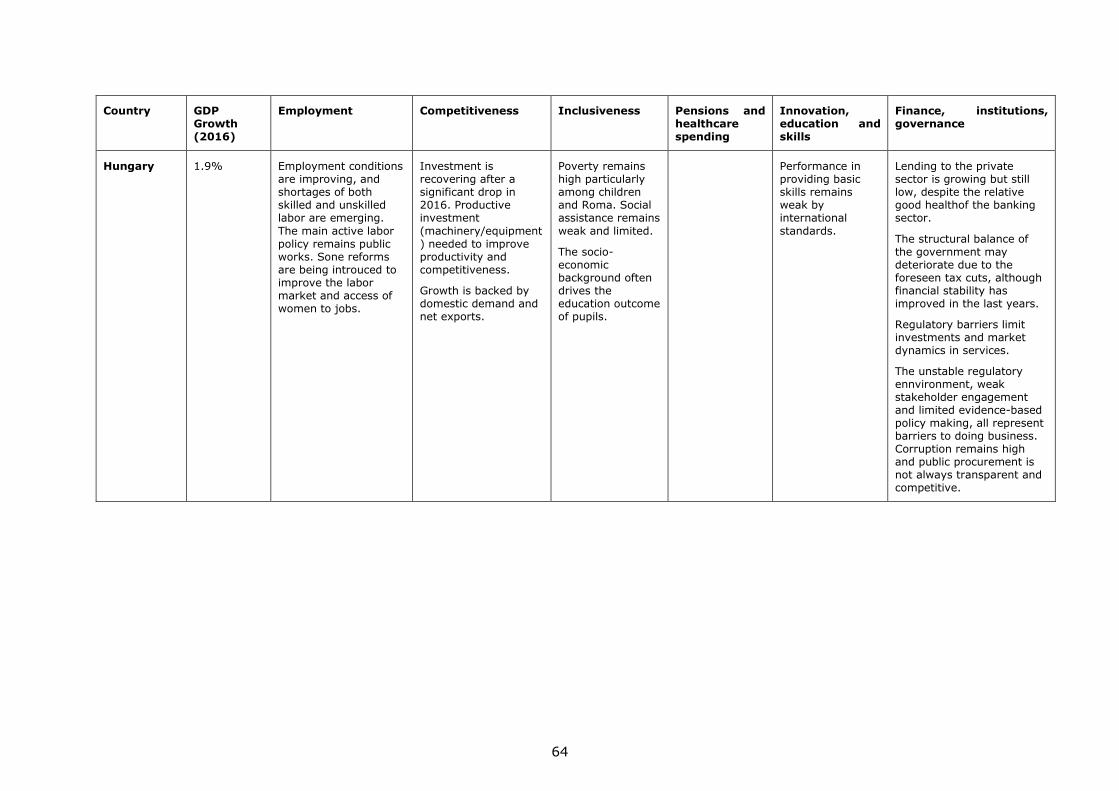
64
Country GDP Growth (2016)
Employment Competitiveness Inclusiveness Pensions and healthcare spending
Innovation, education and skills
Finance, institutions, governance
Hungary 1.9% Employment conditions are improving, and shortages of both skilled and unskilled labor are emerging.
The main active labor policy remains public works. Sone reforms are being introuced to improve the labor market and access of women to jobs.
Investment is recovering after a significant drop in 2016. Productive investment
(machinery/equipment) needed to improve productivity and competitiveness.
Growth is backed by domestic demand and net exports.
Poverty remains high particularly among children and Roma. Social assistance remains
weak and limited.
The socio-economic background often drives the education outcome of pupils.
Performance in providing basic skills remains weak by international
standards.
Lending to the private sector is growing but still low, despite the relative good healthof the banking sector.
The structural balance of the government may deteriorate due to the foreseen tax cuts, although financial stability has improved in the last years.
Regulatory barriers limit investments and market dynamics in services.
The unstable regulatory ennvironment, weak stakeholder engagement and limited evidence-based policy making, all represent barriers to doing business. Corruption remains high and public procurement is not always transparent and competitive.

65
Country GDP Growth (2016)
Employment Competitiveness Inclusiveness Pensions and healthcare spending
Innovation, education and skills
Finance, institutions, governance
Romania 4.9% Employment is improving in line with general economic growth. Active labor market policies now
substantially better targeted to inactive groups. Undeclared work remains prevalent, affecting the labor market and fiscal revenues.
Domestic demand is strengthening.
Difficulty to secure high skill labor supply vs education system
deficiencies and persisting emigration.
General improvement of economic conditions and fight against
poverty are at risk of not being sustainable in the long term, especially in case of reversal of structural reforms.
Income inequality remains high.
Although subjec tto reforms, the healthcare system has still low
effectiveness, offers limited services especially in rural areas, and shows high corruption.
Persistently high early school leaving and low tertiary education attainment. R&D
remains away from Europe 2020 targets.
Relatively high deficit (2.8% of GDP), projected to increase to well above 3%. Debt increasing but still at around 60% of GDP.
Financial stability improving, but uncertainty in the legislation may undermine investments. Non-performing loans have relatively high incidence. Governance is improving, and so also the fight against corruption, although at risk of being reversed through recent legislative initiatives.
Public investment is among the highest in the EU, but the effectiveness is limited by relatively poor infrastructure.
Corruption and administrative complexity hold back investments.

66
Country GDP Growth (2016)
Employment Competitiveness Inclusiveness Pensions and healthcare spending
Innovation, education and skills
Finance, institutions, governance
Slovakia 3.3% Decreasing unemployment but still issues with long-term unemployment
Overall positive investment outlook. Relatively high sectorial concentration of the economy; lack
of infrastructure hampers investments in large parts of the country; limitations persist on the quality of the business environment, qualified labor.
High energy dependency and low energy efficiency.
Indicators of poverty and exclusion risks have been deteriorating
although the Europe 2020 objectives appear attainable. Although poverty is not widespread, poverty intensity may be high due to weak social safety nets.
The system appears to be not sustainable in the long term and requires
structural adjustments. The pension age is among the lowest in Europe.
The education system appears rather weak. Students‘ performance in
basic skills has been deteriorating. Vital SME landscape receiving increasing attention, but still limited R&D, business/research collaboration etc.
The social background may give rise to inequalities in education outcomes.
Tax evasion has fallen. Barriers to investments persist (infrastructure, bureaucracy, insolvency arrangements). Problems
with municipal waste management. Corruption remains a challenge despite efforts to modernize the public administration. Concerns with the independence of the judiciary.
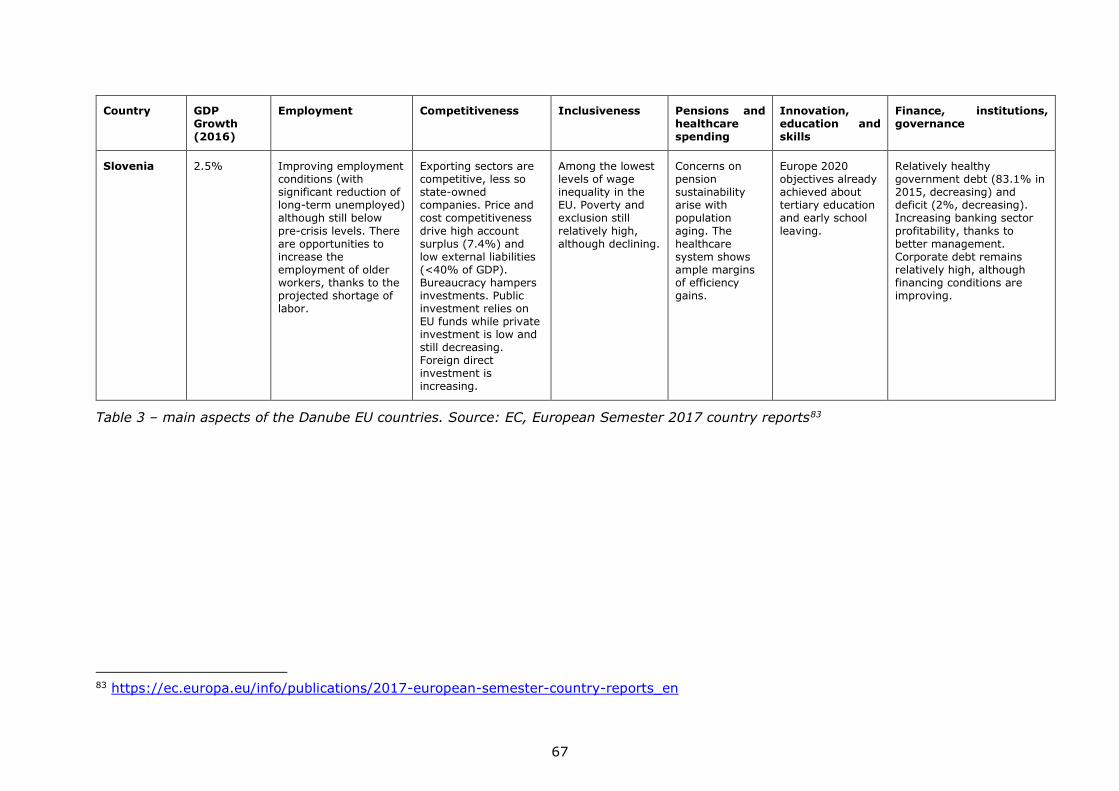
67
Country GDP Growth (2016)
Employment Competitiveness Inclusiveness Pensions and healthcare spending
Innovation, education and skills
Finance, institutions, governance
Slovenia 2.5% Improving employment conditions (with significant reduction of long-term unemployed) although still below
pre-crisis levels. There are opportunities to increase the employment of older workers, thanks to the projected shortage of labor.
Exporting sectors are competitive, less so state-owned companies. Price and cost competitiveness
drive high account surplus (7.4%) and low external liabilities (<40% of GDP). Bureaucracy hampers investments. Public investment relies on EU funds while private investment is low and still decreasing. Foreign direct investment is increasing.
Among the lowest levels of wage inequality in the EU. Poverty and exclusion still
relatively high, although declining.
Concerns on pension sustainability arise with population
aging. The healthcare system shows ample margins of efficiency gains.
Europe 2020 objectives already achieved about tertiary education and early school
leaving.
Relatively healthy government debt (83.1% in 2015, decreasing) and deficit (2%, decreasing). Increasing banking sector
profitability, thanks to better management. Corporate debt remains relatively high, although financing conditions are improving.
Table 3 – main aspects of the Danube EU countries. Source: EC, European Semester 2017 country reports83
83 https://ec.europa.eu/info/publications/2017-european-semester-country-reports_en

68
Figure 15 – share of GDP by country accounted for by industry and agriculture (Source : ICPDR, DRBMP 2015).

69
Annex 2 – Shares of employment in the Nomenclature of Territorial Units for Statistics 2 (NUTS2)
regions in the Danube river basin
Figure 16 – NUTS2 level regions (i.e.basic regions for the application of regional policies) in the Danube river basin
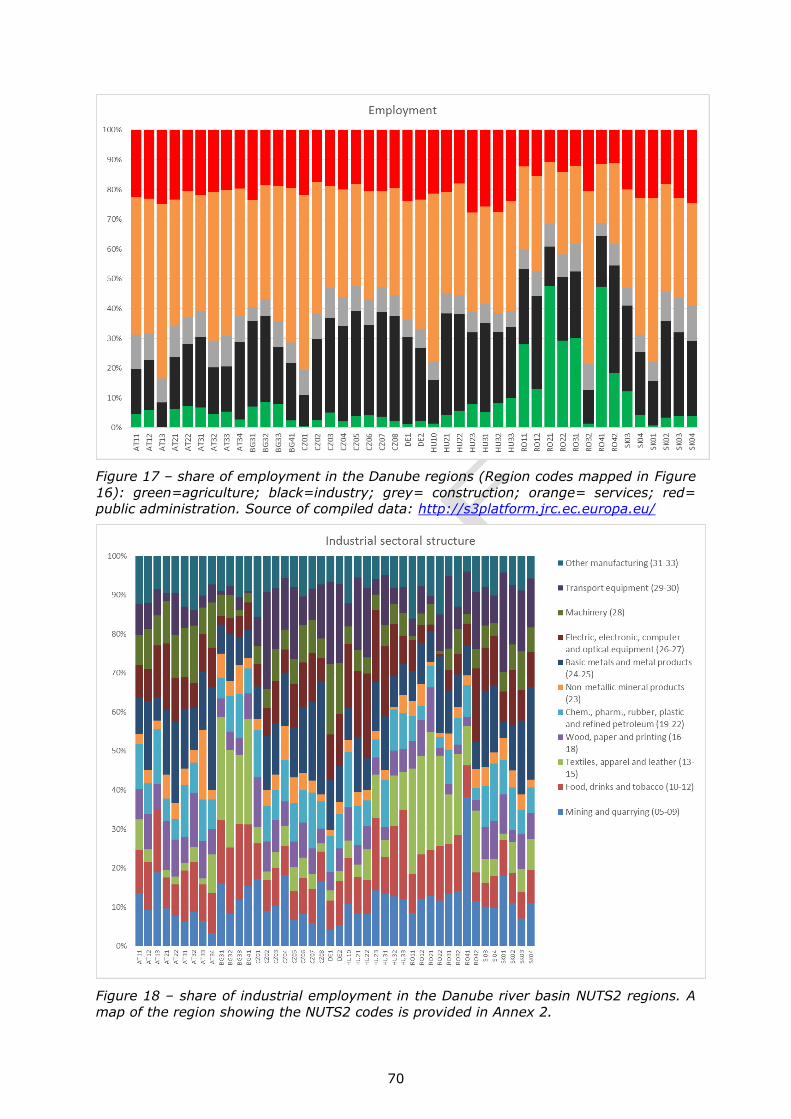
70
Figure 17 – share of employment in the Danube regions (Region codes mapped in Figure
16): green=agriculture; black=industry; grey= construction; orange= services; red=
public administration. Source of compiled data: http://s3platform.jrc.ec.europa.eu/
Figure 18 – share of industrial employment in the Danube river basin NUTS2 regions. A
map of the region showing the NUTS2 codes is provided in Annex 2.

71
Annex 3 –Global Innovation Index (GII) and Environmental
Performance Index (EPI) in the Danube Countries, 2016
The region does not qualitfy among the leading innovative regions globally, based on the
the Global Innovation Index (GII) 201684 (Figure 19). The Danube countries (with the
exception of Austria, Germany and in to some extent the Czech Republic) are usually in
the lowest ranks of the European Union, and non-EU Danube countries lag even farer.
The environmental performance of the Danube countries may be framed by inspecting the
results of the University of Yale’s Environmental Performance Index (EPI), 2016 report85
(Figure 20). Compared to the GII, in terms of EPI the Danube countries rank overall quite
well, although they still tend to lag behind most of the non-Danube EU countries. In the
Danube, the highest EPI is attributed to Slovenia, Croatia and Austria, with the other
Danube EU countries slightly behind and the Danube non-EU countries at further distance.
If we look at the evaluation criteria of the GII (Figure 21 to Figure 24), we may identify
some areas where margins of improvement are concentrated, given the overall innovation
ranking of a country86.
In terms of institutions, Romania, Bulgaria, Moldova, Hungary and Ukraine appear to be
worse than their peers.
The regulatory environment (regulatory quality, rule of law, costs of redundancy dismissal)
is worse than their peers for Czech Republic, Moldova, Slovakia and Ukraine and, to a
lesser extent, for Croatia and Hungary.
The business environment 87 is worse than their peers for Austria, Czech Republic,
Hungary, Bulgaria and Ukraine, and to a lesser extent Croatia and Moldova.
For what concerns human capital and research, all countries except Slovenia and Ukraine
have a ranking in education worse than their overall ranking; ranking in tertiary education
(including the number of inbound tertiary students) is also worse for Bulgaria, Croatia,
Hungary, Moldova and Slovakia.
Croatia, Bulgaria, Romania, Moldova, Montenegro and Slovakia also rank worse than their
peers in research and development (including the number of researchers, quality of
country top universities, and both private and public expenditure).
In terms of infrastructure, the Czech Republic, Bulgaria, Hungary and Slovenia have
sizable gaps compared with their peers. Ukraine, Moldova, Hungary, Croatia, Slovakia,
Romania and Bulgaria are particularly worse than their peers for general infrastructure;
for ecological sustainability, Ukraine and Moldova show the largest gap while Austria, with
a good overall environmental performance, lags behind in terms of energy productivity
(consumption/GDP).
84 https://www.globalinnovationindex.org This index, developed by a collaboration among Cornell University, WIPO and INSEAD, ranks countries worldwide based on the following criteria reflecting either conditions for innovation (input) or output providing evidence of innovation: Institutions;
Human capital and research; Infrastructure; Market sophistication; Business sophistication; Knowledge and technology outputs; Creative outputs. 85 The EPI score (https://epi.envirocenter.yale.edu/) is a weighted combination of indicators
reflecting Environmental Risk Exposure, Household Air Quality and Air Pollution, Unsafe Sanitation, Drinking Water Quality, Wastewater Treatment, Nitrogen Use Efficiency and Balance, Change in Forest Cover, Fish Stocks, Protected Areas and Species Protection, Trend in Carbon Intensity and CO2 Emissions. 86 In the following discussion, we systematically refrain from referring to Germany, as the Danube part of the country may not be faithfully depicted by the national scale indicators of the GII. 87 Measured here by the World Bank “Ease of doing business” indicators Ease of starting a business, Ease of resolving insolvency, Ease of paying taxes.

72
The GII output indicators reveal gaps in knowledge creation88 for Bulgaria, Hungary,
Montenegro, Romania, Slovakia, Slovenia; in the production of creative goods 89 in
Bulgaria, Croatia, Moldova, Montenegro and Ukraine; in online creativity90 for Slovenia,
Slovakia, Moldova. Gaps in knowledge impact91 and knowledge diffusion92 are rather
widespread among the Danube countries considered.
88 Patents, publications. 89 Cinema, publications, etc, and their export. 90 Number of domains, WikiPedia edits, Youtube uploads. 91 Growth rate of GDP per person engaged, New business density, Total computer software spending, ISO 9001 quality certificates, High-tech and medium high-tech output. 92 Intellectual property receipts, High-tech exports, ICT services exports, Foreign direct investment, net outflows.
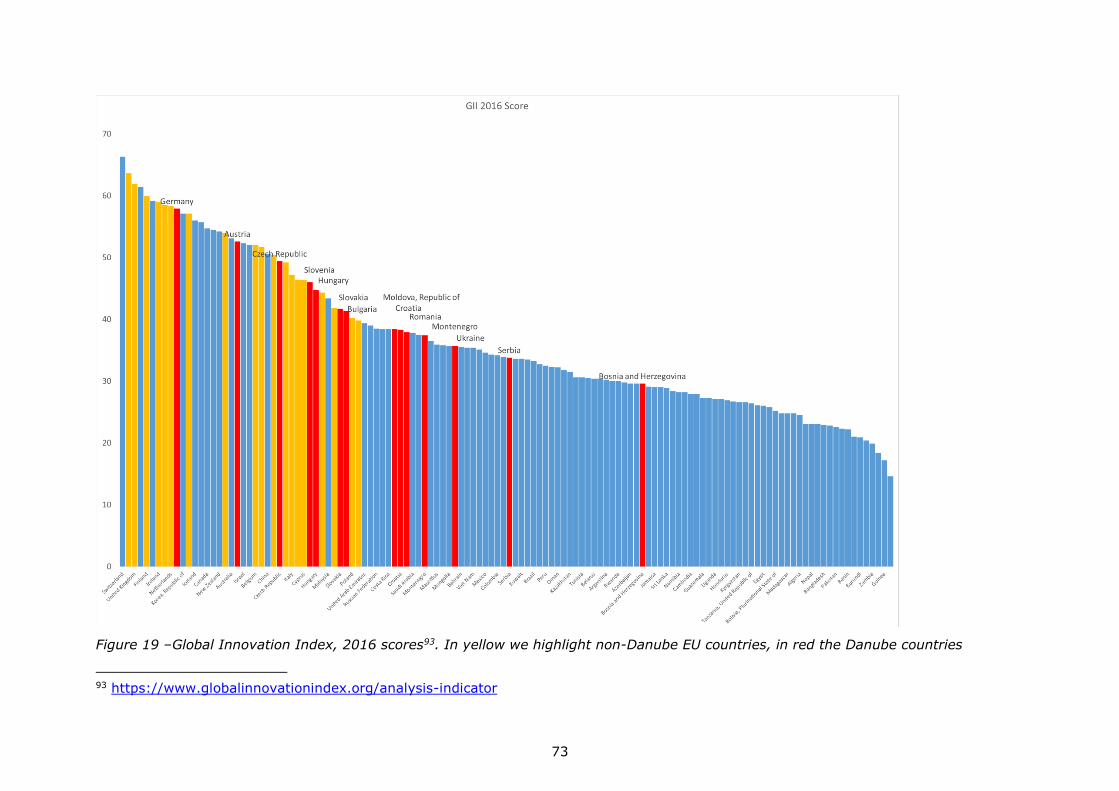
73
Figure 19 –Global Innovation Index, 2016 scores93. In yellow we highlight non-Danube EU countries, in red the Danube countries
93 https://www.globalinnovationindex.org/analysis-indicator

74
Figure 20 - –Environmental Performance Index, 2016 report scores. In yellow we highlight non-Danube EU countries, in red the Danube
countries. http://epi.yale.edu/country-rankings

75
Figure 21 –Global Innovation Index, 2016 scores. Human capital and research ranking
gap. https://www.globalinnovationindex.org/analysis-indicator
Figure 22 –Global Innovation Index, 2016 scores. Institutions ranking gap.
https://www.globalinnovationindex.org/analysis-indicator

76
Figure 23 –Global Innovation Index, 2016 scores. Infrastructure ranking gap.
https://www.globalinnovationindex.org/analysis-indicator
Figure 24 –Global Innovation Index, 2016 scores. Output ranking gaps.
https://www.globalinnovationindex.org/analysis-indicator.

77
List of figures
Figure 1 – The EUSDR pillars and priority areas (www.danube-region.eu) .................. 14
Figure 2 – Ease of Doing Business Rankings for 2017, World Bank. The rankings are on a
range 1 (best conditions) to 190 (worst conditions in the World). The sum of rankings
highlights the contribution of the different criteria to the final judgment on the ease of
doing business in a country (Kosovo reported as per the original data).
http://www.doingbusiness.org/rankings ................................................................. 16
Figure 3 – Corruptions Perception Index (CPI) 2012-16. Danube countries (Kosovo
reported as per the original data). Higher values indicate lower perceived corruption. The
graph also plots the GDP per capita in 2013 (in US$) from the Danube river basin
mabagement plan (DRBMP), 2015 update (table 22).
http://www.transparency.org/news/feature/corruption_perceptions_index_2016 ........ 17
Figure 4 – Designations of products in the EU (blue bars) and Danube (red) countries.
Includes applications, published and registered products (PDO = products with Protected
Designation of Origin; PGI = with Protected Geographical Indication; TSG = Traditional
Specialities Guaranteed, as per EU Regulation No 1151/2012). ................................. 19
Figure 5 – projected demographic evolution for the EU Danube countries. Source: EC,
2018. A: trends in total population; B: % population above 65 years; C: above 80 years.
“2016” indicate the most recent data, “change” is difference between 2016 and 2070. 20
Figure 6 – current and projected urban (above) and forested (below) land use in the
Danube. From Bisselink et al., 2018, reused under Decision 2011/833/EU. ................. 21
Figure 7 – Renewable water in the Danube river basin estimated by the model SWAT. From
Karabulut et al., 2016 (http://dx.doi.org/10.1016/j.ecoser.2015.08.002) under CC BY NC
ND license .......................................................................................................... 22
Figure 8 – Water provisioning for different uses in the Danube river basin. From Karabulut
et al., 2016 (http://dx.doi.org/10.1016/j.ecoser.2015.08.002) under CC BY NC ND license
......................................................................................................................... 23
Figure 9 – Share of demand among the different uses in the Danube river basin. From
Karabulut et al., 2016 (http://dx.doi.org/10.1016/j.ecoser.2015.08.002) under CC BY NC
ND license .......................................................................................................... 23
Figure 10 – Change in mean annual surplus (precipitation - evapotranspiration) using the
Budyko model discussed in Pistocchi et al., 2015. A: median under RCP 4.5 scenario; B:
median under RCP 8.5 scenario; C: minimum under RCP 8.5 scenario; D: maximum under
RCP 8.5 scenario ................................................................................................. 24
Figure 11 - Impact of 2 degree climate change on mean seasonal streamflow, as compared
to the 1981-2010 climate. The green colour indicates rivers where the uncertainty in the
results is large. From Bisselink et al., 2018, reused under Decision 2011/833/EU. ....... 25
Figure 12 - axes used for the definition of the scenarios ........................................... 31
Figure 13 – an environmental Kuznets’ curve.Source: Wikipedia, reused under the Creative
Commons Attribution (CC-BY) 3.0 License. ............................................................. 44
Figure 14 - Average monthly N-NO3 concentration (mgN/L) for a 15-year simulation period
in the Upper Danube Basin under current conditions (top), optimized fertilization (middle)
and optimized fertilization and wastewater treatment plant upgrade (bottom). From Udias
et al., 2016 (doi:10.3390/w8090371) under CC-BY license. ...................................... 56
Figure 15 – share of GDP by country accounted for by industry and agriculture (Source :
ICPDR, DRBMP 2015). ......................................................................................... 68
Figure 16 – NUTS2 level regions (i.e.basic regions for the application of regional policies)
in the Danube river basin ..................................................................................... 69

78
Figure 17 – share of employment in the Danube regions (Region codes mapped in Figure
16): green=agriculture; black=industry; grey= construction; orange= services; red=
public administration. Source of compiled data: http://s3platform.jrc.ec.europa.eu/ .... 70
Figure 18 – share of industrial employment in the Danube river basin NUTS2 regions. A
map of the region showing the NUTS2 codes is provided in Annex 2. ......................... 70
Figure 19 –Global Innovation Index, 2016 scores. In yellow we highlight non-Danube EU
countries, in red the Danube countries ................................................................... 73
Figure 20 - –Environmental Performance Index, 2016 report scores. In yellow we highlight
non-Danube EU countries, in red the Danube countries. http://epi.yale.edu/country-
rankings ............................................................................................................. 74
Figure 21 –Global Innovation Index, 2016 scores. Human capital and research ranking
gap. https://www.globalinnovationindex.org/analysis-indicator ................................. 75
Figure 22 –Global Innovation Index, 2016 scores. Institutions ranking gap.
https://www.globalinnovationindex.org/analysis-indicator ........................................ 75
Figure 23 –Global Innovation Index, 2016 scores. Infrastructure ranking gap.
https://www.globalinnovationindex.org/analysis-indicator ........................................ 76
Figure 24 –Global Innovation Index, 2016 scores. Output ranking gaps.
https://www.globalinnovationindex.org/analysis-indicator. ....................................... 76
List of tables
Table 1 – sources of nutrient pollution in the DRB (data from ICPDR, 2015). .............. 27
Table 2 – Summary of the challenges anticipated for water management under the 4
scenarios. .......................................................................................................... 42
Table 3 – main aspects of the Danube EU countries. Source: EC, European Semester 2017
country reports ................................................................................................... 67

GETTING IN TOUCH WITH THE EU
In person
All over the European Union there are hundreds of Europe Direct information centres. You can find the address of the centre nearest you at: https://europa.eu/european-union/contact_en
On the phone or by email
Europe Direct is a service that answers your questions about the European Union. You can contact this service:
- by freephone: 00 800 6 7 8 9 10 11 (certain operators may charge for these calls),
- at the following standard number: +32 22999696, or
- by electronic mail via: https://europa.eu/european-union/contact_en
FINDING INFORMATION ABOUT THE EU
Online
Information about the European Union in all the official languages of the EU is available on the Europa website at: https://europa.eu/european-union/index_en
EU publications You can download or order free and priced EU publications from EU Bookshop at: https://publications.europa.eu/en/publications. Multiple copies of free publications may be obtained by contacting Europe Direct or your local information centre (see https://europa.eu/european-union/contact_en).
KJ-N
A-3
00
16
-EN-N
doi:10.2760/134358
ISBN 978-92-76-14177-8