water sewerage planning guidelines
DESCRIPTION
sewerage treatmentTRANSCRIPT

Planning Guidelines for Water Supply and Sewerage April 2010 Chapter 6 amended March 2014

This publication has been compiled by Queensland Water Supply Regulator, Water Supply and Sewerage Services, Department of Energy and Water Supply.
© State of Queensland, 2014.
The Queensland Government supports and encourages the dissemination and exchange of its information. The copyright in this publication is licensed under a Creative Commons Attribution 3.0 Australia (CC BY) licence.
Under this licence you are free, without having to seek our permission, to use this publication in accordance with the licence terms.
You must keep intact the copyright notice and attribute the State of Queensland as the source of the publication.
For more information on this licence, visit http://creativecommons.org/licenses/by/3.0/au/deed.en
The information contained herein is subject to change without notice. The Queensland Government shall not be liable for technical or other errors or omissions contained herein. The reader/user accepts all risks and responsibility for losses, damages, costs and other consequences resulting directly or indirectly from using this information.
Contents 1 Purpose of the guidelines 1
2 Key planning principles 3
The regulatory framework 3
Knowledge management 3
The planning process 3
Stakeholders 4 Demand/flow and projections 4
Network modelling 4
Options for service provision 5
Remote or small community issues 5
Analysis of options 5 Implementation 5
Planning outputs 6
3 Glossary of terms 6
4 Abbreviations 15
Chapter 1 The regulatory framework 18
1 Purpose 18
2 Key principles 18
3 Why is this important? 18
4 When is knowledge of the regulatory framework required? 18
5 Key elements 18 6 Checklist 22
Chapter 2 Knowledge management 24
1 Purpose 24
2 Key principles 25 3 Why is knowledge management important? 25
4 When should knowledge management be undertaken? 25
5 Key elements 26
5.1 Identification of the knowledge required 26 5.2 Determine the current situation 27 5.3 Identification of knowledge management tools available 27 5.4 Develop and implement knowledge management strategy 31
6 Checklist 31
Chapter 3 The planning process 32
1 Purpose 32
2 Key principles 32
3 Why is planning important? 32
i

4 When should planning be undertaken? 33
5 Key elements 33 5.1 Identify service need 35 5.2 Determine Service Objectives 36 5.3 Determine Scope of Planning 36 5.4 Identify stakeholder requirements 37 5.5 Evaluate current and future demands 38 5.6 Identify options for service provision 38 5.7 Undertake options analysis 38 5.8 Develop implementation strategy 39 5.9 Outputs from the planning process 39 5.10 Key support processes 40
6 Checklist 41
Chapter 4 Stakeholders 42
1 Purpose 42
2 Key principles 42
3 Defining stakeholder involvement 42 3.1 Who or what are stakeholders? 42 3.2 Why involve stakeholders? 43 3.3 When should stakeholders be involved? 43 3.4 How to involve stakeholders? 44
4 Key elements 45 4.1 Identify stakeholders 45 4.2 Quantify and analyse stakeholder importance/involvement and requirements 46 4.3 Develop and implement stakeholder management strategy 49 4.4 Document stakeholder requirements 49
5 Checklist 50
Chapter 5 Demand/flow and projections 51
1 Purpose 51
2 Key principles 51
3 Why is the knowledge of demands and projections important? 51 4 When should demand and projections be determined? 52
5 Key elements 52
5.1 Collect and evaluate raw data 52 5.2 Determine key planning parameters 54 5.3 Determine future demand or flow projections 58
6 Checklist 60
Chapter 6 Network modelling and applications 62
1 Purpose 62
2 Key principles 62
3 Why is network modelling important? 62 4 When should network modelling be undertaken? 62
5 Key elements 63
5.1 Model management 63 5.2 Determine model scope 64
5.3 Determine model demand/flow and patterns 64
- ii -
5.4 Import data to analysis package 65
5.5 Model verification and calibration 68 5.6 Run model for various scenarios 71 5.7 Model outputs 73
6 Fire flow policy and minimum provisions 73
6.1 Overview 73 6.2 Purpose 73 6.3 Regulatory requirements 74 6.4 Roles and responsibilities 75 6.5 Fire flow policy 75 6.6 Minimum fire flow for water service provider networks 79
7 Demand and pressure management areas 83
7.1 Planning and design 84 7.2 Consultation with building owners/occupiers 85 7.3 Commissioning 87 7.4 Compliance testing by building owners 87
8 Provision of flow and pressure advice 87
8.1 Overview 87 8.2 Development/building applications 88 8.3 Certification and compliance testing 90 8.4 Changes to network conditions 90 8.5 Water supply schemes without network models 91
9 Checklist 91
10 Bibliography 92
Appendix 1 Example pro-forma 93
Chapter 7 Options for service provision 95
1 Purpose 95
2 Key principles 95 3 Why is this important? 95
4 When should options for service provision be considered? 95
5 Key elements 96
5.1 Determine current performance 96 5.2 Shortlist potential options 96 5.3 Detailed evaluation of potential options 97 5.4 Water supply options 99 5.5 Sewerage options 113 5.6 Other Issues to be considered in Infrastructure Planning 132
6 Checklist 132
Chapter 8 Remote or small community issues 133
1 Purpose 133
2 Key principles 133
3 Background 133
4 Why is this important? 133 5 When should these issues be addressed? 134
6 Key elements 134
7 Checklist 137
- iii -

Chapter 9 Analysis of options 138
1 Purpose 138
2 Key principles 138
3 Why is the analysis of options important? 138
4 When should the analysis be undertaken? 138 5 Key elements 139
5.1 Determine the evaluation criteria 139 5.2 Determine options 139 5.3 Develop inputs 140 5.4 Undertake the options analysis 141 5.5 Sensitivity analysis 143
6 Checklist 144
Chapter 10 Implementation 145
1 Purpose 145 2 Key principles 145
3 Why is an implementation strategy important? 145
4 When should an implementation strategy be developed? 146
5 Key elements 146
5.1 Determine project criticality 146 5.2 Determine the preferred project delivery option 147 5.3 Develop implementation program 149
6 Checklist 150
Chapter 11 Planning outputs 151
1 Purpose 151
2 Principles 151
3 Why is this important? 151
4 When should planning reports be developed? 151
5 Key elements 152
5.1 Prepare planning report 152 5.2 Incorporate outputs into other documentation 152
6 Checklist 152
- iv -

1 Purpose of the guidelines The primary purpose of these guidelines is to facilitate strategic thinking in the planning process.
These guidelines are the first major revision of Queensland State Government Planning Guidelines on urban water supply and sewerage for over 10 years. Since then there have been substantial changes in the administration of, and regulatory framework for, the urban water industry as well as changes in the approach to water and sewerage planning. For instance the Water Services Association of Australia (WSAA) codes are adopted as suitable standards for the planning and design aspects of water and sewerage reticulation/collection systems previously covered in the State Government planning and design guidelines.
The revised planning guideline has an emphasis on integrated system planning incorporating water, sewerage and stormwater. The planning phase of the asset lifecycle provides the greatest opportunity for delivering water and sewerage services at the lowest lifecycle cost while also meeting social and environmental requirements. The document focuses on the planning process and attempts to promote consideration of a wide range of infrastructure, source substitution and ‘non-asset’ solutions to meet community needs. The planning principles/processes outlined in this document are applicable to planning for other municipal services.
This guideline encourages service providers to base their planning on ‘real’ data. It includes guidance on sizing of components and, as far as possible, attempts to continue the design philosophy in previous guidelines while achieving consistency with the WSAA Codes. Service providers can develop their own design parameters and sizing criteria based on the performance characteristics of their existing systems.
Each chapter includes a bibliography that provides a ready reference to more detailed information, much of which is accessible by direct linkage to specific Internet sites. It is proposed the bibliography will be updated at regular intervals.
Each chapter has a consistent structure which includes:
Purpose succinctly describes the purpose of the topic in the chapter.
Key Principles a short listing of guiding rules. Why is This Important? briefly highlights the importance of the issue,
benefits to the service provider and possible risks of not addressing the issue.
When Should This be Undertaken?
describes when the activity should be undertaken in the planning process.
Key Elements outlines the key elements of the process being considered.
Checklist a listing of prompt questions which may assist the planner and internal reviewer.
The guideline consists of the following chapters:
Chapter 1 – The Regulatory Framework. This provides an overview of the regulatory framework as it applies to the planning of water supply and sewerage services.
- 1 -

Chapter 2 – Knowledge Management. Effective knowledge management is a critical foundation for quality infrastructure planning. Without this foundation, the resources allocated to planning studies become focused on information capture and verification. This diverts the allocation of resources from the application of strategic thinking skills in developing and critically evaluating options to provide optimal solutions for stakeholders.
This chapter provides an overview of knowledge management as it applies to the planning process. It is based on the interim Australian Standard AS 5037 (int) 2003 Knowledge Management.
Chapter 3 – The Planning Process. This chapter provides an overview of the planning process, which includes:
Identifying service needs in the short, medium and long term in order to deliver defined service standards, social, environmental and financial outcomes.
Evaluating options for delivering the defined outcomes. Determining the optimal strategy that delivers the defined outcomes at the lowest
financial, social and environmental (triple bottom line) cost. Communicating the outcomes of the planning process to decision makers through a
planning report.
Chapter 4 – Stakeholders. This chapter provides guidance on:
How to identify stakeholders and analyse stakeholder needs and requirements. What stakeholders are important through the different stages of planning. The tools used to identify the relative importance or significance of, different stakeholder
groups and their potential to impact or influence the project or to be impacted on, or influenced by, the project.
Chapter 5 – Demand/Flow and Projections. The accurate assessment of water demand and sewage flow forms the basis of all planning studies. This chapter provides guidance on the assessment of water demand and sewage flows and in particular addresses the assessment of future demand and flow based on historical records and future growth and water usage projections.
Chapter 6 – Network Modelling. This chapter provides an overview of the networking modelling process and highlights issues that should be considered to ensure that models efficiently deliver desired outcomes.
Chapter 7 – Options for Service Provision. A range of options exists for the provision of water supply and sewerage services. These include non-asset, source substitution and infrastructure options. This chapter outlines a number of these options and highlights the need to explore a wide range of solutions that go beyond the traditional infrastructure approach.
Chapter 8 – Remote or Small Community Issues. This chapter highlights some of the issues that need to be considered in the provision of water and sewerage services to small or remote communities.
Chapter 9 – Analysis of Options. The purpose of analysing options is to determine the preferred option which provides the optimal mix of financial, social and environmental outcomes for stakeholders. This chapter provides an overview of options analysis methodologies. Reference to more detailed information sources is provided.
- 2 -

Chapter 10 – Implementation. This chapter highlights the need to develop an implementation strategy for the preferred option or strategies arising from a planning study to determine:
The criticality of the project to the service provider’s capital works and operational programs.
The most cost-effective means of implementing the option with minimal risk.
Chapter 11 – Planning Outputs. It is essential that the results of the planning process are effectively communicated to key decision makers and other stakeholders by means of a planning report. This chapter outlines how a planning report can provide key decision makers with information to assess and demonstrate how the preferred option best meets the service need.
2 Key planning principles
The regulatory framework
Planners must be aware of the regulatory framework and its potential impacts on options and implementation programs relating to the provision of water supply and sewerage services.
Knowledge management
The management of both explicit and tacit knowledge facilitates effective and efficient planning.
Effective knowledge management exists when there is:
a culture of knowledge sharing within an organisation and with key stakeholders a process in place for:
o capture of explicit knowledge o sharing tacit knowledge o continual learning and improving
appropriate information systems in place to collect, analyse and transfer knowledge an understanding of what knowledge is required and where it can be accessed.
The planning process
Planning should include a comprehensive and rigorous identification of all options to meet the defined service levels, including options based on non-asset solutions.
Planning should be an iterative process which attempts to balance service needs with infrastructure, operation and maintenance, financial and environmental options.
Key stakeholders should be identified and involved up-front in the planning stage.
Non-asset solutions, full lifecycle costs, risk and maximising existing infrastructure capability should be considered before deciding to either construct new assets or replace assets.
Effective planning outcomes can only result from rigorous analysis, the application of strategic thinking skills and the adoption of an integrated approach to urban water planning which considers, where appropriate, water supply, sewerage and management of stormwater as a single system.
- 3 -

Stakeholders
Stakeholder involvement can beneficially influence planning and project outcomes.
Stakeholders can provide useful information in identifying feasible options and quantifying constraints.
Documenting benefits and risks can assist in gaining Stakeholder support for planning outcomes.
Stakeholders can generate or impose constraints.
Stakeholders can influence or select outcomes.
Stakeholders should be provided with the appropriate level of information commensurate to their involvement or decision-making responsibility.
Demand/flow and projections
Future water demand and sewage flow including peaking factors should be based on actual system performance, historical records and a consideration of future demand pattern changes.
Existing and future water demand should be separated into internal and external components so that the impact of demand management changes can be properly assessed.
It is essential that planners examine the underlying basis for current and future water demand particularly in terms of the many variables affecting internal and external demand components. Unit water demands or sewage flows should be specified as per equivalent person (EP).
Water demand should be associated with a required water quality, so that the potential magnitude of water recycling from various sources (e.g. stormwater, wastewater), or supply from alternate sources (e.g. rainwater tanks, bores) can be assessed.
The components of water loss (e.g. leakage) should be determined. Actions required to reduce these components should be stated, where cost effective.
Peaking factors, particularly for water demand, should take into consideration the likely changes to historical patterns where water recycling is incorporated.
Sewage flow should take into account changes in internal water demand resulting from demand management initiatives. The impacts of infiltration/inflow management programs should also be considered.
Demand projections should be broken down to match sub-catchments where appropriate
Network modelling
The desired outcomes of the modelling work and the extent/detail are to be established before commencing the process.
Operational staff should be involved in the construction and analysis of the network model.
- 4 -

Successful network modelling requires the investment of time by experienced staff to interpret the results of the modeling.
Model outputs should be verified against actual system performance.
Options for service provision
The objectives of a proposal to deliver an identified water supply or sewerage service should be clearly defined before evaluating options.
A range of options (non-asset, source substitution, new and replacement asset) should be examined in a holistic manner that considers water supply, sewerage and stormwater management as component parts of an integrated urban water management program.
Non-asset solutions should generally be considered preferentially. Traditional solutions involving new infrastructure construction may not always be the optimal solution for providing a service.
Remote or small community issues
Planners should take into account the ability of the community and service provider to fund, manage and sustain the proposed infrastructure.
The appropriateness of proposed solutions should be rigorously assessed.
Sustainable operational strategies are an essential consideration for planning studies for small and remote communities.
Regional solutions for service provision, management and operations should be considered for small or remote communities.
Analysis of options
Informed investment decisions can only be made through thorough analysis that considers financial, social and environmental impacts (positive and negative) and implementation risks throughout the lifecycle of the infrastructure.
Analysis of planning options must identify the long-term financial impact (e.g. recurrent costs, including depreciation, and customer charges) of all planning outcomes before proceeding with capital investment decisions.
All feasible potential options to meet service levels, including non-asset solutions should be considered in the options analysis.
The assumptions underlying the analysis of options must be justified and clearly documented in a planning report.
Implementation
Stakeholders, including asset owners, need to be aware of issues and risks associated with the implementation of projects proposed through a planning study.
- 5 -

A rational approach to project prioritisation is essential to effectively deliver a capital works program.
The recommended implementation strategies should be based on a thorough review of potential risks and how they will be managed.
Planning outputs
Planning reports should clearly and succinctly communicate to key decision makers and other stakeholders how the preferred option best meets the service need, taking into account future development scenarios and assumptions.
Planning reports should demonstrate that a rigorous examination (at an appropriate level) of options, costs and risks has been undertaken, and that all legislative, financial, environmental and social issues have been addressed, or at least considered.
3 Glossary of terms access chamber 1 Large diameter inspection/maintenance chamber which
allows operator access to a sewer.
aerosols Vapour droplets created during spray irrigation which may contain disease causing organisms
alliance 5 Where several companies or service providers work together to deliver the project.
annual demand 1 Total water demand for a year.
aquifer 8 An underground layer of permeable rock, sand or gravel that absorbs water and allows it free passage through pore spaces
aquifer recharge 2 The infiltration or injection of natural waters or recycled waters into an aquifer, providing replenishment of the groundwater resource.
average day demand 1 Annual demand divided by 365.
average dry weather flow
7 This is the combined average daily sanitary flow into a sewer from domestic, commercial and industrial sources.
avoided costs Costs which are unavoidable if nothing is done, but may be avoided if action is taken.
beneficial use The use of any element or segment of treatment wastes or by-products that contributes to public benefit, welfare, safety, health or aesthetic enjoyment.
Biochemical Oxygen Demand (BOD)
1 A measure of the dissolved oxygen required for the breakdown of organic material.
biosolids Stabilised organic solids derived from wastewater treatment process sludge which can be beneficially used.
Build Own Operate (BOO)
5 Similar to BOOT, except that the private sector consortium is responsible for the facility in perpetuity.
blackwater Toilet waste that contains organic matter from urine, faecal matter and toilet paper.
- 6 -

Build Own Operate Transfer (BOOT)
5 A private sector consortium is responsible for design, construction, operating, owning and financing a facility for the life of the project (normally 20-25 years). At the end of this period ownership of the facility is transferred to the service provider.
Build, Transfer, Operate (BTO)
5 A private sector company is responsible for design, construction and operation of a facility (normally 20-25 years). Ownership is transferred to the service provider after commissioning on payment of most of the capital cost.
common effluent drainage (CED)
1 A system with septic tank effluent collected and conveyed in a gravity sewerage network.
community service obligations (CSO)
3 Activities which would not normally be undertaken by a commercial entity (usually because they are not profitable) and are provided by a commercial entity under an agreement with government.
compost 1 Material produced by aerobic biological decomposition of organic material.
composting toilet 1 On-site treatment which uses the principle of composting to break down excreta to a humus type.
Concession 5 This is an extension of BTO where a private sector company is responsible for operation and maintenance of the system together with capital investment required over the life of the concession, typically 20-30 years.
consequence 6 The outcome of an event expressed qualitatively or quantitatively, being a loss, injury, disadvantage or gain. There may be a range of possible outcomes associated with an event.
constant flow system 1 A water supply system where water is supplied at a constant rate of flow, with peak demands being obtained from individual storages at each house.
constructed wetland A wetland that has been purpose built to achieve a set of design objectives. Constructed wetlands apply the functions of natural wetlands and utilize soil, water and biotic processes to achieve these objectives.
Customer Service Standards
13 A document developed by a water service provider to inform customers who do not have contracts with the service provider of the level of service standards
denitrification 1 process which transforms nitrates and nitrites into gaseous nitrogen in the absence of freely available oxygen.
Design & Construction (D&C)
5 A single company is responsible for both design and construction of the project, based on meeting explicit performance requirements. A service provider takes over and operates the infrastructure.
disinfection 1 Inactivation or removal of pathogenic micro-organisms.
drinking water 15 Water that is suitable for human consumption, food preparation, utensil washing and oral hygiene. (Drinking water quality is defined by the Australian Drinking Water Guidelines 12)
- 7 -

dual reticulation The supply of water from two separate sources, requiring two sets of pipes: one to provide drinking water (for drinking, cooking, bathing and laundry purposes); the other to provide appropriately treated non-drinking water (e.g. raw water or recycled water) for purposes such as toilet flushing, garden watering/irrigation and other external uses or industrial applications.
ecological footprint (EF)
Used to convey the environmental impacts associated with a development. It is a tool that calculates the area of land required to provide all energy and material resources consumed and includes all wastes discharged for each option.
ecological sustainable development
3 Principles of ecological sustainable development are:
(a) decision-making processes should effectively integrate both long-term and short-term economic, environmental, social and equitable considerations;
(b) if there are threats of serious or irreversible environmental damage, lack of full scientific certainty should not be used as a reason for postponing measures to prevent environmental degradation;
(c) the present generation should ensure the health, diversity and productivity of the environmental is maintained or enhanced for the benefit of future generations;
(d) the conservation of biological diversity and ecological integrity should be a fundamental consideration in decision making;
(e) recognition of the need to develop a strong, growing and diversified economy that can enhance the capacity for environmental protection; and
(f) decisions and actions should provide for broad community involvement in issues affecting them.
economic analysis Assesses the overall impact of a project on the local, regional or state economy.
economically viable 3 Evaluation of whether the gains from a project outweigh the costs of a project. Economic evaluation is undertaken from the perspective of the economy as a whole and does not differentiate between winners and losers.
effluent 2 Treated or untreated liquid waste flowing from a sewage treatment plant or from agricultural and industrial processes.
Electrical Conductivity (EC)
A measure of the concentration of salts in a solution
environmental flow 2 The release of water from storage to a stream to maintain the healthy state of that stream.
environmental outcomes or impacts
These include efficient resource use, environmental impacts, and environmental compliance.
- 8 -

Equivalent Person (EP)
The water supply demand or the quantity and/or quality of sewage discharge for a person resident in a detached house.
It is also applied to:
The number of persons who would have a water demand equivalent to the establishment being considered.
The number of persons who would contribute the same quantity and/or quality of domestic sewage as the establishment being considered.
event 6 An incident or situation, which occurs in a particular place during a particular interval of time.
external recycling 2 The use of recycled water that has been produced by another organisation.
external water use / demand
11 Water used externally in activities such as garden watering or irrigation, car washing, filling swimming pools.
externality 3 A benefit (positive externality) or cost (negative externality) borne by a third party (including the environment) who cannot pay or be compensated for the benefit or cost through the normal market mechanism.
financial analysis Evaluates the financial viability of a project from the perspective of the service provider.
financial viability 3 A project is financially viable if the revenues from the project cover the project costs and earn a commercial return on investment. Financial evaluation is considered from the perspective of the project developer.
financial/economic outcomes or impacts
These include organisational financial performance, efficiency, dividend payments, return of assets, economic impacts on key stakeholders, e.g. customers, employees or developers.
greywater Wastewater from the laundry, bathroom and kitchen that has not been in direct contact with toilet waste (blackwater).
groundwater Subsurface water from which wells, springs, or bores are fed; strictly the term applies only to water below the water table.
groundwater infiltration
Groundwater (non-rainfall dependent infiltration). Generally exists for sewers laid below groundwater table. Groundwater infiltration enters the system via defective pipes or joints and leaking manhole walls.
hazard A source of potential harm or a situation with a potential to cause loss.
health determinants Health determinants are those factors that have either a positive or negative influence on health at the individual or population level. They include social support networks, employment and working, physical environments, education, personal health practices and coping skills, health services, biology and genetic, income and social status.
- 9 -

hurdle rate 3 The rate of return which is required to be demonstrated to be able to be met before a capital investment project should be commenced; i.e. It is the level of profitability which the proposed project is required to exceed (or “hurdled”) to be accepted for development.
influent 2 Liquid waste flowing into a treatment facility.
Interim Resource Operations Licence (IROL)
See Resource Operations Licence
internal rate of return 3 The discount rate at which a project has a net present value of zero.
internal water use / demand
11 Water used internally in buildings and would also encompass any other water consumption that is not influenced by climate. This demand is assumed to remain unchanged by seasonal effects during the year.
irrigation 2 The watering of crops, pasture, golf courses, parks, gardens and open spaces, which may involve using different applications (e.g. drip, trickle, spray and flood).
knowledge management
4 A multi-disciplined approach to achieving organisational objectives by making best use of knowledge. It involves the design, review and implementation of both social and technological processes to improve the application of knowledge, in the collective interest of stakeholders. Two types of knowledge exist, namely
(i) Explicit knowledge – knowledge that has been recorded as information in a document or some other medium; and
(ii) Tacit knowledge – information that resides in a person’s mind and may include aspects of culture or “ways of doing things”.
lamphole 1 Small diameter flushing and rodding point which does not provide for operator access to a sewer.
least cost planning 11 Least Cost Planning or Integrated Resource Planning aims to identify an appropriate balance between system operation/capacity expansion costs and the savings associated with programs aimed at increasing the efficiency of water use.
lifecycle assessment (LCA)
An environmental assessment of the overall mass balance of an option, from the production of raw materials to the ultimate disposal of all wastes.
likelihood 6 Used as a qualitative description of probability or frequency.
maintenance hole See access chamber.
manhole See access chamber.
mean day maximum month
Highest 30 day moving average daily water demand during a year.
- 10 -

modified conventional sewerage
1 Similar to conventional gravity sewerage but with extensive use of access chamber lift pumping to reduce excavation, replacing access chambers with lampholes, using small diameter reticulation mains and adopting flatter sewer grades.
multi-criteria analysis A means of ranking options based on financial and non-financial criteria.
net present value 3 The discounted value of the expected benefits of a project, less the discounted value of the expected costs.
nitrification 1 Transformation of inorganic ammonium into nitrate.
non-drinking water Any water other than drinking water.
nutrients 1 Elements essential for sustained plant or animal growth e.g. nitrogen, phosphorous and potassium.
non-revenue water 14 Components include real and apparent water losses and unbilled authorised consumption. Refer to IWA “best practice” standard approach to water balance calculations.
optimism bias 10 A tendency for under-estimation of costs and project duration and over estimation of benefits.
pathogens 1 Micro-organisms that are potentially disease-causing; include bacteria, protozoa and viruses.
peak day demand 1 Maximum demand in any one day of the year.
peak dry weather flow 7 The most likely peak sanitary flow in a sewer during a normal day. It exhibits a regular diurnal pattern with morning and evening peaks.
peak hour demand Peak hourly demand a system will be called on to supply.
peak wet weather flow Includes peak dry weather flow, groundwater infiltration and rainfall dependent infiltration.
pH 1 A measure of hydrogen ion concentration (0 – acid, 14 – alkaline, 7 – neutral).
point of use treatment Supplementary treatment provided by consumer at the point of use (e.g. kitchen tap).
Public Private Partnership (PPP)
A PPP is a risk-sharing relationship between the public and private sectors to deliver timely public infrastructure and services. Objectives include:
Delivery of improved services and better value for money through appropriate risk-sharing.
Encouraging private sector innovation. Optimising asset utilisation. Integrating whole-of-life management of public
infrastructure.
- 11 -

rainfall dependent inflow & infiltration
Peak (rainfall dependent) inflow and infiltration. This includes flow discharges into the sewer from:
unauthorised roof, ground or stormwater drainage leaking manhole covers disconnected sewers low disconnector traps. indirect infiltration of rainwater entering defective pipes
and joints from the surrounding soil.
rainwater tanks 2 Tanks used to collect and store rainfall from household roofs for beneficial use.
raw water Water that forms the source supply for drinking water before it has been treated.
recycled water 2 Appropriately treated effluent and stormwater.
Resource Operations Licence (ROL)
Licence issued under a Resource Operations Plan (ROP). It includes details of the water infrastructure, such as dams and weirs, covered by the licence and the conditions that the holder of the licence must comply with, including operating arrangements and water supply requirements. http://www.dnrm.qld.gov.au/water/catchments-planning/planning-process
Resource Operations Plan (ROP)
A Resource Operations Plan (ROP) details how the objectives of a Water Resource Plan (WRP) will be achieved and provides operational rules to ensure security of water supply and environmental objectives are met.
reticulated water supply
1 Water supply network that provides a piped water supply to each dwelling, commercial or industrial premises.
risk 6 The chance of something happening that will have an impact upon objectives. It is measured in terms of consequences and likelihood.
risk analysis 6 A systematic use of available information to determine how often specified events may occur and the magnitude of their consequences.
risk assessment 6 The overall process of risk analysis and risk evaluation.
risk level 6 The level of risk calculated as a function of likelihood and consequence.
risk management 6 The culture, processes and structures that are directed towards the effective management of potential opportunities and adverse effects.
risk reduction 6 A selective application of appropriate techniques and management principles to reduce either likelihood of occurrence or its consequences, or both.
risk treatment 6 Selection and implementation of appropriate options for dealing with risk.
septic tank 1 Sewage treatment device providing a form of primary treatment of sewage comprising sedimentation of settable solids, flotation of oils and fats, and anaerobic digestion of sludge.
- 12 -

septic tank effluent pumping (STEP)
1 A system in which the effluent from septic tanks is pumped to a treatment works using small diameter pipes; also known as common effluent pumping.
septic tank/soil absorption system
1 A household sewage treatment and effluent management system involving sedimentation in an underground tank followed by percolation of the effluent into the soil from a subsurface distribution system.
sequential design & construction
5 Involves separate stages for design and construction. These stages could be undertaken by in-house teams or external contractors.
sewage 2 The used water of a community or industry, containing dissolved and suspended matter (also called wastewater).
sewer mining 2 Diversion and treatment of raw sewage for on-site purposes such as irrigation. Treatment process waste is returned to the sewer.
sewerage The sewerage system comprises the pipes, pumps and plant needed to collect, transport and treat sewage.
sewerage reticulation 1 Sewage collection and transport network.
sludge The unstabilised concentrated solids produced during a wastewater treatment process. Sludge can be beneficially used after further treatment to produce biosolids.
smart sewers Systems designed to modified design criteria which take advantage of modern materials and design and construction approaches to produce a lower cost collection system without any loss in the quality of service to customers.
social outcomes or impacts
These include customer service, a health determinant impact on the community, employee work conditions and health and safety.
stakeholders Stakeholders include persons or groups who will define, constrain, influence or decide on planning options and all those affected through implementation of the planning recommendations to those using or receiving the resulting services.
Key stakeholder groups will include customers, business owners, and regulators. For most planning exercises, “environmental representatives”, the “community” and the “service provider” will be stakeholders. A “stakeholder” may also be defined as anyone who directly or indirectly receives the benefit, or sustains the costs, resulting from the implementation of a project. Primary stakeholders are those stakeholders that will be closely linked to a particular aspect or phase of the planning or asset lifecycle. These primary stakeholders may change over the planning or asset lifecycle.
standpipe 1 A pipe structure with a control valve and overhead outlet used for filling water tankers.
stormwater 2 All surface water runoff from rainfall, predominantly in urban catchments. Such areas may include rural residential zones.
- 13 -

sullage 1 Refer to greywater.
suspended solids (SS) 1 Solids retained after filtration through a glass fibre filter paper.
trade waste 9 Water borne waste from business, trade or manufacturing premises other than waste that is a prohibited substance or human waste or stormwater.
treated effluent Aqueous waste flowing from sewage treatment plants or agriculture and industry processes, that has been treated to improve its quality.
triple bottom line An integrated approach to the achievement of environmental, social and economic outcomes.
vacuum sewerage (VS) 1 A system in which all sewage is conveyed by a vacuum in the sewage collection network.
variable grade sewers (VGS)
1 A system with inflective grades allowing construction in undulating areas. Parts of the sewer will always be full.
wastewater 1 Refer to sewage.
water losses Refer to non-revenue water
water mining Refer to sewer mining.
water quality 2 The chemical, physical and biological condition of water.
water recycling 2 Use of appropriately treated wastewater and urban stormwater for further beneficial purposes.
water resource 2 The sources of supply of ground and surface water in a given area.
Water Resource Plan (WRP)
A Water Resource Plan (WRP) is prepared by the State Government as a requirement of the Water Act 2000. A WRP provides a framework for sustainable management of water in a catchment in terms of social, economic and environmental needs including water allocation for human use (urban, industry, agriculture, mining) and for the preservation of the health of the aquatic environment. A Water Resource Plan may also establish the basis for water allocations to be traded on a permanent basis. Water Resource Plans are published as subordinate legislation to the Water Act 2000 and implemented through a Resource Operations Plan (ROP). (http://www.dnrm.qld.gov.au/water/catchments-planning/planning-process)
weighted average cost of capital (WACC)
3 The method for calculating the cost of capital of a business, which comprises both the cost of debt and the cost of equity, weighted according to their respective significance in the organisation’s capital structure.
wet composting toilet 1 Treats all household sewage and putrescible household food and other organic solid wastes. Uses aerobic composting to break down the solid waste. The treated effluent requires management in an on-site (e.g. land application system) or off-site (e.g. CED) effluent management system.
- 14 -

1 Water Services Association of Australia (WSAA), Affordable Water Supply & Sewerage for Small
Communities. 2 Queensland Department of Environment and Resource Management (formerly Environmental Protection
Agency), Queensland Government, Queensland Water Recycling Guidelines. 3 Queensland Government, Guidelines for Financial and Economic Evaluation of New Water Infrastructure in
Queensland. 4 Interim Australian Standard AS5037 (Int) – 2003 5 Adapted from Water and Sewerage Infrastructure Delivery Options, Department of Land and Water
Conservation (DLWC), Local Government and Shires Association, NSW, 1999. 6 AS/NZS4360:1999. Risk Management. 7 Water Services Association of Australia, 2002, Sewerage Code of Australia (WSA02 – 2002). 8. ANZECC/ARMCANZ 2000, Australian and New Zealand Guidelines for Fresh and Marine Water Quality. 9 Water Act 2000. 10 HM Treasury, Supplementary Green Book Guidance – Optimism Bias. 11 Improving Water Use Efficiency in Queensland’s Urban Communities. 12 NHMRC/NRMMC 2004, Australian Drinking Water Guidelines. 13 Guidelines for Preparing Strategic Asset Management Plans 14 International Water Association, 2000, Losses from Water Supply Systems: Standard Terminology and
Recommended Performance Measures 15 Water Services Association of Australia, 2002, Water Supply Code of Australia
4 Abbreviations ABS Australian Bureau of Statistics
AD average day demand
ADWF average dry weather flow
ANZECC Australian and New Zealand Environment and Conservation Council
ARI average recurrence interval
ARMCANZ Agriculture and Resource Management Council of Australia and New Zealand
AS/NZS Australian Standard/New Zealand Standard
BNR biological nutrient reduction
BOD biochemical oxygen demand
BOO build, own, operate
BOOT build, own, operate, transfer
BTO build, transfer, operate
BWL bottom water level
°C degrees Celsius
CED common effluent drainage
CSO community service obligation
CSS customer service standard
D&C design and construction
DEWS Department of Energy and Water Supply (Qld) – includes the former Department of Environment and Resource Management (DERM)
EIS environmental impact statement
EF ecological footprint
- 15 -

EP equivalent person
ERA environmentally relevant activity
GFA gross floor area
GIS geographical information system
GWI groundwater infiltration
ha hectares
HU Hazen units of colour
IDAS integrated development assessment system
I/I Infiltration/inflow
IIF rainfall dependent inflow and infiltration
IROL interim resource operations licence
IRR internal rate of return
ISO International Standards Organisation
kL kilolitres
IWA International Water Association
kPa kilopascals
kWh kilowatt-hours
LCA life cycle assessment
LCP least cost planning
L/s litres per second
m metres
MCS modified conventional sewerage with lift pumping
MD maximum day demand
MDMM mean day maximum month demand
mg/L milligrams per litre
MH maximum hour demand)
ML megalitres
mL millilitre
ML/a megalitres per annum
ML/d megalitres per day
mm millimetre
N nitrogen
NHMRC National Health and Medical Research Council
NPV net present value
NRMMC Natural Resource Management Ministerial Council
NRW non-revenue water
NTU nephelometric turbidity units
- 16 -

NWQMS National Water Quality Management Strategy
O&M operation and maintenance
OMA operation, maintenance and administration
P phosphorous
PD peak day demand
PDF peak daily flow
PDWF peak dry weather flow
pH hydrogen ion activity
PH peak hour demand
PPP public private partnership
PV present value
PWWF peak wet weather flow
QPI&F Queensland Primary Industries and Fisheries (part of Queensland Department of Employment, Economic Development and Innovation)
QWRS Queensland water recycling strategy
ROL resource operations licence
ROP resource operations plan
RTU remote terminal unit
SAMP strategic asset management plan
SCADA supervisory control and data acquisition
SS suspended solids
STEP septic tank effluent pumping, also known as common effluent pumping (CEP)
STP sewerage treatment plant
TWL top water level
UV ultra-violet radiation
VGS variable grade sewerage
VPO vegetation protection order
VS vacuum sewerage
WRP water resource plan
WSAA Water Services Association of Australia
- 17 -

Chapter 1 The regulatory framework
1 Purpose
The purpose of this chapter is to provide an overview of the regulatory framework as it applies to the planning of water supply and sewerage services.
2 Key principles
Planners must be aware of the regulatory framework and its potential impacts on options and implementation programs relating to the provision of water supply and sewerage services.
3 Why is this important?
Properly managed water supply and sewerage services are essential for the maintenance of public health and ensuring the wellbeing of communities. Poorly managed water supply and sewerage services can threaten public health and result in environmental harm. To ensure that these services are properly managed a significant legislative and regulatory framework exists that must be complied with by those responsible for the provision and management of these services
It is important that planners are aware of the legislative and regulatory framework relating to water supply and sewerage services because:
Non compliance may result in prosecution or loss of reputation. Community health and wellbeing may be threatened. Significant project delays may result in order to rectify failures of compliance with
approvals processes. Projects and approval processes may have regulator imposed deadlines. Financial and other incentives from State and Federal Governments may apply.
To ensure implementation of “best practice” and to minimise risk, planners should keep abreast of new or updated standards, guidelines and codes.
4 When is knowledge of the regulatory framework required?
Maintaining and updating knowledge of the regulatory framework (Federal, State and Local Government), standards, guidelines and codes is an important ongoing process for all planners. Ignorance of regulatory requirements and standards etc. is not a defence against legal action.
5 Key elements
Table 5.1 provides a summary of the key matters to be addressed by certain legislation in relation to water supply and sewerage provision. It is not a summary of all the legislation which may directly or indirectly apply to these services. It must be recognised that the whole legal framework can impact on various aspects of the provision of these services. Planners should obtain their own legal advice to ensure they comply with legislative requirements.
- 18 -

Table 5.1 – Overview of regulatory framework
Act (includes subordinate
legislation under the Act) Summary Requirements
Water Supply (Safety and Reliability) Act 2008
The powers and obligations for service providers in providing water and sewerage services: Service provider must be registered. Preparation of:
o Strategic Asset Management Plan (SAMP) and Customer Service Standards (CSS).
o System Leakage Management Plans o Drought Management Plans
Requirements also include o annual reporting o regular reviews and audits.
Power of entry provisions (restricted to matters relating to service provider’s infrastructure) Water allocation/access to water resources. Construction of a Dam: Subject to size parameters set out in the Act, a failure impact
assessment may need to be undertaken to determine if structure is a referable dam.
For certain dams preparation of a flood mitigation manual is required.
Development permit required (refer section on Sustainable Planning Act).
Work within a watercourse, lake or spring – Permit required.
Aboriginal Cultural Heritage Act 2003 Torres Strait Islander Cultural Heritage Act 2003
Cultural heritage duty of care. Development or activity impacting on Aboriginal or Torres Strait Islander cultural heritage – Cultural Heritage Management Plan is to be developed under certain circumstances. Aboriginal Cultural Heritage and Torres Strait Islander Cultural Heritage Databases and Registers to be consulted.
Acquisition of Land Act 1997
Defines a local government’s powers and responsibilities, as a constructing authority, for taking land (resumptions, easements).
Coastal Protection and Management Act 1995
For work within/across a tidal area or waterway - riverine protection permit required from NR&M.
Community Services (Torres Strait) Act 1984
Powers and responsibilities for management of Island Council areas.
Council Regulations Project impacts on an area with a Vegetation Protection Order (VPO) – Council approval required to destroy or interfere with vegetation under a VPO.
Environment Protection and Biodiversity Conservation Act 1999 (Commonwealth)
Commonwealth assessment and approval regime to be followed for any project or an activity that impacts on: World Heritage properties (e.g. Great Barrier Reef, Wet Tropics or
Fraser Island) a Ramsar wetland of international importance (e.g. Moreton Bay,
Great Sandy Strait, Bowling Green Bay) migratory species, threatened species or ecological communities
listed under commonwealth legislation.
- 19 -

Act (includes subordinate
legislation under the Act) Summary Requirements
Environmental Protection Act 1994 Environmental Protection Regulation 1998 Environmental Protection (Water) Policy 2009 Environmental Protection (Noise) Policy 1997 Environmental Protection (Air) Policy 1997
The Department of Environment and Heritage Protection (DEHP) – previously DERM – sets licence conditions for Environmentally Relevant Activities (ERA’s) (both water and sewage treatment plants) under the Act. Development Approvals – IDAS process needs to be followed: Upgrading or constructing sewage treatment plant for 21 or more
EP. Upgrading or constructing water treatment plant. Environmental authority required to operate: sewage treatment plant for 21 or more EP water treatment plant (other than treatment that only involves
disinfection). Sludge/biosolids management: [refer DEHP’s Operational Policy “Management for beneficial reuse of biosolids from sewage treatment plants (STP) and other sources”] For beneficial use of biosolids on land, DEHP uses the Environmental Management Program (EMP) process. Sludge/biosolids disposal will require an environmental authority. Site Management Plan will be required for contaminated sites listed
on the Environment Management Register. Environmental Protection Policies: Water:
o Preparation of Environmental Plans by the local government sewage management (i.e. I/I management) trade waste management water conservation management
o On-site domestic wastewater treatment systems – cumulative impacts.
Noise and Air. The Act defines the process for undertaking an EIS when required. Work within/across non-tidal or fresh waterway (i.e. bed or banks of a creek) – Dredging permit required from DEHP. Removal of soil from site – determine if site listed on Environmental Management Register. Then a Site Management Plan is required.
Financial Administration and Audit Act 1977
Financial management policies and principles in relation to State Government departments and statutory bodies.
Fisheries Act 1994 Construction of a waterway barrier – approval required from Queensland Primary Industries and Fisheries (QPI&F) – part of the Department of Employment, Economic Development and Innovation. Direct impact of construction through a mangrove/wetland – Section 51 approval required from QPI&F. Indirect impact (construction adjacent to or future operation) on a mangrove/wetland – Section 51 approval required from QPI&F.
- 20 -

Act (includes subordinate
legislation under the Act) Summary Requirements
Great Barrier Reef Marine Park Act 1975 (Commonwealth) Great Barrier Reef Marine Park Regulations 1993. Sewage Policy 1991 (amendment 1993)
Tertiary treatment standard, as defined in the Regulation, required for discharge of effluent from fixed structures on islands into the Great Barrier Reef Marine Park.
Health Act 1937 Provision of water or sewerage services including reuse - general requirements in relation to: Local government to act to prevent the occurrence of a notifiable
disease within its area. Prohibition on business activity that is a nuisance or injurious to the
health of any of the inhabitants of an area. Provisions for mosquito and vermin control. Prohibition of the carrying off of sewage or stormwater drainage to
particular places.
Sustainable Planning Act 2009
Assessable development requiring the Integrated Development Approval System (IDAS) to be followed for the following activities (see the Sustainable Planning Act for details): Development undertaken on a registered place under the
Queensland Heritage Act 1992. Work involving clearing of native vegetation. Operational and construction work for taking or interfering with water
under the Water Act 2000: o Taking, or interfering with, water from a watercourse, lake or
spring or from a dam constructed on a watercourse. o Taking, or interfering with, artesian water. o Taking, or interfering with: overland flow water; or sub-artesian water;
o Controlling the flow of water into or out of a watercourse, lake or spring in a specified area declared under the Water Act 2000.
Construction of a referable dam under the Water Supply (Safety and Reliability) Act 2008.
Increase in the storage capacity of a referable dam by more than 10%.
Tidal works. Works carried out completely or partly within a coastal management
district. Reconfiguring a lot under the Land Title Act 1994. Development prescribed under a regulation under the Environmental
Protection Act 1994 as an environmentally relevant activity (e.g. water and sewage treatment plants).
Preparation of Infrastructure Charges Schedule or Infrastructure Agreement. Infrastructure standards included in local government’s planning scheme / planning scheme policy.
- 21 -

Act (includes subordinate
legislation under the Act) Summary Requirements
Land Protection (Pest and Stock Route Management) Act 2002
Requirements for declared pests and pest management plans - may be relevant to water supply catchments, storages (declared water weeds and other pests).
Local Government Act 1993
Policies and principles in relation to local government financial management, corporate and operational plans, National Competition Policy, full cost pricing. Provides powers for charging for water and sewerage services. Power of entry provisions.
Local Government (Community Government Areas) Act 2004
Declares Aboriginal councils as local governments (shire councils) Under the Local Government Act 1993 and aligns their governance with the Local Government Act 1993.
National Measurement Act 1960 (Commonwealth)
Requirements in relation to water meters. From 1 July 2004 all new domestic water meters need to have pattern approval, verification and reverification.
Native Title Act 1993 (Commonwealth) Native Title (Queensland) Act 1993
Access and impacts on land subject to Native Title.
Plumbing and Drainage Act 2002
Construction of a sewage treatment works less than 21EP and on-site land application of effluent. Greywater use in sewered areas (late 2005). Technical standards specified in On-site Sewerage Code (or Queensland Plumbing and Wastewater Code when adopted late 2005).
Queensland Competition Authority Act 1997
Pricing of water and sewerage services. Compliance with National Competition Policy principles.
Queensland Heritage Act 1992
Conservation of Queensland’s cultural heritage.
Statutory Bodies Financial Arrangements Act 1982
Management of the powers of statutory bodies including local governments to enter into financial arrangements.
Trade Practices Act 1994 (Commonwealth)
Provision of water and sewerage services including effluent recycling – product “fit for purpose” and liability issues.
Vegetation Management Act 1999
Regulates the clearing of vegetation.
Wet Tropics World Heritage Protection and Management Act 1993
Establishes the Wet Tropics Management Authority and sets constraints on certain activities in wet tropics area.
Workplace Health & Safety Act 1995
Defines the obligation to prevent a person’s death, injury or illness being caused by a workplace, by workplace activities or by specified high risk plant.
6 Checklist
Have all compliance issues been considered in the planning studies and have all relevant regulatory bodies been consulted?
- 22 -

Has sufficient allowance been made in the implementation program for obtaining relevant approvals?
Is there a need for specific legal advice?
- 23 -

Chapter 2 Knowledge management
1 Purpose
Effective knowledge management is a critical foundation for quality infrastructure planning. Without this foundation, the resources allocated to planning studies become focussed on information capture and verification. This diverts the allocation of resources from the application of strategic thinking skills in developing and critically evaluating options to provide optimal solutions for stakeholders.
This chapter provides an overview of knowledge management as it applies to the planning process. It is based on the interim Australian Standard AS 5037 (int) 2003 Knowledge Management.
Definitions
Knowledge Management1
“A multi-disciplined approach to achieving organisational objectives by making best use of knowledge. It involves the design, review and implementation of both social and technological processes to improve the application of knowledge, in the collective interest of stakeholders.” Two types of knowledge exist, namely:
Explicit knowledge – knowledge that has been recorded as information in a document or some other medium; and
Tacit knowledge – information that resides in a person’s mind and may include aspects of culture or “ways of doing things”.
Data2
A set of discrete, objective facts about events; Provides no judgement or interpretation; Gives no sustainable basis for action; It cannot tell you what to do; and Says nothing about its own importance or irrelevance.
Data is important to organisations because it is essential raw material for the creation of information.
Information2
Unlike data, information has meaning. Data becomes information when its creator adds meaning. We transform data into information by adding value in various ways:
Contextualised: we know for what purpose the data was gathered Categorised: we know the units of analysis of key components of the data Corrected: errors have been removed from the data Calculated: the data may have been analysed mathematically or statistically Condensed: the data may have been summarised in a more concise form
Knowledge2
1 Interim Australian Standard AS5037 (Int) – 2003 2 Working Knowledge: How Organisations Manage What They Know. Davenport, T.H, Laurence P. Harvard
Business School Press 1998
- 24 -

Knowledge derives from information as information derives from data. If information is to become knowledge, human action must be directly involved in the transformation. This transformation happens through such actions as:
Comparison: how does information about this situation compare to other situations we have known?
Consequences: what implications does the information have for decisions and actions? Connections: how does certain information relate to other information? Conversation: what do other people think about this information?
2 Key principles
The management of both explicit and tacit knowledge facilitates effective and efficient planning.
Effective knowledge management exists when there is:
a culture of knowledge sharing within an organisation and with key stakeholders a process in place for:
o capture of explicit knowledge o sharing tacit knowledge o continual learning and improving
appropriate information systems in place to collect, analyse and transfer knowledge an understanding of what knowledge is required and where it can be accessed.
3 Why is knowledge management important?
Knowledge management is an important support process for planning because:
Planning requires access to a wide range of complex and inter-related information. It minimises the loss of critical knowledge when key personnel (which is usually one
person in a small service provider) depart from the organisation. The move from hardcopy to electronic data storage requires rigorous management to
ensure data integrity. Water and sewerage provision requires the input of a range of specialists and disciplines. It improves the efficiency of planning as:
o Resources can be focussed on analysis and optimisation rather than data collection and verification.
o Inputs are comprehensive, reliable and timely. It contributes to continuous improvement through the feedback of experiences and
knowledge into the planning process. It facilitates cooperative sharing of knowledge within an organisation and with external
stakeholders. It ensures that systems are in place to deliver information that is readily accessible,
accurate, consistent and current.
4 When should knowledge management be undertaken?
Knowledge management already exists to varying degrees in all organisations which involve a continuous process of:
creating, discovering and acquiring knowledge capturing and storing knowledge
- 25 -

presenting, distributing and sharing knowledge revising and disposing of knowledge.
Knowledge management procedures should be implemented to address the full asset lifecycle.
5 Key elements
Key elements of developing appropriate knowledge management for the planning process are illustrated in Figure 5.1.
FIGURE 5.1 –Alignment with corporate knowledge management
Knowledge management initiatives related to water and sewerage planning should align as far as is practicable with the overall organisational knowledge management strategies particularly in regard to:
technology and systems document and records management.
5.1 Identification of the knowledge required This involves identifying and prioritising what knowledge is required to provide effective and efficient planning. This would include knowing about:
the strategic direction for the service provider the outcomes from local, regional and State planning initiatives the regulatory framework including compliance and approvals trends in the water industry both in Australia and overseas the needs of customers and other stakeholders how particular planning studies relate to other planning studies what planning has previously been undertaken factors that affect critical planning data (e.g. what is the basis of unit demands? What is
the basis of cost estimates?) regional issues that will impact on water and sewerage service provision or be impacted
by these services experiences of the organisation or other organisations with similar projects in the past issues that have potentially serious impacts on the service provider in the future (e.g.
climate change).
Identify the Knowledge Required
Knowledge Management for Planning
Determine the Current Situation
Identify the Tools Available
Develop & Implement a Knowledge
Management Strategy
Corporate Knowledge Management
Identify the Knowledge Required
Knowledge Management for Planning
Determine the Current Situation
Identify the Tools Available
Develop & Implement a Knowledge
Management Strategy
Corporate Knowledge Management
- 26 -

5.2 Determine the current situation This would involve determining:
how the required knowledge is collected, stored and shared what other planning related knowledge is collected, stored and shared and why.
This allows gaps between knowledge requirements and current capabilities to be quantified. It may be necessary to delay the planning process and implement some monitoring in order to collect additional data where very little is currently available.
5.3 Identification of knowledge management tools available AS5037 provides a comprehensive listing of knowledge management tools, techniques and approaches (termed “enablers”). Table 5.1 provides a summary listing of potential tools that could be readily applied to the planning process.
Some service providers are utilising AS/ISO10007 – Quality Management Systems Guidelines for Configuration Management to assist them to maintain information integrity and reliability.
Benchmarking is a powerful knowledge management tool. It allows a service provider to measure its performance and search for best practices that can be adapted to its own organisation. There are two components of a benchmarking exercise. These include:
Metric benchmarking. This involves the development of performance indicators to measure the efficiency and effectiveness of current performance and to track future performance. These indicators can be compared to the organisations to assess comparative performance and identify potential areas for improvement.
Process benchmarking. This involves identifying and implementing process changes to achieve or exceed performance targets. Metric benchmarking will identify where performance gaps exist and organisations which are achieving best practice. Process benchmarking involves understanding the processes that contribute to best practice outputs and outcomes, and adapting these processes to one’s own organisation.
TABLE 5.1 – Tools available
Tool Description Typical Application for Planning
Organisational Learning
Learning from situations and using this learning to continuously improve
Post completion audits/reviews in relation to project outputs (costs, benefits, timeliness, quality) outcomes. Learning from the experiences of others through: - Peak bodies (e.g. Queensland Water
Directorate, AWA) - Meeting with similar organisations - Conferences/seminars - Technical literature - Benchmarking
Innovation Sharing of knowledge and creativity.
Value management or similar workshops during all stages of the planning cycle. Workshops to include planning and operational staff plus other stakeholders as appropriate.
Organisational Memory
A means by which past knowledge is brought to
Post completion audits Documenting information before departure of
- 27 -

Tool Description Typical Application for Planning bear on present activities key staff
Documented procedures for the planning process Documented Operations Management Plan that is maintained up to date
Meetings Cross-team meetings to foster innovation and for the sharing of “lessons learnt”
Regular and structured meetings between planning and operations staff and where appropriate, relevant stakeholders.
Mentoring and Coaching
Transfer of expertise and tacit knowledge from expert to less experienced or knowledgeable staff
Mentoring and skills transfer from senior planner to more junior staff. Transfer of external consultant’s knowledge to service provider staff. Apply approaches that keep knowledge with the service provider staff rather than developing knowledge externally
Knowledge Literacy and Resourcing
Skills, attitudes and mindset to acquire knowledge
Openness to new ideas and willingness to share knowledge. Assimilation of new knowledge into the planning process.
Market Research Customer and other stakeholder surveys.
Information Management
Collection, storage, analysis and presentation of outputs
Typical planning related information is listed in Table 5.2.
Document Records Management
Registration, storage and retrieval of planning related documents (hardcopy and digital) including: - Planning reports - Models - Calculations - Supporting studies - Spreadsheets and databases - GIS files - Drawings
Technology & Systems – Communication
Utilisation of telemetry system outputs.
Databases Databases/spreadsheets
Portals, Intranets and Extranets
Use of Internet and web technologies to support groups, formal work units or informal communities of practice
Systems for sharing planning data and knowledge across the organisations.
Search Engines Accessing of relevant information from Internet.
- 28 -

TABLE 5.2 – Typical planning related information
Category Information
Benchmarking Benchmarking information from similar organisations
Compliance Regulatory requirements
Control Telemetry system outputs
Customer Census data
Number/type of connections
Occupancy ratio
Aspirations and/or expectations
Socio-economic distribution, particularly ‘capacity-to-pay’
Water demand/sewage flow
Current demands
Flows by customer type
Customer water meter readings
Daily demand/flow
Daily rainfall
Daily temperature
Demand/flow projections by customer type
Diurnal demand patterns by customer type
Diurnal demand/flow patterns
Duration and extent of water restrictions
External water use
History of demand management initiatives
Internal water use (by type)
Peaking factors by customer type
Seasonal extremes (tourist areas)
Trade waste (quantity and quality)
Water losses
Documentation Demand management/ water loss studies
I/I management studies
Previous planning studies
Financial Capital cost estimates
Operation, maintenance & administration (OMA) costs including components
OMA cost estimates
Tariff (including historical changes)
Unit rates
Infrastructure Asset condition/ performance
Design criteria
Size, location, capacity, age, levels
- 29 -

Category Information
Knowledge “As constructed” drawings
Experiences of other authorities as well as own authority
Models Hydrological, hydrogeological and hydraulic analyses
Network models
Population models
Treatment process models
Operation & maintenance
Energy consumption
Information on how the system is operated and reasons for the operating philosophy
Operational experience
Operational objectives
Operational settings (including seasonal adjustments)
Pump hours
Staffing - resources and capabilities
System operation including zonings
Regulatory framework Legislation, standards, guidelines, codes, and industry “best practice”
Risk management Risks associated with water and sewerage provision
System security
Service standards Complaints
Current service levels
Service standards
Source Groundwater levels
Streamflows
Spatial Aerial photographs
Land use classification
Land use plans
Priority infrastructure plans
Stakeholders Stakeholder requirements
Strategic Direction Organisational objectives
Treatment Wastewater composition
Treatment plant unit performance and efficiency
Water quality (raw and treated)
- 30 -

5.4 Develop and implement knowledge management strategy As illustrated in Table 5.1 and in the interim Australian Standard (AS 5037-2003) a number of strategies exist to maximise use of knowledge within an organisation. The strategies depend on:
the size of the organisation and available resources the benefit/cost of implementing the strategies.
6 Checklist
How confident are you that the data being used in the planning study is reliable? What has been done to ensure this level of confidence?
Has the tacit knowledge of operational staff been effectively utilised?
Have you learnt from the experiences of others? How?
How has the knowledge gained by the external consultant been transferred to the service provider?
How has the service provider been included in the collection and processing of information so that they have ownership of the knowledge?
Are the outputs of planning studies registered in a corporate library (hardcopy and digital)?
How have you been able to minimise the impact of losing key planning staff?
Have outcomes of planning studies been clearly communicated to stakeholders?
- 31 -

Chapter 3 The planning process
1 Purpose
The purpose of the planning process is to:
Identify service needs in the short, medium and long term in order to deliver defined service standards, social, environmental and financial outcomes.
Evaluate options for delivering the defined outcomes. Determine the optimal strategy that delivers the defined outcomes at the lowest financial,
social and environmental (triple bottom line) cost. Communicate the outcomes of the planning process to decision makers through a
planning report.
2 Key principles
Planning should include a comprehensive and rigorous identification of all options to meet the defined service levels, including options based on non-asset solutions.
Planning should be an iterative process which attempts to balance service needs with infrastructure, operation and maintenance, financial and environmental options.
Key stakeholders should be identified and involved up-front in the planning stage.
Non-asset solutions, full lifecycle costs, risk and maximising existing infrastructure capability should be considered before deciding to either construct new assets or replace assets.
Effective planning outcomes can only result from rigorous analysis, the application of strategic thinking skills and the adoption of an integrated approach to urban water planning which considers, where appropriate, water supply, sewerage and management of stormwater as a single system.
3 Why is planning important?
The greatest opportunity to influence project outcomes, minimise risk and reduce costs exists in the early stage of an initiative (i.e. during the planning stage) as illustrated in Figure 3.1. Investment in planning, while often incorrectly seen to be a significant cost, has the potential to result in substantial dividends (financial and non-financial). The cost of planning in comparison to the capital expenditure involved in infrastructure construction and on-going operation and maintenance is low.
FIGURE 3.1 – Ability to influence project outcomes
Abi
lity
to In
fluen
ce
Proj
ect O
utco
mes
Planning Design Construction Operation & Maintenance
Renewal/ Disposal
- 32 -

It is also critical that service providers plan for optimal infrastructure maintenance and
renewal to sustain or improve service standards.
Outcomes from effective planning include:
a common understanding of the issues, options and outcomes by all stakeholders cost effective delivery of services a cost-effective infrastructure investment program achievement of an optimal financial, social and environmental result integration into regional infrastructure planning studies lower costs to the customer continued achievement of service standards protection of the natural and built environment the minimisation of risk appropriate solutions for available skill level.
4 When should planning be undertaken?
For service providers, infrastructure planning should be a continuous process. Planning studies become out of date over time, particularly for schemes subject to high population increase.
Planning would be stimulated by issues such as:
changes in unit demands for services variation in growth projections adverse trends in customer service levels changes in community attitudes changes in technology changes in regulatory requirements or guidelines timeframes for the provision of critical infrastructure to meet service demands (e.g. the
lead time required for the construction of a dam would be at least 10-15 years) the service provider’s Business Plan and the requirements of the TMP/SAMP.
For service providers with a static or declining customer base and limited regulatory requirements for infrastructure investment (e.g. stricter effluent licensing) the planning process may only involve a regular review of:
current and future service needs system capacity and performance to meet the defined service needs asset maintenance and renewal strategies the revenue required to sustainably deliver the service.
5 Key elements
The planning process is illustrated in Figure 5.1. For clarity, the process has been shown to be linear. In practice, it is more likely to be iterative.
- 33 -

FIGURE 5.1 – The planning process
High level inputs are summarised in Table 5.1.
TABLE 5.1 – Higher level inputs
High Level Input Typical Source of Information
Service Provider Strategic Planning
This information would provide the strategic direction for the delivery of water and sewerage services and stormwater management. It would address matters such as customer service standards and financial, social and environmental objectives. This information would typically be provided from, and be consistent with, documentation such as: Corporate Plan Business Plan Operations Plan Total/Strategic Management Plans Strategic Asset Management Plans Customer Service Standards Environmental Management Plans This will be an iterative process. Planning studies and TMP sub-plans would be key supporting documents in determining a strategic direction.
Land Use Planning Strategic Land Use Plan Priority Infrastructure Plan Integrated Catchment Management Plan Note: In terms of long term or strategic water service planning it is necessary to consider timeframes well beyond those of current land use planning.
Regional Planning Regional and Sub Regional Planning Strategy Plans and Studies
Land Use Planning Inputs
Regional Planning Inputs
Other Regulatory Inputs
State Water Planning Inputs
Identify Service Needs
Identify Stakeholder
Requirements
Identify Options for
Service Provision
Develop Implementation
Strategy
Planning Report
Key Support Process
Provide InformationProvide Planning Resources
Key Planning Processes
High level inputs
EvaluateCurrent &
FutureDemands
DetermineScope ofPlanning
DetermineService
Objectives
Water Related Trends
Project Manage the Process
Inputs from Service Provider Strategic
Planning
Analyse Options
Land Use Planning Inputs
Regional Planning Inputs
Other Regulatory Inputs
State Water Planning Inputs
Identify Service Needs
Identify Stakeholder
Requirements
Identify Options for
Service Provision
Develop Implementation
Strategy
Planning Report
Key Support Process
Provide InformationProvide Planning Resources
Key Planning ProcessesKey Planning Processes
High level inputs
EvaluateCurrent &
FutureDemands
DetermineScope ofPlanning
DetermineService
Objectives
Water Related Trends
Project Manage the Process
Inputs from Service Provider Strategic
Planning
Analyse Options
- 34 -

High Level Input Typical Source of Information Regional and Sub Regional Infrastructure Planning Studies Note: It is often necessary to give consideration to jurisdictions beyond those of the particular planning authority (e.g. adjacent local governments)
State Water Planning Water Resource Plan (WRP) Resource Operations Plan (ROP) Resources Operations Licence (ROL/IROL) Regional Water Supply Strategies
Other Regulatory Inputs Sustainable Planning Act 2009 Water Supply (Safety and Reliability) Act 2008 Water Act 2000 Environmental Protection Act 1994 and associated
regulations Environmental Protection (Water) Policy 2009 Native Title Act 1993 Aboriginal Cultural Heritage Act 2003 Torres Strait Islander Cultural Heritage Act 2003 Refer to Chapter 1 – Regulatory Framework for further information.
Water Related Trends This would be assessed from a range of sources and would cover such issues as: climate change status of the environment and future scenarios planning trends (e.g. integrated water management) trends in technology regulatory trends trends in community perception trends in customer needs.
5.1 Identify service need The service need (short, medium and long term) can be identified through:
monitoring of service standards, operational performance, service demand/capacity projections
responding to proposals from developers community requests for service implementing the outcomes of high level inputs such as a service provider’s corporate or
Total Management Plan responding to regulatory changes identified opportunities for service improvements and efficiencies.
In identifying a need, consideration should be given to:
What exactly is the need? If the need is to provide a service, the provision of new infrastructure may only be one option for providing the service.
Whether the need is compatible with the service provider’s strategic direction. What evidence exists to support the need and what is the level of confidence that this
evidence is accurate. Potential solutions to address the need (i.e. new infrastructure or non-asset solutions).
- 35 -

5.2 Determine Service Objectives It is critical before planning commences to define in measurable terms the objectives and critical success factors of an initiative that will deliver the identified service need. These objectives could relate to:
service requirements and standards regulatory compliance operational performance objectives social objectives environmental objectives financial objectives workplace health and safety objectives.
These objectives and critical success factors should be stated clearly in the subsequent planning report.
5.3 Determine Scope of Planning The scope of planning and the resources to be allocated to the activity should correspond to such matters as:
the overall importance to the services to be provided the significance of the failure to deliver the service need the extent of the planning issues to be considered complexity of the issues to be addressed risks associated with meeting the service need costs of a project potential benefits arising from greater investment in planning.
The scope of a planning study and resources to be allocated should be carefully considered before commencing a planning study.
In a number of instances, the planning for an initiative could be undertaken iteratively. The feasibility of an initiative will then determine whether it is progressed into a more detailed planning phase.
Table 5.2 summarises the objectives of the various levels of infrastructure planning.
Every planning study should have a context. For instance strategic/master level planning should be undertaken within the context of regional planning. Detailed level planning should be within the context of strategic level planning.
Wherever possible, planning should be undertaken within an integrated urban water management context. Integrated water management involves considering urban water supply, wastewater and stormwater management within a full water cycle and includes recognising the interactions between these various components.
- 36 -

TABLE 5.2 – Planning levels
Infrastructure Planning Level Output Objectives
Strategic/master planning
Strategic/Master Planning Report
To confirm the service need to be satisfied and its priority. To identify key stakeholders and their requirements. To identify potential options. To determine short, medium and long term (50 year) strategies (infrastructure investment and non-asset solutions) in relation to major scheme components (e.g. sources, trunk mains, treatment plants). To assess the social, environmental and financial implications. To provide a linkage to regional planning. To provide outputs to an Infrastructure Charges Plan. To identify future land requirements.
Concept/ feasibility planning
Concept/ Feasibility Report
To confirm the service need to be satisfied and its priority. To identify key stakeholders and their requirements. To identify potential options. To assess the technical feasibility of a project. To provide indicative estimates of financial and non-financial returns from the project. To provide a broad overview of possible social, environmental and financial implications. To determine whether the service provider should invest in more detailed investigations.
Detailed planning Detailed Planning Report
To provide detailed infrastructure investment and non-asset strategies (short, medium and long term) at zone/sub-catchment level and for facilities such as pump stations and treatment plants. To provide detailed cost estimates. Sufficient work needs to be undertaken to accurately identify lifecycle costs. To provide a precise identification of environmental and social impacts. To provide inputs to an Infrastructure Charges Plan. The detailed planning report will form the basis for a subsequent design report prepared at the commencement of the design phase.
5.4 Identify stakeholder requirements An initiative to address a service need can involve or impact on a range of stakeholders in a variety of ways. It is essential to identify the key stakeholders and their desired outcomes at the outset and determine the potential impacts (both positive and negative) and how these can be managed. Some initiatives may require significant consultation with a range of stakeholders. This is discussed in more detail in Chapter 4 – Stakeholders. For many routine initiatives, stakeholder identification is likely to be a straightforward process. For urban water supply and sewerage initiatives, stakeholders would include at least customers, relevant internal organisational staff and elected members. Stakeholders can assist in identifying key constraints and deficiencies early in the planning phase.
- 37 -

5.5 Evaluate current and future demands This would involve assessing the capacity of existing infrastructure and its capability to meeting current and future service demands. Demands and projections including demand management are discussed in Chapter 5 – Demand / flow and projections.
5.6 Identify options for service provision Identifying and evaluating feasible options (both asset and non-asset) is a critical planning process. These options may be categorised as:
base case (do nothing) minimal approach existing asset options – this may involve asset rehabilitation, renewal or replacement
options non-asset options (e.g. demand management, alternative means of service delivery, I/I
reduction, optimising existing operation or improved utilisation of existing infrastructure) new asset options. A range of options may exist.
The optimal strategy could well be a combination of these categories. Details of potential asset and non-asset options are included in Chapter 7 – Options for service provision.
5.7 Undertake options analysis Options analysis can be facilitated through having value management type workshops. Options can be creatively and economically addressed through challenging assumptions, generating alternative ideas and improving communication and establishing priorities.
Depending on the scope of the planning study, workshops could include internal planning, design, construction and operational staff, a range of key stakeholders or combinations of each.
The identification and management of risks should be embedded into the planning process and in particular the options analysis. Managing risk provides a basis for a more rigorous planning study as it allows strategies to be developed to:
reduce the likelihood and consequence of risks avoid the risk by not proceeding with the option accept the risks (and highlighting this in the planning report).
At least the following categories of risk should be considered:
Commercial/Financial Industrial relations Legal Asset Ownership Social Organisational Environmental Technological Political Infrastructure Cultural Public health Site Workplace Health and Safety Contractual Regulatory Design, construction & commissioning Demand Operational Security
- 38 -

A common problem in the planning process is “optimism bias” – a tendency for planners to be over-optimistic about key project parameters including demand projection assessments, capital costs, operating costs, works duration and benefits delivery.
The options should be evaluated against the following:
achievement of the project objectives lifecycle revenues and costs environmental benefits and adverse impacts social benefits and adverse impacts and the distribution of these benefits/impacts key assumptions and risks risks of the project not proceeding.
Projects should be ranked based on an agreed weighted evaluation criteria using multi-criteria analysis that consider both financial and non-financial measures. Refer to Chapter 9 – Analysis of options for further information.
5.8 Develop implementation strategy Once the preferred option has been selected an implementation program should be formulated.
In formulating an implementation strategy consideration should be given to:
staging of the project service provider implementation targets implementation targets set by regulators funding availability (both internal and external). This may require input into the service
provider’s financial model. risks associated with deferring the project the service provider’s ability to deliver the capital works program within the nominated
timeframe the proposed project delivery methodology (e.g. traditional, BOOT (Build, Own, Operate,
Transfer), PPP (Public Private Partnership)) anticipated lead times for critical infrastructure (e.g. dams) potential constraints (e.g. approvals, land acquisition).
In some cases, it may be necessary to evaluate a number of options (in terms of implementation programs) in order to confirm the preferred option.
5.9 Outputs from the planning process The output from the planning process will be a:
Strategic/Master Planning Report Concept/Feasibility Report or Detailed Planning Report.
Typical content of a report is outlined in Chapter 11 – Planning Outputs.
- 39 -

5.10 Key support processes
5.10.1 Project management Project management of the planning process involves a number of activities including:
programming and budgeting for planning studies. This will include programming planning (at a strategic, preliminary or detailed level) in response to: o timeframe since previous studies o outputs from other studies o regional planning requirements o business development opportunities o customer-related or operational problems o regulatory changes.
determining the degree of infrastructure planning required briefing and monitoring (quality, timelines and value for money) of infrastructure planning
work undertaken internally or by consultants coordinating the handover of infrastructure planning documentation including:
o registering, storing and distributing planning reports o registering and storing supporting information such as CAD/GIS files and network
models o summary documents that are understandable to non-technical persons
ensuring the updating of: o infrastructure investment (capital works) programs o Infrastructure Charges Schedules.
coordinating internal review and documentation approval by the service provider.
5.10.2 Planning information Effective information management is a critical foundation for quality infrastructure planning. Without this foundation, the resources allocated to planning studies become focussed on information capture and verification. This diverts the allocation of resources from the application of strategic thinking skills in developing and critically evaluating options to provide optimal solutions for stakeholders. Refer to Chapter 2 – Knowledge management for further information.
5.10.3 Planning resources The ability and experience of the people to be involved in the planning process, whether internal or external, will have a major bearing on the outcomes and quality of the analysis. Desirable characteristics include:
strategic and systems thinking skills a broad appreciation of technical, financial, social and environmental issues planning experience availability to use value management or similar approaches to explore a wide range of
solutions ability to access appropriate information and to recognise unreliable data effective communication skills – the ability to translate findings into planning reports that
can be readily understood by all stakeholders an understanding of risk management’s importance in all planning activities an appreciation of ‘optimism bias’ the ability to work in a multi-disciplinary team.
- 40 -

In identifying resources required for a planning study which is outsourced the service provider should make adequate allowance for the input of internal staff. Active involvement of internal planning, design, construction and operation staff particularly in the identification of service needs and objectives, stakeholder requirements, options analysis and implementation strategy is essential.
6 Checklist
What evidence exists to support the need? How confident are you of this evidence? Has the planning study adequately considered trends that may impact on water and
sewerage provision? Have stakeholders and their desired outcomes been sufficiently identified and
addressed? Is there adequate knowledge of the current service delivery performance or condition,
performance or utilisation of existing infrastructure? How confident are you of the reliability of information provided for the planning study?
What have you done to confirm the validity of this information? Have the resources/skills allocated to the planning been appropriate to the scope of the
study? Is the level of strategic thinking sufficiently robust? How has this been facilitated? To what level can the planning be considered as “integrated”? Have a sufficiently wide range of options for service delivery been considered? How were
the options identified? Has there been adequate analysis of lifecycle revenues and costs, social and
environmental impacts? Have non-asset solutions been adequately identified and assessed? Have the risks been rigorously evaluated? Has the planning proceeded to the appropriate level to justify the recommended
strategies? Do the recommended strategies identified in the planning study address the objectives
and critical success factors that will deliver the identified service need? Are the implementation strategy and timeframes realistic? How have these been
determined? Have responsibilities been clearly identified in the implementation strategy? To what extent does the recommended strategy align with the service provider’s strategic
direction, land use planning, regional planning and regulatory requirements? Are you confident that the proposed strategy is the optimal strategy in terms of social,
environmental and financial outcomes? Does the strategy meet stakeholder expectations? Would you invest in this strategy if you were personally responsible for its
implementation?
- 41 -

Chapter 4 Stakeholders
1 Purpose
The purpose of the Stakeholders chapter is to:
Provide an outline of how to identify stakeholders and analyse stakeholder needs and requirements.
Identify what stakeholders are important through the different stages of planning. Provide an outline of the tools used to identify the relative importance or significance of,
different stakeholder groups and their potential to impact or influence the project or to be impacted on, or influenced by, the project.
2 Key principles
Stakeholder involvement can beneficially influence planning and project outcomes.
Stakeholders can provide useful information in identifying feasible options and quantifying constraints.
Documenting benefits and risks can assist in gaining Stakeholder support for planning outcomes.
Stakeholders can generate or impose constraints.
Stakeholders can influence or select outcomes.
Stakeholders should be provided with the appropriate level of information commensurate to their involvement or decision making responsibility.
3 Defining stakeholder involvement
3.1 Who or what are stakeholders? Stakeholders include persons or groups who will define, constrain, influence or decide on planning options and all those affected through implementation of the planning recommendations to those using or receiving the resulting services.
Key stakeholder groups will include customers, business owners and regulators. For most planning exercises, “environmental representatives”, the “community” and the “service provider” will be stakeholders. A “stakeholder” may also be defined as anyone who directly or indirectly receives the benefit, or sustains the costs, resulting from the implementation of a project. This includes designers or operators who may be faced with higher costs due to sub-optimal planning.
Primary stakeholders are those stakeholders that will be closely linked to a particular aspect or phase of the planning or asset lifecycle. These primary stakeholders may change over the planning or asset lifecycle.
- 42 -

Primary stakeholders will include those who:
pay for services provided as a result of the project (Customers) sign off on capital works, investment programs or budget allocations (Business Owners) specify project constraints and standards (Regulators) define planning constraints and parameters (design, construction, operational and
financial staff) contribute financially to the project are affected during the construction or implementation phases of the project are impacted on in the ongoing operation, e.g. property owner with an easement or dam are traditional owners of the land.
Secondary stakeholders will include:
those who represent minority and interest groups only indirectly connected to the matter being addressed
service users or consumers who are neither paying customers nor shareholders.
The list of stakeholders should be specific and clearly linked to the planning issues under examination. Considerable overlap may exist between certain stakeholders in terms of their representation.
3.2 Why involve stakeholders? Identifying and effectively managing stakeholder relationships is critical to successful planning and project delivery. Stakeholder involvement can be used to:
identify and develop collaborative approaches identify a shared vision formulate creative solutions define requirements, constraints and risks assist with identification of options provide information and education test acceptability of asset and non-asset solutions.
There is a mandatory requirement for public consultation for Planning Schemes under the Sustainable Planning Act 2009.
In involving stakeholders it is necessary to have a clear appreciation of the overall objectives of the stakeholder and in particular how they will be able to contribute.
A comprehensive map of stakeholders is needed to help clarify the desired outcomes. The desired outcomes and impact need to be expressed in terms that stakeholders understand. Analysis of stakeholder interests and influence is needed to help assess delivery options. The linkages between risks, options and stakeholder expectation, needs to be understood in order to ensure that stakeholder involvement contributes positively to the planning process. Stakeholder involvement needs to be interactive for successful planning.
3.3 When should stakeholders be involved? It is important to begin stakeholder involvement early in any planning process and continue involvement throughout all planning phases. Different stakeholder groups will be important from the start of planning to the final phases of planning. Stakeholder analysis should be used to identify when to engage different stakeholders (see Section 4.2).
- 43 -

3.4 How to involve stakeholders? Service providers need to plan and manage for a variety of stakeholder involvement and interaction. These interactions could be based on the need for:
compliance consultation co-operation partnership/joint planning persuasion education information feedback empowerment influence negotiation participation
To achieve effective stakeholder involvement a planner needs to ensure a number of conditions or prerequisites are met. These include:
Reliable information is available to stakeholders in a form they can understand. Time to participate, to build trust, to learn, to resolve disputes, to create solutions. Commitment of stakeholders. Willingness to learn amongst stakeholders. Shared authority and responsibility to affect and implement decisions.
How stakeholders are involved will depend on the project. For most planning initiatives, it will be desirable for service providers to prepare a Stakeholder Management Plan, which outlines the role each identified stakeholder needs to represent, the way stakeholders can involve themselves and the process for dealing and resolving issues that arise. Figure 3.1 outlines an overall approach that may be adopted in the planning process.
FIGURE 3.1: Involving stakeholders
From Stakeholder Management Strategy (Gold Coast Water 2003)
It is a fact that a high number of stakeholders will add substantially to the overall cost of the planning phase. Good planning has the potential to save a lot of money, but poor planning has the potential to greatly increase the cost of a project. Considerable financial savings may eventuate by allowing the project to progress unopposed and be accepted/owned by all stakeholders throughout the life of the assets.
Awareness Education Stage
Awareness Education Stage Consultation StageConsultation Stage Communication &
Endorsement StageCommunication &
Endorsement Stage
Inputs to technical team to develop options
Inputs to technical team to develop preferred option
Awareness Education Stage
Awareness Education Stage Consultation StageConsultation Stage Communication &
Endorsement StageCommunication &
Endorsement Stage
Inputs to technical team to develop options
Inputs to technical team to develop preferred option
- 44 -

Clearly a balance must be made between stakeholder representation, the time able to be taken to complete the planning process and the overall cost. In general, stakeholder representative groups such as customer advisory groups who are able to represent multiple interests may need to be favoured when compared with addressing single interest stakeholders.
4 Key elements
The key elements in planning for stakeholder involvement are illustrated in Figure 4.1 and include:
1. Identifying stakeholders 2. Quantification and analysis of stakeholder importance/requirements 3. Development of a Stakeholder Management Strategy 4. Implementation of the Stakeholder Management Strategy.
FIGURE 4.1: Key elements
4.1 Identify stakeholders For successful planning outcomes, all stakeholders should be identified and their specific requirements and/or needs analysed to assess stakeholder importance and influence. Typical Stakeholder groups will include:
customers business owner regulatory authorities funding agencies lobby and interest groups individuals or groups impacted by construction or by on-going operational activities individuals or groups impacted when service levels are not met traditional owners.
The stakeholders will vary depending on the type of planning initiative and the phase of the asset lifecycle.
A number of tools can be used to assist with the identification of stakeholder groups. These include:
Use of social, environmental and financial accountability framework - evaluation of current accountability and reporting frameworks can be used to identify stakeholders.
Stakeholder Requirements
Identify Service Needs
Identify Stakeholder
Requirements
Identify Options for
Service Provision
Planning Report
EvaluateCurrent &
FutureDemands
DetermineScope ofPlanning
DetermineService
Objectives
Identify Stakeholders
Quantify & Analyse Stakeholder Importance/
Involvement Requirements
Develop & Implement Stakeholder Management
Strategy
Document Stakeholder Requirements
Analyse Options
Develop Implementation
Strategy
Stakeholder RequirementsStakeholder Requirements
Identify Service Needs
Identify Stakeholder
Requirements
Identify Options for
Service Provision
Planning Report
EvaluateCurrent &
FutureDemands
DetermineScope ofPlanning
DetermineService
Objectives
Identify Stakeholders
Quantify & Analyse Stakeholder Importance/
Involvement Requirements
Develop & Implement Stakeholder Management
Strategy
Document Stakeholder Requirements
Analyse Options
Develop Implementation
Strategy
- 45 -

Relationship diagrams illustrating relationships between the service provider and various stakeholders (elected members, owners/shareholders, customers, suppliers).
Process diagrams which outline the stakeholders involved in processes such as the project approval process from need identification, project planning and prioritisation through to financing and budget approval.
Infrastructure lifecycle diagrams which indicate the stakeholder groups impacted or have an interest in various stages of the asset lifecycle e.g. operators, maintainers, asset managers.
Customer Stakeholder groups include:
Stakeholders that provide revenue sources e.g.: o residential customers o industrial/commercial customers o developers o agencies providing grants and subsidies o other Council departments o other local government agencies.
Stakeholders that consume products/services without direct payment e.g.: o tenants (in some cases) o tourists and visitors o general public using public facilities provided by Council and other establishments.
Stakeholders with special requirements e.g.: o high risk and critical community facilities o crisis centres o hospitals o dialysis users.
Stakeholders affected during implementation/construction include groups affected by: o land acquisition o construction access o easements o traffic control.
Stakeholders involved in planning/project approval including those involved in: o setting or adopting service levels o establishing priorities for forward planning and capital works projects o development of business cases and budget submissions o prioritising construction works.
Special Interest Groups include:
o political with representation o political with no representation o vocal minority o silent majority.
4.2 Quantify and analyse stakeholder importance/involvement and requirements
Stakeholder mapping will identify the relationship and relative importance of each stakeholder group. The stakeholder analysis seeks to answer questions such as:
Who depends on the project? Who are interested in the outcome of the project? Who will influence the project?
- 46 -

Who will be affected by the project? Who will work against the project?
Tools such as Stakeholder Importance Analysis (refer to Table 4.1) and ‘Stakeholder Concern Analysis’ (refer Table 4.2) will assist in identifying stakeholder importance to the planning initiative and their anticipated requirements. These requirements will be further clarified through interaction with the stakeholders. Section 3.4 outlines a number of options available for stakeholder interaction.
The importance, involvement and requirements of stakeholders are time and project phase dependent. Stakeholder analysis needs to recognise these dependencies and identify specific stakeholders for each phase of the planning.
TABLE 4.1: Stakeholder importance analysis
Stakeholder Group
How will they
influence the
project?
At what Phase?
How can the project take advantage of
the stakeholder?
What can the project do
for the stakeholder?
Importance Rating
Involvement Rating
Customers Choose from: Constraints
Identification Option
Identification Planning Approvals Funding
Allocation Prioritisation and
Budget Allocation Implementation
Choose the level of importance: Limited Influential Mandatory
Choose the level of involvement: Seek
participation and empower Consult Inform Maintain
Awareness
Business Owners
Regulators
Others (specify)
When analysing the long list of possible stakeholders, consideration needs to be given to the general categories of stakeholder groups, identifying those who:
are affected by, or significantly affect, the issue have information, knowledge and expertise about the issue control or influence implementation instruments relevant to the issue.
- 47 -

TABLE 4.2: Stakeholder concerns analysis
Stakeholder Affected by or
Affect the Outcome
Control or Influence
Requirements or Desired
Stakeholder Outcomes
Importance Rating
Involvement Rating
Public Sector Agencies
Choose: Affected by the
Planning Process Affected by the
Implementation Affected by the
Outcomes
Choose the area of control or influence: Funds Compliance Property Issues Information Knowledge Expertise Other (specify)
Choose the level of importance: Limited Influential Mandatory
Choose the level of involvement: Seek
participation and empower Consult Inform Maintain
Awareness
Specific Agency Staff
Private Sector
Interest Groups
Planners should develop an evaluation matrix such as outlined in Figures 4.2 and 4.3 to evaluate stakeholder importance or level of involvement.
FIGURE 4.2: Importance rating FIGURE 4.3: Involvement rating
Analysis of stakeholder importance/significance can take many forms. Other types of analysis include:
evaluation of stakeholder rights, risks and responsibilities evaluation by level of participation e.g. involvement by consultation, active, collaboration,
empowerment etc. scenario analysis by identifying and analysing key stakeholders for a range of scenarios
including organisational and customer risks. For example: o loss of service, or o reduced service levels during droughts.
- 48 -

Customers represent one stakeholder group with a specific and significant importance.
From a business perspective, the importance of customer groups can be quantified in terms of the revenue generated e.g. significant customer groups by annual revenue, capital contributions or subsidies. Preferably this should be graphically presented to illustrate the level of importance.
From a social perspective, there may be a need to identify how the project may impact on customers’ lifestyle.
From a life-cycle perspective, may need to consider total contributions over the life-cycle of the proposed planning outcome to get a clear perspective of the most significant stakeholders in terms of benefits and “full” costs. For example, developers contribute during construction, where as consumers contribute to operations, maintenance and renewals.
4.3 Develop and implement stakeholder management strategy As part of the planning process, a stakeholder management strategy (SMS) should always be prepared. For many routine initiatives this will be a simple, straightforward process. However, for some initiatives it will require a significant investment in resources. The SMS is used to define and implement the activities and responsibilities for managing stakeholders. It also ensures that the stakeholders’ role in the study is defined and understood by the stakeholder. The SMS should include:
identification of stakeholders the outcomes of analysis and mapping of stakeholder requirements broad description of the direction and approach that will or has been used for stakeholder
management at all phases of planning and implementation the strategy for issue and concern management the communications strategy the involvement strategy analysis and mapping of influence and impact for each stakeholder group description of how the program will engage with all stakeholders including mechanisms
for encouraging, receiving and responding to feedback from stakeholders, and advising stakeholders of the outcomes from the consideration of their feedback and input
description of how the program will empower relevant stakeholders to make decisions and find solutions
measures to determine how well the communication process is engaging with stakeholders
measures to check that stakeholder expectations have been met.
The communications strategy is aimed at ensuring ongoing commitment and support by all key stakeholders for all aspects of the project.
4.4 Document stakeholder requirements The last phase of addressing stakeholder requirements is to summarise and document the results of identifying and analysing stakeholder needs, expectations, concerns and requirements etc. This phase of the planning process is most significant and should identify some of the key issues to be addressed in developing the supporting business case for the project.
The findings of a stakeholder analysis need to be included (with different amounts of detail) into the planning report. Such a summary can be brief, depending on the nature of the initiative, and the analysis will probably be revised as the initiative develops, interests change, and more information becomes available.
- 49 -

5 Checklist
Have all key stakeholders been identified? Has a summary been provided detailing the nature of stakeholder relationships and the
potential impact of the proposal? Has a consultation strategy been identified? Have the key stakeholders providing information been identified and the accuracy of the
information used quantified? Have all customer requirements been identified?
For identifying stakeholders, has the planning process included:
Listing of all primary and secondary stakeholders? Identification of all potential supporters and opponents of the project? Analysis to identify different types of stakeholders (at both primary and secondary
levels)?
For assessing which stakeholders are important for project success, has the planning process included:
Which problems affect which stakeholders? Identification and prioritisation of stakeholder needs, interests and expectations?
For high risk – high expenditure projects, has the planning process included:
Stakeholder mapping? Stakeholder segmentation analysis? Communication strategy? Stakeholders involved in development of the planning report? Stakeholder issues/constraints/support fully documented and impacts analysed? Process documented in planning report?
For low risk – low expenditure projects, has the planning process included:
Interviews of key stakeholder representatives? Stakeholders advised on a well-informed “as required” basis?
- 50 -

Chapter 5 Demand/flow and projections
1 Purpose
The accurate assessment of water demand and sewage flow forms the basis of all planning studies. This chapter provides guidance on the assessment of water demand and sewage flows and in particular addresses the assessment of future demand and flow based on historical records and future growth and water usage projections.
2 Key principles
Future water demand and sewage flow including peaking factors should be based on actual system performance, historical records and a consideration of future demand pattern changes.
Existing and future water demand should be separated into internal and external components so that the impact of demand management changes can be properly assessed.
It is essential that planners examine the underlying basis for current and future water demand particularly in terms of the many variables affecting internal and external demand components. Unit water demands or sewage flows should be specified as per equivalent person (EP).
Water demand should be associated with a required water quality, so that the potential magnitude of water recycling from various sources (e.g. stormwater, wastewater), or supply from alternate sources (e.g. rainwater tanks, bores) can be assessed.
The components of water loss (e.g. leakage) should be determined. Actions required to reduce these components should be stated, where cost effective.
Peaking factors, particularly for water demand, should take into consideration the likely changes to historical patterns where water recycling is incorporated.
Sewage flow should take into account changes in internal water demand resulting from demand management initiatives. The impacts of infiltration/inflow management programs should also be considered.
Demand projections should be broken down to match sub-catchments where appropriate.
3 Why is the knowledge of demands and projections important?
The knowledge of current and anticipated future water supply demand and/or sewage flow is fundamental to planning. The assumptions used in determining demand or sewage flow have a permanent effect on planning outcomes and subsequent planning decisions. Without a thorough analysis of demand/flow, premature or excessive investment in capital works may result causing unnecessary additional financial impacts on customers. Conversely, inadequate demand management and/or infrastructure investment may result in increasing customer service complaints or environmental impacts.
The service provider needs to know current and future demands/flows in order to determine what spare capacity exists, the weak links in the system, and the ability to accept new or unexpected demands.
- 51 -

4 When should demand and projections be determined?
A service provider should have knowledge of current demand/flow and anticipated future projections at all times. These should be updated at regular intervals, depending on the size of the system, growth rate, etc.
In undertaking a planning study, current and future demands flow should be determined once:
service needs and objectives have been determined stakeholder requirements have been identified adequate raw data on existing demands or flows is available.
5 Key elements
The key elements are illustrated in Figure 5.1.
FIGURE 5.1 – Key elements
5.1 Collect and evaluate raw data For existing water supply and sewerage systems it is essential that actual demand/flow data is used. Typical raw data requirements are listed in Table 5.1.
TABLE 5.1 – Raw data requirements
Data Water Supply Sewerage Comments
Land use plans
Priority infrastructure plans
Land use classification
Number of connections by customer and land use type including: Existing developed; Existing undeveloped; and Future potential
developments.
Customer type could include residential, rural residential, commercial, industrial, etc.
Current & Future Demands
Identify Service Needs
Identify Stakeholder
Requirements
Identify Options for
Service Provision
Planning Report
EvaluateCurrent &
FutureDemands
DetermineScope ofPlanning
DetermineService
Objectives
Collect & Evaluate Raw Data
Determine Key Planning Parameters
Manage Demand Determine Future Demand Projections
Analyse Options
Develop Implementation
Strategy
Current & Future DemandsCurrent & Future Demands
Identify Service Needs
Identify Stakeholder
Requirements
Identify Options for
Service Provision
Planning Report
EvaluateCurrent &
FutureDemands
DetermineScope ofPlanning
DetermineService
Objectives
Collect & Evaluate Raw Data
Determine Key Planning Parameters
Manage Demand Determine Future Demand Projections
Analyse Options
Develop Implementation
Strategy
- 52 -

Data Water Supply Sewerage Comments
Occupancy ratio This is the average household size as determined from census data or other means.
Census data Census data should be noted as well as the census boundaries.
Daily demand/flow The planner should determine meter accuracy and the level of confidence in this data
Customer water meter readings The planner should determine meter accuracy and the level of confidence in this data
Diurnal demand/flow patterns Patterns for different customer types may be necessary (i.e. residential, commercial, industrial).
Seasonal demand/flow patterns Particularly relevant where large tourist/transient population exists, some industrial activities or distinct climate change influences demand.
Daily rainfall The planner should determine meter accuracy and level of confidence in this data.
Daily temperature The planner should determine meter accuracy and level of confidence in this data.
Climate change Likely to impact on future demands.
Internal water use (by type)
External water use
Duration and extent of water restrictions
History of demand management initiatives
How effective was each strategy (e.g. two part tariffs, rain water tank subsidies, water efficient devices etc.).
- 53 -

Data Water Supply Sewerage Comments
Tariff (including historical changes)
Would be applicable to sewerage if sewerage charge is based on metered water consumption.
Trade waste (quantity and quality)
Wastewater composition
5.2 Determine key planning parameters All unit water consumption or wastewater flow should be specified as per EP (equivalent person). Equivalent person is defined as “water supply demand or the quantity and/or quality of sewage discharge for a person resident in a detached house”. The term equivalent person is also applied to:
The number of persons who would have a water demand equivalent to the establishment being considered.
The number of persons who would contribute the same quantity and/or quality of domestic sewage as the establishment being considered.
5.2.1 Water supply Key planning parameters to be determined are listed in Table 5.2
TABLE 5.2 – Water supply planning parameters
Parameter Abbreviation Comments
Average Day Demand AD Separate out into internal and external demand.
Mean Day Maximum Month MDMM This is the highest 30 day moving average daily water demand during a year. Parameter used in Queensland only to reflect demand persistence in response to climatic conditions.
Peak Day Demand PD Previous guideline used the term Maximum Day Demand (MD).
Peak Hour Demand PH Previous guideline used the term Maximum Hour Demand (MH).
Non-revenue water NRW Refer to IWA “best practice” standard approach to water balance calculations. Components include real losses, apparent losses and unbilled authorised consumption.
Fireflow Refer to Chapter 6.
- 54 -

A number of studies have been undertaken in recent years concerning internal residential consumption. Typical ranges of consumption are listed in Table 5.3. These figures would apply to typical household sizes of 2 to 4. More detailed studies (Water Corporation 2003, IPART 2004 refer to section 7.0 – Bibliography) should be consulted for further information.
TABLE 5.3 – Typical household (2-4 persons) internal water use
Range Typical % of Internal Use
Toilets 110-180 L/d 26%
Baths/Showers 170-220 L/d 34%
Kitchen 45-90 L/d 13%
Laundry 100-140 L/d 22%
Other 15-50 L/d 5%
Internal residential consumption will depend on the extent of demand management initiatives adopted (e.g. tariff structure, dual flush cisterns, water efficient devices etc.) and household size. Sewage ADWF from residential areas will provide an indication of internal water usage.
Evaporative air conditioners can significantly add to water demand. Evaporative air conditioners can use up to 75L/hr in the summer months. These units use between 10% and 25% of the total annual residential consumption in hot and dry climates. Quoted average household water usage from evaporative air conditioners are:
Western communities 250-300 kL/annum Darling Downs 70-115 kL/annum
External water usage will depend on:
the nature of the development (detached residential, multi unit development etc.) lot size location rainfall patterns pricing level of water restrictions moisture deficit.
Water demands from commercial/industrial premises can be measured from meter readings. Table A provides an indication of average water demands and wastewater flows from a range of developments. However, these figures are for indicative and comparative purposes only. Caution should be exercised in the use of this data.
The components of NRW including real and apparent losses can be determined using the IWA “best practice” approach to water balance calculations. It is likely that the regulatory requirement for the preparation of System Leakage Management Plans will assist in the determination of the NRW components.
For some smaller urban centres or for new schemes a planner should access water consumption and NRW component data from similar neighbouring schemes making allowance for the age and maintenance of the neighbouring infrastructure.
- 55 -

Planners should determine peaking factors based on actual system performance. For larger schemes, peaking factors for different types of developments (e.g. residential, multi-unit development, commercial) should be determined.
Changes in reservoir volumes should be considered in determining Peak Day or Peak Hour demand, particularly for smaller schemes.
An indicative range of peaking factors is listed in Table 5.4. These will vary depending on the characteristics of the scheme (e.g. level of industrial/commercial demand), climate, pricing regime and extent of water restrictions etc. For smaller schemes higher peaking factors may be required but this will depend on the standard of service available.
TABLE 5.4 – Indicative ranges of overall peaking factors
Equivalent Persons MDMM:AD Peak Day Factor PD:AD
Peak Hour Factor PH:AD
> 5,000 1.4 – 1.5 1.5 – 2.0 3.6 – 4.0
< 5,000 1.5 – 1.7 1.9 – 2.3 3.6 – 4.5
Arid areas (where internal water use is less than 30% of total water consumption)
1.5 – 1.7 1.7 – 2.0 3.6 – 5.0
The water loss components of NRW can be assumed to have a peaking factor of 1.0 unless the service provider has more accurate information.
Typically the process for determining existing demand parameters would be as follows:
Determine unit water demand (L/EP) for detached residential development based on metered consumption and occupancy ratio. Determine total EP and total demand for detached residential development or land use.
Determine metered consumption for all (excluding detached residential) land use categories and/ or development/ customer categories. For all categories determine total EP and demands.
For all categories (particularly those have significant external water use) determine internal and external water demands.
Determine the components of NRW. Determine peaking factors and diurnal flow patterns for total system and various land use
classifications.
5.2.2 Sewerage Key flow parameters to be considered are listed in the Table 5.5.
- 56 -

TABLE 5.5 – Key sewage flow parameters
Parameter Abbreviation Comments
Average dry weather flow ADWF* This is the combined average daily sanitary flow into a sewer from domestic, commercial and industrial sources (WSAA). Note: this excludes any IIF.
Peak dry weather flow PDWF* The most likely peak sanitary flow in a sewer during a normal day. It exhibits a regular diurnal pattern with morning and evening peaks (WSAA).
Peak wet weather flow PWWF Includes: PDWF + GWI + IIF
Groundwater infiltration GWI Groundwater (non-rainfall dependent) infiltration. Generally exists for sewers laid below groundwater table. Groundwater infiltration enters the system via defective pipes or joints and leaking manhole walls. GWI can generally be estimated as the flow between midnight and 4.00 am during dry periods.
Rainfall dependent inflow and infiltration
IIF Peak (rainfall dependent) inflow and infiltration. This includes flow discharged into sewer from: unauthorised roof, ground or stormwater
drainage leaking manhole covers disconnected sewers low disconnector traps indirect infiltration of rainwater entering
defective pipes and joints from the surrounding soil.
Refer to the WSAA Sewerage Code for further details.
*In some schemes the ADWF and PDWF may include a GWI component throughout the year. This may have an impact on peaking factors.
Planners should determine ADWF, PDWF and PWWF based on:
1. Actual system performance 2. The WSAA Sewerage Code or 3. The historical Queensland approach, where typically
PDWF = C2 X ADWF where C2 = 4.7 X (EP) -0.105
PWWF = (5 x ADWF) or (C1 x ADWF), whichever is the larger
C1 = 15 x (EP) - 0.1587 (note: the minimum value for C1 = 3.5)
In the above formulae, EP is the total equivalent population in the catchment gravitating to a pump station
- 57 -

For smart sewers IIF can be 50% of calculated IIF for conventional sewers.
Generally ADWF will range between 150-275 L/EP/d. This flow should be consistent with internal household water use.
The process for determining existing demand parameters would typically be as follows:
Determine unit flow (L/EP) at ADWF for detached residential development based on internal water consumption and/or bulk metering of a residential catchment, and occupancy ratio. Determine total EP and total ADWF for detached residential development or land use.
Determine unit flow (L/EP) at ADWF for all (excluding detached residential) land use categories and/ or development/ customer categories. For all categories determine total EP and ADWF.
Determine total ADWF from treatment plant and catchment metering. Calibrate ADWF calculated from treatment plant or catchment metering against the calculated ADWF based on L/EP based land use categories.
Determine peaking factors and diurnal flow patterns for total system and various land use classifications.
5.2.3 Schemes with high transient or tourist populations For schemes with a significant component of non-permanent residential population (e.g. tourist centres), planners will need to consider the appropriate peaking factors to be applied for both water and sewerage.
Planners need to ensure that double counting does not occur when taking into account holiday season loadings at communities subject to a significant increase in population. For instance, adopting both peak population numbers and excessive peaking factors to determine planning and design parameters.
Designing a sewerage scheme with an excessive peaking factor to cope with a 3-4 week peak tourist season could have adverse operational impacts during other parts of the year.
5.3 Determine future demand or flow projections
5.3.1 The planning horizon The planning horizon would depend on a number of factors including:
lead time including approvals to construct infrastructure growth rates possible infrastructure staging options.
For water services the overall planning horizon for major resource and system components should be 50 years.
For the detailed planning of new infrastructure a planning horizon of 20 years is appropriate provided it is consistent with the overall resource planning horizon of 50 years.
An ultimate development scenario based on a stated population density, should be considered particularly in relation to identifying:
the location of essential infrastructure for early procurement of land/easements long term constraints (e.g. pipeline corridors that may only accommodate one main) optimal staging strategies.
- 58 -

5.3.2 Demand management The service provider’s current and future demand management strategy should be given serious consideration before determining demand/flow projections. This could be an iterative process. The strategies may need to be re-evaluated once the implications of increasing demand become apparent later on in the planning study. The sustainability of a demand management strategy over the longer term should also be considered.
Demand management strategies are listed below in Figure 5.3.
FIGURE 5.3 – Demand management strategies
Demand management strategies should also have an impact on reducing sewage ADWF. However, PWWF may remain unchanged where high infiltration/inflow levels exist.
5.3.3 Estimating future demands/flows In estimating future demands/flow it is necessary to understand the underlying cause of current and historical demands/flows. This will necessitate collecting and analysing the data listed in Table 5.1. Consideration should be given to the following in estimating future demands/flows per EP:
State/regional consumption targets internal and external demand and impacts of demand management on the various
components of these demands changing household occupancy ratios changing development types (e.g. increasing multi-unit development and small lot
developments) the impact of climatic change impacts of ageing infrastructure (e.g. increasing inflow/infiltration) impacts of I/I reduction strategies the impacts of various asset options (e.g. rainwater tanks).
Demand Management Strategy
Demand Reduction Strategy
Supply Rationalisation Strategy
• Volumetric charging• Education campaigns (eg Water
Wise)• Water restrictions• Installation/retrofitting of water
efficient devices• Showerhead replacement program• Toilet retrofits• Residential water audits & retrofits• Rebates on water efficient
appliances, rainwater tanks• Outdoor water audits
• Customer metering• Water loss reduction• Leakage detection and repair• Accurate metering• Pressure reduction• Effluent re-use• Rainwater tanks
- 59 -

Population projections should be based on population planning information available from a local government. Broad local government growth projections are also available from the State Government. Census information is also a good source of data on occupancy ratios and population growth trends. However, census data should be carefully interpreted as it may represent broad statistics of an area where the actual customers of a system may be a statistical minority.
The process for estimating future water demand or sewage flow projections would include the following:
Determine future growth by land use categories and/or development/ customer categories within zones or catchments.
Determine growth or reduction in per EP demand/ flow by land use categories and/or development/ customer categories taking into account impacts of various demand management initiatives.
Determine anticipated changes in the components of NRW in response to water loss reduction strategies.
Calculate total water demand or sewage flow. Determine future peaking factors and diurnal flow patterns based on anticipated impacts
of various demand management initiatives and, in the case of sewage, I/I reduction strategies.
A scenario analysis should be undertaken to assess the impacts of changing variables on the resulting demand/flow projections.
6 Checklist
What confidence do you have in the raw data? What have you done to ensure the reliability of the raw data? Do you really understand the underlying cause of water demand? To what extent has demand management been considered? Is there a commitment by the service provider to implement demand management
strategies? Have State/regional water consumption targets been considered? Can they be met? Have the benefits of demand management been quantified and presented in a planning
study? Have the components of NRW been accurately determined? What is the strategy to reduce NRW? What is the basis of the peaking factors? How consistent is the internal household demand with sewage ADWF? Are there any
reasons for the difference? Is the planning horizon appropriate for the study? What are the demand/flow projections based on? What level of scenario analysis has been undertaken? Have the impacts of changing any variable been assessed? Are you confident that the projections form a sound foundation to the planning study? What have you done to ensure this level of confidence?
- 60 -

TABLE A – Indicative average demands/flows from commercial/institutional developments (litres/day)
Development Water Demand Sewage Flow Unit Apartment/Home Unit 300 to 500 225 to 450 1 bed 550 to 750 300 to 600 2 bed 700 to 900 400 to 750 3 bed Caravan Park – Van 550 to 750 300 to 675 site Caravan Park – Tent 150 to 250 150 to 250 site Central Business 14000 to 20000 11250 to 20000 ha Child Care Centre 40 to 70 25 to 45 staff and pupils Commercial Premises 500 to 800 150 to 300 100 sqm GFA* Convalescent Home 600 to 1100 300 to 450 bed Crematorium 500 to 700 250 to 500 100 sqm GFA Education – Primary School 50 to 80 25 to 45 staff and pupils Education – Secondary School
90 to 150 50 to 90 staff and pupils
Education – Tertiary Institution
90 to 150 50 to 90 staff and pupils
Fast Food Store 1400 to 4200 1200 to 2000 100 sqm GFA Food Services 1200 to 2000 900 to 1200 100 sqm GFA Heavy Industry 10000 to 35000 10000 to 13500 ha Hospital 500 to 1800 400 to 800 bed Hostel Accommodation 200 to 600 150 to 400 bed Hotel 700 to 1200 300 to 600 100 sqm GFA Light Industry 10000 to 35000 10000 to 13500 ha Major Shopping Development
300 to 800 200 to 550 100 sqm GFA
Medical Centre 400 to 700 250 to 675 100 sqm GFA Motel 300 to 600 225 to 500 room Multiple Units 500 to 700 225 to 450 1 bed 800 to 1000 300 to 600 2 bed 1000 to 1400 400 to 750 3 bed Place of Worship 200 to 400 100 to 180 100 sqm GFA Public Building 500 to 600 280 to 450 100 sqm GFA Restaurant 800 to 1800 550 to 600 100 sqm GFA Retirement Village 300 to 700 225 to 450 1 bed 500 to 1000 300 to 550 2 bed 700 to 1400 450 to 750 3 bed Service Station 500 to 700 250 to 350 100 sqm GFA Shop 600 to 800 280 to 450 100 sqm GFA
(* GFA – Gross Floor Area)
These figures are for indicative and comparative purposes only. Caution should be exercised in the use of this data.
- 61 -

Chapter 6 Network modelling and applications
1 Purpose
Water supply and sewerage planners use a range of models to support decision-making. Network modelling is a key activity:
• To gain an understanding of how the water supply operates under various demand/flow scenarios (including fire flow), now and into the future.
• To gain an understanding of how the sewerage system operates under various demand/flow scenarios, now and into the future.
• To assess the performance of the water supply or sewerage system in the event of various failure events (e.g. critical asset failure or overflows).
• To assess the impacts of proposed operational modifications, augmentations or renewals.
• To review the impacts of proposed developments. • To provide the supporting information for a planning study.
This chapter provides an overview of the networking modelling process and highlights issues that should be considered to ensure that models efficiently deliver reliable outputs. In addition, an outline of the considerations for the provision of fire flow by water service providers is included.
2 Key principles
• The desired outcomes of the modelling work and the extent/detail are to be established before commencing the process.
• Operational staff should be involved in the construction and analysis of the network model.
• Successful network modelling requires the investment of time by experienced staff to interpret the results of the modelling.
• Model outputs should be verified against actual system performance.
3 Why is network modelling important?
Network modelling is a key component of water supply and sewerage planning because:
• It allows existing infrastructure to be utilised to its maximum capacity. • It will support the development of an optimised capital works program. • It provides service providers with the information necessary to make optimal decisions in
relation to system operation and planning to achieve the desired service standards. • It will lead to value for money for customers. • It allows water service providers to provide other stakeholders more accurate and
considered information regarding expected system performance.
4 When should network modelling be undertaken?
• For larger service providers with high growth rates, network modelling will be an ongoing process undertaken by skilled in-house staff and/or external consultants.
• Modelling allows water service providers to provide other stakeholders with information regarding expected system performance under existing and future demand conditions.
- 62 -

• For smaller service providers with static populations, network modelling will be undertaken intermittently to support specific planning studies or to identify the cause of operational problems. The modelling is likely to be undertaken by external consultants.
• Water service providers with schemes that do not have network models should refer to section 8.5 for recommendations on the type of flow and pressure advice that should be provided to developers and hydraulic designers to assist with hydraulic design and maintenance.
5 Key elements
The network modelling process is illustrated and discussed in the following sections.
Figure 1: Network modelling–key elements
5.1 Model management Effective model management is essential to the success of modelling for planning, decision support and operations.
A key process will be the selection of the appropriate software.
A wide range of dynamic network modelling software packages exist on the market. These are becoming increasingly more powerful. For water supply, dynamic modelling should be used in most cases. Water supply static models are only suitable to analyse peak hour demand or fire flow impacts downstream of a reservoir. Static sewerage models are common. However, dynamic sewer modelling is becoming more prevalent for the larger systems. Selection of an appropriate modelling software package would depend on such factors as:
• the applications required • the outputs now and in future years • number of pipe lengths in the networks to be modelled • compatibility with the service provider’s SCADA, GIS and other systems • lifecycle cost of software • the service provider’s modelling capability • frequency of use • level of support by software supplier • availability of user groups • track record in other sites.
DetermineModel
Demands& Patterns
DetermineModel Scope
Import Data to Analysis
Package
Undertake Model
Verification
Run Model for Various Scenarios
ModelOutputs
Manage Models
IdentifyServiceNeeds
Determine Service
Objectives
Determine Scope of Planning
IdentifyStakeholder
Requirements
Evaluate Current &
Future Demands
Identify Options for
Service Provision
Develop Implementation
StrategyPlanningReport
Analyse Options
- 63 -

The following issues need to be considered in managing the model:
• The service provider should determine who is responsible for managing the model, whether an external consultant or internally. An agreement should be made in relation to access to data files, outputs, data updates, cost of service and intellectual property.
• Only one master model should exist. This should be a read only file that is available to users.
• Formal systems should be set up to ensure that the master model is up to date so that it reflects reality (e.g. new infrastructure, revised zonal boundaries).
• Formal systems should be developed to ensure efficient and reliable data transfer to and from other service provider information systems.
• Records of the source and quality of each model component should be kept. Notes on the context of the model should be maintained.
• Each model should have an audit trail on how the model was built to provide some assurance on the quality of the model.
• Processes should be set in place to ensure that tedious, repetitive tasks can be automated, or at least minimised. This will allow modellers to allocate more time to the analysis of network performance.
• Operational as well as planning staff should have ownership of the model.
5.2 Determine model scope Prior to commencing the model the service provider will need to clarify exactly what the objectives of the model are so that the appropriate level of data is collected. Typical reasons for modelling a system include:
• investigate system performance using flow survey or first time model build • resolving problems in the system (flooding, overflows) • optimising operations and system performance • investigate future planning and development.
A decision will also need to be made on the extent and level of detail of the model, for instance, will it include the source and treatment plant; all pipes or a skeletal network. The reasons the system is being modelled should determine the extent and detail necessary.
5.3 Determine model demand/flow and patterns Model demands or flows can either be set up using GIS software or manually. Projections of these demands will need to consider the issues highlighted in Chapter 5 – Demand/Flow and Projections.
Diurnal demand/flow patterns will be based on a range of factors including the type of development and location. Diurnal patterns are available from:
• field measurement • various dynamic network modelling packages • internal service provider studies • consulting engineers, who generally have a library of typical diurnal demand patterns.
- 64 -

For water supply the diurnal pattern should include a separate component for water losses which would have a peaking factor of 1.0 (unless the service provider has more reliable information on water loss variation throughout the day) and remain unchanged over the analysed period. However, water losses may change over time depending on the service provider’s supply management strategy.
Diurnal patterns should be developed for:
• Average day demand (AD) • Mean day maximum month (MDMM) • Peak day demand (PD)
The modeller will need to confirm that the selected pattern is realistic for the scheme being modelled. The pattern may change over time in response to demand management initiatives.
For sewerage, static models will be based on fixed dry weather flows plus infiltration and inflow (refer to Chapters 5 and 7).
Dynamic sewer models should be run for a nominated design flow and will incorporate:
• dry weather diurnal flow patterns • groundwater infiltration • rainfall dependent infiltration/inflow for various rainfall return periods (e.g. 2 year ARI).
5.4 Import data to analysis package Network modelling requires a wide range of inputs. The inputs listed in Table 1 should be considered when developing a model.
Table 1: Inputs to be considered for network modelling
Water Supply Sewerage
Mains • Pipe diameter (nominal) • Pipe diameter (internal) • Length • No. of connections • Material/class • Age • Location • Friction factors
• Pipe diameter (nominal) • Pipe diameter (internal) • Length • No. of connections • Material/class • Age • Location • Friction factors • Invert levels • Grade (pipe and manhole)
Maintenance holes
• Type • Location, invert levels, ground
levels
Overflow structures
• Tailwater constraints • Location, invert levels, ground levels, operating levels, diameter, volume outfall location
Valves • Type • Diameter • Location • Operational settings
• Type • Diameter • Location
- 65 -

Water Supply Sewerage
• Design performance
Pumps • Location • Type • Characteristic curves including
power and efficiency • Performance testing/monitoring
data (e.g. flows, suction and discharge pressure, operating periods)
• Operational control settings
• Location • Type • Characteristic curves including
power and efficiency • Performance testing/monitoring
data (e.g. flows, suction and discharge pressure, drawdown tests, operating periods)
• Operational control settings (e.g. for pump control valves and variable frequency drives)
Fire hydrants and services
• Location • Type • Diameter • Hydrant performance
characteristics (flow and pressure where recorded)
Wet/dry wells • Location • Volume, area • Ground level, invert levels
Reservoirs • Location • Volume, area • Operating levels (BWL, TWL,
Overflow) • Any restrictions to the operating
levels • Ground Elevated
Treatment plants • Location • Operating levels • Capacity • Clear water storage
• Location • Operating levels • Capacity
Spatial data • Land Use Plans • Priority Infrastructure Plan • Contour Plans • Infrastructure data for model input • Customer
• Land Use Plans • Priority Infrastructure Plan • Contour Plans • Infrastructure data for model input
Demands/flows • Current demands by customer type • Unaccounted-for-water use • Peaking factors by customer type • Diurnal demand patterns by
customer type • Demand projections by customer
type • Fire flow policy • DMA and Bulk flow meter flows
• Current dry weather flows • Flows by customer type • Peaking factors • Diurnal flow patterns by customer
type • Infiltration/Inflow
- 66 -

Water Supply Sewerage
Customer data • Location of major customers • Standards of service (particularly
flow and pressure) • Fire flow policy • Customer complaint data (e.g.
flow/pressure complaints, main break locations and possibly water quality complaints)
• Location of major customers • Standards of service (particularly
overflow events) • Customer complaint data (e.g.
odours)
Operational knowledge
• Operational staff knowledge • Operating philosophy including
seasonal variations, operational constraints, zone boundaries, restrictions and local service issues
• Operational staff knowledge
Water quality (where modelled)
• Chlorine residual levels • Microbiological results • Location of failure events
• Environmental sensitivity of natural body that receives controlled overflows
Ancillary assets • Internal weirs at bifurcation personal access chambers
• Screens • Flow control devices • Flap valve type • Sluice gates • Storage tanks • Flumes
The inputs will be obtained from various sources including drawings, asset registers, GIS, O&M manuals etc.
Importing of data from GIS or other databases is becoming more prevalent. It also provides a means of verifying or amending existing GIS data.
The importation of data from GIS typically requires significant time and resource inputs. Extensive time is usually required to identify and address errors in the database and to verify the base network data. Modellers should determine GIS requirements and accuracy before commencing modelling input.
For water supply models the modeller will need to determine appropriate pipe friction factors. Defining friction factors is best undertaken through model calibration (refer to Section 5.5). In other cases, friction factors may be defined by standard design criteria, taking account of material, age and condition of the pipes. The results of such modelling assumptions should be verified as outlined in Section 5.5.
For dynamic modelling of sewers the challenge is to determine the level of infiltration/inflow into the system for defined rainfall events. This will depend on the loading, condition, location and level of maintenance of system components (including house drains).
- 67 -

Other inputs required by the modeller to make optimal decisions include:
• Unit cost rates for various pipe diameters in various locations (greenfield, residential, Central Business District) and conditions (e.g. topography, geology).
• Cost estimates for pump stations and reservoirs of various capacities. • Operation and maintenance costs of assets.
For compatibility of GIS and modelling packages, modellers will need to ensure correct connectivity between nodes.
5.5 Model verification and calibration Network models are developed to represent the hydraulic performance of complex systems of pipes, pumps, valves and reservoirs. To adequately plan and manage water networks into the future it is important to replicate, at an appropriate level of accuracy, the performance of the network as a whole and for individual assets. Models can then be used with confidence to predict future performance and to develop cost effective and efficient systems.
Confidence in network models requires verification and/or calibration of the model against operational performance. Models should be calibrated using extensive field data, particularly if the model is being used as the basis of developing capital works programs or for evaluating operational performance and customer impacts. As a minimum, all network models should be verified according to the definition provided in Section 5.5.1.
5.5.1 Definitions For the purposes of this guideline the following definitions are provided:
• Verification of a network model is the review of the inputs of a model to ensure that the outputs reflect the reality of the network operation, without undertaking extensive calibration effort. Verification activities may include: o Checks of input data such as residential population, non-residential demand,
boundary valve locations, pump performance and other asset data o Discussions with operations staff to confirm operational settings, asset data and
system layout o Confirmation of performance issues, e.g. overflow locations, low pressure areas o Use of field data sourced from SCADA or temporary equipment, e.g. pump flow
rates/daily volume throughput and operation times, pressures at pumping stations, reservoir levels, District Metering Area (DMA) flows, hydrant tests and system pressures to check the actual operation of the model.
• Calibration of a network model is the process of adjusting a model’s parameters to ensure that the model’s outputs achieve agreement with field measured data. The calibration process includes the assessment of performance over a range of operating conditions, e.g. 24 hour calibration under summer demand conditions for water supply. Network calibration requires field flow, pressure, reservoir level and other field data as inputs. The extent of field data collected should be sufficient to enable the calibration to achieve the required tolerances.
5.5.2 Water supply models Most water supply schemes have SCADA data at critical assets such as pump stations and reservoirs. This real-time data can be used to verify the operation of the model. Records available may include:
• flows • pressures
- 68 -

• reservoir levels • pump operation, flow rates, suction and discharge pressure • control valve operation.
Calibration requires the collection of extensive pressure, flow and level data together with the status of control valves and pumps. The generated flows and pressure of hydrant tests should be used as inputs for model calibration. A 24 hour calibration under summer demand conditions is normally undertaken to provide a range of conditions in the network. A second 24 hour period is used to check the consistency and reliability of the calibration.
The accuracy of the calibration depends greatly on the density of pressure loggers and the extent of other information collected. In older systems, where pipes have variable friction factors and there are suspected asset data issues such as uncertainty on diameter, material and valve status, a higher density of monitors may be warranted. Where assets are new and in good condition, and there is confidence in the asset data, a lower density of monitors would be acceptable. Higher densities of monitors may also be warranted where water quality calibration is being undertaken.
Where further accuracy is required for the smaller pipes in the reticulation network, hydrant tests may be useful to increase the local flow and generate headloss. Under typical normal demand conditions, the head losses in reticulation mains are very low, pipe friction factors cannot be accurately determined through field measurement as the head losses are in the same order of magnitude of the error bands of typical field flow and pressure measuring equipment. Artificially creating higher flows and high head loss through the network ensures that the head loss measured is several orders of magnitude higher than the instrument error levels.
Verification of the performance of water supply network models must be undertaken as a minimum to confirm the performance of the system. Data collection considerations for planning the verification are provided in Section 5.5.1.
Where model outputs are provided to developers, designers and others for development approval or fire flow requirements, such advice should be combined with field tests to confirm any impact of local pipe conditions on future performance. Advice regarding the type of data to be provided is given in Section 8.
Modellers should be aware that the accuracy of models is limited by many factors, and should consider sensitivity of such issues on outputs and advice provided. Examples of limitations are:
• accuracy of demand patterns for peak days • forecast of demand for future development • performance of aging pumps • currency of closed valve data in GIS • difficulties in replicating modulating valve and variable speed drive operation.
5.5.3 Sewerage models Many sewerage schemes have some form of data logging or SCADA which allow real-time measurement of system performance. Also, additional short term flow survey data may be implemented to capture flow details near critical assets. Different monitors available may include:
• rainfall event recorders • flow monitors
- 69 -

• depth monitors • pump station monitors– o incoming and/or outgoing flow o wet well water levels o pump on/off levels o pump run times
• overflow monitors
The minimum requirement for model verification requires:
• Good quality asset details at, and within the immediate vicinity of areas under investigation.
• Verification of pumps and associated rising mains via pump system curve analysis. This provides pipe friction factors to match pump flow rates obtained from draw down test results.
Verification of a dynamic sewerage model may include checking pump hours for dry weather and overflow events, based on a defined ARI. Flow gauging to determine dry weather flows (DWF) in trunk mains is also used for calibration of sewerage network models.
The accuracy of calibration depends greatly on the density of rain gauges and the extent of other information collected. The number of and distribution of rain gauges is dependent on type of terrain and spatial variability of rainfall in the region. Typically it is advisable that there is 1+1 per 2km.
Calibration of DWF should use only one specific representative profile for weekdays and weekends for all dry weather days/periods under investigation.
Calibration of wet weather flows (WWF) requires using a number of different storm events of varying intensity, rainfall depth and length of duration. Ideally a minimum of three events are required for analysis:
1. Short intense storm (1 to 2 hours) 2. Long duration storm (12 to 24 hours) 3. Multi peaked storm of average duration (6 hours) or consecutive storms
Alternatively, the selection of storms may investigate the catchment time of concentration (Tc) with recommended storm durations 0.5 x Tc, Tc and 2 x Tc.
The last step in the calibration process is to undertake a historical verification of flooding and surcharge data. This applies a large storm event (typically 1 in 10 years ARI event) to the calibrated model to show the system performance for storms not generally recorded during the flow survey.
Predicted flooding locations are then compared with known sources of information, including:
• flooding register • customer complaint databases • observations and photos of system overload from operations • historical newspapers • questionnaires to local residents.
For predicted flooding locations in excess of 25m3, with no corroborating historical data, a site investigation will be required to establish the reason for discrepancy.
- 70 -

Conversely, for cases where flooding is observed to occur and not predicted, then a review of asset and loading details is required.
5.6 Run model for various scenarios As a minimum, models should typically be run for the following planning horizons:
• current year • current plus 5 years • current plus 10 years • current plus 20 years • ultimate development.
Water supply models should be run for each horizon for the scenarios listed in Table 2. This is in lieu of any other scenarios which may be more applicable to the system. In addition to these runs, assessment of performance taking account of the failure of major assets should be undertaken to understand risk and to define redundancy needs.
Table 2: Modelling scenarios–water supply
Scenario Required performance criteria Comment
1. 3 days at Mean Day Maximum Month demand
All reservoirs to have a net inflow at the end of each day
Commence reservoir level at 90% full at midnight (i.e. start of day 1)
2. Scenario 1 to be followed by 3 days of Peak Day demand
No reservoir should have failed during period of analysis
Scenarios 1 and 2 could be run using Peak Week if historical data available, rather than 3 peak days
3. Fire flow Refer to Section 6 Refer to Section 6
The modeller may need to run the water network model for low demand periods to assess whether reservoir detention periods are excessive, which may lead to a detrimental impact on water quality.
The minimum pressures at the property boundary should be:
• Residential – 20 to 25m • Industrial/commercial – 25m
The maximum pressures should not exceed 80m to limit leakage and stresses on the reticulation system and to minimise problems with household plumbing fixtures.
- 71 -

Table 3: Modelling scenarios–sewerage
Scenario Required performance criteria
1. Dry weather flow System meets explicit operational criteria e.g. minimising detention periods (odour management), or overflow events (equipment or power supply failure)
2. Wet weather flows (refer to Chapters 5 and 7)
Number and location of overflows do not exceed service provider customer service and design standards and EPA requirements
Models should be run for an ultimate demand/flow case. Typically the circumstances when the model should be run for the ultimate demand/flow case include:
• to determine long-term asset capacity and cost • where pipeline corridors exist that can only accommodate one main • to determine land requirements capacity and location for future reservoir, water or
sewage pump station sites • to determine optimal staging strategies.
Modelling scenarios should include assessing the impacts of various strategies (e.g. new works, renewals, operational modifications, leakage or pressure management) to meet service standards and operational objectives (e.g. energy management or I/I reduction). Optimising pipe network, reservoir and pump station capacity together with lifecycle costs will be a key element of this process.
Most dynamic water supply network modelling packages are sufficiently powerful to accommodate all pipes in a network. This, together with electronic infrastructure data captured (generally through a GIS), allows a more accurate allocation of nodal demands and assessment of performance of the smaller reticulation mains under normal and fire flow conditions. The use of all mains models for sewerage systems is possible however the data needs of such detailed models are onerous and such an approach may not be cost effective.
Fire Flow Analysis Fire flow analysis should be undertaken for all water supply networks to ensure that the network is capable of providing the performance outlined in Section 5.6 for relevant planning horizons and for specific developments. An approach to undertaking fire flow analyses is also provided in Section 6. Fire flow is also a critical component for the design of pressure management areas as outlined in Section 7.
Transient Analysis Some planning studies may require the need for surge analysis to be undertaken.
Water Quality Modelling A number of water supply network models have the capacity to model chlorine residual decay in the system. Greater utilisation of this capability is likely in the future.
Hydrogen Sulphide Modelling In situations where long detention periods are anticipated or where the system may experience low loadings in the early stages of its life, then hydrogen sulphide generation should be modelled.
- 72 -

The modelling would be based on empirical predictive equations for rising and gravity mains.
5.7 Model outputs Model outputs will include:
• pump station operating periods over time (water supply and sewerage) • reservoir levels over time (water supply) • mains pressure and velocity over time (water supply and sewer rising mains) • overflow events • fire flow performance (refer to Section 6).
This information can be presented in a range of graphical and textural outputs. The results should be presented in a report that describes:
• the methodology for the model • the customer service, design and operational criteria adopted for the model • assumptions used in the model • limitations of the model • verification of model accuracy • results of the modelling and implications on the service provider.
The model should be presented in a workshop to planning and operational staff. Where work is undertaken by external consultants, adequate training should be provided to relevant service provider staff.
6 Fire flow policy and minimum provisions
6.1 Overview Water for fighting fires is a community service provided by water service providers through their water network. Provision of network capacity to fight fires in the community is an important part of the water supply network, however this is no legal requirement for this service to be provided. This section outlines the issues that should be considered by water service providers in relation to providing water for fire fighting.
6.2 Purpose The purpose of this section is to:
• Summarise any regulatory requirements associated with fire provision and fire safety installations.
• Outline the roles and responsibilities of each party with respect to fire provision and fire safety installations.
• Describe a Fire Flow Policy that could be developed by water service providers. • Outline minimum fire flow performance that should be provided by the water service
provider. • Provide guidance on the use of recycled water for fire fighting.
- 73 -

6.2.1 Definitions For the purpose of this section the following terms are defined:
• Fire service – The Queensland Fire and Rescue Service. • Fire flow – The flow, in addition to the background demand of the network, provided from
a water service provider’s water supply main for fighting fires. Fire flow may vary for different land uses.
• Background demand – Level of normal water supply demand that is assumed to occur during fire events.
• Residual pressure – Available pressure in the main measured in relation to the ground level.
• Excessive pressure area – An area of the network where residual pressure is greater than 65m head.
• Pressure disadvantaged area – An area that contains critical hydrants. • Critical hydrant – A hydrant where residual pressures range between 12m to 15m head
based on the fire provision criteria (if the hydrant is not in good condition the required level of service may not be achieved and the hydrant’s condition and operation should be checked under regular maintenance).
• Failure hydrant – A hydrant where residual pressure falls below 12m under the fire provision criteria.
• High fire flow area – An area or property with high risk of fire and hence a fire flow requirement that is higher than the minimum stipulated under this guideline (refer to Section 6.5.2).
• Critical customer – A critical customer can be defined as a customer to whom the water service provider has agreed to provide specific flow and or pressure conditions from the water supply network, e.g. private fire fighting systems in accordance with the Building Code of Australia (BCA).
• Simultaneous fires – A situation where multiple (concurrent) fires occur at the same time within a water supply network.
• District metered area (DMA) – A segregated area of the network with single or multiple inlets which are monitored to measure leakage performance.
• Pressure management area (PMA) – A segregated area of the network with active pressure reduction valves (PRVs) on inlets, designed to manage network pressures to a lower level. Pressure management may be controlled via a constant outlet pressure, a time varied pressure or through flow modulation.
6.3 Regulatory requirements While there are no legislative requirements for a water service provider in Queensland to provide a water supply for fire fighting purposes, water service providers typically provide fire hydrants in road reserves for this purpose. These fire hydrants are maintained at standards set by the provider.
- 74 -

6.4 Roles and responsibilities
6.4.1 Water service provider Each service provider should:
• develop and maintain a fire flow policy as detailed in Section 6.5 • implement a service level agreement with the local fire service • maintain a fire flow provision register • document minimum fire flow provisions and maintain this level of service in the water
supply network • include provisions in recycled water management plans (RWMP) for recycled water used
for fire fighting.
6.4.2 Building owner/occupier It is the legal responsibility of building owners and building occupiers to engage an appropriately qualified person to design, construct and maintain fire safety installations in accordance with the relevant Australian Standards and Building Codes. These obligations include:
• Design fire safety installations in accordance with the relevant Queensland Legislation, parts of Volume 1 of the BCA and referenced Australian Standards.
• Maintain and test fire safety installations in accordance with Queensland Development Code (Part MP6.1) and the Building Fire Safety Regulation 2008 (section 54).
• The building owner must keep a record of maintenance for each prescribed fire safety installation for the building.
• Section 74 of the Building Act 1975 requires a Development Application involving special fire services to be referred to the fire service as an advice agency.
• If water service provider street hydrants are used in lieu of on-site hydrants, then the building owner/occupier is legally required to maintain and test the hydrant in accordance with Queensland Development Code (Part MP6.1) and the Building Fire Safety Regulation 2008 (section 54). At the request of the building owner/occupier, testing of the relevant street hydrant can be conducted by the water service provider or a private tester. If a private tester is used then prior approval to test the hydrant should be sought from the water service provider.
6.5 Fire flow policy
6.5.1 Overview A Fire Flow Policy is a commitment to cooperate and communicate with the local fire service to provide an appropriate standard of fire protection to the community.
To comply with this guideline, a water service provider must develop a policy detailing the fire fighting provisions required for water supply reticulation systems in its area. Cooperation with the local fire service is essential for the continuing provision of reliable fire service.
A Fire Flow Policy should include the following:
• Risk Assessment – A plan to identify and address existing and future fire risks (refer to Section 6.5.2)
• Fire Flow Provision Register – Reference to the maintenance of a property register detailing cases where additional fire provision is to be delivered above or beyond the levels specified in this guideline and where street fire hydrants are used in lieu of on-site fire safety installations (refer to Section 6.5.3)
- 75 -

• Service Level Agreements – A way of formally documenting agreed service levels between the water service provider and the local fire service (refer to Section 6.5.4)
• Communication – Commitment to a communication protocol, and details of relevant information to be provided to the fire service (refer to Section 6.5.5)
• Flow Provisions – Details of the fire flow provisions to be provided in the water supply network (minimum fire flow provisions are provided in Section 6.6.2)
• Residual Pressure – Details of the minimum residual pressure requirements within the water supply network at specified minimum fire flows (refer to Section 6.6.3)
• Background Demand – Outline of the background demand criteria applied during a fire flow analysis (refer to Section 6.6.4)
• Use of Recycled Water – Linkage of any recycled water network nominated for fire provision to a RWMP (refer to Section 6.6.6).
6.5.2 Risk Assessment A water service provider should identify fire related hazards and assess the level of risk from these hazards to then establish High Fire Flow Areas. Efforts should be made to mitigate risks, however in cases where mitigation is not feasible consideration may be given to increased fire flow and/or higher residual pressure (within limits).
It is recommended that the hazard identification and risk assessment be undertaken in conjunction with the local fire service.
As part of the assessment the water service provider should undertake an initial fire flow capacity investigation, with the support of network modelling, to identify the following:
• critical hydrants • failure hydrants • excessive pressure areas • pressure disadvantaged areas • critical customers • high fire flow areas • inadequately spaced or no hydrants.
Should any potential failure hydrants be identified as part of the investigation, field checks should be done to ensure that the minimum fire provision is achievable and any required works should be placed on a prioritised program, based on the risk determined through the assessment.
As part of the assessment, the water service provider should, in conjunction with the local fire service, identify and categorise hazards including:
• buildings that are constructed of high risk material e.g. full timber construction • buildings that are constructed in close proximity • buildings close to dense vegetation with a high risk of bushfires • areas with aged infrastructure including mains, hydrants and fittings • areas where access to buildings is difficult due to terrain • PMA (existing or future) • areas served by pump systems to ensure adequate residual pressures • area is pressurised and no fire fighting reserve exists • area is pressure disadvantaged or has critical hydrants.
- 76 -

The level of risk associated with these hazards should then be assessed using an appropriate risk assessment methodology. Where critical hydrants exist in areas that have no hazards, then further action will not be necessary. However, if the risk assessment highlights unacceptable risk levels, mitigation strategies should be developed.
Risk mitigation strategies that should be considered may include the following:
• further assessment of the hydraulic performance of the network • replacement of aged hydrants with new epoxy coated units • regular hydrant inspection, testing and maintenance • pipe lining or replacement (including hydrant riser) • additional hydrant installation (smaller spacings e.g. 40m spacing) to reduce high
headloss through hydrants and improve available fire flow. This may be of particular importance in commercial/industrial areas.
• installation/upgrade of water supply network pumps to improve fire flow performance. Consideration should be given to standby power in these situations e.g. pressurised systems/high level zones without sufficient fire storage
• adoption of localised peaking factors for high level systems where system pressure is solely provided by pumps
• flow modulation of PRVs or secondary feeds in PMAs • additional flow and or residual pressure provision above that detailed in these guidelines • treatment of buildings that are identified as being at unacceptable risk with fire demand
provisions under the BCA which are greater than the default values in this guideline.
The methodology, assessment and outcomes of the risk assessment should be fully documented and revised regularly when system characteristics are changed, or new risk hazards identified.
6.5.3 Fire flow provision register A water service provider may, in certain situations, provide fire flow capacity that is greater than those specified in this guideline, either to individual developments where capacity is available, or to specific areas such as Central Business Districts and industrial estates. To ensure the higher flow provisions are accounted for into the future a water service provider should maintain a Fire Flow Provision Register.
The Register should record the conditions under which the approval of the higher fire flow provision was made, including:
• Development-based approval– o date of approval o property identification o description of the applicable structures on the property (e.g. BCA building class,
number of levels, floor area etc.) and approved use o location and size of supply from the network (asset ID and details) o level of service provided (flow and pressure) o additional devices installed on the property for fire protection, e.g. separate fire main,
fire pump, tank or other equipment • High fire flow area decision– o date of commencement o level of service to be provided (flow and pressure) o outline a nominated off-take point or applicable asset from the network (infrastructure
asset ID etc.) o use of the building or facility.
- 77 -

The Register should also include the location and required pressure and flow for any street hydrants that are used in lieu of on-site fire safety installations.
6.5.4 Service level agreements Service Level Agreements, between the water service provider and the local fire service, are recommended as a way of documenting the risk management process and ensuring it is revised regularly.
The purpose of these agreements is to define the expected standard of procedures and communication activities that will occur between the water service provider and the local fire service to ensure that community expectations for fire flows are maintained.
Service Level Agreements are achieved by:
• Establishing and defining the communication requirements and expectations between the water service provider and the local fire service.
• Understanding that any requirements or expectations should be compatible with the water service provider’s system.
• Building strong co-operation around critical technical decision-making in distribution network performance, augmentation and alteration.
• Ensuring the water service provider nominate an on-call officer to advise fire service officers in the event that changes to the distribution network may have an adverse impact on fire fighting capability, including significant supply interruptions.
• Sharing of information regarding distribution network performance including pressures and water flows.
• Providing a framework for escalation of unresolved issues around water loss management activities between the water service provider and the local fire service.
Template documents for creating a Service Level Agreement are available from the Queensland Water Directorate website <www.qldwater.com.au>.
6.5.5 Communications with the fire service Regular communication with the local fire service is a key element of the Fire Flow Policy. As part of this process water service providers should provide the following to the local fire service:
• Maps showing the water supply network and all fire hydrants in an agreed GIS format and identifying– o Critical pressure hydrants (those with residual pressure less than 12m head during a
fire event) and expected timing for rectification o Pressure disadvantaged hydrants (those with a residual pressure between 12 to 15m
head during a fire event) o Excessive pressure hydrants (those with residual pressure areas > 65m head under
night demand conditions) • Maps showing details of DMA/PMAs, including– o Location of normally open supply points o Location and type of PRVs e.g. flow modulated, fixed outlet pressure o Area boundary and any secondary supply points o Critical pressure points i.e. location of lowest operating pressure
• Maps showing recycled water areas designated for fire flow application • Adopted fire flow provision for each hydrant • Identification of high risk properties (as agreed with the fire service) • Fire Flow Provision Register data for relevant properties
- 78 -

Information provided to the fire service should be updated on a periodic basis or when substantial changes to network operation warrant.
Service Level Agreements as discussed in 6.5.4 should be in place between the water service provider and the local fire service to formally document communication requirements and expectations.
6.6 Minimum fire flow for water service provider networks
6.6.1 Overview This section outlines the minimum fire flow provision for hydrants and storages which are owned and maintained by the water service provider. These provisions should be considered as the minimum provisions that should be provided by the water service provider. In practice, the minimum pressure provisions will be exceeded except where topographic or operational constraints exist. If there is excess capacity in the network, the water service provider should consider making this capacity available for private on-site hydraulic systems.
These provisions define the following parameters:
• fire flow for residential and non-residential areas • residual pressure at the point of the fire connection • background demand to be allowed for at the time of a fire.
6.6.2 Minimum fire flow The minimum fire flow provision will vary dependent on the type of development, and the capability of the community to resource fire protection. The following categories of development should be considered for the design fire flow:
• General urban category – comprises areas served by an urban fire service. Minimum fire flows for this category are– o residential buildings (3 storeys and below) – 15 L/s for 2 hour duration o high density residential buildings (greater than 3 storeys) – 30 L/s for 4 hour duration o commercial/industrial buildings – 30 L/s for 4 hour duration o high fire flow areas – refer to Section 6.5.2
• Small community category – comprises communities with a permanent population of
less than 500 people, or served by a rural fire service or equivalent. In these communities discussions with the local rural fire service are required to determine minimum fire flows. It is recommended that the following is considered– o residential buildings (up to 2 storeys) – the agreed fire flow should not be below
7.5 L/s for a 2 hour duration o non-residential buildings (up to 2 storeys) – the agreed flow rate should not be below
15 L/s for a 2 hour duration o other buildings – in the case where higher fire risks are associated with a building or
group of buildings, the ‘General Urban Category’ provision should be adopted. A building may be deemed to be subject to a high fire risk due to one or more of the following factors- public access buildings that are constructed of high risk material e.g. full timber
construction buildings that are constructed in close proximity e.g. multiple sole occupancy,
building spacing less than 1.5m etc. buildings with more than 2 storeys buildings close to dense vegetation with a high risk of bushfires areas with aged water supply infrastructure including mains, hydrants and fittings
- 79 -

areas where access to buildings is difficult due to terrain buildings with fire flow demand greater than the default residential and
non-residential values (i.e. high fire flow areas) buildings used to store or manufacture highly flammable materials.
Where identified risks cannot be mitigated, more appropriate fire flow provisions should be adopted.
• Tourist affected small community category – this category comprises small communities with a permanent population of less than 500 people and served by a rural fire service or equivalent. A risk assessment should be undertaken, in conjunction with the local fire service to determine whether an elevated level of risk exists during peak holiday periods. Based on the assessed level of risk the fire flow adopted for this category should be as follows– o limited risk – refer to small communities category above o elevated risk – refer to general urban category above
• Rural residential category – this category includes large lot rural or park residential
development (e.g. >5000 m2). Due to the difficulties that exist in providing effective and practical fire flow provision to areas of sparse residential development, a clear understanding of the capacity of the water supply service should be developed with the fire service. Water service providers should consider the following when determining a minimum fire flow– o urban fire service – general urban category flows should be provided o rural fire service – the greater of the small communities flow provision or the existing
standard provided in adjoining areas should be provided o development provisions such as on-site storages (swimming pools or tanks) or tanker
filling points on the main for schemes where small mains or a constant flow water supply scheme is provided which will not provide adequate fire flows.
6.6.3 Residual pressure The minimum residual pressure to be provided is that which will maintain a positive pressure on the suction side of the fire service appliance when operating at the minimum fire flow. The adopted residual pressure should be as follows:
• 12m head measured in the main (relative to estimated ground level) at the hydrant • 6m head in the main for all other areas of the water supply zone to ensure a minimum
level of service to other customers during a fire event.
These pressures are for fire flow conditions and not under normal operating conditions where the higher pressures outlined in Section 5 are provided.
Analysis of a typical water supply reticulation arrangement indicates that:
• Dependent on the background pressure and local pipe diameters, 2 hydrants in good condition can be required to obtain a minimum flow rate of 15 L/s at 12m head
• To enable the extraction of a commercial / industrial flow provision (minimum of 30 L/s) up to 3 hydrants in good condition are required at the specified residual pressure of 12m head. Spacing of hydrants in such areas requires careful consideration (refer Section 6.5.2).
- 80 -

It is essential that mains and hydrants are kept in good condition through regular inspection and maintenance programs. This particularly applies to infrastructure in pressure disadvantaged areas to ensure that the minimum desired flows and residual pressures are achieved and that, ultimately, sufficient flow and pressure is provided to the fire service appliance suction hoses.
In addition the service provider should define the operating level of reservoirs that service the zone, to ensure that the residual pressure can be achieved 95% of the time. The operating level for fire flow could be defined as mid water level or minimum operating level dependent on operational settings.
6.6.4 Background demand The level of background demand needs to be established to provide a balance between risk and cost. Assessment of fire events over a 9 year period was undertaken to assess the probability of fire occurrence. Based on this assessment the following minimum criteria should be adopted for background demand during a fire event:
• Predominantly Residential Areas o The minimum residual pressure specified in Section 6.6.3 should be achieved
with a background demand of 2/3 Peak Hour demand (calculated using adopted Desired Standard of Service criteria). Background demand will be less than 2/3 Peak Hour approximately 95% of the time.
o A check should be undertaken at Peak Hour demand (calculated using adopted Desired Standard of Service criteria) to ensure that pressures in the network remain positive.
o The calculated background demand should not be less than AD. o Predominantly Commercial / Industrial Areas – In this case, the following
scenarios should be investigated with the worst case being adopted: o At Peak Hour demand of the Commercial / Industrial area (e.g. between 10am
to 4pm). The intent of this model is to assess the local reticulation performance.
o At the 2/3 Peak Hour demand of the water supply zone (e.g. around 6pm). The intent of this model is to assess the zone trunk performance.
o Mixed Residential / Commercial / Industrial Areas – In such cases a combination of background demand conditions similar to the Predominantly Commercial / Industrial Areas above should be examined.
6.6.5 Summary of minimum fire provisions A summary of minimum fire provisions is contained in Table 4.
- 81 -

Table 4: Summary of fire provisions
Item Description
Flow provision – general urban category (Section 6.6.2)
Residential building (3 storeys and below) 15 L/s for 2 hour duration (from up to 2 hydrants)
High Density Residential building (greater than 3 storeys)
30 L/s for 4 hour duration (from up to 3 hydrants)
Commercial / Industrial building 30 L/s for 4 hour duration (from up to 3 hydrants)
High Flow Area Refer to ‘Risk Assessment’ provision below
Flow provision – small community category (Section 6.6.2)
Residential buildings (up to 2 storeys) 7.5 L/s for 2 hour duration*
Non-Residential buildings (up to 2 storeys) 15 L/s for 2 hour duration*
Other buildings Refer ‘General Urban’ category above
Residual pressure (Section 6.6.3)
Minimum Residual Pressure – In the main at the hydrant
12 metres head
Minimum Pressure – Elsewhere in the supply zone during a fire event
6 metres head
Risk Hazard Refer to ‘Risk Assessment’ provision below
Positive residual pressure must be provided in the main at PH demand during a fire event
Background demand (Section 6.6.4)
Predominantly Residential Areas • 2/3 PH • not to be less than AD • check for positive pressure at PH
Predominantly Commercial / Industrial The assessment is to be conducted for the following scenarios: • PH for localised Commercial / Industrial area • 2/3 PH for total zone
The worst case scenario is to be used, which may vary from site-to-site.
Risk assessment (Section 6.5.2)
High Flow Area • risk areas to be identified • QFRS to be consulted • mitigation measures to be utilised to reduce
risk * Consultation must occur between the service provider and the Rural Fire Service to determine the adopted flow provision. These specified flow rates represent the minimum allowable provision.
6.6.6 Recycled water When recycled water is supplied for fire fighting and/or fire protection (i.e. water for fire sprinkler systems) the following should be considered:
• The recycled water supplied should be Class A+ quality as defined in the Public Health Regulation 2005.
• Under the Public Health Act 2005 the recycled water quality must be fit for use and therefore consideration should be given to the ability of the system design to maintain the water quality.
- 82 -

The recycled water provider must have an RWMP approved by Water Supply Regulation, DEWS in accordance with the Water Supply (Safety and Reliability) Act 2008 where recycled water is:
• sewage or effluent sourced from a service provider’s sewerage, or is wastewater that is supplied to an unrelated entity and
• the supply of recycled water meets the definition of a dual reticulation system.
A dual reticulation system means a network of pipes enabling drinking water and recycled water to be supplied to premises from separate pipes, but only if used to provide recycled water for—
• flushing toilets or • connection to a cold water laundry tap for a washing machine at a residential premises or • irrigating lawns or gardens of a residential premises or • washing down external parts of a residential premises.
The RWMP must be approved prior to the supply of recycled water for dual reticulation and it is an offence for a recycled water provider to supply recycled water for a dual reticulation system without having an approved RWMP.
7 Demand and pressure management areas
The introduction of DMAs and PMAs can impact on a water service provider’s customers. It is important to consult with relevant stakeholders on all aspects of the planning, design, implementation and operation of pressure management programs.
There are three private hydraulic systems that may be affected by the implementation of DMA/PMAs. These are:
• fire safety installations • domestic water supply • water-based commercial and industrial processes.
The planning process should seek to optimise the arrangement of the area in order to strike a balance between the reduction in water pressure and the overall cost of implementation (including consideration for the effect on existing buildings). Water service providers should consider the whole of community cost as well as water service provider’s cost when planning pressure management programs. If a decision is made to proceed, then all affected customers such as building owners and occupiers should be issued timely and effective notice allowing them sufficient time to make any necessary upgrades to their private hydraulic systems. However, where the implementation of a DMA/PMA will result in considerable costs to the community, a water service provider should consider other alternatives for managing its network.
The process that should be adopted when implementing DMAs and PMAs is shown in Figure 2.
- 83 -

Figure 2: Process for implementing DMA/PMAs
Step 1 – Preliminary DMA/PMA planning and design
Step 2 – Identification of buildings that may be affected
Step 3 – Consultation with building owners/occupiers
Step 4 – Review of DMA/PMA planning
Step 5 – DMA/PMA detailed design
Step 6 – Notification to building owners/occupiers
Step 7 – Modification of building hydraulic systems as required (by building owners/occupiers)
Step 8 – DMA/PMA commissioning
Step 9 – Compliance testing (by building owners/occupiers)
The key elements of the above process are:
• Planning and design • Consultation with community, including building owners/occupiers • Commissioning • Compliance testing.
The important considerations for each of these elements are described in the following sections.
7.1 Planning and design Although it is not the intent of this guideline to provide a detailed design guide for pressure management it is important that the designer considers a range of issues in the design:
• DMA/PMA planning is based on the fundamental requirement that minimum water supply service standards are not contravened. Service standards include– o minimum pressure supplied to customers point of connection o fire flows from water service provider owned hydrants in the street are in accordance
with system design standards • Design should be undertaken using network models calibrated to a reasonable density of
flow and pressure data loggers and appropriate tolerances. The aim of this exercise is to ensure that the model replicates the actual configuration and operation of the network under a range of conditions.
• Where a large flow range is required PRV installations may need to incorporate high and low flow valves or multiple feeds. Large increases in local flow rates and pressures during fire events can cause damage to assets including PRVs and private connections.
- 84 -

• System controllers should be designed to operate PRVs across the full range of flow and pressure including fire flows for all serviced customers. Monitoring should be connected to either SCADA or dial up systems configured to immediately alarm on any abnormal condition.
• PRV design must consider the reaction time for supplying fire flows. This may be achieved by ensuring that the controller and valve operator are fully compatible and that the system has sufficient capacity for the full range of flows.
• PRV design should consider a higher level of fire flow than the minimum provision if it is available in the network. This can be analysed by performing hydraulic calculations for available fire flow from the most hydraulically advantaged locations within a DMA/PMA.
• Consider using dual feeds for DMAs as this usually significantly enhances available network fire flows.
• Failure mode of PRVs needs to be considered. From a fire protection perspective the preferred solution is to fully open or open at a pressure designed to deliver the required background demand and fire flow.
• Alternative feeds to DMAs/PMAs taking account of fire flows should be included for use during maintenance.
Pressure management tends to complicate previously open and simple water supply systems. Therefore, it is essential that comprehensive contingency planning is undertaken as part of the implementation process. Such planning should include the following aspects:
• A risk assessment and mitigation strategy should be developed using a reliable methodology such as that outlined in AS/NZS ISO 31000:2009, including either hazard and operability study assessment or failure analysis to identify possible modes of failure.
• Risks should be addressed as part of system design, where possible. If this is not possible then monitoring should be provided, together with consideration of critical spares and external maintenance providers for specialist equipment.
• System monitoring should identify any abnormal operation with immediate alarming to operations staff. This may be achieved using either SCADA or mobile technology.
• Contingency plans should be documented and provided to operations staff through suitable training. Information needs to be kept up to date through quality management procedures.
• Documentation of boundary valve location is essential together with methods to manage the on-going operation of valves during emergency and routine maintenance.
7.2 Consultation with building owners/occupiers As the legal responsibility lies with the building owner/occupier, water service providers should adopt a process for notifying affected occupiers of proposed pressure management programs. A reasonable period should be allowed for the affected parties to undertake any necessary design and upgrading of fire safety or other hydraulic installations.
7.2.1 Identify affected buildings Water service providers should identify all buildings that may be affected by a change in mains pressure, such as multi-storey buildings, large residential complexes, boarding houses, holiday accommodation, aged-care centres, hospitals and other commercial and industrial facilities. Types of systems that may be affected include building fire safety installations, domestic water supply to multi-storey buildings and water driven commercial and industrial processes.
- 85 -

Water service providers should liaise with their relevant plumbing division regarding the installation of on-site water devices e.g. residential pressure reduction valves and backflow prevention devices that may be installed in accordance with the Plumbing and Drainage Act 2002.
7.2.2 Consultation with building owners/occupiers Water service providers should liaise with the building owners/occupiers to ensure that their water supply requirements are clearly understood and taken into account. Consideration should be given to:
• The minimum water flow and pressure required for the building’s hydraulic systems to function in accordance with the relevant legislative requirements.
• The potential impact of the proposed change in mains pressure. • The scope of any modifications that may be required to the building’s hydraulic systems,
as a direct result of the proposed change. • The estimated cost of implementing the modifications.
7.2.3 Review of planning Having received feedback with relation to building modifications that would be required, water service providers can make an informed assessment of the total costs associated with the viability of proceeding with the DMA/PMA. At this point the water service provider may consider the following options:
• proceeding with the proposed DMA/PMA without alteration • reconfiguring the DMA/PMA boundary to exclude critical buildings • upgrading property connections to provide additional supply • augmenting the water supply network within the DMA/PMA • scaling back any proposed pressure reduction • deferring the implementation of the DMA/PMA until a time in the future when the cost to
achieve the water loss savings may be more viable.
7.2.4 Notification to building owners/occupiers Once the planning for the implementation of a DMA/PMA is finalised the water service providers should notify the building owners/occupiers likely to be affected that the pressure and flow regime is going to change and that they should take necessary action to ensure that building’s hydraulic systems are compliant under the new condition.
The notification should include:
• The date by which all necessary modifications to building fire safety installations and other hydraulic systems should be completed.
• Reference to final pressure and flow advice that may be offered by the water service providers (refer to Section 8 of this guideline for advice on providing flow and pressure information to customers).
• Reference to the Building Fire Safety Regulation 2008 requiring building owners/occupiers to maintain at all times the prescribed fire safety installation to a standard of safety and reliability in the event of a fire.
A period of up to 12 months should be allowed for modification of works to be completed. It should be noted, that major works requiring Sustainable Planning Act 2009 or Building Act approvals may require a longer period of time.
- 86 -
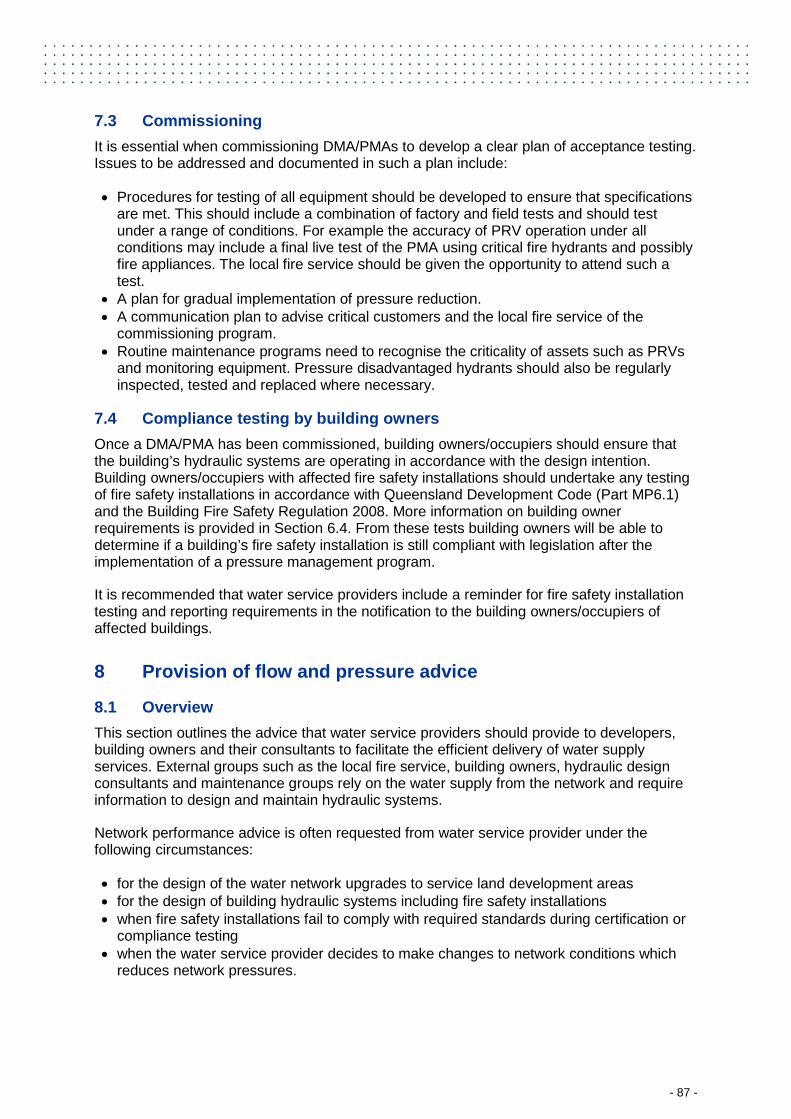
7.3 Commissioning It is essential when commissioning DMA/PMAs to develop a clear plan of acceptance testing. Issues to be addressed and documented in such a plan include:
• Procedures for testing of all equipment should be developed to ensure that specifications are met. This should include a combination of factory and field tests and should test under a range of conditions. For example the accuracy of PRV operation under all conditions may include a final live test of the PMA using critical fire hydrants and possibly fire appliances. The local fire service should be given the opportunity to attend such a test.
• A plan for gradual implementation of pressure reduction. • A communication plan to advise critical customers and the local fire service of the
commissioning program. • Routine maintenance programs need to recognise the criticality of assets such as PRVs
and monitoring equipment. Pressure disadvantaged hydrants should also be regularly inspected, tested and replaced where necessary.
7.4 Compliance testing by building owners Once a DMA/PMA has been commissioned, building owners/occupiers should ensure that the building’s hydraulic systems are operating in accordance with the design intention. Building owners/occupiers with affected fire safety installations should undertake any testing of fire safety installations in accordance with Queensland Development Code (Part MP6.1) and the Building Fire Safety Regulation 2008. More information on building owner requirements is provided in Section 6.4. From these tests building owners will be able to determine if a building’s fire safety installation is still compliant with legislation after the implementation of a pressure management program.
It is recommended that water service providers include a reminder for fire safety installation testing and reporting requirements in the notification to the building owners/occupiers of affected buildings.
8 Provision of flow and pressure advice
8.1 Overview This section outlines the advice that water service providers should provide to developers, building owners and their consultants to facilitate the efficient delivery of water supply services. External groups such as the local fire service, building owners, hydraulic design consultants and maintenance groups rely on the water supply from the network and require information to design and maintain hydraulic systems.
Network performance advice is often requested from water service provider under the following circumstances:
• for the design of the water network upgrades to service land development areas • for the design of building hydraulic systems including fire safety installations • when fire safety installations fail to comply with required standards during certification or
compliance testing • when the water service provider decides to make changes to network conditions which
reduces network pressures.
- 87 -

8.2 Development/building applications Provision of flow and pressure information facilitates design by hydraulic consultants as well as land developers. However to achieve an efficient design which takes account of the current and future network requirements, a range of options including upgrading of the water service provider’s network should be assessed.
8.2.1 Land development As part of the development application process, information regarding the available flow and pressure is usually requested by developers to design sub-divisions. Advice provided by the water service provider should consider the extent of the development (and hence the likely demand on their existing network) and the complexity of the analysis required.
This information should be the basis of a network modelling scenario to determine the performance of the existing system under the demands imposed by the development. This modelling should be the responsibility of the developer and carried out by either:
a. The developer using the service provider’s established model (whole or relevant sub-model)
b. The service provider at the developer’s cost.
As part of the network modelling the developer will be required to ensure that:
a. The water service provider’s mains are designed to comply with the adopted design standards for street hydrants (or minimum standards outlined in this guideline). Any private fire services should be designed to the relevant codes and Australian Standards.
b. Any augmentations required to the existing network for it to continue to comply with adopted standards.
Where modelling is undertaken by the developer, the water service provider will need to supply sufficient information to support the level of assessment.
Where network models are not available, the water service provider should provide any available asset data together with land use and demand data to enable a competent designer to size the network augmentations associated with the development. In this instance some level of field verification such as a hydrant test should be undertaken. More information on providing advice when network models are not available is provided in Section 8.5.
8.2.2 Building approvals While it is the legal responsibility of a building owner/occupier to ensure their buildings meet fire safety standards, advice should be provided by water service providers to building developers/hydraulic consultants during the design of building fire safety installations. The advice provided should accurately reflect the capacity of the network without compromising future network growth or the ability of the water service provider to implement leakage and pressure management programs. Advice should be adequate for hydraulic consultants, in consultation with the building owner, to assess risks and to design a system to meet the relevant regulatory requirements.
All new development for buildings classified from Class 2 to 9 must ensure that adequate fire protection is available in accordance with the BCA. Developers generally commission hydraulic consultants to design internal systems in accordance with the requirements of Australian Standards as referenced by the BCA.
- 88 -

For hydraulic consultants to design appropriate systems, information is required on the available flow and pressure in the water supply network.
Design of fire safety installations is generally based on the residual pressure available at the connection point for 95% of the time. As outlined in AS2419.1 and other relevant standards, residual pressure data is generally supplied from:
• Hydraulic Models – An analysis using a network model can be undertaken at background demand levels to provide hydraulic performance to be guaranteed 95% of the time. This is the preferred source of performance data.
• Field Hydrant Tests – This method provides a snapshot of the hydraulic performance of the network. Such a test is rarely undertaken at background demand level that would meet the 95% of the time condition, and does not take account of future demand in the network. Therefore such an approach in isolation will generally result in an overestimate of the ability of the water service provider infrastructure to supply fire flow.
The use of data from network models is the preferred approach to providing information for the design of fire safety installations. Data should be provided from a network model at an appropriate point in the network, i.e. at a point where there is reasonable confidence in the accuracy of the information. When providing information the following should be considered:
• Where a network model is fully calibrated the advice may be provided directly from the model for the point of connection.
• Where the model has been verified at a higher level, then the service provider should provide model output data at a System Reference Point or SRP (as identified in AS2419) and a hydrant test should be carried out at the point of connection, with pressure gauges simultaneously read at both the SRP and on a non-flowing mains branch/standpipe near the point of connection to determine the additional hydraulic losses between the SRP and the point of connection. Care must be taken to account for any further additional pipe losses that will occur between the point of pressure measurement near the connection point and the proposed fire service point of connection.
8.2.2.1 Suggested process for assessing fire flow applications Hydraulically modelled fire flow and pressure advice should be sought by hydraulic consultants, land developers or building owner/occupiers from a water service provider. This advice should be augmented with a hydrant field test to verify that the results reflect actual field conditions. The advice should be used as the basis for the developer assessing if the source of water is capable of meeting the minimum pressure requirements at the specified flow rates. If the source is not capable of meeting the requirements, the developer will need to consider the following options:
• Provide pump(s) with suction connected directly to an acceptable source of water supply, which is water service provider mains (subject to approval from the water service provider), private reservoir, river, lake, sea or bore.
• Provide pump(s) with suction connected to a suction tank which is filled from the acceptable source of supply e.g. water agency mains.
• Provide storage tank which is filled from the acceptable source.
- 89 -

8.2.2.2 Pressure and flow advice for fire safety installations Water service providers should develop a standard form for provision of advice on the performance of the network. The advice should include:
• Pressure at the connection point under normal (non-fire flow peak hour) operating conditions. This would include either current conditions or future conditions (whichever is the worst case scenario), where there is likely to be a marked change.
• Mains pressures expected to be maintained for 95% of the time (as per AS2419) either at the point of connection or at an SRP or a node close to the proposed connection point. This data should be in the form of residual pressure for various flow rates.
• maximum permissible flow from the nominated connection point • volume of water available in storage reservoirs for the fire event.
An example pro-forma for the supply of flow and pressure advice has been provided in Appendix 1.
8.2.2.3 Possible conditions associated with flow and pressure advice Provision of any flow and pressure advice based on network assessment should include conditions to contextualise the advice. Possible conditions could include:
• The service provider cannot guarantee water pressures and flows in excess of its published service standards.
• The information provided is based on the best available information at the time of publication and is subject to variation over time.
• Network models are verified with limited data and conditions in the field may vary from modelling assumptions.
• Field investigations and inspections should be undertaken to satisfy the user that the data is suitable for its intended purpose. Users relying on hydraulic modelling information do so at their own risk.
8.3 Certification and compliance testing Building owners are required to undertake testing of fire hydrants and sprinkler systems as part of the certification and on-going compliance of fire safety installations. Any testing should be conducted in accordance with the Queensland Development Code’s (Part MP6.1) Fire Hydrant and Sprinkler System Commissioning and Periodic Maintenance Procedure using properly calibrated and maintained equipment.
If during testing of fire safety installations the pressure/flow rates do not meet the fire safety installation’s design criteria a thorough check of potential on-site problems should be undertaken. The relevant water service provider should only be contacted once all potential on-site issues have been investigated. The water service provider may be requested to issue an up-to-date flow and pressure advice. If the results do not explain the performance, the following may be required:
• identifying whether pressures in a pressure managed area have changed • undertaking a network valve status check.
8.4 Changes to network conditions Pressure in the network can fluctuate due to a large number of factors:
• Normal daily variations due to time of day water use patterns, tank water level fluctuations, hydraulic transients, valve operation, and cycling of pumps.
- 90 -

• Short-term emergencies due to fires, pipe breaks, system components out of service for rehabilitation and repair, power outages, and flows from sprinklers to fight fires.
• Long-term system changes due to water main construction, changes in pressure regulating valve settings, addition of new pumps, corrosion and scale in piping, and changes in pressure zone boundaries.
• Long-term variations in water use patterns, including new users and changes in usage for existing users.
The water service provider should include this advice on their proforma to the hydraulic designers.
8.4.1 Temporary changes It is essential that a communication process be agreed which meets the reasonable expectations of the local fire service, providing information on planned and emergency changes, which have a significant impact on the anticipated ability to fight fires. This information will allow the local fire service, if appropriate, to amend their response to an event to match the conditions in the field. The focus should be on manageable and robust information systems, taking into account risk assessment.
8.4.2 Permanent changes Intentional pressure reductions can have impacts on a range of customers who rely on the delivery of potable water within a known pressure range.
A customer communication process should be implemented when the impact on customers is likely to be significant (e.g. when pressure drops below 40m head or a decrease of more than 10% or 5m) for an extended amount of time (e.g. longer than 6 months).
A similar process to that adopted in Section 7.2 should be developed for any planned pressure management programs.
8.5 Water supply schemes without network models Water service providers may have small to medium size schemes for which a network model has not been developed. In such cases, alternative approaches should be adopted to assess the performance of the water supply network under fire fighting conditions, e.g. hydrant flow and pressure tests.
Water service providers should supply information based on the levels of reservoirs and the likely operating level that would be available for 95% of the time. An estimate of the background demand, based on the adopted design criteria and the number of connections, can be developed by the hydraulic consultant.
It is recommended that the hydraulic consultant seeks information from the water treatment plant or system operator on direct pumping into the network or other operational issues which may affect flow and pressure in the network. Advice from the local fire service should also be sought prior to approval of a connection.
9 Checklist
How confident are you that the following model inputs are accurate?
o infrastructure attributes (plans and GIS) o demands o friction factors
- 91 -

What have you done to confirm the reliability of inputs?
Have you fully considered how inputs (e.g. demands, diurnal patterns etc.) will change over time?
Has there been sufficient time spent on model analysis or has the time been spent on mechanical data input?
Does the model reflect reality of operation?
What is the level of model verification/calibration undertaken?
Have operational staff been involved in the development of the model?
Do operational staff have ownership of the model?
Has sufficient strategic thinking been applied to this modelling? How?
Has a realistic policy on fire flows been developed? Are the modelling outputs consistent with this policy?
Are you confident that the proposed strategies are optimal for the system? What have you done to confirm that this is the optimal solution?
Have adequate arrangements been made for managing this model? (e.g. responsibilities, maintenance, audit trail, data transfer)
Has adequate hand-over and training been provided on the model?
10 Bibliography
Australian Building Codes Board, Building Code of Australia.
AS2118.1-2006 Automatic Fire Sprinkler Systems Part 1: General Systems
AS2118.1-1999 Automatic Fire Sprinkler Systems Part 1: General Systems
AS2419-2005 Fire Hydrant Installations Part 1: System design, installation and commissioning
Carthew M, Jegatheesan V, Fracchia H, Network Modelling for Townsville Distribution System, AWA Federal Convention 2003.
Queensland Development Code (Part MP6.1), Fire Hydrant and Sprinkler System Commissioning and Periodic Maintenance Procedure – Version 1. Accessed: 2 December, 2011.
Local Government Infrastructure Services (2007), Guideline for Implementing Pressure and Leakage Management in Areas Containing Buildings with Fire Protection and other Hydraulic Systems
Walski T, Barnard TE, Merritt LB, Harold E, Walker N, Whitman BE, Wastewater Collection Systems Modelling and Design, Haestad Press.
- 92 -

Appendix 1 Example pro-forma
Fire Flow and Pressure Advice
Date: Reference:
Applicant details
Name: Contact number:
Property details
Address:
Property number: Land use:
Requested fire flow and pressure
Design flow (L/s): Residual pressure (kPa):
Water supply zone information
Zone name:
Reservoir mid water level/maximum HGL (m AHD):
Pressure managed area? Y N
Supply main (at connection point) (refer to attached plan)
Size of main: mm Material of main:
Modelling reference point
Modelling information is based on the following location (refer to attached plan)
Note: Show system layout and demand/flows in connection mains to enable calculations of head loss from SRP to property (if applicable)
Model node number/s
Assumed node elevation (m AHD measured at ground level):
- 93 -

Residual pressure available for 95% of the time (Measure in main at modelling reference point. Losses through hydrant not included.)
Flow (L/s) Residua pressure (m head)
0
5
10
15
20
25
30
Reservoir storage available in zone (kL)
Notes:
(Water service providers add notes on any issues related to modelling assumptions, e.g. head loss coefficients, future Demand Management Areas/Pressure Management Areas, proposed augmentations or changes to network etc.)
Advice conditions
Include conditions relating to the advice, for example:
• The service provider cannot guarantee water pressures and flows in excess of its published service standards.
• The information provided is based on the best available information at the time of publication and is subject to variation over time.
• Network models are verified with limited data and conditions in the field may vary from modelling assumptions.
• Field investigations and inspections should be undertaken to satisfy the user that the data is suitable for its intended purpose. Users relying on hydraulic modelling information do so at their own risk.
- 94 -

Chapter 7 Options for service provision
1 Purpose
A range of options exist for the provision of water supply and sewerage services. These include non-asset, source substitution and infrastructure options. This chapter outlines a number of these options and highlights the need to explore a wide range of solutions that go beyond the traditional infrastructure approach.
2 Key principles
The objectives of a proposal to deliver an identified water supply or sewerage service should be clearly defined before evaluating options.
A range of options (non-asset, source substitution, new and replacement asset) should be examined in a holistic manner that considers water supply, sewerage and stormwater management as component parts of an integrated urban water management program.
Non-asset solutions should generally be considered preferentially. Traditional solutions involving new infrastructure construction may not always be the optimal solution for providing a service.
3 Why is this important?
Planners should consider a wider range of options for the provision of water or sewerage services for the following reasons:
There is a growing world-wide trend towards seeking alternative service provision options that are more environmentally friendly.
The community is keen to ensure an ecological sustainability approach and value for money for services.
There are limited traditional water resources to meet demands. It will ensure defined outcomes at the lowest social, environmental and financial costs. It will deliver an appropriate solution to a particular situation rather than a “one size fits
all” approach. It is likely to satisfy the aims of a wider range of stakeholders. Failure to consider a wider range of options may expose the service provider to criticism
from stakeholders.
4 When should options for service provision be considered?
Options for Service provision should be considered once the service needs and service objectives have been clearly defined. These objectives would relate to:
service requirements and standards regulatory compliance operational performance objectives social objectives environmental objectives financial objectives.
- 95 -

5 Key elements
The process for selecting the optimal strategy is illustrated in Figure 5.1.
FIGURE 5.1 – Selecting the optimal strategy for providing a service
5.1 Determine current performance It is essential that the planner clearly understands the performance of the existing infrastructure. This will require access to reliable information which should be readily available. If this information is not available a plan should be actioned to obtain reliable information. This issue is discussed in Chapter 2 – Knowledge management.
The planner will need to review such matters as:
actual service levels against service standards compliance with current and future regulatory requirements current and future service demands (refer to the section on demands and projections) achievement of stakeholder requirements operational performance costs of providing the existing service and the components of these costs performance in comparison to similar service providers (metric benchmarking) identifying in detail where the gaps exist between current performance and desired
service needs and objectives (short, medium and long term).
5.2 Shortlist potential options An iterative process for determining options may be necessary. All possible options should be identified for further evaluation.
The following tables indicate that a wide range of asset, non-asset solutions and a combination of asset and non-asset solutions, exist to deliver water supply and sewerage services. Planners should have an open mind in relation to potential solutions.
Determine Current Performance
Options for Service Provision
Shortlist Potential Options
Detailed Evaluation of Potential Options
Select the Optimal Strategy
DetermineService
Objectives
Identify Service Needs
Determine Scope of Planning
Identify Stakeholder
Requirements
Evaluate Current &
Future Demands
Identify Options for
Service Provision
Planning Report
Develop Implementation
Strategy
Analyse Options
- 96 -

5.3 Detailed evaluation of potential options Chapter 9 – Analysis of Options outlines methodologies for selecting the most appropriate strategies to achieve the desired outcomes. In evaluating options, consideration should be given to:
an integrated urban water management approach the need for more detailed studies, pilot studies etc. the technical feasibility of the options to deliver the defined service the skills and capabilities of the service provider to manage the proposed infrastructure potential social and environmental (including heritage) impacts potential for staging risks associated with the option, some of these risks are listed in Table 5.1 regulatory approvals lifecycle revenues and costs.
Options are likely to be a combination of non-asset, source substitution and infrastructure solutions.
There may be a number of constraints which impact on the technical, financial and environmental feasibility of an option. These constraints which may include the following should be identified and evaluated in relation to each option:
regulatory compliance with guidelines (e.g. Australian Drinking Water Guidelines) climatic geotechnical conditions heritage/native title issues topographical environmental.
Options should be evaluated and ranked according to a previously defined set of objectives and include a detailed assessment of constraints and implementation limitations.
The sizing of system components is summarised in Table 5.8 (Water Supply) and Table 5.15 (Sewerage).
TABLE 5.1 – Some potential risks to be considered in evaluating options for the provision of services
Risk Category Risk Commercial/Financial Demand
Erroneous capital and operational costs. Demand estimates and projections are over or under estimated. Out of sequence development
Climate Climate change Climate variability
Environmental Adverse environmental impacts short and long term Approval processes
Implementation Contractual risks Delays Latent conditions
- 97 -

Risk Category Risk Infrastructure Sub-optimal sizing of infrastructure
Sub-optimal timing of infrastructure Infrastructure failure Power supply failure Lightning strikes
Natural Disasters Impacts on infrastructure Impacts on construction
Organisational Service provider doesn’t have the skills/capabilities/resources to effectively operate and maintain the proposed infrastructure
Political Community perceptions and complaints in relation to: increased charges the service being delivered standards of service perceived public health risks location of infrastructure. Policy changes
Public Health Risks include: drinking water quality doesn’t meet Australian Drinking Water
Guidelines cross-connections between the drinking water system and
non-drinking water or wastewater systems exposure to aerosols contamination from wastewater or other sources.
Regulatory Non compliance Time to obtain approvals
Security Potential for sabotage or vandalism
Social Adverse community perception Community disruption Pressure groups Vandalism Lack of householder maintenance of on-site facilities Inadequate community education Inadequate community consultation Infrastructure failure impacts
Technical Topographic constraints Unforseen geotechnical problems
Technological Limited track record for system, process, equipment or materials Long term performance of infrastructure
5.3.1 Selection of the optimal strategy Refer to Chapter 9 – Analysis of Options.
- 98 -

5.4 Water supply options
5.4.1 Non asset solutions – water supply In many instances improved service delivery can be achieved through enhanced utilisation of existing infrastructure, demand management, source substitution, etc. Potential non-asset solutions are summarised in Table 5.2.
TABLE 5.2 – Non-asset options – water supply
Category Option
1.1.1.1 Service Delivery Impacts
Con
tinui
ty
of S
uppl
y
Qua
ntity
of
Sup
ply
Qua
lity
of
Supp
ly
Def
errin
g C
apita
l In
vest
men
t
Demand Management
User pays pricing Volumetric charging for wastewater Retrofitting water use devices Water use audits – internal and external Public education Business water use efficiency programs House “tune up” water conservation programs Sub-metering of building units Water restrictions Real time public tracking of progress
Reduction of water losses
Identification and reduction of NRW components Leakage management Meter audits/calibration
Pressure Management
Pressure management/pressure reduction
System Improvements
Enhance monitoring (e.g. telemetry or other alternatives) Treatment plant automation Mains cleaning Alternative service delivery (water tankering) Rezoning Improved responsiveness Training/skills development Investment in predictive/planned maintenance
Source Substitution
Rainwater harvesting, effluent reuse Diversion from sewer e.g. greywater, sewer mining
Land Use Planning
Increased residential density Catchment management and source water protection
Service Standards
Modify standards of service in consultation with customers. (Note Water Supply (Safety and Reliability) Act 2008 compliance in relation to SAMP/CSS)
- 99 -

5.4.2 Infrastructure options – water supply A range of infrastructure options exist for the provision of water supply services which can be implemented in conjunction with a range of non-asset solutions. These options are summarised in the following tables:
Table 5.3 Indicative Water Source and End Use Options Table 5.4 Applicability of Water Supply Infrastructure for Different Urban Areas Table 5.5 Typical Options Available to Provide a Water Supply Service Table 5.7 Overview of Applicability of Water Treatment Processes
These tables imply that:
Different types of infrastructure could be provided in various parts of an urban environment.
Not all the infrastructure would necessarily need to be supplied by the service provider. Some infrastructure may only be required seasonally (e.g. when a saline secondary
supply has to be utilised during the dry season). Different standards of water services and treatment levels could be provided for different
end uses.
Other valid options may also be appropriate.
For any water source end use option (Table 5.3), the water must be fit for the intended end use. The characteristics of specific sources will determine the level of treatment, monitoring and maintenance regime required for the proposed use. Consult Section 7 – Bibliography for specific guidance on water quality criteria for drinking and recycling purposes.
TABLE 5.3 – Indicative water source and end use options
End Use
Water Source
Surf
ace
Wat
er
Gro
und
Wat
er
Rai
nwat
er
Sea
wat
er
Rec
ycle
d W
ater
Aqu
ifer
Re-
Cha
rge
(Sto
rmw
ater
)
Aqu
ifer
Re-
Cha
rge
(Rec
ycle
d w
ater
)
Gre
ywat
er
Treatment (U=untreated/ T=treated)
U T# U T# U T# U T# U## T# U T# U T# U T#
Drinking* X 1 1 X X X X X X X X Hot water### X 1 1 X X X X X X X X Bath/Showers* X 1 1 X X X X X X X X Toilet flushing 1 1 X X 1 X X X Dishwashing* X 1 1 X X X X X X X X Laundry X 1 1 X X X X X X X X Garden Watering / irrigation 1 1 X X 1 X 2 2
Pools* X 1 1 1 X X X X X X X Car Washing 1 1 X X 1 X X X Industrial processes 1 1 X X 1 X X X Fire fighting 1 1 X ? ? X ? X X
- 100 -

Notes for Table 5.3
#T (treated) assumes that water is treated to a quality suitable for the proposed end use
## “Untreated recycled water” refers to secondary treated sewage effluent
###.Hot water: water temperature must comply with the requirements of AS/NZS 3500.4 (Applied Provisions under the Standard Plumbing and Drainage Regulation 2003), that is, must be stored at a minimum of 60oC and be delivered at the outlet of all sanitary fixtures at a temperature not exceeding 45oC for specified facilities for young, aged, sick or disabled persons or 50oC in all other buildings)
* Where a reticulated drinking water supply is provided, water used for drinking, food preparation, utensil washing, oral hygiene and bathing purposes should be of drinking water quality Appropriate (note that while option may be appropriate it may not be cost effective)
X Unsuitable
? Under consideration
1. Need to verify that untreated water is of a quality suitable for the intended end use
TABLE 5.4 – Applicability of water supply infrastructure for different urban areas
Settlement
Maj
or U
rban
>2
5,00
0 co
nnec
tions
Med
ium
Urb
an
1,00
0-25
,000
con
nect
ions
Smal
l Urb
an
100-
1,00
0 co
nnec
tions
V. S
mal
l Urb
an
<100
con
nect
ions
Rur
al R
esid
entia
l
Dis
pers
ed H
ousi
ng
(Loc
ality
)
Comments
Infrastructure
Water Source
off-site
on-site On-site sources could include rainwater tanks or bores.
Treatment
off-site X
on-site On-site rainwater treatment could be provided in all settlements.
mobile X X X Provides supplementary treatment when secondary sources are utilised (e.g. sea water desalination) during drought periods.
Pumping
off-site X
on-site On-site pumping required if rainwater supply
- 101 -

Storage
off-site X X
on-site Rainwater tanks
Mobile Supply
tankered X X Tankered water would be an emergency supply or supplementary source to rainwater.
bottled X X Includes delivery
- 102 -
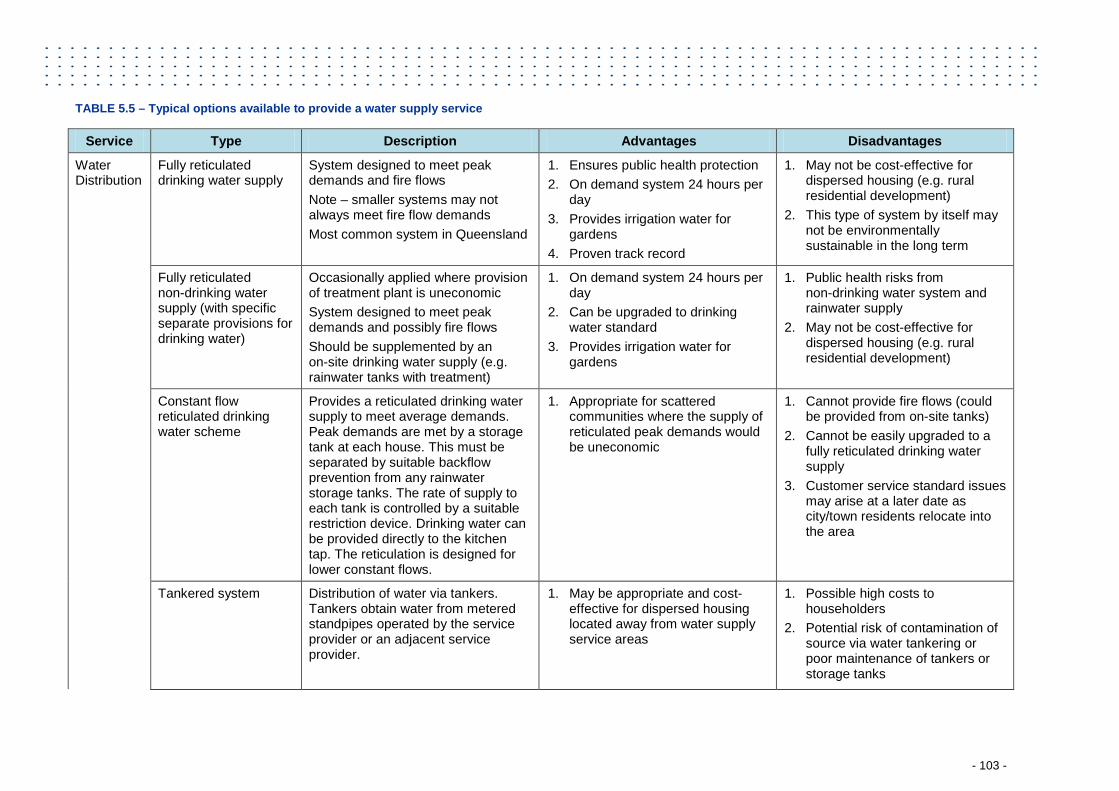
TABLE 5.5 – Typical options available to provide a water supply service
Service Type Description Advantages Disadvantages
Water Distribution
Fully reticulated drinking water supply
System designed to meet peak demands and fire flows Note – smaller systems may not always meet fire flow demands Most common system in Queensland
1. Ensures public health protection 2. On demand system 24 hours per
day 3. Provides irrigation water for
gardens 4. Proven track record
1. May not be cost-effective for dispersed housing (e.g. rural residential development)
2. This type of system by itself may not be environmentally sustainable in the long term
Fully reticulated non-drinking water supply (with specific separate provisions for drinking water)
Occasionally applied where provision of treatment plant is uneconomic System designed to meet peak demands and possibly fire flows Should be supplemented by an on-site drinking water supply (e.g. rainwater tanks with treatment)
1. On demand system 24 hours per day
2. Can be upgraded to drinking water standard
3. Provides irrigation water for gardens
1. Public health risks from non-drinking water system and rainwater supply
2. May not be cost-effective for dispersed housing (e.g. rural residential development)
Constant flow reticulated drinking water scheme
Provides a reticulated drinking water supply to meet average demands. Peak demands are met by a storage tank at each house. This must be separated by suitable backflow prevention from any rainwater storage tanks. The rate of supply to each tank is controlled by a suitable restriction device. Drinking water can be provided directly to the kitchen tap. The reticulation is designed for lower constant flows.
1. Appropriate for scattered communities where the supply of reticulated peak demands would be uneconomic
1. Cannot provide fire flows (could be provided from on-site tanks)
2. Cannot be easily upgraded to a fully reticulated drinking water supply
3. Customer service standard issues may arise at a later date as city/town residents relocate into the area
Tankered system Distribution of water via tankers. Tankers obtain water from metered standpipes operated by the service provider or an adjacent service provider.
1. May be appropriate and cost-effective for dispersed housing located away from water supply service areas
1. Possible high costs to householders
2. Potential risk of contamination of source via water tankering or poor maintenance of tankers or storage tanks
- 103 -

Service Type Description Advantages Disadvantages This would supplement existing on-site non-drinking water systems (rainwater tanks, bores, surface sources)
2. Householders take a more responsible attitude to water consumption
3. No cost to the service provider.
Dual reticulation Two parallel reticulated systems are provided. One system provides drinking water. The second system provides non-drinking water (e.g. untreated raw water or recycled water) for garden watering, toilet flushing and other external uses including parks, gardens and playing fields. Possibly the recycled water could be used for fire fighting
1. Increased use of recycled water 2. Reduced direct release of effluent
to waterways 3. Reduced overall drinking water
demand 4. Reduced peak drinking water
demand 5. Possible decrease in drinking
water pipe sizes 6. Recycled water may be a
potential source of water for fire fighting
7. More reliable local source of water for non-drinking uses
8. Potential to delay provision/expansion of major drinking water supply infrastructure (e.g. future dam, water treatment upgrades)
9. Potential lower tariff for recycled water use compared to drinking water
10. Potential relaxation of water restrictions
1. Higher level of treatment required to provide reclaimed water of required standard
2. Health risks (possible cross connection, public contact, pathogen transfer via aerosols)
3. Additional cost to householder due to additional plumbing requirements and on-going monitoring to ensure that no cross connection exists
4. Additional network for service provider to operate and maintain
5. Potential regulatory/legislative constraints
6. Public perception particularly in the early stages of the proposal
7. Need to develop a recycled water headworks charge
8. Potential for recycled water run-off
9. Need to gain acceptance of fire authorities and fire fighters
10. The need to develop a policy on recycled water use
11. Potential impact of recycled water salinity on gardens
- 104 -

Service Type Description Advantages Disadvantages
Rainwater tank (sole supply)
Collects rainfall run-off from roofs for water supply. Generally used for drinking and non-drinking purposes. May be supplemented by a bore or surface supply for non-drinking purposes supplemented by tankered water during low rainfall periods.
1. No cost to service provider 2. Householders take a more
responsible attitude to water consumption
3. Low water consumption
1. Failure of supply during low rainfall periods. Supplementary tankered water required
2. Area requirements for location of a tank, particularly on small lots
3. Associated costs to householders of supply installation, operation and maintenance of tanks and associated pumps and pipe work
4. Potential contamination of stored water (e.g. airborne contaminants, animal wastes etc.)
5. Potential public health issues (mosquito breeding)
6. Limited guidelines for rainwater tanks currently exist
7. Cost of ongoing Council monitoring of system
8. Noise from pumps
Rainwater tanks (supplementary supply)
Collects rainfall run-off for water supply and possibly stormwater attenuation. Rainwater could be used for all non-drinking water uses including toilet flushing, laundry and garden watering. Could be used as a back up for drinking.
1. Reduced demand for drinking water supply
2. Reduced stormwater run-off therefore reducing size of downstream stormwater infrastructure
1. Failure of supply during low rainfall periods. This would have to be supplemented by drinking supply (which could be also under stress) or tankered water
2. Area requirements for location of a tank, particularly on small lots
3. Associated costs to householders of supply installation, operation and maintenance of tanks and associated pumps and pipe work
4. Potential contamination of stored water (e.g. airborne contaminants, animal wastes etc.)
- 105 -

Service Type Description Advantages Disadvantages 5. Potential public health issues
(mosquito breeding) 6. Comprehensive guidelines for
rainwater tanks don’t currently exist
7. Ongoing Council monitoring of system
8. Issues in relation to responsibility (owner or service provider) for ongoing maintenance, particularly if tanks are mandatory
9. Noise from pumps
Drinking Water
Centralised water treatment
A range of water treatment processes exist. These are summarised in Table 5.7. The appropriate water treatment process will depend on: raw water characteristics and
variability; service standards (drinking water
quality); cost effectiveness of the process; operational capability of service
provider
1. This facility is critical to the maintenance of public health
2. Water quality to customers can be controlled by the service provider
3. Economies of scale 4. Plant managed by qualified
operation and maintenance staff 5. If particular customers require
further treatment this can be provided by a “point of use” system paid for by the customer
1. Water quality can decay due to characteristics of the reticulation system (e.g. condition, detention)
2. Some service providers may have difficulty attracting qualified staff to run facilities
Point of use water treatment
A range of small systems are available to enhance the water quality provided by the service provider. These systems include: Activated carbon and mechanical
filters Water softeners Iron removal equipment Neutralisers
1. May be an appropriate solution where the cost of centralised water treatment is prohibitive
2. The consumer has more control of water quality
3. No cost to the service provider
1. Each of the alternative systems has specific applications and some limitations
2. Consumers may not properly maintain the systems and would result in water quality deterioration and potential public health concerns
- 106 -

Service Type Description Advantages Disadvantages Reverse osmosis 3. Not all consumers will select the
most appropriate system 4. Total cost of service will be
increased to consumers 5. The homeowner may have to be
trained in system selection, operation and maintenance
Bottled Water Bottled water is increasingly being used as an alternative to tap water. Bottled water quality is covered by the Australia New Zealand Food Standard Code Standard 1.6.1 Microbiological Standards for Food and Standard 2.6.2: Non-Alcoholic Beverages and Brewed Soft Drinks
1. May be an appropriate solution where the cost of centralised water treatment is prohibitive
2. Possible opportunities for bulk purchase cost reduction
1. The cost/litre of bottled water is over a 1000 times that of tap water
2. The service provider may need to organise contracts for the supply of bottled water
3. The service provider may have to organise/manage the distribution of bottled water
4. Environmental impacts if containers not recycled
Note: Some of the information in this table has been adapted from: Pimpama Coomera Water Futures – Master Plan Options Report, Gold Coast Water, July 2003 Affordable Water Supply & Sewerage for Small Communities, WSAA, 1999
- 107 -

5.4.3 Drinking Water Quality The Australian Drinking Water Guidelines (NHMRC/NRMMC 2004) are adopted as the basis of drinking water quality in Queensland. These guidelines define drinking water as “water intended primarily for human consumption either directly, as supplied from the tap, or indirectly in beverages, ice or foods prepared with water. Drinking water is also used for other domestic purposes such as bathing and showering”. These criteria apply to water as delivered to the consumer and the water utility should be operated accordingly.
Where there is a reticulated drinking water supply, water of drinking water quality should be used for human consumption, food preparation, utensil washing, oral hygiene and bathing (AS/NZS 3500, AS/NZS 4020, WSAA, 2002, Water Supply Code of Australia).
The Framework for Management of Drinking Water Quality outlined in the Guidelines provides a preventive risk management approach which is comprehensive from catchment to consumer.
As a minimum standard, the quality of the water must not impair human health. It is also important to consider other characteristics, including the water’s palatability and its aesthetic quality. Drinking water should be clear, colourless, adequately aerated, have no discernible taste or odour and be pleasant to drink. It should be free from suspended matter or turbidity, pathogenic organisms and harmful chemical substances.
Where necessary water should be treated to minimise corrosion of pipes, fittings and structures or scaling and staining of pipes and fixtures.
Where the water does not meet the requirements of the Australian Drinking Water Guidelines and the service provider determines that the cost of further treatment exceeds the benefit, the community should be involved in setting the levels of service for characteristics not directly related to health. An informed community could agree to accept levels in excess of the Australian Drinking Water Guidelines. However the Australian Drinking Water Guidelines values for characteristics of direct health significance should not be exceeded and the process of community consultation should not be seen as a licence to simply degrade the quality of a water supply.
- 108 -

TABLE 5.7 – Overview of applicability of water treatment processes
Process
Cat
chm
ent
Man
agem
ent
Raw
Wat
er
Stor
age
Des
trat
ifica
tion
Scre
enin
g
Mic
ro s
trai
ners
Pre-
chlo
rinat
ion
Aer
atio
n an
d St
rippi
ng
Coa
gula
tion,
Se
dim
enta
tion
or
DA
F
Prec
oat F
iltra
tion
Dire
ct F
iltra
tion
Lim
e So
fteni
ng
Ozo
ne/B
AC
Che
mic
al
Oxi
datio
n
Dis
infe
ctio
n
Mic
rofil
trat
ion
Ultr
afilt
ratio
n
Nan
ofilt
ratio
n
Rev
erse
Osm
osis
Elec
trod
ialy
sis/
El
ectr
odia
lysi
s R
ever
sal
Ion
Exch
ange
Act
ivat
ed C
arbo
n
Act
ivat
ed A
lum
ina
Characteristic
Debris Algae Blue-green algae Turbidity Colour Taste and Odour Hardness TDS Chloride Sulphate Iron Manganese Heavy metals Nitrate Fluoride Organic contaminants
volatile synthetic
Pesticides/Herbicides Dissolved organic carbon Radionuclides Viruses Bacteria Protozoa Adapted from: Water Quality & Treatment – A Handbook of Community Water Supply, American Water Works Association 1999
- 109 -

5.4.4 Infrastructure sizing – water supply This section should in read in conjunction with the following chapters:
Chapter 5 – Demand/Flow and Projections; and Chapter 6 - Network Modelling.
Table 5.8 provides a summary of water supply system component sizing. These are generally based on parameters adopted in the previous State guidelines. Service providers can develop modified sizing guidance based on the performance and characteristics of their existing systems.
Where a dual reticulation system or other alternative means of service delivery is proposed then the applicability of the component sizing should be re-evaluated. In particular, for reticulation systems the source of water for firefighting should be determined and the sizing of components for the other system re-evaluated. In dual reticulation systems care should be taken not to apply traditional sizing criteria without considering the water quality issues that may arise from installation of oversized components.
The planner should undertake a risk assessment in determining:
the level of pump stand-by capacity reservoir emergency storage/fire fighting reserve.
Factors to be considered in the risk assessment are listed in Table 5.9.
TABLE 5.8 – Sizing of water supply system components
Component Sizing Comments
Surface water source
Historical no failure yield Refer to Principles for Surface Source Yield Determination (page 17)
Groundwater source
Long term safe yield of bore/bores
Based on drawdown tests
Raw water pumps MDMM over 20 hours or long term safe yield of bores
The period of operation can be confirmed/amended through modelling and risk assessment
Raw water mains MDMM (gravity supply) MDMM over 20 hours (pumped supply)
Max velocity 2.5m/s The period of operation can be confirmed/amended through modelling and risk assessment
Treatment Plant Delivery flow rate from source (over 20 hours)
The period of operation can be confirmed/amended through modelling and risk assessment
Treated water pumps feeding a ground level reservoir
MDMM over 20 hours The period of operation can be confirmed/amended through modelling and risk assessment
- 110 -

Component Sizing Comments
Treated water pumps feeding an elevated reservoir
Capacity (L/s) = 6PH – reservoir operating volume 6 x 3600 Volume in litres
Trunk mains feeding ground level reservoir
MDMM (gravity) MDMM over 20 hours (pumped supply)
Trunk mains feeding elevated reservoir
Capacity of treated water pumps
Reservoirs (ground level)
3 (PD-MDMM) + (greater of Emergency Storage/Firefighting Storage)
This sizing relates to operating level. Emergency storage subject to risk assessment by service provider. Firefighting storage would need to be incorporated for smaller reservoirs.
Elevated reservoir 6 (PH – MDMM) 12 + firefighting reserve
A firefighting reserve should be determined through network modelling and subject to risk assessment by the service provider Based on the proven capability of variable speed pumps and pressure cells, elevated reservoirs may not be economically viable. The planner should determine the optimal combination of inflow/storage and capacity/demand based on lifecycle cost analysis. The frequency/duration of power failures should also be considered.
Trunk reticulation mains
PH Max velocity 2.5m/s For smaller schemes the trunk mains may have to be sized to accommodate fireflow.
Reticulation mains PH + fireflow Max velocity 2.5m/s @ PH
Reticulation booster pump station
PH + fireflow
Pumped System Peak instantaneous flow + fireflow
This situation may exist in smaller systems if variable speed pumps would replace any elevated storage. In these instances it would be necessary to calculate instantaneous flow based on concurrent demand. This would exceed PH by a significant margin.
- 111 -

Component Sizing Comments
Standby pumps Standby pump capacity to match the largest single unit pump capacity
Constant flow system
AD for all system components Typical on-site storage = 22.5kL
Fire fighting requirements to be determined in consultation with Local Fire Service
Dual reticulation system
System components generally sized as for conventional system
There may be a need to re-evaluate sizing of some components where alternative systems are proposed.
TABLE 5.9 – Risk assessment consideration – water supply
Factor Pump or Equipment Standby Capacity
Reservoir Emergency/
Firefighting Reserve Asset criticality (likelihood and consequence of failure)
Availability of alternative supply (e.g. standby generation equipment)
Level of maintenance
Water quality impacts (e.g. detention time)
Reservoir storage capacity versus pump station or supply capacity
Site aspects (space limitations)
Operational requirements Principles for surface source yield determination
The historical simulation modelling methodology should be adopted for calculation of yields.
Theoretical yield calculations should utilise a simulation from 1900 or earlier to the present, where sufficient rainfall data is available.
The minimum storage level should be determined and revised at appropriate intervals. The volume below the minimum storage level should not be included in the storage volume for theoretical yield calculation.
The environmental flow requirements determined under the State Government’s Water Resource Planning process are to be incorporated into the theoretical yield calculations for storages/systems.
The theoretical yield of all storages/systems should target the Historic No Failure Yield (HNFY) for both monthly and annual measures.
- 112 -

A contingency storage volume should be determined based on a detailed assessment of the risks associated with inaccuracies in the modelling and the risk of experiencing a worse drought than that which is historically recorded.
Management strategies such as demand management, drought management, imposition of restrictions, multi-source management may serve to increase the managed yield of a source/system.
It would be desirable for service providers to re-evaluate yields of existing storages and the sensitivity of these yields to any land use or climatic changes.
Adapted from:
Queensland Government and SEQROC, Determination of Source Water Availability in South East Queensland – Discussion Paper (draft), May 2004.
Independent Pricing and Regulatory Tribunal of New South Wales (IPART), Review of the Performance Criteria in Sydney Catchment Authority’s Operating Licence, July 2003.
5.5 Sewerage options
5.5.1 Non-asset solutions – sewerage Table 5.10 summarises potential non-asset solutions that can contribute to the provision of sewerage services.
TABLE 5.10 – Non-asset solutions
Category 1.1.1.2 Option
Impacts
Was
tew
ater
Q
uant
ity
Was
tew
ater
R
elea
se (w
et
& d
ry w
eath
er)
Bre
aks/
C
hoke
s
Odo
urs
Trea
tmen
t Pl
ant L
oadi
ng
Efflu
ent
Qua
lity
Water Demand Management
Refer to Table 5.2
Trade Waste Management
Policy Implementation Pre-treatment Cleaner production Education
Infiltration/Inflow Management
Infiltration/inflow reduction
System Improvements
Enhance monitoring (e.g. telemetry)
Treatment plant automation
Improved responsiveness
Training/skills development
Investment in predictive / planned maintenance
- 113 -

Category 1.1.1.2 Option
Impacts
Was
tew
ater
Q
uant
ity
Was
tew
ater
R
elea
se (w
et
& d
ry w
eath
er)
Bre
aks/
C
hoke
s
Odo
urs
Trea
tmen
t Pl
ant L
oadi
ng
Efflu
ent
Qua
lity
Flow balancing
Pump station scheduling
Improve the performance of existing on-site systems
Standby generators
Septicity control
Storage
5.5.2 Infrastructure options – sewerage Table 5.13 provides an overview of the various sewage collection options available. These could be combined with centralized or localised treatment facilities or with sewer mining facilities. Various on-site sewerage management systems are also available.
Figure 5.2 provides a generalised overview of potential wastewater treatment options. Table 5.11 provides a Treatment Process Summary.
Preliminary treatment involves the removal of large objects (e.g. plastics) through screening. Smaller particles (e.g. sand) are removed in grit removal units.
Primary treatment involves solids settlement and the removal of grease and scum.
Secondary treatment uses micro-organisms to break down and remove remaining dissolved wastes and fine particles. Micro-organisms and wastes are incorporated in the sludge.
Nutrient reduction removes nitrogen and phosphorus nutrients that could cause algal blooms in waterways and threaten aquatic life. Nutrient reduction is not available at all sewage treatment plants because it requires expensive specialised equipment. It is becoming more common in Queensland. Operational enhancements can provide some nutrient reduction.
Disinfection reduces disease-causing micro-organisms.
- 114 -

TABLE 5.11 - Treatment process summary – wastewater treatment and recycling
(adapted from Table 4.2 Metcalf and Eddy, 3rd edition)
Contaminant Unit operation / unit process Suspended solids Screening and comminution
Grit removal Sedimentation Filtration (granular medium, membrane) Flotation Chemical polymer addition Coagulation/sedimentation Natural systems (land treatment, wetlands)
Biodegradable organics
Attached growth systems o Trickling filters o Rotating contact filters
Suspended growth systems o Activated sludge variations
Lagoon variations Physical/chemical systems (coagulation; chemical
precipitation) Membrane bioreactors Natural systems
Volatile organics Air stripping Off gas treatment Carbon adsorption
Pathogens Disinfection o Chlorination o Chlorine dioxide o UV radiation o Ozonation
Lagoons Natural systems Membrane systems Primary and secondary processes
Nitrogen Suspended growth nitrification and denitrification variations Fixed growth nitrification and denitrification variations Ammonia stripping Ion exchange Breakpoint chlorination Lagoons Natural systems
- 115 -
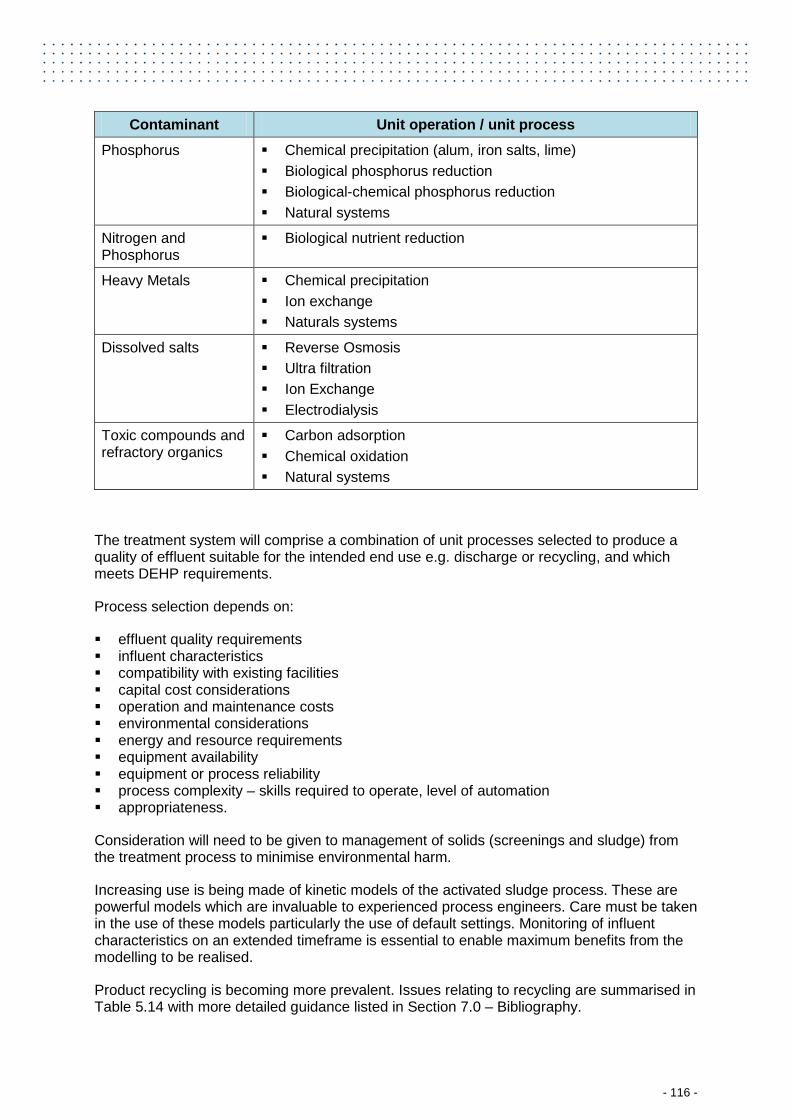
Contaminant Unit operation / unit process Phosphorus Chemical precipitation (alum, iron salts, lime)
Biological phosphorus reduction Biological-chemical phosphorus reduction Natural systems
Nitrogen and Phosphorus
Biological nutrient reduction
Heavy Metals Chemical precipitation Ion exchange Naturals systems
Dissolved salts Reverse Osmosis Ultra filtration Ion Exchange Electrodialysis
Toxic compounds and refractory organics
Carbon adsorption Chemical oxidation Natural systems
The treatment system will comprise a combination of unit processes selected to produce a quality of effluent suitable for the intended end use e.g. discharge or recycling, and which meets DEHP requirements.
Process selection depends on:
effluent quality requirements influent characteristics compatibility with existing facilities capital cost considerations operation and maintenance costs environmental considerations energy and resource requirements equipment availability equipment or process reliability process complexity – skills required to operate, level of automation appropriateness.
Consideration will need to be given to management of solids (screenings and sludge) from the treatment process to minimise environmental harm.
Increasing use is being made of kinetic models of the activated sludge process. These are powerful models which are invaluable to experienced process engineers. Care must be taken in the use of these models particularly the use of default settings. Monitoring of influent characteristics on an extended timeframe is essential to enable maximum benefits from the modelling to be realised.
Product recycling is becoming more prevalent. Issues relating to recycling are summarised in Table 5.14 with more detailed guidance listed in Section 7.0 – Bibliography.
- 116 -

5.5.3 Sewage quality Monitoring of sewage characteristics should be undertaken on an extended timeframe. This is essential where kinetic modelling of the sewage treatment process is to be undertaken. Typical composition of domestic sewage is listed in Table 5.12. The variations would be due to internal water usage, infiltration/inflow and trade waste loadings.
TABLE 5.12 – Typical composition of domestic sewage
Constituent Unit Municipal1 Resort2,3
pH value 6.5-8 6-8
Electrical Conductivity1 μS/cm 700-900 700
Total Dissolved Salts1 mg/L 500-650 500
Suspended Solids mg/L 140-410 400
BOD5 mg/L 140-480 450
Total Organic Carbon mg/L 160-250 -
Ammonia Nitrogen (as N) mg/L 20-60 60
Orthophosphate (as P) mg/L 6-10 10
Total Phosphorus (as P) mg/L 6-30
Total Sulphide mg/L 5-15 5
Hydrogen Sulphide mg/L 1-5 1
Alkalinity1 mg/L 50-300
Total Oil and Grease mg/L 10-100
1 Concentration will depend on water supply characteristics, level of infiltration of saline groundwater and trade waste characteristics. 2 Data provided by Simmonds & Bristow. 3 Self contained resorts (e.g. island resorts) with laundry facilities etc. would also have a higher flow rate per EP.
- 117 -

TABLE 5.13 – Typical options available to provide a sewerage service
Service Type Description Advantages Disadvantages Collection System
Conventional Gravity System
Wastewater is collected through gravity sewers, which grade downhill. Manholes (or maintenance shafts) are provided at intervals and change of direction to provide maintenance access points. Pump stations may be provided to pump wastewater into another sub-catchment, catchment or treatment plant. This is the most common form of wastewater collection system in Queensland.
1. Extensive experience of this type of system in Queensland.
2. Provides a reliable and cost-effective means of collecting wastewater.
3. Designed to meet a designed wet weather flow.
1. Can be susceptible to infiltration/inflow from both service provider infrastructure and customer sewerage pipework.
2. Is susceptible to tree root intrusion causing blockages.
3. May require deep and expensive excavation in flat areas (or alternatively a number of pump stations).
4. May need to be constructed below the water table or in rock which will add significantly to costs.
5. Potential for odours where long detention times exist.
6. Potential operational problems if greywater re-use is implemented.
Smart Sewers Smart Sewers are systems designed to modified design criteria compared with existing ‘traditional’ reticulated gravity wastewater systems. The main features of the modified criteria include: reduced peak wet weather
flow allowance
1. Reduced capital cost for system construction.
2. Reduced O&M costs. 3. Less infiltration/inflow. 4. Less corrosion. 5. Longer useful life. 6. Less obtrusive system. 7. Less capacity for illegal
1. No comprehensive design guidelines exist.
2. Requires paradigm shift in industry.
3. Increased supervision and quality control costs.
4. House drains may continue to be a source of
- 118 -

Service Type Description Advantages Disadvantages the use of modern pipe
materials provision of smaller and less
frequent access structures replacement of access
chambers with non-accessible inspection openings
The concept of ‘smart’ sewers takes advantage of modern materials and design and construction approaches to produce a lower cost collection system without any loss in the quality of service to customers.
connections. infiltration/inflow. 5. Detailed documentation
and/or above ground markers required to provide on-going access to inspection points.
Modified Conventional Sewerage with Lift Pumping (MCS)
Similar to conventional gravity system except that extensive use is made of access chamber lift pumping to reduce trench excavation. Access chambers are replaced with small diameter flushing and rodding points. Able to use smaller diameter sewer reticulation mains and adopt flatter grades.
1. More cost-effective for smaller communities.
2. May be appropriate for areas with high excavation costs (e.g. rock or high groundwater levels).
1. May have slightly reduced service levels (e.g. sewer blockages, possibly more frequent wet weather overflows).
2. May generate more greenhouse gases.
3. May generate odours through longer detention times.
Vacuum Sewerage (VS)
Small diameter shallow collection system that is maintained under negative pressure using a number of centralised vacuum pumping stations. Groups of 6-8 houses drain to a single pit incorporating
1. Appropriate for areas with high excavation costs (e.g. rock or high groundwater levels).
2. Appropriate where terrain is flat and low-lying.
1. Each house must be drained to a communal pit.
2. Relatively high energy user. 3. May generate more
greenhouse gases. 4. Possible need for an access
- 119 -

Service Type Description Advantages Disadvantages a vacuum valve to control wastewater flow into the pipeline. At a predetermined level the valve in the pit opens and wastewater is “sucked” into the pipeline system to a central vacuum/pumping station. The collection radius for the pump station is in the order of 2km.
3. Lower infiltration/inflow (but still potential in upstream gravity pipework).
4. Central vacuum/pumping station rather than a number of stations as for a conventional system.
5. Less odour potential.
easement to facilitate maintenance of collection pits.
Common Effluent Drainage scheme (CED)
This involves treatment of wastewater on-site by means of septic tanks with effluent transported off-site for further treatment. On-site treatment reduces solids and the pipework can be laid at a shallower grade. The effluent tends to be more septic. Appropriate where: existing septic tanks are in
good condition low housing density with little
growth anticipated; relatively flat terrain; rock is at shallow depths;
and where cluster development
in rural areas exist, particularly where soils are not suitable for on-site sewerage systems.
1. Reduced costs for sewer reticulation in flat terrain or where rock exists at shallow depths.
2. Sewer gradients can be reduced, most manholes eliminated and inspection openings provided.
3. Lower maintenance costs due to fewer sewer and pump blockages.
4. Suitable for schemes not provided with a reticulated water supply.
1. Septic tanks on premises may require desludging every 2 years.
2. Alterations to house drainage may make connection costs more expensive.
3. May prevent economic upgrading to conventional sewerage at a later date.
4. When individual householder costs (eg septic tank capital and operation costs) are included with service provider costs, this option may not be significantly cheaper than a conventional sewerage scheme.
5. Requires maintenance to be undertaken by householder.
- 120 -

Service Type Description Advantages Disadvantages
Variable Grade Sewerage (VGS)
Similar to CED but it permits the collecting sewers to be laid at inflective grades (i.e. with a series of low points) with a net fall from inlet to outlet.
As for CED As for CED
Septic Tank Effluent Pumping (STEP)
This is similar to a CED system except that the septic effluent flows to a storage tank with a pump. It is then pumped to the treatment plant. The storage tank can serve individual houses or a group of 2-4 houses. Septic tanks should be desludged every 2 years. May be appropriate for small communities <500 persons.
1. Reduced capital costs where rock exists at shallow depths.
2. Reduced infiltration/inflow.
1. As for CED. 2. Householder energy costs
will increase. 3. Possible problems of solids
carryover into the pressure main
4. Householders may install facilities (e.g. pumps) for which system is not designed – problem if common pumping main
5. May generate more greenhouse gases.
6. Requires ongoing service provider monitoring of householder system.
Pressure Sewerage Collection System
Each property is provided with an in-ground tank. A grinder pump in the tank discharges wastewater from the property by a small diameter polyethylene pipeline to a common pressure sewer in the street. The pressure sewer discharges to either a gravity sewer, pumping station or directly to a treatment
1. Appropriate in situations where groundwater level is high, land is flood prone or is rocky and steep.
2. Appropriate to waterfront areas where overflows from conventional systems may cause environmental harm.
3. An alternative where it is impractical to install a
1. Limited experience of technology by Service providers.
2. Householder energy costs will increase.
3. Potential for odours if long detention times in tank.
4. Requires a greater level of customer cooperation to protect pumps from blockage
- 121 -

Service Type Description Advantages Disadvantages plant. System introduced to Australia in late 1990’s after 30 years experience in the US and Europe.
conventional system. 4. Can be a cost-effective
alternative through the elimination of pump stations, deep excavation.
5. Potential lower householder connection costs.
6. Reduced infiltration/inflow. 7. Less construction disruption
due to shallow trenching.
and premature wear. 5. Requires ongoing service
provider monitoring of system
6. May generate more greenhouse gases.
Wastewater Treatment
Centralised Wastewater Treatment
A range of wastewater processes exist. These are summarised in Figure 5.2. The appropriate wastewater treatment process will depend on: current and anticipated DEHP licence conditions and development approvals the appropriateness of the
process to the service provider’s resources, skills and operational capability; and
cost-effectiveness of the process
1. Effluent quality can be controlled by the service provider.
2. Economies of scale. 3. The plant is managed by
qualified operation and maintenance staff.
1. Provides a point source of pollution.
2. Location may not be optimal to facilitate effluent re-use.
3. Long wastewater detention time in collection system may cause odour and corrosion problems.
4. Buffer distance may limit surrounding development.
Localised Wastewater Treatment
Provides localised communal wastewater treatment facilities with local reuse. Treatment of wastewater from a small group of lots with local
1. Flexibility to handle dispersed development.
2. Potentially easier environmental approvals
1. Community objection. 2. Difficult to find suitable plant
locations. 3. Potentially more difficult to
- 122 -

Service Type Description Advantages Disadvantages discharge or reuse of effluent would reduce transportation infrastructure and costs.
because of small scale. 3. Close to reuse application. 4. Lower conveyance costs. 5. Less odour and corrosion in
wastewater system. 6. Less greenhouse emissions.
obtain environmental approvals because of large number of affected sites.
4. Diseconomies of scale in relation to capital and operational costs.
5. More operational risk. 6. More skilled resources
required. 7. Higher administration costs. 8. Ownership/operational
issues.
Sewer Mining (also termed Water Mining)
Provision of small-scale treatment facilities close to centres of reuse demand to supply recycled water as required. The idea of sewer (or water) mining is that wastewater is drawn from the wastewater system as required and treated, and the residuals from the treatment processes returned to the sewer. The benefit of sewer mining is that it produces recycled water at the point of use, reducing the transportation requirements for treated water.
1. Produces recycled water close to point of use.
2. Reduces infrastructure required to transport treated water.
3. Reduces system costs. 4. By returning residuals to
sewer it simplifies the processes and costs at the plant.
1. Requires multiple treatment facilities
2. Potential community objection to number of plants and proximity to development.
3. Difficult to find suitable sewer mining plant locations.
4. Potentially more difficult to obtain environmental approvals because of number of affected sites.
5. Diseconomies of scale in relation to capital and operational costs.
6. More operational risk. 7. More skilled resources
required.
- 123 -

Service Type Description Advantages Disadvantages 8. Downstream sewers require
a steeper minimum gradient to be self-cleaning (higher viscosity of sewage due to high solids concentration).
On-site Sewerage Management Systems (OSMS)
On-site Systems (household)
This includes the settlement and/or flotation in a septic tank, prior to effluent discharge to either a secondary treatment process or land application system. Secondary systems include aerated wastewater treatment systems, sand filters, constructed wetlands. Wet composting toilets are another treatment option. Land application includes modified trench systems, evapo-transpiration beds, mounds, surface and sub surface drip irrigation systems and surface spray systems. Appropriate where sufficient land area is provided.
1. Appropriate for rural properties with sufficient land area.
2. Low cost. 3. Allows beneficial reuse
on-site. 4. All waste is contained within
the allotment.
1. Likelihood of failure due to poor design including siting and sizing and inadequate operation and maintenance.
2. Potential public health and environmental risks from poorly performing systems.
3. Environmental impacts from the cumulative impacts of on-site plants.
4. Monitoring required by Council.
5. Reliance on householder for running and maintaining the system.
On-site systems (trade waste pre-treatment facilities)
Treatment ranges from simple grease arrestors to packaged treatment plants to treat various trade wastes. These are provided by the trade waste generator to comply with a service provider’s trade waste policy or to reduce trade waste
1. Reduces load on the sewerage system.
2. Reduced probability of treatment plant (service provider’s) shock loading.
3. Provides opportunities for local re-use.
4. Reduced capital and
1. Diseconomies of scale (for generator).
2. Some trade waste may be beneficial to treatment processes (e.g. BNR).
3. May require trade waste generator to have in house treatment skills (unless
- 124 -

Service Type Description Advantages Disadvantages charges. May be accompanied by recycling of effluent.
operational cost for sewerage system.
contracted out).
Waterless Composting Toilets
Composting toilets are an alternative to conventional flush toilets. Composting toilets receive toilet waste only (faeces, urine and paper) and generally have no flushing mechanism. Waste is allowed to compost naturally over time and is periodically removed for disposal as a fertiliser/soil improver. A separate system is required for collection and treatment of greywater, i.e. wastewater from kitchen, bathroom and laundry. This would reduce the amount of water used as wastewater discharged to a centralised system, potentially reducing the size of the systems.
1. Provide human waste disposal systems that do not use water, chemicals or heat and have no polluting discharge.
2. Reduced water demand. 3. Reduced wastewater flows. 4. Reduced infrastructure costs
for water supply and wastewater disposal.
5. System managed on-site. 6. Decreased Operation and
Maintenance costs for centralised services.
7. All waste contained within allotment.
1. Social acceptance. 2. Limited track record in urban
development. 3. Paradigm shift required. 4. Not permitted in sewered
areas. 5. Potential odour problems in
operation. 6. Potential health and safety
concerns, especially associated with disposal of compost.
7. Potential environmental concerns associated with disposal of compost.
8. Reliance on householder for operation and maintenance of system.
Partial On-site System
Greywater Re-use
Use of greywater from on-site systems for some household reuse applications (e.g. watering lawns and gardens) Greywater is wastewater, excluding toilet and possibly kitchen wastes, i.e. mainly bathroom and laundry wastewater.
1. Reduced demand on water supply systems.
2. Reduced load on wastewater system (septic or collection system).
3. Potential wastewater system size reductions.
4. Allows beneficial reuse on-site.
1. Requires separate wastewater and blackwater collection and handling systems.
2. Requires additional storage capacity.
3. Additional cost to householder to install household greywater
- 125 -

Service Type Description Advantages Disadvantages This has the potential to reduce demand on the drinking water supply and reduce flows to the wastewater system.
collection and reuse system. 4. Operation and maintenance
cost to householder to run the system.
5. Current regulations may not allow greywater reuse.
6. Potential odour problems in operation.
7. Potential health and safety concerns, especially associated with irrigation of untreated greywater.
8. Potential environmental concerns associated with greywater irrigation.
9. Reliance on householder for operation and maintenance of system.
10. Higher strength wastewater collection system may cause odour and corrosion problems.
Note:
The information in this table has been adapted from:
Pimpama Coomera Water Futures – Master Plan Options Report, Gold Coast Water, July 2003 Affordable Water Supply and Sewerage for Small Communities, WSAA, 1999 Comparison of Alternative Sewerage Systems, Shoalhaven Water
- 126 -

TABLE 5.14 - Product recycling
Product Description Advantages Disadvantages Effluent This involves recycling effluent for
either: Urban/residential recycling Agricultural use Industrial applications
The level of treatment will vary for different purposes. Effluent is classified (A+ to D) for different uses. Refer to relevant references in Section 7.0 – Bibliography.
1. Provides positive benefits in the areas of water conservation and environmental improvements.
2. Improved management of a scarce source.
1. Potential public health, environmental and legal risks
2. Without effective planning and management, some recycling schemes may not be environmentally, socially or financially sustainable.
3. Public is yet to fully accept effluent recycling.
Biosolids This involves beneficially reusing biosolids for: Agriculture; and Horticulture
Biosolids are graded for different uses.
1. Potential resource which provides organic matter, nutrients, trace elements and moisture to land with subsequent improvements in soil structure and fertility.
2. Reduced volume of waste transferred to landfill.
1. Potential public health, environmental and legal risks.
2. Without effective planning some recycling schemes may not be environmentally, socially or financially sustainable.
3. Potential land contamination.
- 127 -
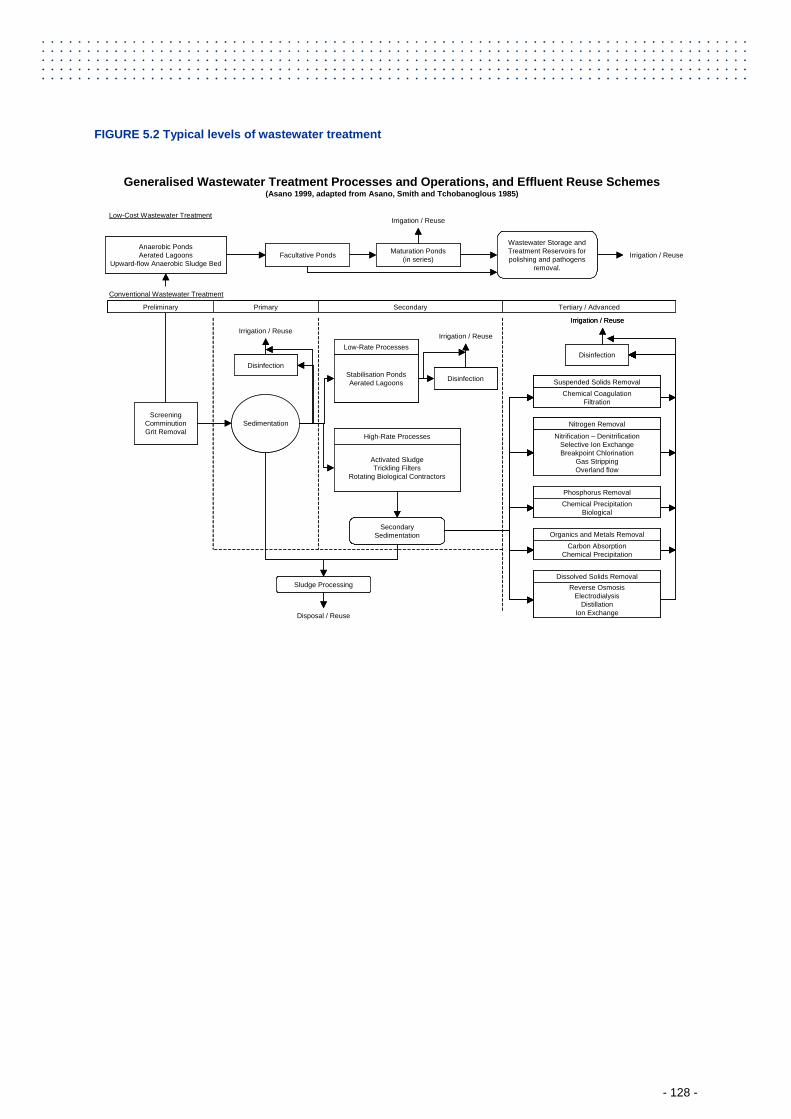
FIGURE 5.2 Typical levels of wastewater treatment
Generalised Wastewater Treatment Processes and Operations, and Effluent Reuse Schemes (Asano 1999, adapted from Asano, Smith and Tchobanoglous 1985)
Anaerobic PondsAerated Lagoons
Upward-flow Anaerobic Sludge BedFacultative Ponds Maturation Ponds
(in series)
Wastewater Storage and Treatment Reservoirs for polishing and pathogens
removal.
Irrigation / Reuse
Low-Cost Wastewater TreatmentIrrigation / Reuse
Screening Comminution Grit Removal
Conventional Wastewater Treatment
Preliminary Primary Secondary Tertiary / Advanced
Irrigation / Reuse
Disinfection
Sedimentation
Low-Rate Processes
Stabilisation Ponds Aerated Lagoons
High-Rate Processes
Activated SludgeTrickling Filters
Rotating Biological Contractors
Secondary Sedimentation
Sludge Processing
Disposal / Reuse
Irrigation / Reuse
Disinfection
Disinfection
Suspended Solids RemovalChemical Coagulation
Filtration
Nitrogen Removal
Nitrification – DenitrificationSelective Ion ExchangeBreakpoint Chlorination
Gas StrippingOverland flow
Phosphorus RemovalChemical Precipitation
Biological
Organics and Metals RemovalCarbon Absorption
Chemical Precipitation
Dissolved Solids RemovalReverse Osmosis
ElectrodialysisDistillation
Ion Exchange
Irrigation / Reuse
Generalised Wastewater Treatment Processes and Operations, and Effluent Reuse Schemes (Asano 1999, adapted from Asano, Smith and Tchobanoglous 1985)
Anaerobic PondsAerated Lagoons
Upward-flow Anaerobic Sludge BedFacultative Ponds Maturation Ponds
(in series)
Wastewater Storage and Treatment Reservoirs for polishing and pathogens
removal.
Irrigation / Reuse
Low-Cost Wastewater TreatmentIrrigation / Reuse
Screening Comminution Grit Removal
Conventional Wastewater Treatment
Preliminary Primary Secondary Tertiary / AdvancedPreliminary Primary Secondary Tertiary / Advanced
Irrigation / Reuse
Disinfection
Sedimentation
Low-Rate Processes
Stabilisation Ponds Aerated Lagoons
Low-Rate Processes
Stabilisation Ponds Aerated Lagoons
High-Rate Processes
Activated SludgeTrickling Filters
Rotating Biological Contractors
High-Rate Processes
Activated SludgeTrickling Filters
Rotating Biological Contractors
Secondary Sedimentation
Sludge Processing
Disposal / Reuse
Irrigation / Reuse
Disinfection
Disinfection
Suspended Solids RemovalChemical Coagulation
Filtration
Suspended Solids RemovalChemical Coagulation
Filtration
Nitrogen Removal
Nitrification – DenitrificationSelective Ion ExchangeBreakpoint Chlorination
Gas StrippingOverland flow
Nitrogen Removal
Nitrification – DenitrificationSelective Ion ExchangeBreakpoint Chlorination
Gas StrippingOverland flow
Phosphorus RemovalChemical Precipitation
Biological
Phosphorus RemovalChemical Precipitation
Biological
Organics and Metals RemovalCarbon Absorption
Chemical Precipitation
Organics and Metals RemovalCarbon Absorption
Chemical Precipitation
Dissolved Solids RemovalReverse Osmosis
ElectrodialysisDistillation
Ion Exchange
Dissolved Solids RemovalReverse Osmosis
ElectrodialysisDistillation
Ion Exchange
Irrigation / Reuse
- 128 -

5.5.4 Infrastructure sizing – sewerage This section should be read in conjunction with the following chapters:
Chapter 5 – Demand/Flow and Projections Chapter 6 – Network Modelling
Table 5.15 provides a summary of sewerage system component sizes. Service providers can develop modified sizing guidance based on the performance and characteristics of their existing systems and a comprehensive risk assessment.
TABLE 5.15 – Sizing of sewerage system components
Component Sizing Comments
Conventional system
Gravity sewers 150mm minimum size Depth of flow at PWWF <= 0.75d Min velocity = 0.7m/s @ PDWF + GWI Minimum Sewer Grades Diameter (mm) % 150 0.55 225 0.33 300 0.25 375 0.17 450 0.14 525 0.12 600 0.10 750 0.08 For EPs < 20 the min grade for 150 main should be 1% For EPs 20-50 the min grade for 150 main should be 0.67%
Gravity sewers sized for PWWF (i.e. 5 x ADWF min or C1 x ADWF, whichever is the larger). There will be a need to consider water conservation impacts on minimum sewer grades. For smart sewers a reduced peaking factor for PWWF may be applied (i.e. 4 x ADWF).
Rising mains Min velocity > 0.75m/s Max velocity 1.5m/s (single) and 2.5m/s (all pumps)
May need to reduce velocity prior to discharge to receiving sewer
Pump station wet well storage
0.9 x Single pump capacity L/s kL
N
Storage is between pump start and stop. N = 12 starts for motors less than 50kW. N = 5 starts for motors greater than 50kW. Other options can be considered based on starting regime (soft starters etc.) and manufacturers’ recommendations.
Emergency storage
4 hours x ADWF above duty pump start level in wet well. Can include system storage below wet well overflow level
DEHP may impose a higher level of emergency storage depending on the environmental sensitivity of receiving water. The availability of a standby generator may reduce the required detention period.
- 129 -

Component Sizing Comments
Single Pump Capacity (duty and standby)
C1 x ADWF Where C1 = 15 x (EP) – 0.1587
Minimum value of C1 to be 3.5
Other derived values for C1 may be used based on system performance. Alternatively the approach in the WSAA Code can be adopted.
Total pump capacity (both pumps operational)
PWWF (i.e. 5 x ADWF min or C1 x ADWF; whichever is the greater)
Overflows should not occur at flow < 5 x ADWF or C1 x ADWF (whichever is the larger). Alternatively the approach in the WSAA Code can be adopted. DEWS should be consulted.
Vacuum sewerage
Mains PWWF = (4 x ADWF) A peaking factor of 4 is reasonable to take into account • reduced I/I into a vacuum
system; and • the potential for I/I from
upstream gravity pipework WSAA code released 2004
Valves 80mm diameter to prevent blockage
Smart sewers
Mains PWWF = (4 x ADWF)
Common effluent drainage system
Connection 100mm main May require a second septic tank (1.37kL min) to treat household sullage if existing septic tank only treats toilet wastes.
Mains Depth of flow at 3 x ADWF <= 0.75d Min velocity in sewers > 100mm = 0.3m/s Min grades 100mm – 1 in 100 for first 30m
1 in 250 thereafter 150mm – 1 in 400 225mm – 1 in 670
Rising mains Min 50mm diameter (ID) Min velocity = 0.3m/s
A larger diameter main may be needed to prevent system blockage Peak flow 3 x ADWF
Septic tank effluent pumping
Connection 50mm (ID) minimum
Pumping mains 32mm (ID) minimum Peak flow 3 x ADWF
Pressure sewerage collection system
Property tank Pumping main
630L 40mm (ID) minimum
Peak flow 3 x ADWF WSAA code under preparation
Wastewater treatment
Treatment Plant Full treatment provided for 3x ADWF Minimum of screening and settling
DEWS may impose more stringent conditions depending on the
- 130 -

Component Sizing Comments provided for 3-5xADF Minimum of coarse screening for >5x ADWF
environmental sensitivity of receiving water.
On-site sewerage management system
Refer to: On-site Sewerage Code, Queensland Department of Local Government and Planning, Nov 2003 AS/NZS 1546:1998 On-site Domestic Wastewater Treatment Units – Septic tanks AS/NZS 1546:2:2001 On-site Domestic
Wastewater Treatment Units – Waterless composting toilets
AS/NZS 1546:2001 On-site Domestic Wastewater Treatment Units – Aerated wastewater treatment systems AS/NZS 1547:2000 On-site domestic wastewater management
Grey water reuse
Refer to: Guidelines for the Use and Disposal of Greywater in Unsewered Areas, Queensland Department of Local Government and Planning, June 2003
Queensland Plumbing and Wastewater Code, Queensland Department of Local Government, Planning, Sport and Recreation, 2005 (available late 2005; will cover greywater in sewered areas).
Effluent re-use
Storage/Irrigation Size determined from modelling of water balance, soil dryness and nutrients.
- 131 -

5.6 Other Issues to be considered in Infrastructure Planning Planners should give consideration to such issues as:
drought management, including contingency plans the need for specific materials (e.g. corrosion protection) or specialist support services,
which could impact on capital and operational costs siting of facilities to ensure access in all weathers; and to minimise impacts, including
noise, air pollution, radio interference and visual impacts management of by-products (e.g. biosolids) surge pressures how the scheme is to be monitored and controlled, level of automation, out of hours
operation resourcing the operation and maintenance of the infrastructure lifecycle cost impacts of additional assets (e.g. financial models should incorporate
additional O&M costs) actions to minimise the probability and consequence of various risks (refer to Table 5.1).
6 Checklist
What evidence exists to support the need for improvements? How confident are you of this evidence?
Have the objectives for providing the service been clearly documented?
Do these objectives cover service standards, social, financial and environmental objectives?
Have stakeholder requirements been adequately identified?
How well has the current performance been assessed? How confident are you of the information?
How have the future service demands been assessed?
How has the gap between existing performance and desired service needs and objectives (short, medium and long term) been determined? Has this been clearly documented?
Have non-asset options been rigorously considered before considering investing in infrastructure?
Has a sufficiently wide range of infrastructure options or a combination of options been considered?
Has the basis for selecting a preferred option been clearly documented? Is this supported by rigorous analysis commensurate with the level of infrastructure investment.
- 132 -

Chapter 8 Remote or small community issues
1 Purpose
This chapter highlights some of the issues that need to be considered in the provision of water and sewerage services to small or remote communities.
2 Key principles
Planners should take into account the ability of the community and service provider to fund, manage and sustain the proposed infrastructure.
The appropriateness of proposed solutions should be rigorously assessed.
Sustainable operational strategies are an essential consideration for planning studies for small and remote communities.
Regional solutions for service provision, management and operations should be considered for small or remote communities.
3 Background
Queensland contains 450 communities with a population of less than 1000 people. These account for nearly 75% of the State’s communities but only 5% of its population. Of these communities 340 have populations ranging between 50 to 500 persons and many of these are remote. The provision of water and sewerage services to these communities requires the adoption of practical, appropriate solutions, which recognise the constraints that size and remoteness imposes on the delivery of these services.
4 Why is this important?
The provision of reliable and affordable water supply and sewerage services is as essential to the public health and well-being of small communities as it is to larger urban centres. However, in many instances, service provision to the smaller and remote communities must overcome specific challenges that do not impact on the larger coastal communities. These include:
Huge diseconomies of scale for both capital and operational costs. Figures 4.1 to 4.4 provide an indication of the level of these diseconomies of scale. For instance, Figure 4.1 indicates that the cost (per EP) of constructing a water supply scheme for a community of 100 people could be nearly five times that to service a community of 10,000 people.
The costs associated with these diseconomies of scale mean that it can be difficult: o for service providers to charge customers the full cost to sustain the infrastructure in
the long term o to provide the optimal infrastructure to meet desired service levels o to adequately resource the management and operation of the scheme o to attract suitably qualified and skilled staff.
Declining population in some smaller and remote communities Staff turnover Reliance on one critical member of staff Limited water source options Costs of accessing specialist maintenance resources
- 133 -

Costs of planning studies can be high in relation to the total water supply and sewerage budget
Greater proportion of input required from customers and community in the operations and maintenance of the system.
Planners should recognise these and other challenges, and develop appropriate strategies.
5 When should these issues be addressed?
Issues that particularly impact on small or remote communities should be addressed as early as possible in the planning process to minimise wasteful investment of scarce resources in inappropriate solutions.
6 Key elements
The process for selecting the optimal strategy for the provision of water supply and sewerage services to small or remote communities will be the same as for any other community. The process is illustrated in Figure 6.1 and is described in Chapter 3 – The planning process and Chapter 7 – Options for service provision.
FIGURE 4.1 - Capital Cost - Water Infrastructure
0.00 1.00 2.00 3.00 4.00 5.00 6.00 7.00 8.00
10 100 1000 10000 Equivalent Person
Mul
tiplie
r
FIGURE 4.2 - OM&A Cost - Water Infrastructure
0.00 0.50 1.00 1.50 2.00 2.50 3.00
10 100 1000 10000 Equivalent Person
Mul
tiplie
r
FIGURE 4.3 - Capital Cost - Sewerage Infrastructure
0.00 0.50 1.00 1.50 2.00 2.50 3.00 3.50
100 1000 10000 Equivalent Person
Mul
tiplie
r
FIGURE 4.4 - OM&A Cost - Sewerage Infrastructure
0.00 0.20 0.40 0.60 0.80 1.00 1.20 1.40 1.60
100 1000 10000 Equivalent Person
Mul
tiplie
r
- 134 -

FIGURE 6.1 – Selecting the optimal strategy for providing a service
Issues that should be considered by the smaller service providers include:
How much should be invested in the planning study? Before commencing on a planning study the service need should be identified and confirmed through consultation with key stakeholders. Potential savings can result from the critical evaluation of needs. For instance, fireflow capacity and infrastructure should be commensurate with the rural fire service capability. Consideration should also be given to the expected life of the community (e.g. a mining town). Where the project is likely to have significant financial impact it would be desirable to determine what priority exists for this type of project under various financial assistance packages. The planning study should be an iterative process. It should commence with a feasibility study which will: o evaluate potential options (asset and non asset solutions) o provide indicative costs and financial impacts on customers o identify what further studies (and their costs) are required o identify potential risks particularly in relation to ongoing management and operation of
the infrastructure and the impacts of cost estimate over-runs (capital and operational).
Should the project be feasible it can progress into a more detailed planning phase.
Availability and reliability of information. Systems should be set in place to collect and store operational data. Due to the turnover of staff and reliance on one key person, it is essential that systems are set up to register and store all planning reports and related operational data. Smaller service providers should require all planning reports and related digital files to be provided at the end of a planning study. As constructed drawings should be provided, registered and maintained. Planning studies can be quite expensive in relation to a small service provider’s water and sewerage budget. To obtain value for money, planning costs should be expended on analysis and optimisation rather than collecting and verifying raw data. However, for many small communities the collection and verification of raw data will be critical and a balance between the collection and verification, and analysis and optimisation will have to be achieved.
Problems can be experienced in obtaining reliable population statistics for small or remote communities.
Determine Current
Performance
Options for Service Provision
Shortlist Potential Options
Detailed Evaluation of
Potential Options
Select the Optimal Strategy
DetermineService
Objectives
Identify Service Needs
Determine Scope of Planning
Identify Stakeholder
Requirements
Evaluate Current &
Future Demands
Planning Report
Develop Implementation
Strategy
Identify Options for
Service Provision
Analyse Options
- 135 -

Financial assistance. Financial assistance packages may be available for capital works. However, this availability should not be allowed to distort the analysis of options. The service provider should carefully consider its ability to financially and operationally sustain the infrastructure in the long term. The policy on cross-subsidisation between schemes should be clarified at the commencement of the planning study.
Population decline. The issue of population decline in some small communities will require serious consideration and needs to be addressed in any planning study. Similarly renewal of infrastructure by smaller capacity assets may be appropriate for these communities.
Population fluctuation. In some small communities there may be short term and long term population fluctuations that will require serious consideration. Population data may not adequately reflect population peaks and troughs due to visitors, or during holidays, festivals or other events. An understanding of both the extent and duration of population fluctuation will be required.
Resource sharing. The planning study should evaluate the benefits of resource/skills sharing between neighbouring local governments for the management and operation of water supply and sewerage services. A regional approach for service provision should also be considered.
Options. Chapter 7 – Options for service provision provides a range of options, many of which would be appropriate for small or remote communities. Resource sharing with neighbouring local governments may also be feasible in some circumstances. The features of an optimal solution for small or remote communities include: o technology that is appropriate to the locality and skills level of the service provider o proven track record in similar situations o low recurrent costs o ability to upgrade in later years (applicable where potential for significant growth
exists) o infrastructure provided is “fit for purpose”.
Community reaction. Communities may react strongly to significant rate increases or the provision of services (e.g. reticulated sewerage), which the community does not perceive as being necessary. In these instances community consultation is essential in the early stages of the planning process. Plan to develop ideas and systems slowly and inclusively so that the community can develop ownership of the ideas and designed systems.
Community priorities. Planners should consider the competing priorities of the community governance structure, as there are usually limited resources available.
Sustainable capacity. Planners should consider the following factors that contribute to sustainable water and sewerage services. These factors are applicable to all communities but can impact more on the smaller remote communities. These factors include: o Community capacity which represents the ability of the community to sustain its
population/demand for services and the capacity and commitment of the service provider to maintain the infrastructure to meet appropriate and targeted service levels.
o Infrastructure capacity which is the physical and operational capacity of the infrastructure. It addresses the technical considerations needed by the service provider to achieve required public health and environmental standards and considers infrastructure appropriateness, condition and limitations.
- 136 -

o Financial capacity of the service provider’s financial ability to sustain the service in the long term.
o Environmental capacity is the capacity/capability of the service to minimise environmental harm and to achieve environmental compliance.
o Management and systems capacity is the ability of the service provider to manage its infrastructure in an effective and efficient manner. It involves management, administration, technical and operational skills, staffing and systems, strategic planning, information management and risk management.
o Service levels. Each service should be able to sustain service standards. For example: water supply – quantity, quality and reliability of supply sewerage – reliability of service and quality of effluent.
7 Checklist
Are the issues that will impact on provision of water or sewerage services to the community thoroughly understood?
What is the basis of this understanding?
What has been the level of stakeholder consultation in relation to matters such as:
willingness to pay service standards impact on lifestyle willingness to undertake additional responsibility?
Have all practical options (asset and/or non-asset) been seriously considered?
Are the preferred options appropriate in terms of resources and applicability?
Has the option of resource/skill sharing for system management and operation been thoroughly investigated? How was this undertaken?
Does the preferred option have a demonstrated track record? How has this been determined?
Have the risks associated with the project been clearly identified and what measures have been taken to minimise any risks?
Has the planning progressed to a stage where design can commence (subject to funding approval)? If not what further work is required?
Has actual community responsibility for the proposed designed system been identified and discussed?
- 137 -

Chapter 9 Analysis of options
1 Purpose
The purpose of analysing options is to determine the preferred option which provides the optimal mix of financial, social and environmental outcomes for stakeholders.
This chapter provides an overview of options analysis methodologies. Reference to more detailed information sources is provided.
2 Key principles
Informed investment decisions can only be made through thorough analysis that considers financial, social and environmental impacts (positive and negative) and implementation risks throughout the lifecycle of the infrastructure.
Analysis of planning options must identify the long term financial impact (e.g. recurrent costs, including depreciation and customer charges) of all planning outcomes before proceeding with capital investment decisions.
All feasible potential options to meet service levels, including non-asset solutions should be considered in the options analysis.
The assumptions underlying the analysis of options must be justified and clearly documented in a planning report.
3 Why is the analysis of options important?
Options analysis is a critical component of any planning study because:
it objectively evaluates options based on a range of financial and non-financial criteria it provides a clear rationale for selecting a preferred option.
A project must meet service level criteria, financial, social and environmental objectives as well as legal obligations within an acceptable risk to the service provider.
4 When should the analysis be undertaken?
The options analysis should be undertaken once:
A need has been identified (e.g. maintenance or improvement in service standards, change in community expectations or change to current planning/operating assumptions).
The service objectives have been determined. Stakeholder requirements have been identified (refer to Chapter 4 - Stakeholders). Potential options for service provision have been identified (refer to Chapter 7 - Options
for service provision). Reliable information has been compiled to quantify financial, social and environmental
benefits, costs and risks.
The options analysis will be an iterative process commencing with a short-listing of potential options for more detailed evaluation, and subsequently the selection of a preferred option.
- 138 -

5 Key elements
Key elements of the options analysis are illustrated in Figure 5.1.
FIGURE 5.1: Key elements
5.1 Determine the evaluation criteria The evaluation criteria should be clearly linked to quantified service objectives for the project. These objectives could relate to:
service standards regulatory compliance operational performance/efficiency social objectives environmental objectives financial objectives.
5.2 Determine options These options may be categorised as:
base case (do nothing) minimal approach existing asset options – this may involve asset rehabilitation, renewal or replacement
options non-asset options (e.g. demand management, alternative means of service delivery, I/I
reduction, optimising existing operation or improved utilisation of existing infrastructure) new asset options (a range of options may exist).
The optimal strategy could well be a combination of these categories. Details of potential asset and non-asset options are included in Chapter 7 - Options for service provision.
The identification and analysis of options can be facilitated through having value management or similar workshops. Options can be creatively and economically addressed through challenging assumptions, generating alternative ideas, improving communication and establishing priorities.
Depending on the scope of the planning study, workshops could involve internal planning and operational staff, or a range of key stakeholders or a combination of each.
- 139 -

The identification and management of risks should be embedded into the planning process and in particular the options analysis. Managing risk provides a basis for a more rigorous planning study as it will allow strategies to be developed to:
reduce the likelihood and consequences of risks avoid the risk by not proceeding with the option accept the risks (and highlighting this in the planning report).
5.3 Develop inputs The range of inputs a planner would typically determine for each option may include:
Whether the option is technically feasible. The level of compliance with service standards. This will be a quantitative assessment. Financial data including projected costs (capital, operational and renewal) and revenues. Compliance with regulatory requirements. This may be quantitative in relation to matters
such as effluent standards. Other assessment may be qualitative. It would be mandatory for a preferred option to be fully compliant with regulatory requirements.
Level of achievement of operational targets (e.g. energy consumption performance indicators). Some operational objectives may be more qualitative (e.g. operational skills requirements).
Achievement of social objectives. Many of these would be qualitative (e.g. improved public health, equitable provision of services).
Achievement of environmental objectives (e.g. reduced greenhouse gas emissions, improvement in the management of a scarce water resource). These could be a combination of quantitative (e.g. ecological footprint) or qualitative.
Potential risks associated with the project. The assessment is likely to be qualitative. Risks to be considered would vary with the type of project and could include some of the following categories:
Commercial/Financial Industrial relations
Legal Asset Ownership
Social Organisational
Environmental Technological
Political Infrastructure
Cultural Public health
Site Workplace Health and Safety
Contractual Regulatory
Design, construction & commissioning Demand
Operational Security
A key input to the options analysis will be cost estimates. In developing cost estimates, the following should be considered:
Estimates should include explanatory notes that clearly indicate the basis of the estimate. For instance. - Capital cost estimates should include all project costs (e.g. planning, survey,
geotechnical, heritage, design, contract management, administration and service provider project management costs).
- 140 -

- Operational estimates should make allowance for administration and other overheads.
- The contingency percentage should be specified. The contingency percentage will be higher for preliminary or feasibility studies than more detailed planning studies, to reflect the confidence level in the estimate.
- Confidence in the estimates should be highlighted by specifying a range. The range would narrow as the definition of the scope of the project becomes more defined as planning develops. Specifying a number rather than a range may give decision makers an impression of greater estimating accuracy than actually exists.
In developing estimates of benefits the following should be considered: - Avoided costs – costs which are unavoidable if nothing is done, but may be avoided if
action is taken (for example, costs if a township experiences regular droughts requiring water carting).
- Cost savings – verifiable reductions in existing levels of expenditure if a project proceeds (for example, reduced user costs if septics were replaced with a reticulated sewerage system or through more efficient operation).
Planners should be conscious of “optimism bias” – a tendency for under-estimation of costs and project duration and over-estimation of benefits. Higher risk of cost underestimation would occur with non-standard projects. This risk could be compensated through applying a higher risk-based contingency percentage in the cost estimates.
5.4 Undertake the options analysis The options analysis should include:
Technical evaluation of feasible options (refer Chapter 7 – Options for service provision) including project staging. If the project is technically feasible then further analysis can be undertaken.
A financial analysis to determine the financial viability of each option. Analysis of social impacts (positive and negative). Analysis of environmental impacts (positive and negative). Risk assessment. A multi-criteria analysis for qualitative evaluation of impact and risk. Sensitivity analysis to evaluate the changes to key variables and how these changes
would affect the overall cost/benefit of a project.
A financial analysis evaluates the financial viability of a project from the perspective of the service provider. An economic analysis assesses the overall impact of the project on the local, regional or state economy. The planning study should clearly identify what type of analysis has been undertaken.
A financial analysis includes:
Projections of revenue (upfront and annual) from various sources. This would also include any community service obligations (CSO’s) and residual infrastructure value.
Projections of costs including capital (new and renewal works), operation, maintenance, depreciation, administration, taxation and dividend payments.
Calculation of financial viability. The project is usually considered financially viable if the net present value (NPV) is greater than zero, i.e. the total discounted value of revenues are greater than the total discounted costs. The option with the highest NPV is often selected if the sole criteria is financial. An alternative approach is the use of Internal Rate of Return (IRR) which determines the interest rate that a capital investment will return. In some instances a project may have a positive NPV but may not be considered financially viable as an internal rate of return greater than the “hurdle rate” may be required by the
- 141 -

service provider. The “hurdle rate” may have been set to meet commercial objectives based on some rate that is higher than the current weighted average cost of capital (WACC).
An economic analysis would evaluate quantifiable benefits in addition to revenue. The following may also be considered:
Benefits which result directly or indirectly from the project. Benefits to consumers, and the broader community as a whole (externalities).
In an economic analysis, costs would also include such items as quantifiable environmental costs.
Least cost planning (LCP) analysis is an evaluation technique that can be used to include consumer as well as service provider costs and benefits. For example, the principles of Least Cost Planning applied to water resource management involve considering demand management initiatives along with source substitution and supply augmentation options to identify methods of meeting the water related needs of a region at least cost to the community.
Demand management initiatives are identified by disaggregating water use into customer sectors and then into various end uses. Having identified demand management measures for each end use, the potential water savings from each initiative are systematically evaluated. This is followed by an estimation of water demand if the demand management initiatives are implemented and revised projections where appropriate.
The analysis of the costs and benefits of demand management options is undertaken by estimating the present value cost of implementing the option and the present value benefits that are accrued by avoiding and/or deferring any existing capital or operating costs associated with current supplies or any planned supply augmentation. The net present value (present value costs minus the present value benefits) is then used to estimate the unit cost of options and enable comparisons.
A multi-criteria analysis is a means of ranking options based on financial and non-financial criteria. The non financial criteria may be a combination of qualitative and quantitative criteria.
Quantitative criteria for Ecological Sustainable Development (ESD) are gaining greater acceptance within the water industry. Typical tools include:
Ecological footprint (EF) Lifecycle assessment (LCA).
The EF concept can be used to convey the environmental impacts associated with a development. EF is a tool that calculates the area of land required to provide all energy and material resources consumed and includes all wastes discharged for each option. The EF concept is reported to have limitations (e.g. exclusion of downstream impacts such as impacts on receiving waters) and may not currently be appropriate for an options analysis. However, it could become a useful decision support tool as the technique is further refined.
LCA is an environmental assessment of the overall mass balance of an option, from the production of the raw materials to the ultimate disposal of all wastes. It can be a useful technique for comparing options on the basis for ecological sustainability.
- 142 -

A range of methodologies exist for multi-criteria analysis. Tables 5.1 and 5.2 provide an example. Weightings should be agreed prior to undertaking the multi-criteria analysis.
TABLE 5.1 Benefits – compliance with service objectives
Criteria
Wei
ghtin
g Option 1 Option 2 Further Options
Score Weighted Score Score Weighted
Score Score Weighted Score
Service standards
Social objectives
Environmental objectives
Operational objectives
Etc.
Total
TABLE 5.2 Risks
Risk Criteria
Wei
ghtin
g Option 1 Option 2 Further Options
Score Weighted Score Score Weighted
Score Score Weighted Score
Financial
Social
Political
Environmental
Etc
Total
Options can then be ranked based on the relationship between NPV, benefits and risks. The multi-criteria analysis could be undertaken through a workshop of key stakeholders.
5.5 Sensitivity analysis There will always be some degree of risk and uncertainty surrounding the outcome of a financial or economic evaluation.
An assessment should be made of a realistic range for all key variables. The assessment should be performed using different combinations of worst and best case scenarios. Techniques for assessing risk and uncertainty include:
Sensitivity analysis. This illustrates what would happen if a small number of the key variables changed and how these changes would affect the overall cost and benefits/revenues of the project.
- 143 -
Risk analysis. This assigns probabilities to the key variables, weights the key values by their probabilities of occurrence and uses these data to calculate the net present value of the project.
Scenario planning. This approach is used if there are many assumptions in the project evaluation, each of which could vary. It is a process of looking at various possible situations or future scenarios.
A clear statement of the assumptions used in the analyses and the reasons for choosing them must be given in a planning report so that the decision maker is aware of the underlying assumptions.
6 Checklist
How confident are you of the reliability of information provided for the options analysis? Can you confirm the validity of this information?
Has a sufficiently wide range of staff and other stakeholders been involved in the multi-criteria analysis, including the development of criteria and weightings?
Has a sufficiently wide range of options for service provision been considered? How were the options identified and then refined to focus the detailed analysis?
Has there been adequate analysis of lifecycle revenues and costs, social and environmental impacts?
Have non-asset solutions been adequately identified and assessed? Have the risks been rigorously evaluated? Does the analysis include an appropriate level of sensitivity analysis? To what extent has the analysis taken into account the tendency for “optimism bias”? Has the planning proceeded to the appropriate level to justify the recommended option? Has a ‘reality check’ been undertaken to assess whether the outcomes of the analyses
are reasonable? Are you confident that you can demonstrate that the proposed option is the optimal
strategy in terms of social, environmental and financial outcomes? Would you invest in the preferred option if you were personally responsible for its
implementation?
- 144 -

Chapter 10 Implementation
1 Purpose
The purpose of developing an implementation strategy for the preferred option or strategies arising from a planning study is to determine:
the criticality of the project to the service provider’s capital works and operational programs
the most cost-effective means of implementing the option with minimal risk.
2 Key principles
Stakeholders, including asset owners, need to be aware of issues and risks associated with the implementation of projects proposed through a planning study.
A rational approach to project prioritisation is essential to effectively deliver a capital works program.
The recommended implementation strategies should be based on a thorough review of potential risks and how they will be managed.
3 Why is an implementation strategy important?
In many instances there would be advantages for an implementation strategy to be developed as part of a planning study. Service providers require information on the criticality of a project, how it is to be implemented and an estimated timeframe because:
The project has to compete with other projects for priority in the capital works program (new or replacement works). Non-asset projects (e.g. demand management) also have to compete for funding and resources.
Implementation of the most appropriate infrastructure delivery option will provide beneficial results to the service provide.
Some projects require a significant lead time for consultation, approvals, land acquisition etc.
Service providers need to be aware of the resources required to manage and implement the project and the capital works program.
Failure to deliver the capital works program to meet quality, timelines and cost objectives may result in non-compliance with service standards or regulatory requirements.
For smaller service providers and for routine projects the implementation strategy is relatively straightforward. However, for larger service providers with competing demands to meet growth and other stakeholder requirements, effective project and program management is essential.
The implementation strategy should quantify parameters used to prioritise projects within a capital works program.
- 145 -

4 When should an implementation strategy be developed?
The implementation strategy should be developed once the preferred option has been selected. However, in certain circumstances project delivery may influence the selection of the preferred option. The implementation strategy should be documented in a planning report.
5 Key elements
Key elements of the implementation strategy development are illustrated in Figure 5.1.
FIGURE 5.1 – Key elements
5.1 Determine project criticality Projects identified in planning studies have to compete with other projects (new or replacement works) within a service providers capital works program. Non-asset projects (e.g. demand management) also have to compete for funding and resources.
The planning process can provide a rationale for determining the relative importance of a project to meet the service provider’s objectives. The process would need to be consistent across all planning studies. Consequently the prioritisation methodology has to be clearly documented by the service provider.
A suggested approach could be one similar to that adopted for the multi-criteria analysis (refer to Chapter 9 – Analysis of options). It would typically involve:
Determining project NPV or NPV/EP serviced. Assigning a rating and weighting to the anticipated benefits of the project to the service
provider. These could include: o alignment with the service provider’s strategic direction as outlined in its Corporate,
Business or Total Management Plan o criteria such as service reliability, quality, quantity, operational efficiency,
environmental improvement etc. Assigning a rating and weighting to the likely risks if the project does not proceed. These
risks could be social, political, regulatory, financial, environmental, public health, workplace health and safety, etc.
- 146 -

Assigning criticality scores to the project based on: o NPV and/or NVP per EP o total benefit score o total risk (if the project does not proceed) score.
The service provider would prioritise projects within a proposed program based on the relationship between the above for each project.
5.2 Determine the preferred project delivery option The method of infrastructure or project delivery may need to be determined and evaluated in the planning stage, as different options will likely result in different financial impacts. For example, the financial impact of funding a treatment plant using traditional project delivery will be totally different from that of funding it through a build, own, operate, transfer (BOOT) arrangement.
Infrastructure delivery needs to be consistent with a service provider’s delivery policy and procedures. A summary of infrastructure delivery options is outlined in Table 5.1.
TABLE 5.1 – Summary of alternative infrastructure/project delivery options
Option Process Applicability
Sequential Design & Construction
Involves separate stages for design and construction. These stages could be undertaken by in-house teams or external contractors.
Suited to a large proportion of urban water and sewerage projects including projects where a reasonably detailed concept design needs to be developed (e.g. a dam or a pipeline) in an environmentally sensitive area, or where (due to the nature and location of the works) there is little scope for post-tender innovation.
Design & Construction (D&C)
A single company is responsible for both design and construction of the project, based on meeting explicit performance requirements. A service provider takes over and operates the infrastructure.
Suited to projects over $1M where there are many options which could meet performance requirements. It is applicable for a group of treatment works or major pumping stations.
Build, Transfer, Operate (BTO)
A private sector company is responsible for design, construction and operation of a facility (normally 20-25 years). Ownership is transferred to the service provider after commissioning on payment of most of the capital cost.
Suited to projects over $5M involving a water treatment works or sewage treatment works, where operational costs are a significant proportion of the total life cycle costs, and where service providers wish to maintain ownership of its facilities. May also be suitable for a group of projects such as a group of small town sewerage schemes.
Build Own Operate Transfer (BOOT)
A private sector consortium is responsible for design, construction, operating, owning and financing a facility for the life of the project (normally 20-25 years). At the end of this period ownership of the facility is transferred to the Service provider.
Suited to “greenfield” projects over $20M involving a water treatment works or sewage treatment works, where operational costs are a significant proportion of the total life cycle costs and where projects are easily separable from the rest of a service provider’s business.
- 147 -

Option Process Applicability
Alliance Where several companies or service providers work together to deliver the project.
In special circumstances.
Concession This is an extension of BTO where a private sector company is responsible for operation and maintenance of the system together with capital investment required over the life of the concession, typically 20-30 years.
In special circumstances.
Build Own Operate (BOO)
Similar to BOOT, except that the private sector consortium is responsible for the facility in perpetuity.
In special circumstances.
Public Private Partnership (PPP)
A PPP is a risk-sharing relationship between the public and private sectors to deliver timely public infrastructure and services. Objectives include: Delivery of improved
services and better value for money through appropriate risk-sharing;
Encouraging private sector innovation;
Optimising asset utilisation; and
Integrating whole-of-life management of public infrastructure.
In special circumstances
This table has been adapted from Water and Sewerage Infrastructure Delivery Options, Department of Land and Water Conservation (DLWC), Local Government and Shires Association, NSW, 1999.
Factors that should be considered in selecting the most appropriate infrastructure delivery option include (DLWC, 1999):
Net present value of costs and revenues. Size and complexity of project – as the size and complexity of a project increases, a
greater opportunity exists to explore options for infrastructure delivery. Policies on procurement and management of assets. Finance – a BOOT scheme may be more attractive to taking on additional debt. Regulatory approvals – the need for a detailed concept design for regulatory approvals
for certain projects may limit options to sequential design and construction. Timing – D&C may lead to quicker project completion. Design needs – D&C, BTO, Concession or BOOT may be favoured if the best design
process skills are with a contractor or operator. Construction – BTO, Concession or BOOT may be favoured for a “greenfield” site with
high project cost and some complexity and scope for innovation.
- 148 -

Operation – sequential or D&C may be favoured where a service provider’s operational efficiency for similar facilities is high. BTO, Concession or BOOT may be favoured where the desired technology is best available through private sector options, or where the WSP wishes to introduce a competitive element to provision of services in its area.
Risk management – sequential would be favoured where detailed site investigations are necessary to adequately develop and cost a concept design or where there is considerable uncertainty in demand/load projections. BTO, Concession or BOOT would be favoured where the service provider wishes to transfer management of design, construction and operation interface risk to the private sector.
For each project a risk management plan should be prepared to identify how all potential risks for the delivery of the project would be managed. Each infrastructure delivery option would have a different risk profile. The client can then select the option which allows various risks to be allocated to the most appropriate party (client or contractor). Service providers should ensure that true risk transfer will actually exist.
Where innovative financing arrangements are being considered, service providers should take into account:
up-front technical, legal and financial costs compliance with the Statutory Bodies Financial Arrangements Act 1982.
5.3 Develop implementation program Factors impacting on project implementation would include:
relative criticality within the service provider’s capital works program regulator imposed deadlines the service provider’s financial position funding cycles approval timeframes time constraints the need for further planning/design studies (eg design report) extent of further stakeholder consultation project complexity land acquisition availability of contractors/subcontractors availability of materials seasonal factors that could delay construction.
Quantification of the approval timeframes is required to advise stakeholders on the lead times required between project inception and project completion. Lead times for some infrastructure projects (e.g. dam projects) would be in the order of 10 to 15 years to undertake all pre-construction activities.
For high risk projects, the program should nominate an appropriate period after which a post construction evaluation of project costs, benefits and risks is undertaken.
The implementation program should include an estimate of annual cash flow.
For high risk projects it would be desirable to undertake a detailed risk management study to reduce the probability and consequence of risk events.
The implementation plan should include a skills matrix and a training program for service providers that have limited available operating or management skills.
- 149 -

6 Checklist
Is a consistent approach to quantifying project criticality being applied across all planning studies?
Has the appropriate infrastructure delivery option been identified? How?
Have implementation risks been identified and appropriate strategies developed to minimise risk and/or direct them to the most appropriate party?
Does the service provider have the resources to implement the proposed program? How have you made sure of this?
Does the program include a post-completion audit to be undertaken of the high risk projects?
Are you confident that the project can be implemented within the proposed timeframe at minimal risk? What is the basis of this confidence?
- 150 -

Chapter 11 Planning outputs
1 Purpose
It is essential that the results of the planning process are effectively communicated to key decision makers and other stakeholders by means of a planning report.
A planning report provides key decision makers with information to assess and demonstrate how the preferred option best meets the service need. This information should be sufficient to enable decision makers to:
determine the preferred planning strategy endorse the preferred strategy agree on funding the implementation of the strategy.
2 Principles
Planning reports should clearly and succinctly communicate to key decision makers and other stakeholders how the preferred option best meets the service need, taking into account future development scenarios and assumptions.
Planning reports should demonstrate that a rigorous examination (at an appropriate level) of options, costs and risks has been undertaken, and that all legislative, financial, environmental and social issues have been addressed, or at least considered.
3 Why is this important?
It is important that planning outputs are clearly communicated to stakeholders for the following reasons:
Funding providers can justify the investment Stakeholders are satisfied that the strategies are supported by appropriate rigorous
analysis It clearly communicates to decision makers how the preferred strategies will meet the
service need at the lowest financial, social and environmental cost It demonstrates accountability to customers and the community It clarifies the key assumptions, risks and costs associated with the preferred strategies It can form the basis for management to monitor the achievement of outcomes from
implementation of the strategies.
4 When should planning reports be developed?
As discussed in Chapter 3 - The planning process, the outputs from a planning study could be one of the following:
a strategic/master planning report a concept feasibility report a detailed planning report.
Planning an initiative is usually undertaken iteratively. The feasibility of an initiative will determine whether it is progressed into a more detailed planning phase.
- 151 -

Planning reports should therefore be prepared at the end of every planning study.
5 Key elements
Figure 5.1 illustrates how the planning report and other outputs fits into the planning process.
FIGURE 5.1 – The output from a planning study
5.1 Prepare planning report An indicative outline for a planning report is included in Table 5.1. It should be noted that this is NOT a template and it can be adapted to suit the needs of service providers. The extent and detail in the planning report will depend on the extent and complexity of the planning issues to be considered.
5.2 Incorporate outputs into other documentation Planning report outputs should be incorporated into the service provider’s:
project prioritisation system capital works program which should be a component of its 10-20 year financial model Total Management Plan planning report summary documentation planning report relationship diagrams which illustrate the relationship between the
various planning studies undertaken by the service provider.
Digital and hard copies of all planning studies should be registered and stored in a corporate network or library system.
6 Checklist
To what extent is the planning report (in particular the executive summary) an effective means of communication for key decision makers?
Does the document give enough confidence to stakeholders that the recommended strategies are supported by appropriate rigorous analysis?
Is there sufficient logic in the analysis as outlined in the report? Are you confident that the recommended strategies are the most appropriate (financially,
socially and environmentally) to meet the service need? Is the proposed implementation program and funding strategy feasible based on the
results of your project prioritisation process and financial modelling?
Identify Service Needs
Identify Stakeholder
Requirements
Identify Options for
Service Processing
Develop Implementation
Strategy
Planning Report
Planning Outputs
EvaluateCurrent &
FutureDemands
DetermineScope ofPlanning
DetermineService
Objectives
Prepare Planning Report
Incorporate Outputs into
Other Documentation
AnalyseOptions
- 152 -

Have risk issues been adequately considered and are the proposed risk management strategies feasible?
To what level can the planning be considered as “integrated”? Have a sufficiently wide range of options for service delivery been considered? Have non-asset solutions been adequately identified and assessed? Has the planning proceeded to the appropriate level to justify the recommended
strategies? Do the recommended strategies identified in the planning study address the objectives
and critical success factors that will deliver the identified service need? To what extent does the recommended strategy align with the service provider’s strategic
direction, land use planning, regional planning and regulatory requirements? Are you confident that the proposed strategy is the optimal strategy in terms of social,
environmental and financial outcomes? Would you invest in this strategy if you were personally responsible for its
implementation?
TABLE 5.1 – Indicative planning report outline
Executive summary
This should present a clear, concise plain English outline of the proposal, including the rationale for proceeding with the recommended option. This summary should be composed, as far as possible, in a non-technical language because: Decision makers will primarily consult the executive summary. It should convey a quick and explicit understanding of the arguments, key issues and
major implications without undue detail. It should present a useful “big picture” overview. It should include specific recommendations
Project objectives and scope
This should include a clear statement on the objectives and scope of the proposed initiative and its connection to the service provider’s strategic direction as outlined in its Total Management Plan. This section should also indicate how this planning study relates to the planning studies. Refer to Chapter 3 - The planning process.
Description of the service need
This section would clearly and succinctly describe what exactly the service need is and how this was determined. Refer to Chapter 3 - The planning process.
Stakeholder analysis
The results of identifying and analysing stakeholders needs, expectations, concerns and requirements should be documented. Refer to Chapter 4 - Stakeholders.
- 153 -

Existing service delivery
This should clearly describe: the existing infrastructure and its condition how it is operated and maintained how the system relates to the rest of a scheme. For describing infrastructure a schematic layout is usually preferable to long-winded descriptions.
Current performance in meeting service needs
This section will address such issues as: actual service levels against service standards future compliance with service standards regulatory compliance achievement of the service provider’s financial and non-financial objectives operational performance where gaps exist between current performance and desired service needs and social,
financial and environmental objectives (short, medium and long term). Refer to Chapter 7 - Options for service provision.
Current demand and future projections
This section should summarise current and future demand/flows including peaking factors. The impacts of demand management should be clearly outlined. The basis of the demand and projections should be described. The impact of changing key variables should be documented. Refer to Chapter 5 - Demand and projections.
Summary of options
This would include a shortlist of options (infrastructure and non-asset) and reasons for selecting these options. Any assumptions should be clearly documented. Refer to Chapter 7 - Options for service provision.
System analysis
The section should demonstrate the degree that integrated water management has been considered. The section should describe and summarise any analyses that have been undertaken. Where modelling is undertaken (e.g. network, hydraulic, water quality, treatment process, etc.), the results can be presented in a range of graphical and textual outputs. This section should outline: the methodology for the model customer service, design and operational criteria adopted for the model assumptions used in the model limitations of the model verification of model accuracy results of the modelling and implications on the service provider. Refer to Chapter 6 - Network modelling.
- 154 -

Cost estimates
This section would include a detailed breakdown of capital, operation, maintenance and renewal costs for each option. Proposed implementation dates and staging should be highlighted. Refer to Chapter 9 – Analysis of options.
Options analysis
This section would summarise the results of options analysis which would include: technical analysis (i.e. is the option technically feasible) economic and financial analysis social analysis environmental analysis. Refer to Chapter 9 - Analysis of options.
Funding strategy
This section will outline how this initiative will be funded (e.g. revenue, loans, infrastructure charges, subsidies etc.). It should include a reference to how the funding strategy was determined (e.g. the service provider’s 10-20 year financial model).
Implications of the proposal
This section should highlight the implications of proceeding with the proposal, e.g.: financial (e.g. capital and recurrent costs (including depreciation), customer charges, the
service provider’s financial position) social (e.g. improvements or reductions in service levels, community benefits) environmental (e.g. environmental improvements) operational (e.g. operational efficiency).
Implementation strategy
This would include a discussion on the appropriate infrastructure delivery options (e.g. traditional procurement, design and construct etc.) and a recommended approach. It would include an implementation program that addresses approvals (regulatory and funding), land acquisition, investigations, design, construction and cash flows. An indication of how the proposed program could be incorporated into the existing service providers capital works program taking into account other competing priorities. Potential resourcing implications for the service provider should also be highlighted. Refer to Chapter 10 - Implementation
Risk management
A planning report should identify all material risks associated with the proposal and document: How the probability of a risk event will be managed; How the consequence of a risk event will be managed; and Who will be responsible for managing the risks.
- 155 -

A wide range of risks could be experienced. Some of these would include: - commercial/financial - organisational - contractual - political - demand - public health - environmental - regulatory - implementation - security - infrastructure - social - natural disasters - technological - operational
Recommendations
A clear recommendation for the preferred option and other supporting recommendations should be provided.
Appendices
The appendices could include: detailed tables and drawings reference listing including any detailed supporting studies minutes of critical meetings minutes of any value management workshops.
- 156 -

Telephone enquiries
Water: 13 QGOV (13 74 68) business hours
Energy: 13 43 87 business hours
Visit: www.dews.qld.gov.au