water sharing in the nile river valley - unep · water sharing in the nile river valley ... 3.6 fao...
TRANSCRIPT

PROJECT GNV011 : USING GIS/REMOTE SENSING FOR THE SUSTAINABLE USE OF NATURAL RESOURCES
Water Sharing in the Nile River Valley
Diana Rizzolio Karyabwite
UNEP/DEWA/GRID -Geneva
January -March 1999 January-June 2000


Water Sharing in the Nile River Valley
UNEP/DEWA/GRID-Geneva - DR i
ABSTRACT
The issue of freshwater is one of highest priority for the United Nations Environment Programme
(UNEP). The Nile Basin by its size, political divisions and history constitutes a major freshwater-related environmental resource and focus of attention.
UNEP/DEWA/GRID-Geneva initiated several case studies stressing a river basin approach to the integrated and sustainable management of freshwater resources. In 1998 GRID-Geneva started a
project on Water Sharing in the Nile River Basin. The Nile Valley project was set up to prepare an experimental methodology to identify the potential water-related issues in a watershed. The first stage of
the project consisted of the compilation of available geoferenced data sets for the Nile valley region to be used as inputs for water balance modelling; and led to the elaboration of a first report1.
Available georeferenced data sets have been stored in Arc/Info-ArcView. They serve as inputs for water balance modelling. General data on transboundary water sharing and on the Nile River Basin
were also collected.
Several international projects operating in the Nile River Valley are oriented towards Nile Basin water
management, using GIS and remote sensing techniques. Therefore any continuation of the GRID-Geneva Nile River project should be linked with and integrated into one of these successful field
programmes.
1 Booth J., Jaquet J.-M., December 1998.


Water Sharing in the Nile River Valley
UNEP/DEWA/GRID-Geneva - DR iii
TABLE OF CONTENTS
ABSTRACT........................................................................................................................................ I
TABLE OF CONTENTS ...................................................................................................................... III
LIST OF FIGURES .............................................................................................................................IV
LIST OF TABLES ...............................................................................................................................V
INTRODUCTION ................................................................................................................................ 1
PART I. DATA COMPILATION ...................................................................................................... 3
1 WATER PROBLEMS .................................................................................................................. 3
1.1 Water: quantity and quality............................................................................................... 3
1.2 Water issues........................................................................................................................ 6
2 NILE RIVER VALLEY................................................................................................................. 9
2.1 Generalities ........................................................................................................................ 9
2.2 Physiography .................................................................................................................... 12
2.3 Climate.............................................................................................................................. 24
2.4 Hydrology.......................................................................................................................... 26
2.5 Population ........................................................................................................................ 33
2.6 Water Resources utilisation............................................................................................. 34
2.7 Fauna and Flora.............................................................................................................. 36
3 NILE RIVER BASIN PROJECTS................................................................................................ 38
3.1 Basin-Wide Cooperation.................................................................................................. 38
3.2 Monitoring, Forecasting and Simulation project (MFS)............................................... 42
3.3 FRIEND/Nile Project...................................................................................................... 43
3.4 Georgia Tech –Nile Basin Management......................................................................... 44
3.5 The UNDP Nile River Basin Cooperative Framework Project ..................................... 48
3.6 FAO Nile Basin Water Resources Project...................................................................... 48
3.7 FAO Lake Victoria Water Resources Project ................................................................. 49
3.8 Lake Victoria Environmental Management Project ...................................................... 50
3.9 Snowy Mountains Engineering Corporation ................................................................. 50
3.10 NileSim - Maryland University........................................................................................ 51
3.11 NILE-HYCOS - WMO ..................................................................................................... 54
3.12 Nile Basin Society ............................................................................................................ 55
3.13 Green cross International ................................................................................................ 55
4 DATA ..................................................................................................................................... 57
4.1 Generalities ...................................................................................................................... 57
4.2 DEM.................................................................................................................................. 57
4.3 Hydrological data............................................................................................................. 58

Water Sharing in the Nile River Valley
iv UNEP/DEWA/GRID-Geneva - DR
4.4 Runoff Data.......................................................................................................................59
4.5 Climate and Water Balance .............................................................................................60
4.6 Other Features..................................................................................................................61
4.7 Map Projections.................................................................................................................65
PART II. RESULTS .....................................................................................................................67
5 ARCVIEW PROJECT DESCRIPTION .........................................................................................67
5.1 Generalities .......................................................................................................................67
5.2 Starting the project ...........................................................................................................67
5.3 Project views......................................................................................................................68
5.4 Scritps ................................................................................................................................68
5.5 Tables.................................................................................................................................68
6 WATERSHED DELINEATION......................................................................................................69
6.1 General methodology ........................................................................................................69
6.2 Projection ..........................................................................................................................70
6.3 Watershed delineation......................................................................................................71
6.4 Discussion .........................................................................................................................76
7 WATER BALANCE MODELLING ................................................................................................78
7.1 Soil Water Balance ...........................................................................................................78
7.2 Runoff................................................................................................................................79
7.3 Estimation of Surface Water Yield by Using a Rainfall-Runoff Function ...................79
7.4 River and Reservoir Routing Using the Rivers Model ....................................................80
7.5 Discussion .........................................................................................................................80
TECHNICAL & OTHER RECOMMENDATIONS ...................................................................................81
CONCLUSIONS ................................................................................................................................82
BIBLIOGRAPHY ...............................................................................................................................83
LIST OF FIGURES
Figure 1. Water Cycle .........................................................................................................................3
Figure 2. Water Consumption in the World and in Africa by Economic Activity ......................................5
Figure 3. Water Stress in Africa ..........................................................................................................7
Figure 4. Nile River Countries............................................................................................................10
Figure 5. Nile River Profile from the Kagera measure station to the sea ...............................................13
Figure 6. Nile Basin Topography ........................................................................................................14
Figure 7. Map of the Lake Plateau Area ............................................................................................15
Figure 8. Map of the Sudd and Central Sudan Basin ............................................................................17

Water Sharing in the Nile River Valley
UNEP/DEWA/GRID-Geneva - DR v
Figure 9. Map of the White Nile .........................................................................................................19
Figure 10. Map of the Ethiopian Plateau .............................................................................................20
Figure 11. Map of the Main Nile Area................................................................................................23
Figure 12. Nile River Network...........................................................................................................27
Figure 13. Nile Basin Population Map.................................................................................................34
Figure 14. Georgia Tech's Decision Support System Presentation .........................................................44
Figure 15. Nile Sim Presentation ........................................................................................................51
Figure 16. Status of WMO HYCOS Components................................................................................54
Figure 17. DEM projected .................................................................................................................70
Figure 18. Filled Burndem................................ ................................ ................................ ..................72
Figure 19. Flow Direction GRID ........................................................................................................73
Figure 20. Flow-Paths for the Nile River Bassin................................ ................................ ..................74
Figure 21.Nile River Streams and Watersheds ....................................................................................75
LIST OF TABLES
Table 1. World’s Major River Systems................................................................................................ 9
Table 2. Nile Basin repartition............................................................................................................10
Table 3. Water Resources and water availability per person in the Nile Basin countries (1995)..............11
Table 4. Refugees per country in the Nile Basin................................ ................................ ..................12
Table 5. Rainfall Average in the Nile Basin.........................................................................................25
Table 6. Variations in discharges on the Nile .......................................................................................28
Table 7. Nile Basin Dams ................................ ................................ ................................ ..................30
Table 8. Population in the Nile Basin. .................................................................................................33


Water Sharing in the Nile River Valley
UNEP/DEWA/GRID-Geneva - DR 1
INTRODUCTION
In many countries, water scarcity is one of the principal causes of poverty and malnutrition. At the
beginning of a new millennium, the problem of water quality deterioration is also becoming important. Nowadays 300 millions of Africans are likely to live a water shortage situation. Recurrent and localised
drought, increasing food insecurity and diseases with hydrologic origin or transmission cause millions of deaths every year. Environmental pollution grows, and African countries share one or more river valleys
which extend beyond their national borders.
The United Nations Environment Programme (UNEP), directly concerned with emerging freshwater
problems, has put this issue at the top of its agenda: “UNEP must be in the leading role in this sphere to identify hot spots around the world and sound early warning bells in order to arrive at a better solution
for the future”.1 Several projects have emerged in the organisation. At UNEP/DEWA/GRID-Geneva case studies were initiated which stress a river basin approach to the integrated and sustainable
management of freshwater resources.
The Nile River Basin is one of the world’s most famous river basins. There is a fascination about the
Nile River which has captured human imagination throughout history. Some five thousand years ago a great civilisation emerged depending on the river and its annual flooding cycle. At the beginning of this
new millennium, a few agencies are working on some projects on the Nile River Basin. Those have been summarised in this document in order to understand what has already been studied in the region and in
which directions the GRID-Geneva Nile River project should take.
Geographical Information Systems (GIS) and remote sensing techniques offer a wide range of
possibilities to work on a basin as huge and complex as the Nile Basin. Therefore, most of the international projects actually operating in the valley are using such techniques.
The first stage of the project consisted of the compilation of available geoferenced data sets for the Nile Valley region to be used as inputs for water balance modelling. It led to the elaboration of a first report2,
which offers an introduction to the GRID-Geneva Nile River Basin project. These data sets serve as inputs for water balance modelling, which was carried out with a view to identifying potentially critical
areas.
The widespread availability of digital elevation data via Internet and CD-ROM and advances in the
methods of processing them gives to everybody the possibility to extract the basin hydrographic
1 IPS, 1998. 2 Booth J., Jaquet J.-M., December 1998.

Water Sharing in the Nile River Valley
2 UNEP/DEWA/GRID-Geneva - DR
network of major river systems. A Digital Elevation Model (DEM) at a resolution of 30 arc seconds1,
constructed at the USGS using the Digital Chart of the World (DCW), has been used for the delineation of sub-watersheds. These can then be used to proceed to the water balance and modelling in the basin
with GIS programmes such as ArcView and Arc/Info.
By its size, physiography, political divisions, and history the Nile Basin is very complex. Therefore,
although there are several projects operating actually in the region, it is still difficult to obtain reliable data, at detailed scales. Probably this situation can also be find in other basins such as those facing
major freshwater related problems described in the next chapter of this document.
An extended biography research was made and is resumed in the first part of this report. During the
development of this project, there was a big evolution of the Environmental Systems Research Institute (ESRI )GIS softwares. It was rapidly realised, that such a project should then be developed with those
new products that were not available at that time at GRID-Geneva. Not all the objectives were therefore fulfilled.
This phase of the project was developed at GRID-Geneva 4 months (Januray-March 1999, January-June 2000 on a half-time basis). Acknowledgements to Mr. Dominique Del Pietro and Dr. Behnaz
Zand for their support.
1 http://edcwww.cr.usgs.gov/landdaac/gtopo30/gtopo30.html

Water Sharing in the Nile River Valley
UNEP/DEWA/GRID-Geneva - DR 3
PART I. DATA COMPILATION
1 WATER PROBLEMS
1.1 Water: quantity and quality
Water is a vital component of the Earth ecosystems, redistributing itself through natural cycles,
contributing to climate control and the hydrologic cycle. It ignores political boundaries, fluctuates in both space and time, and has multiple uses. It is essential for nutrition, food production, sanitation, and
economic production (recreation, power generation, transportation, etc.), and embodies symbolic and cultural value. Although it covers over 70% of our planet's surface, less than 3% consists of freshwater.
Most of this freshwater is either frozen in polar ice caps or stored underground.
Figure 1. Water Cycle1
Water has been a major factor in the rise and fall of great civilisations and a source of conflict and
tension between nations. The first great civilisations arose on the banks of large rivers. The Nile in Egypt, the Tigris-Euphrates in Mesopotamia, the Indus in Pakistan, and the Hwang Ho in China. All
1 FAO, 1995.

Water Sharing in the Nile River Valley
4 UNEP/DEWA/GRID-Geneva - DR
these civilisations built large irrigation systems and made the land productive, but collapsed when water
supplies failed or were improperly managed. The decline of the Sumerian civilisation of Mesopotamia, is believed to be due to prolonged droughts and poor irrigation practices resulting in salt build-up in the
soil. Similarly, the abandonment of Roman aqueducts, canals, and reservoirs in North Africa helped the region to return to desert condition.1
Human welfare and progress have been closely associated with access to freshwater. However, in this last century rapid population growth and human activities development interfered with hydrological
processes. Issues related to freshwater quantity and quality are becoming serious in many regions of the world. Arid and semi-arid regions face increasing stress from water scarcity, while most of the globe
faces growing pollution problems as a result of environmental change and lack of adequate management. The population of water-short countries was estimated to be 550 million in 1998 and is expected to
increase to 1 billion by the year 20102, while estimations on water quality pick out that 1 billion people do not have access to clean water, and 1.7 billion do not have sanitation3.
Africa has actually only a third per capita of the water that was available in 1960. This continent is, with Asia, the one where the water is scarce and where its quality is worst4. UNEP estimates that from now
up to the year 2027 almost a third of the world population will suffer from chronic water shortages. The consequences of this scarcity will largely be felt in the arid and semi-arid regions of the planet, and also
on rapid growing coastal regions and in the megacities of developing countries.5 Several of these cities are already or will soon be unable to provide their citizens in safe drinking-water and adequate
sanitation facilities.6
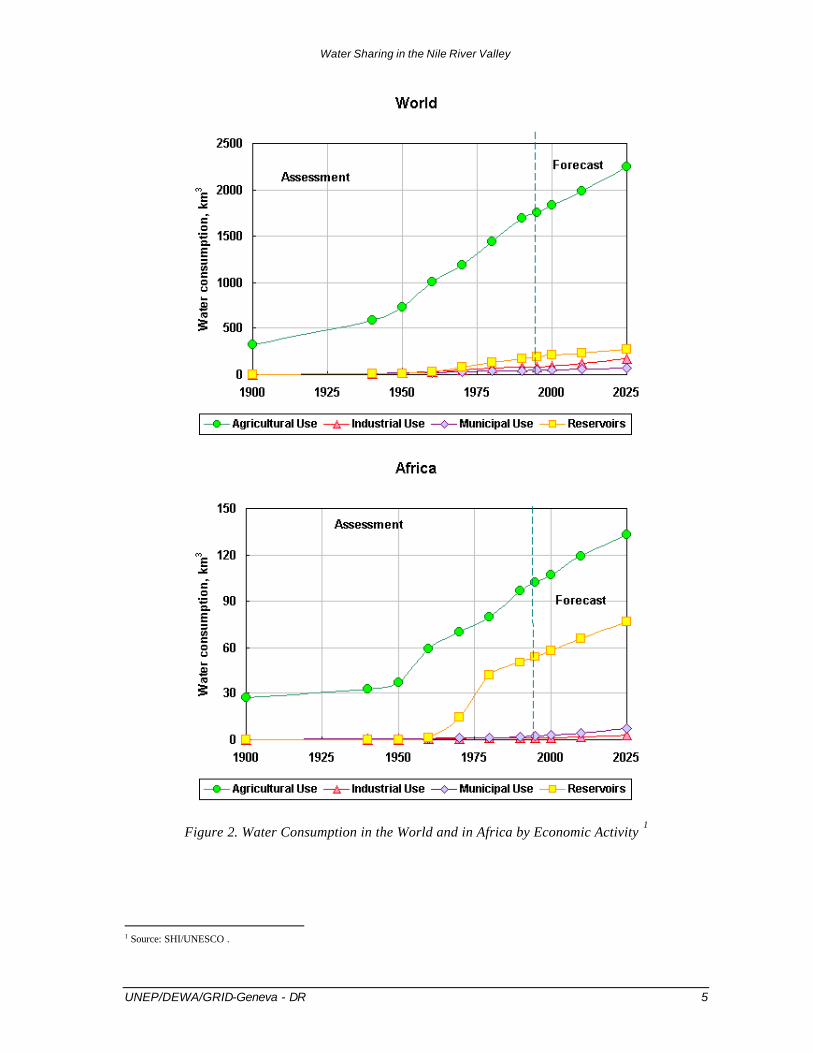
Agriculture is the largest consumer of water, using an average of 80 percent of total water consumption
in developing countries (figure 2). Irrigation direct contribution to world agricultural growth has been substantial, because both the irrigated area and the yield from it have expanded rapidly. However,
irrigation is extremely water intensive. It takes about 1,000 tons of water to grow one ton of grain and 2,000 tons to grow one ton of rice. Moreover water retained in irrigation canals is more and more
affected by eutrophication. In some countries pesticides are used to get rid of this vegetation, aggravating chemical contamination. Reservoirs created by the dams are favourable to the proliferation
and accumulation of this pollution. Modern civil engineering has guaranteed water supply to urban and rural areas, but it has accelerated the degradation of river deltas and has favoured the extinction of
species and wetlands.7
1 El-Ashry Mohamed T., 1998. 2 Topfer Klaus, 1997. 3 Briscoe, John and Harvey A. Garn. , 1995. 4 Nurul Islam, 1996. 5 Dowdeswell, Elizabeth., 1996. 6 Infomundi, March 1997. 7 Postel, Sandra, 1996.
Water Sharing in the Nile River Valley
UNEP/DEWA/GRID-Geneva - DR 5
Figure 2. Water Consumption in the World and in Africa by Economic Activity 1
1 Source: SHI/UNESCO .
Water Sharing in the Nile River Valley
6 UNEP/DEWA/GRID-Geneva - DR
Scarcity and pollution of water endanger health, social and economic welfare, food security and
biological diversity. Moreover, it worsens tensions and conflicts in and between nations.
1.2 Water issues
1.2.1 Policy and legacy
More than 300 water bodies are shared by two or more countries. These international water basins
occupy 47 percent of the world land area, excluding Antarctica1. The Food and Agriculture Organization (FAO) has identified more than 3,600 treaties relating to international water resources,
dating between 805 and 1984, the majority of which deal with some aspect of navigation.2 Since 1814, approximately 300 treaties have been negotiated which deal with non-navigational issues of water
management, flood control or hydropower projects, or allocations for consumptive or non-consumptive uses in international basins.
In the 20th century, only seven minor skirmishes have been waged over international waters. In contrast, almost 150 water-related treaties were signed in the same period. More than half of these treaties do
not include any monitoring provisions whatsoever, two-thirds do not delineate specific allocations, and four-fifths have no enforcement mechanism. Moreover, those treaties, which do allocate specific
quantities, allocate a fixed amount to all riparian states but one. That one state must then accept the balance of the river flow, regardless of fluctuations. Finally, basins shared by more than two countries
are, almost without exception, governed by bilateral treaties, precluding the integrated basin management long-advocated by water managers.3
International law on water is poorly developed, and only concerns itself with the rights and responsibilities of states. Some political entities who might claim water rights, therefore, would not be
represented, such as the Palestinians along the Jordan or the Kurds along the Euphrates.
1.2.2 Water crisis
In 1996, the then UNEP Executive Director stated that in the future, it was most likely that the
complaints and problems caused by the shortage of water supplies would be a cause of conflict amongst nations.4 The world is heading towards a water crisis in several regions, notably in the Middle East and
North Africa, where the available water per capita is 1,247 m3/year, one of the world’s lowest, compared to the 18,742 m3 in North America and with the 23,103 in Latin America. Africa has 19 of
the 25 countries in the world with the highest percentage of populations without access to safe drinking
1 Töpfer Klaus, 1997. 2 FAO, 1978, 1984. 3 Wolf Aaron T., 1997. 4 Dowdeswell, Elizabeth, 1996.

Water Sharing in the Nile River Valley
UNEP/DEWA/GRID-Geneva - DR 7
water. The availability of water in Africa is highly variable both in space and time. Precipitation over the
continent varies from practically zero over the Horn of Africa and the Namib Desert to more than 4,000 mm/year in Sudan's Western Equatorial region. A large proportion of the continent is semi-arid,
receiving between 200 and 800 mm/year of variable rainfall.
Figure 3. Water Stress in Africa1
Upstream nations see little benefit for stopping pollution or maintaining river flow regimes, and countries that share recharge areas for transboundary groundwater supplies see little benefit in protecting recharge
zones from physical degradation and from releases of toxic and hazardous chemicals. The issue of freshwater is now at the top of UNEP's agenda: “UNEP must be in the leading role in this sphere to
identify hot spots around the world and sound early warning bells in order to arrive at a better solution for the future”.2
1 Source: UNEP/GEO 2000. 2 UNEP News Release 1998/7; UNEP News Release 1998/9.

Water Sharing in the Nile River Valley
UNEP/DEWA/GRID-Geneva - DR 8
1.2.3 Water conflict prevention and resolution strategies
The Middle East and North Africa are regions plagued not only by lack of water but also by ancient
political tensions. While action and cooperation among the states are necessary in sectors other than water and the environment, water stands to become a tool which can enhance peaceful relations
between the parties. It is essential to reduce the demand for water by managing population size, enacting conservation measures, promoting awareness and adopting water-saving technologies and pricing
techniques, especially in agriculture. The private sector, non-governmental organisations, international agencies and national agencies can play a major part both as investors and as managers. In fact, it is the
common responsibility of all actors of society: businesses, governments, scholars, researchers and individuals, to contribute to the elaboration of numerous solutions.1
UNEP's strategy was to try to bring governments together as well as mediate the difficulties they are facing. They have done this with success in the Zambezi river basin, in the Lake Chad basin, and in
Lake Titicaca. Legal instrument has to lead to an action plan for joint cooperation among the governments where there is constant dialogue over how to tackle their problems and how to use their
resources.
As the flow of water totally ignores political boundaries, so does its management strain the capabilities
of institutional boundaries. While water managers generally understand and advocate the concept of a watershed as a unit of management, where surface and groundwater, quantity and quality, are all
connected, the institutions developed to manage the resource rarely follow these tenets.
It is obvious that no single discipline, be it law, economics, or engineering will provide all of the answers
for resolving water disputes.
1 Charrier Bertrand, Dinar Shlomi, and Hiniker Mike

Water Sharing in the Nile River Valley
UNEP/DEWA/GRID-Geneva - DR 9
2 NILE RIVER VALLEY
2.1 Generalities
The Nile is one of the world longest rivers, flowing south to north 6,850 kilometres, over 35 degrees of latitude (table 2). Its catchment basin covers approximately 10 % of the African continent, with an area
of 3 106 Km2, and spreads over 10 countries (table 3 & figure 4).
Table 1. World’s Major River Systems
River Length (Km)
Drainage Area (103 Km2)
Annual Discharge (109 m3)
Discharge/unit area (103 m3/Km2)
Nile 6,850 3,110 84 28
Amazon 6,700 7,050 5518 728
Congo 4,700 3,820 1248 326
Mekong 4,200 795 470 590
Niger 4,100 2,274 177 78
Mississipi 970 3,270 562 170
Danube 2,900 816 206 252
Rhine 1,320 224 70 312
Zambezi 2,700 1,200 223 185
The Nile basin, because of its size and variety of climates and topographies, constitutes one of the most
complex of all major river basins. However, the river's annual discharge is relatively small (28 103 m3
Km-2, table 2).

Water Sharing in the Nile River Valley
10 UNEP/DEWA/GRID-Geneva - DR
Figure 4. Nile River Countries
Table 2. Nile Basin repartition.
Country Country Area1 (km2)
Area within the Nile Basin2 (km2)
% of the total Nile Basin Area
% of the country in the Nile Basin
Burundi 27,835 13,260 0.4 47.6
DR Congo 2,345,410 22,143 0.7 0.9
Egypt 1,001,450 326,751 10.5 32.6
Eritrea 121,320 24,921 0.8 20.5
Ethiopia 1,127,127 365,117 11.7 32.4
Kenya 582,650 46,229 1.5 7.9
Rwanda 26,340 19,876 0.7 75.5
Sudan 2,505,810 1,978,506 63.6 79.0
Tanzania 945,090 84,200 2.7 8.9
Uganda 236,040 231,366 7.4 98.0
Total 8,919,072 3,112,369 100.0 34.9
The river is distinguished from other great rivers of the world by the fact that half of its course flows
through countries with no effective rainfall. Almost all the water of the Nile is generated on an area
1 Source: CIA World Factbook, 1999. 2 Source: FAO, 1997.

Water Sharing in the Nile River Valley
UNEP/DEWA/GRID-Geneva - DR 11
covering only 20 percent of the basin, while the remainder is in arid or semi-arid regions where the
water supply is minimal and where evaporation and seepage losses are very large.
Table 3. Water Resources and water availability per person in the Nile Basin countries (1995)1
Country
Internal Renewable Water Resources
(IRWR) (km3/year)
Actual Renewable Water Resources
(ARWR) (km3/year)
Dependency Ratio
%
IRWR per inhab. in 1994
(m3/inhab)
ARWR per inhab. in 1994
(m3/inhab)
Burundi 3.6 3.6 0.0 579 563
DR Congo 935.0 1019.0 8.2 21,973 23,211
Egypt 1.7 58.3 96.9 29 926
Eritrea 2.8 8.8 68.2 815 2,492
Ethiopia 110.0 110.0 0.0 2,059 1,998
Kenya 20.2 30.2 33.1 739 1,069
Rwanda 6.3 6.3 0.0 833 792
Sudan 35.0 88.5 77.3 1,279 3,150
Tanzania 80.0 89.0 10.1 2,773 2,998
Uganda 39.2 66.0 40.9 1,891 3,099
For some countries, as DR Congo, the Nile water is only a small part of their total water resources.
Other countries, as Burundi, Rwanda, Uganda, Sudan and Egypt, are completely dependent on the Nile River for their water resources. While all the water in Burundi and Rwanda is generated inside the
countries’ , most of the water resources of Sudan and Egypt are originate outside their borders (table 4).
Philosophers and savants from ancient Egypt discussed on the Nile source and flow. But from the second half of the second century for at least thirteen centuries, when Portugal triumphed against the
Moors, there were hardly any discoveries on this topic. The river became an interest for many explorers in the nineteenth century, with the invasion of Sudan by Mohamed Ali Pasha and his sons.
It is through the Nile that Islam penetrated in Africa and put an end to the Christian kingdom of Nubia, in 1316. It is also through the Nile that the armies of Mohamed Ali invaded Sudan. It is always through
the Nile that England, thereafter, extended its colonial empire to the borders of East Africa.
The dream of an “Africa of the Nile” of last century explorers’ was not carried out: the Horn of Africa
and the area which prolongs it to the South remain strongly divided and tormented. The conflicts in the continent cause population displacements on a large scale, used by governments as means of pressure
on other States (see table 5). Within the framework of universalisation the “Africa of the Nile” is now of actuality.
1 Source: FAO.

Water Sharing in the Nile River Valley
12 UNEP/DEWA/GRID-Geneva - DR
Table 4. Refugees per country in the Nile Basin1
Country Total number of refugees from other
countries
Refugees outside the country
Burundi 22,100 525,400
DR Congo 285,300 120,000
Egypt 6,600 -
Eritrea 3,000 345,600
Ethiopia 257,700 51,000
Kenya 223,700 -
Rwanda 34,400 40,000
Sudan 391,000 467,700
Tanzania 622,200 -
Uganda 218,200 -
Total 2,025,000 1,279,000
2.2 Physiography
The shape of the Nile we know today is a very recent development. The present day river is complex and is the result of the interconnection of several independent basins by rivers which developed during
the last wet period which affected Africa after the retreat of the ice of the last glacial age, some 10,000 years ago. The basins which constitute part of the present river were disconnected, forming
internal lakes. At times when the climate was wet, they overflowed their banks and became connected to other basins. At other times, when the climate was very dry, they ebbed, shrank into saline pools or
dried altogether. The basins stand out in the longitudinal section of the river, as flat stretches or landings with very little slope, which are connected today with rivers, which have considerably steeper slopes.2
1 Source: UNHCR website, 2000. 2 Said R., 1993.
Water Sharing in the Nile River Valley
UNEP/DEWA/GRID-Geneva - DR 13
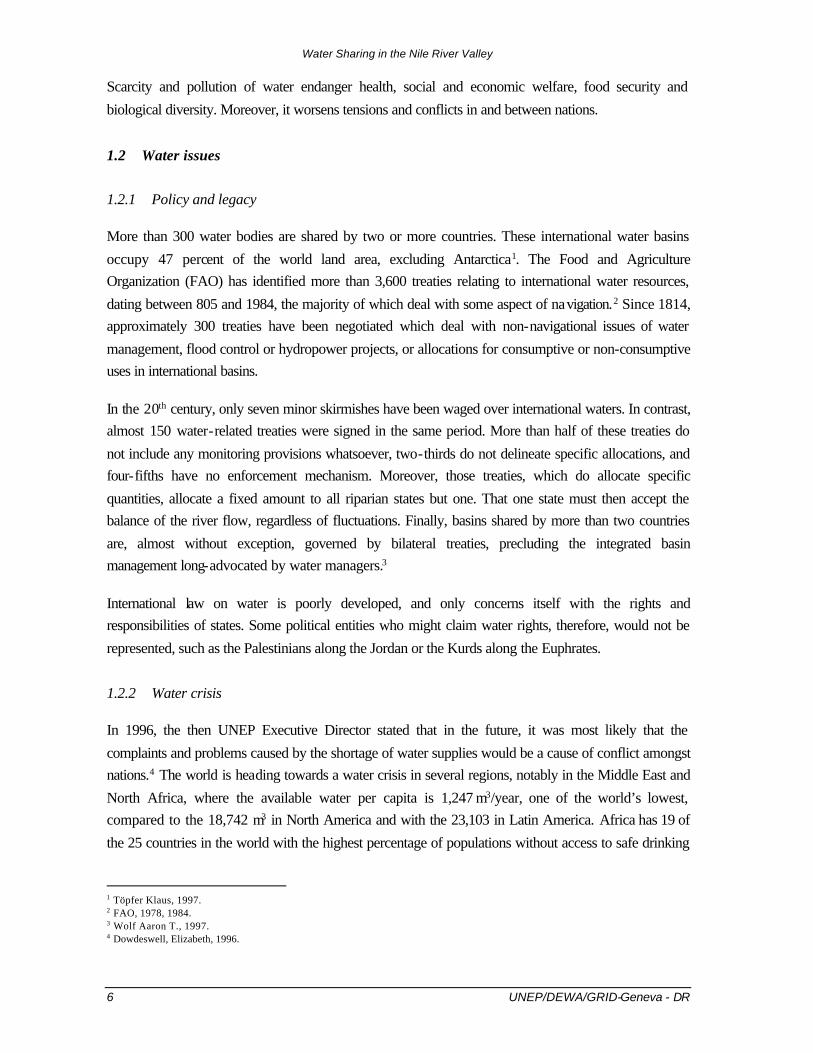
Figure 5. Nile River Profile from the Kagera measure station to the sea1
The Sudd basin is one of the old basins which evolved, like other mainly interiorly drained basins of that
continent, as a result of the extended history of erosion which affected the elevated lands of Africa.
The basin of the Nile is characterised by the existence of two mountainous plateaus rising some
thousands of meters above mean sea level. The Equatorial or Lake Plateau in the southern part of the Nile basin, situated between the two branches of the Great Rift, is at a level of 1,000 to 2,000 metres
and has peaks of 5,100 and 4,300 metres. This plateau contains Lakes Victoria, George, Edward (Mobutu Sese Seko) and Albert, which slope gently toward the north at an average rate of one meter
for every 20 to 50 km of stretch. In contrast the rivers which connect these lakes fall at an average rate of one meter every kilometre or less of length. The Ethiopian or Abyssinian Plateau, which forms the
eastern part of the basin, has peaks rising to 3,500 metres. North of the Lake plateau the basin descends gradually to the Sudan plains where the Nile runs at altitudes lower than 500 m in its northerly
direction. About 200 km south of the Egyptian border the river cuts its channel in a narrow trough bounded from each side by the contour line of 200 m ground surface level. Almost 200 km before
discharging into the sea, the river bifurcates and its two branches encompass the Nile Delta.
The enormous Sudd and Central Sudan basins extend for a distance of 1,800 km from Juba to
Khartoum and form a gently sloping region with a small rate of slope of one meter for every 24 kilometres of stretch.
The basin of the present-day Nile can be divided into six major regions: the Lake Plateau, the Sudd, the White Nile, the Ethiopian Plateau, the Main Nile and the Nile Delta.
1 Extracted form the DEM.

Water Sharing in the Nile River Valley
14 UNEP/DEWA/GRID-Geneva - DR
Figure 6. Nile Basin Topography
2.2.1 The Lake Plateau
The most upstream tributary of the Nile and the most important feeder of Lake Victoria is the River Kagera . This river basin is mountainous country, covering Burundi, Rwanda, Tanzania and Uganda.
The greater part of it is situated between 1,200 and 1,600 metres levels, but in the west the country level is at 2,500 meters and rises to about 4,500 metres to form the peaks of the Mufumbiro Range.
The Kagera basin is a complex of rivers and streams of varying order which are intercepted and

Water Sharing in the Nile River Valley
UNEP/DEWA/GRID-Geneva - DR 15
interconnected by lakes and swamps. Its discharge is rather low because of the swamps and lakes
which exist in the basin and the considerable length of streams flowing in it.1
Figure 7. Map of the Lake Plateau Area
Lake Victoria , the largest lake in Africa, is a depression with a surface of about 69,000 km2, at a level
sea of 1,134 metres. The average depth of the lake is of 40 m, with a maximum depth of 79 m. The lake catchment is divided between five countries: Burundi, Kenya, Rwanda, Tanzania and Uganda.
Three sources contribute to the net supply of Lake Victoria: the outflow of River Kagera, the direct precipitation on the lake surface and the direct runoff of the land portion of the catchment.
The Upper Victoria Nile is the only outlet of Lake Victoria. The river is about 130 km long and the difference in level between its inlet and outlet is about 105 m. Since 1952 the Nile has been leaving
Lake Victoria through the turbines of the power plant annexed to the Owen Dam, built at the foot of the Owen Falls. The width of the water surface in the Upper Victoria Nile varies from 300 to 600 m.
1 Sahin Mamdouh, 1985.

Water Sharing in the Nile River Valley
16 UNEP/DEWA/GRID-Geneva - DR
Lake Kyoga is a shallow depression consisting in of a number of arms, many of which are filled with
swamp vegetation. The lake has an area of 6,270 km2. Its depth is from 3 to 7 metres. In spite of the almost 1,300 mm yearly rainfall, the excessive evapotranspiration from the swamps covered with
cyperus papyrus and water lilies and the insignificant supply brought by many of the rivers draining into the lake the loss of water is very high.1
The Lower Victoria Nile leaves Lake Kyoga at Port Masindi and runs as a sluggish swampy river to the north for about 75 km. There it bends westwards and after a succession of rocky rapids descends
the Murchison (Kabalega) Falls and shortly afterwards enters Lake Albert trough a swampy delta. On the west of the Lower Victoria Nile there is a large system of swamps with a drainage entering the Nile
by the Kafu river, but its contribution may be considered negligible, except after heavy rains. The difference in water level in the Lower Victoria Nile is almost 410 metres.
The chain formed by Lakes Albert, Edward and George forms a part of the Great Rift Valley.
Lake Albert (Mobutu-Sese Seko) has a surface area of 5,300 km2 corresponding to an elevation of
617 metres. The depth of the water reaches 50 metres at some places in the lake. The runoff from the lake drainage basin plus the direct precipitation on the lake itself are all lost by evaporation from the lake
surface. The net gain comes from the inflow of River Semliki, which enters the lake from the south-west.2
The Semliki River connects Lake Edward to Lake Albert, after flowing distance of about 250 km down the Rift Valley to the west of the Ruwenzori Mountain. The difference in water level is
295 metres. Most of the drop takes place over the rapids which exist in the upper of the river course. In the lower part the river has a width of 150 m in flood reduced to 50 m at low stage. The average depth
of water in these two seasons is 5 m and 3 m respectively.3
Lake Edward lies in the western Rift Valley, at an altitude of about 2,200 km.2 The lake basin is
traversed by a number of streams often fringed by thick forest at their low ends. The lake is connected to Lake George by the Kazinga channel, which is practically only a carrier.
Lake George is situated on the equator and its surface area at an elevation of 915 metres is 300 km2. It is drained by a number of streams flowing down from the Ruwenzori into the swamps at the northern
end of the lake. The principal tributary, the Mbuku, carries a considerable flow during the flood.
1 Sahin Mamdouh, 1985. 2 Sahin Mamdouh, 1985. 3 Sahin Mamdouh, 1985.

Water Sharing in the Nile River Valley
UNEP/DEWA/GRID-Geneva - DR 17
2.2.2 Sudd and Central Sudan Basin
The Nile flows out of Lake Albert at the extreme north corner of the lake under the name of the Upper White Nile or Bahr el Jebel. From the outlet of Lake Albert down to the Nimule, 225 km
downstream, the river is rather broad, sluggish, stream fringed with swamps and lagoons. It meanders east and west through a narrow flood plain between hilly country on either side so that the area of the
swamp is well defined. The area occupied by the swamps and open water is estimated at about 380 km2. It is not a deep river and its width varies from 100 to 300 m. A number of small streams join
the Bahr el Jebel from both sides in this reach.
Figure 8. Map of the Sudd and Central Sudan Basin
In the reach between Nimule and Rejaf, a distance of about 156 km, the river is a narrow and fast
stream interrupted by rocky rapids. The river flows into a narrow valley cut through hilly country and descends about 150 m.
In the reach from Nimule to Mongalla the Bahr el Jebel receives a number of small but torrential streams which run full after heavy rains. They carry some flow even in the dry season.
In the reach from Rejaf to Malakal the river is not confined to a single channel except at Mongalla where it is one channel at low stage. Between Rejaf and Bor, a distance of about 180 km, the valley is
wide and flat and there is usually a channel on either side along the higher ground while occasional

Water Sharing in the Nile River Valley
18 UNEP/DEWA/GRID-Geneva - DR
channels cross the swampy valley floor. The distribution of the swamp vegetation on flood plain in the
reach between Juba and Bor is controlled by seasonal flooding.
North of Bor the Valley widens and becomes more swampy, while the sides are less defined. Extensive
swamps spread out on either side of the river and continue down to Lake No. This region is known as the Sudd. North of Kenisa, about 85 km downstream of Bor, dry land can hardly be seen. The river
flows northwards between walls of papyrus and tall grasses reaching 4 or 5 m in height. These plants have their roots in water and the river bank is partially formed of masses of roots of former vegetation.
There are many patches of open water alongside the river north of Bor, many of which are connected directly with the river or with the side channels. North of Ghaba Shambe, some 140 km from Bor, the
swamps are wide and the plain is full of vegetation and lagoons. Because of the high rate of loss of water from the Sudd region and the vast area from which this loss takes place, the total loss in average
year amounts to approximately half of the total flow at Mongalla. In an attempt to transport the water in this region with less loss, the Bahr el Zaraf was joined to the Bahr el Jebel by two cuts of distances of
106 to 112 km from Shambe. These two cuts and the channel which runs between them are so heavily blocked with vegetation that their efficiency in reducing the transmission losses in the swamps is
questionable. Between the two cuts and Lake No in the north there are occasional isolated spots of high ground, compared to the surrounding swamps. At Lake No the Bahr el Ghazal joins the Bahr el Jebel
and the combined stream turns abruptly to the east, bearing the name "White Nile". Here the swamps end.
The Bahr el Zaraf has a winding course of about 280 km in length to its mouth on the White Nile some 80 km from Lake No. In the neighbourhood of the Jebel-Zaraf cuts and for a long way north, the Zaraf
flows through swamp, winding about forming lagoons in its bends like the Bahr el Jebel. The edges of the Bahr el Zaraf are swampy in places as far north as kilometre 100, from the mouth. The banks
gradually become high as one goes northwards until they form definite boundaries limiting the Zaraf to a narrow channel.
The Bahr el Ghazal is the river flowing from Meshra el Req to Lake No. The length of the stream does not exceed 160 km, but the size of its basin is by far the largest of any of the sub-basins of the
tributaries of the Nile River. Only 1/1000 of the rainfall on the basin reaches the basin outlet at Lake No. All along the river and to the south and east of it, there are large areas of swamp which are fed by a
number of streams. The country where the upper course of these streams flow is entirely covered by a sort of savannah forest. In the ravines formed by the streams there is a thick forest similar to the tropical
rain forest of parts of the Lake Plateau. On the lower courses of all the tributaries of the Bahr el Ghazal and along the Ghazal itself are large areas of swamps. Most of the flow carried by the tributaries is lost
in those. On either side of the Uganda-Sudan border that coincides with the division between the Nile and the Congo Basins, numerous streams arise. Most of them descend to a large swampy plain in which
they wind and finally spread and cease to exist as streams with definite courses, except for the Jur, which preserves its channel and joins the Bahr el Ghazal. The lower Ghazal is fringed by papyrus,
though its growth is stunted and less luxuriant than on the Jebel. The many temporary streams which join

Water Sharing in the Nile River Valley
UNEP/DEWA/GRID-Geneva - DR 19
the Ghazal on both sides are usually blocked and therefore cannot contribute much water. Lake No is
nothing but a large shallow lagoon, where the sluggish Bahr el Ghazal joins the Bahr el Jebel after having a tremendous volume of water wasted in the vast swamps.
2.2.3 White Nile
The stretch of the Nile from lake No down to its junction with the Blue Nile is known as the White Nile. This river has an extremely flat slope. In the upper 120 km from Lake No to the mouth of the Sobat
River, there are several swamps, khors and lagoons. In the remaining 800 km, from Malakal to just upstream Khartoum, the channel of the White Nile is almost free of swamps. The drainage basin of the
White Nile extends from the foothills of the lake plateau in the south to the junction of the White and Blue Nile up north and from the foothills of the Abyssinian Plateau in the east to the Nile-Congo basins
division in the south-west and the Nuba Mountains in the west.
Figure 9. Map of the White Nile
From Lake No to the mouth of the Sobat river , the Nile flows in an undefined vegetated course through a plain with a width of 1 km at Malakal. From the mouth of the Sobat to the north of Kosti the width of
the depression between the river banks increases from 3 to 4 km, whereas the width of the river channel itself is between 300 and 400 km. North of Malakal up to its junction with the Blue Nile , the river flows
in a well-defined channel or channels.

Water Sharing in the Nile River Valley
20 UNEP/DEWA/GRID-Geneva - DR
2.2.4 Ethiopian Plateau
The three major tributaries of the Nile which emanate from the Ethiopian Highlands, the Sobat, the Blue Nile and the Atbara are highly seasonal rivers with a ratio of peak flow to low flow of about forty to
one.
Figure 10. Map of the Ethiopian Plateau

Water Sharing in the Nile River Valley
UNEP/DEWA/GRID-Geneva - DR 21
The Sobat River basin includes most of the plain east of the Bahr el Jebel and Bahr el Zaraf and parts
of Abyssinian Mountains and Lakes Plateau. Due to the large size of the basin area and the diversity in its topography, the annual rainfall varies about 650 mm near the mouth of the Sobat, to about 2000 mm
in the most elevated parts of the basin eastwards. The Sobat River is formed by the junction of its two main tributaries, the Baro and the Pibor. The Baro, claimed to be the principal feeder of the Sobat, is
formed by a number of streams which in some places flow through deep gorges in their descent from the plateau. The Pibor draws the greater part of its supply from Abyssinia and the rest from the northern
slopes of the Lake Plateau and from the Sudan plains. Its slope is very flat compared to the Baro and has consequently more chance of forming large swamps and evaporating the water thereof. From the
Baro-Pibor junction to the mouth of the Sobat, the country is a flat plain intersected by swampy depressions of temporary streams which run full during and after rainfall, that can be of a torrential
nature (known as khors). The Sobat has a winding course and its surface width near the mouth varies from 100 m or less in the low-flow period to more than 150 m in flood time, the depth of water is about
3,5 to 6,5 m respectively.
The Blue Nile and its tributaries all rise on the Ethiopian Plateau at an elevation of 2,000 to
3,000 metres. The source of the Blue Nile is a small spring at a height of 2,900 m and at about 100 km south of Lake Tana (maximum length of 78 km, width 67 km and depth 14 m). Most of the Ethiopian
Plateau country is hilly with grassy downs, swamps valleys, and scattered trees. The high country is cut up by deep ravines or canyons in which the rivers flow. In some places the Blue Nile flows in a channel
that is about 1,200 m below the level of the country on either side.
Numerous rock-outcrops occur in the river bed, the last of which are a few kilometres south of
Roseires, some 1,000 km from its source beyond Tana and known as the Damazin Rapids. The Blue Nile emerges from the Plateau close to the western border of Ethiopia, where it runs north-west and
enters the Sudan at an altitude of 490 m. Just before crossing the frontier, the river enters the clay plain, through which it flows to Khartoum. At this point, the Blue Nile joins the White Nile to form the main
stem of the Nile River. The area bounded of these two rivers is known as the Gezira Plain.
The Atbara River, last tributary of the Nile, is a strongly seasonal river which enters the Main Nile at
about 320 km downstream Khartoum. It is 880 km long and the greater part of its catchment is situated in Ethiopia and Eritrea. The highest points in the catchment reach more than 3,500 m, whereas the
eastern watershed of the Atbara is, for the most part, more than 2,500 m high. The river relies totally on many small tributaries, of which Takazze or the Setit is the principal one. Above the Setit junction, the
Atbara receives a number of tributaries of which the Bahr el Salam is the principal. The Atbara is more strongly seasonal in its flow. The big elevation between the head and the junction of the Salam River is
responsible for the excessive sediment load of the Atbara in proportion to its flow volume.

Water Sharing in the Nile River Valley
22 UNEP/DEWA/GRID-Geneva - DR
2.2.5 Main Nile
At Khartoum the Blue Nile joins the White Nile and the combined waters flow for 1,885 km to Aswan through a region of Nubian sandstone overlying an old eroded land surface of crystalline rocks, which
has been laid bare at places in the course of the still incomplete river bed degradation. These crystalline rocks offer a much greater resistance to the river’s action than does the softer Nubian sandstone.
Upstream, in the place where rocks are exposed, degradation ceases, while the river cuts its way through the rocky rapids, called the Cataracts, where the slope is greater and the flow more turbulent.
The rapids themselves are caused by bars of hard rock crossing the course of the river. Here the river deposits no flood plains. Cultivation, therefore, is confined to those few stretches where natural
conditions permit irrigation.
The first storage work in the Nile Valley, the old Aswan Dam, was build in 1902, at the foot of the
Aswan Cataract. It was heightened twice, once in 1912 and the second time in 1934. This dam, together with the other storage works on the Blue and White Niles, have changed the Nile from Aswan
to the sea into a partially regulated river instead of a naturally flowing one. Full regulation has almost been achieved with the formation of Lake Nasser upstream of the high dam at Aswan in 1965. This
huge artificial impoundment of the Nile water extends from Aswan to a little south of the Dal Cataract.
In its natural condition, the length of the river from Aswan to the Delta barrages was 968 km in the low-
flow season and 923 km in the flood season. The mean width was about 900 m and the mean velocity between 1 to 2 m/s.
From Cairo to a little south of Luxor, the cultivated land is usually several kilometres wide but towards Aswan it narrows to about one kilometre and in places the desert hills are close to the river.
Perennial irrigation in Egypt has become possible only after the construction of a number of dams on the Nile and its branches. The old Delta barrages were completed in 1861 and the new ones in 1939. The
surface of the cultivated land in both the Nile Valley and the Nile Delta amounts to only 3% of the total surface area of Egypt. The eastern and the western deserts occupy 23 and 74%, respectively. The
eastern desert is rugged and mountainous and is frequently cut by deep valleys, down which occasional heavy rains cause torrents to flow. The western desert is lower and more undulating, but is nevertheless
sharply divided from the Nile Valley, because cultivation ceases as soon as the ground begins to rise above the level which can be flooded by the Nile water. There are a number of oasis in the western
desert. These are depressions where the ground level is near the water level, which is easily reached by wells.
The Fayum is a depression situated about 70 km south of Cairo and separated from the Nile Valley by a narrow strip of desert. This depression gets its water via a canal from the Nile, whereas the oasis are
supplied by groundwater, and the land has a considerable slope. The bottom of the El-Fayum depression is filled by Lake Qarum and most of the remainder is cultivated. The lake has no outlet and

Water Sharing in the Nile River Valley
UNEP/DEWA/GRID-Geneva - DR 23
receives the drainage water form the cultivated land. Its level, kept fairly constant by evaporation
balancing the inflow, makes its water steadily more saline.
Figure 11. Map of the Main Nile Area

Water Sharing in the Nile River Valley
24 UNEP/DEWA/GRID-Geneva - DR
The Nile north of Cairo bifurcates into the Rosetta and Damietta branches.
2.3 Climate
There is evidence of some climatic changes in the Nile Basin.
Whereas the Nile basin in Sudan and Egypt is rainless during the northern winter, its southern parts and
the highlands of Ethiopia experience heavy rain (more than 1,500 mm during the northern summer). Most of the region falls under the influence of the north-east trade winds between October and May,
which causes the prevailing aridity of most of the basin.
Tropical climates with well-distributed rainfall are found in parts of the East African lakes region and
south-western Ethiopia. In the lake region, there is little variation throughout the year in the mean temperature, which ranges from 16º C to 27º C depending on locality and altitude. Relative humidity,
which varies similarly, is about 80 percent on the average. Similar climatic conditions prevail over the extreme southern parts of Sudan, which receive as much as 1,270 mm of rain spread over a nine-month
period (March to November), with the maximum occurring in August. The humidity reaches its highest at the peak of the rainy season and its low level between January and March. Maximum temperatures
are recorded during the dry season (December to February), with the minimums occurring in July and August.

Water Sharing in the Nile River Valley
UNEP/DEWA/GRID-Geneva - DR 25
Table 5. Rainfall Average in the Nile Basin 1
Country
Average Rainfall in the
Basin Minimum (mm/year)
Average Rainfall in the
Basin Maximum (mm/year)
Burundi 895 1,570
DR Congo 875 1,915
Egypt 0 120
Eritrea 540 665
Ethiopia 205 2,010
Kenya 505 1,790
Rwanda 840 1,935
Sudan 0 1,610
Tanzania 625 1,630
Uganda 395 2,060
To the north, the rainy season gets shorter, and the amount of rainfall decreases. The rainy season,
which occurs in the south from April to October, is confined to July and August in the northern part of the central Sudan, where three seasons may be distinguished. The first of these is the pleasant, cool, dry
winter, which occurs from December to February; this is followed by hot and very dry weather from March to June; and this is followed, in turn, by a hot rainy period from July to October. The minimum
temperature occurs in January and the maximum in May or June, when it rises to a daily average of 41º C in Khartoum. Only about 250 mm of rainfall occurs annually in the Al-Jazirah area (between the
White and Blue Nile rivers), as compared with more than 530 mm at Dakar, Senegal, which is at the same latitude. North of Khartoum less than 127 mm of rain falls annually, an amount insufficient for
permanent settlement. In June and July, the central parts of Sudan are frequently visited by squalls, during which strong winds carry large quantities of sand and dust.
2.3.1 Desertification
The Nile River countries are suffering from the effect of desertification, land degradation and droughts.
A desert-type climate exists over most of the remainder of the area north to the Mediterranean. The
principal characteristics of the northern Sudan and the desert of Egypt are aridity, a dry atmosphere, and a considerable seasonal, as well as diurnal, temperature range in Upper Egypt. Temperatures often
exceed 38º C; in Aswan, for example, the average daily maximum in June is 47º C. While no low temperatures are recorded anywhere in Sudan or Egypt, winter temperatures decrease to the north.
Thus, only Egypt has what could be called a winter season, which occurs from November to March,
1 FAO, 1997.

Water Sharing in the Nile River Valley
26 UNEP/DEWA/GRID-Geneva - DR
when the daily maximum temperature in Cairo is 20º to 24º C and the night minimum is about 10º C.
The rainfall in Egypt is of Mediterranean origin and falls mostly in the winter, with the amount decreasing toward the south. From 203 mm on the coast, it falls gradually to a little over 3 mm in Cairo and to less
than 3 mm in Upper Egypt. During the spring, from March to June, depressions from the Sahara or along the coast travel east, causing dry southerly winds, which sometimes results in a condition called
"khamsin". These are sandstorms or dust storms during which the atmosphere becomes hazy.
2.4 Hydrology
2.4.1 Main studies
To ensure the continuity of the knowledge of the hydrology of the Nile Basin and to present the data in a
systematic way, the volume and supplements of "The Nile Basin" were issued (Hurst et al. 1931-1972). These volumes have been employed in the design and construction of the major hydraulic works on the
Nile and its branches and tributaries.
The periodic rise of the Nile remained an unsolved mystery until the discovery of the role of the tropical
regions in its regime. In effect, there was little detailed knowledge about the hydrology of the Nile before the 20th century, except for early records of the river level that the ancient Egyptians made with the aid
of nilometres (gauges formed by graduated scales cut in natural rocks or in stone walls).
2.4.2 Hydrographic Network
The water of the Nile comes from two sources, the Equatorial Plateau and the Ethiopian Highlands,
both of which receive large quantities of rain.
The actual river came into being as a result of the interconnection of several independent basins and their
integration into one river, during the last wet phase which affected Africa, after the retreat of the ice of the last glacial some 10,800 years ago. The wet phase brought enough water for the basins to overflow
their banks and join other basins, thus forming a flowing river of multiple sources and large catchment area. As long as the wet phase lasted the river's flow was considerably larger than today. Since the end
of the wet phase and the southward shift of the monsoonal rain front some 4,400 years ago, the flow of the river has tended to decline and to show great fluctuations. It decreased from above 100 billion cubic
meters a year to about 90 billion cubic meters after the mid years of the first millennium A.D.
Water Sharing in the Nile River Valley
UNEP/DEWA/GRID-Geneva - DR 27
6
7
8
9
1011
12
13
14
18
19
20
21
22
23
24
25
26
29
31
57
68
68
8
10
65
38
35
44
2828
32
3210
139
24
46
46
38
L. Asswan
Lake Tana
L. Roseires
L. KyogaL. Albert
L. Victoria
Atbara
Blue N.
Blue N.
Sobat
Victoria N.
Wh
ite N
ileW
hite
Nile
Lower Nile
Low
er N
ile
-11
-5
+3
-2
-9
-1
-4
-5
-22?
+12
0
0
38
-5
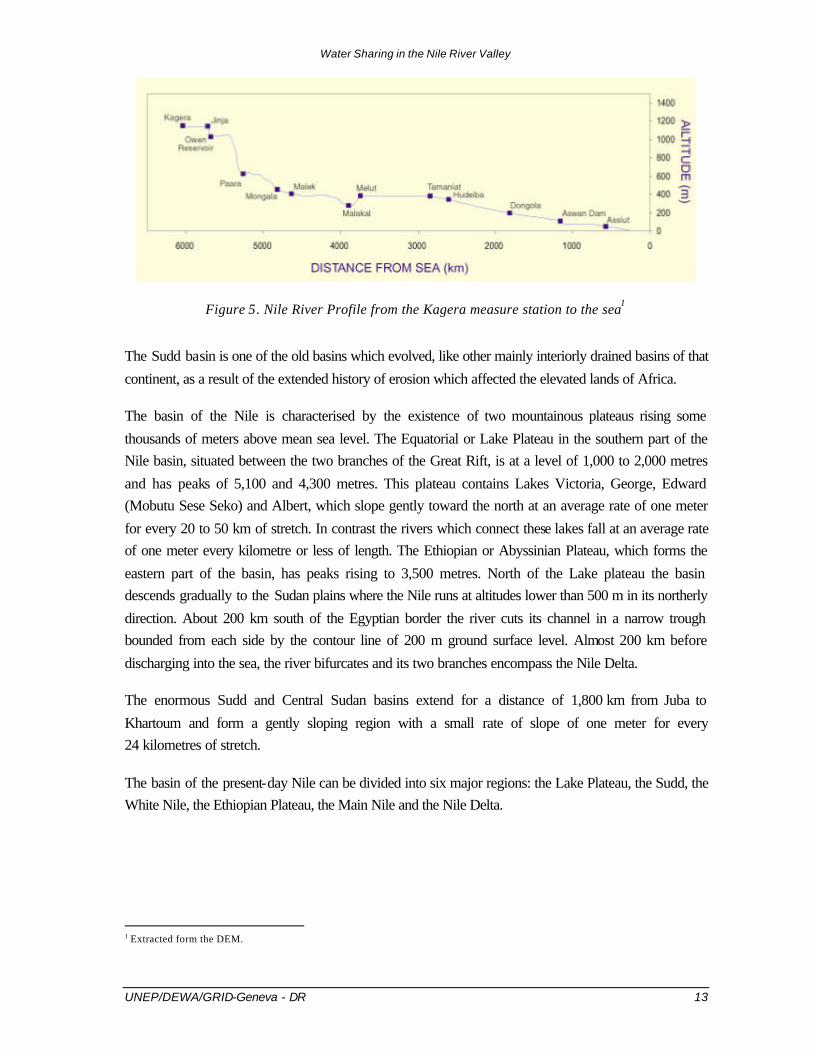
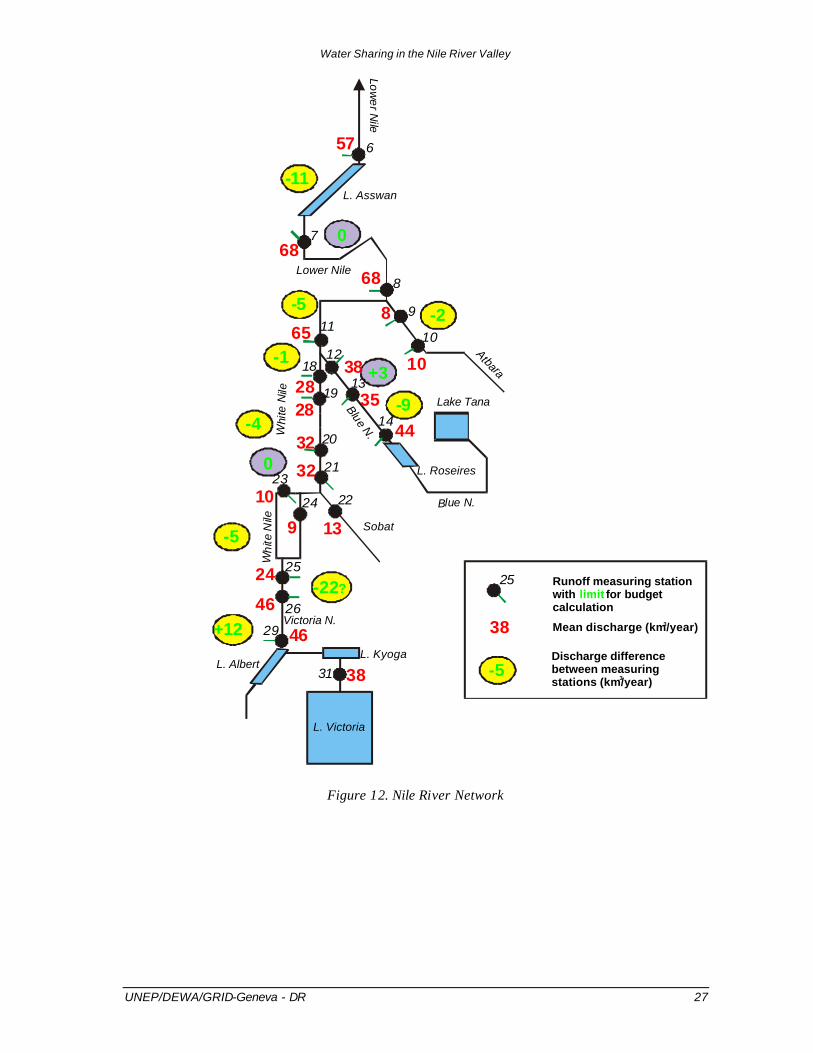
25 Runoff measuring stationwith for budgetcalculation
limit
Mean discharge (km/year)3
Discharge difference between measuring stations (km/year)3
Figure 12. Nile River Network

Water Sharing in the Nile River Valley
28 UNEP/DEWA/GRID-Geneva - DR
2.4.3 River Regime
The principal feature of the Nile River's hydrological regime below the Aswan High Dam is the annual
flood. In the northern Sudan, the river usually begins to rise in May, reaches its maximum level in August, and decreases thereafter, having a low level from January to May. Although the flood is a
regular phenomenon, it varies in both its volume and in its date of onset. The flood is caused by the Blue Nile and Atbara rivers, the waters of which come from heavy seasonal rainfall on the Ethiopian Plateau.
The Ethiopian Plateau contributes then to more than 80 percent of the Nile's total water supply, while the remainder comes from the Lake Plateau of East Africa. During the season when the river's water
level is low, the White Nile becomes the most important stream.
Table 6. Variations in discharges on the Nile
Location Average annual discharges in km3
1961-1970 1948-1970 1912-1982
Lake Victoria exit 41.6 29.4 27.2
Lake Kyoga exit 44.1 30.1 26.4
Lake Albert exit 48.8 33.7 31.4
Mongalla (White Nile) 52.6 36.8 33.1
Malakal (White Nile) 37.8 31.6 29.6
Khartoum (Blue Nile) 45.9 49.8 50.1
Mouth of the Atbara 10.9 12.1 10.6
Dongola (Nile) 86.2 86.2 82.7
The immense fertility of the land of Egypt is due entirely to the annual inundation of the Nile which regulated by an elaborate system of canals and dams, was distributed over the fields renewing the soil
year by year with a fresh deposit of mud.1 Prior to the construction of the great irrigation works of the nineteenth and twentieth centuries in Egypt and Sudan, the inundation level of the Nile in these two
countries used to pass through a regular cycle which was always watched by the inhabitants with great anxiety. If it fell short or exceeded a certain height, death and famine, or over-flooding and destruction
were the inevitable consequences. After the beginning of the rainy season in Ethiopia, the river started rising early in June and gradually swelled to its maximum by the end of September. The country was
1 Said, Rushdi, 1993.

Water Sharing in the Nile River Valley
UNEP/DEWA/GRID-Geneva - DR 29
then submerged and presented the appearance of a sea of turbid water from which the towns and
villages, built on higher ground, rose like islands. For about one month the flood remained nearly stationary, then subsided more and more rapidly till, by December or January, the river returned to its
ordinary bed. With the approach of the summer the level of the water continued to fall. In the early days of June the Nile was reduced to its ordinary breath, and seemed a mere continuation of the desert.
2.4.4 Losses
Only a fraction of the rain falling on the watershed is channelled through the river to its downstream part and then to the sea. A large part is lost through seepage, evapotranspiration and overbank flows to the
swampy lands that fringe the basin in many parts and especially in its equatorial stretch. It is difficult at the present state of knowledge to quantify the water balance of the total basin of the Nile. Large
quantities of water are lost in both the Bahr el Ghazal and the Sobat basins.
In addition to those losses, the carrying capacity of the main rivers which transmit the waters of the Nile
to its downstream part and the sea are limited. The cross sections of the White Nile, the downstream part of the Blue Nile, and the Main Nile to the north of Khartoum are such that they allow but a limited
quantity of water to pass, spilling over the banks whatever additional water reaches them. It would seem that the present-day regime of the river is not carrying beyond Atbara more than 150 billion cubic
meters of water per year.
Variations in rainfall over the years can cause quite considerable variations in discharges and lake levels.
This seems to be more explicitly the case for the White Nile River system. 1
2.4.5 Lakes and Reservoirs
The Nile Basin includes several lakes and artificial reservoirs (see table 8).
1 FAO, 1997.

Water Sharing in the Nile River Valley
30 UNEP/DEWA/GRID-Geneva - DR
Table 7. Nile Basin Dams
Name Country Year of Completion
Utilisation River Original Storage Capacity
Km3
Present Storage Capacity
Km3
Height
m
Owen Falls Uganda 1954 storage, hydroelectric plant
Victoria Nile 2,700,000,000
Aswan High Egypt 1970 Nile 168,900,000
Jebel Aulia Sudan 1937 Regulate Flow White Nile 3.22 2.54
Sennar Sudan 1925 Irrigation, hydroelectric power
Blue Nile 0.93 0.37
Roseires Sudan 1966 irrigation Blue Nile 3.35 2.23
Khashm El Girba Sudan 1964 irrigation Atbara 1.30 0.56
a) Lake Victoria
Lake Victoria is the biggest African lake. Plans for gradually raising the level of the lake's waters were completed in 1954 with the construction of the Owen Falls Dam on the Victoria Nile at Jinja, Uganda.
The dam, which provides hydroelectric power on a large scale, made the lake a vast reservoir.
The early sixties and the late seventies of this century witnessed an unusual rise in the surface water
levels of the Equatorial lakes and of other African lakes as well. The level of Lake Victoria rose by over 2.5 m between 1959 and 19641. For the same period the rise reached 3.3 m for lake Albert, 2.6 m for
lake Tanganyika and 1.5 m for lake Malawi.
The sharp rise in the level of lake Victoria between 1961 and 1964 is difficult to explain in terms of
water balance components, and some authors believe that the rise may have been due to intense earthquake activity that affected the groundwater regime, changing the aquifer elasticity and causing
sudden water surface fluctuations2. Other authors attribute the rise to the manipulation of the Owen Falls Dam levels by the Egyptian engineers who run the dam in a manner to increase storage, so as to fill the
reservoir at the High Aswan Dam3, a claim which was propagated by some workers4 and refuted by the
1 Kite, G., 1981. 2 Salem, Imama & El Bab 1979 3 Waterbury J., 1987. 4 Okidi, 1990.

Water Sharing in the Nile River Valley
UNEP/DEWA/GRID-Geneva - DR 31
Hydromet project which found that the “dam was the cause of only 0.03 metres of the total rise in lake
level, over the period 1957 to 1989”1. Most authors belive that rise of the lake was due to an increase of rainfall in the Lake Plateau.2
Lakes Victoria, Albert (Mobutu Sese Seko), Tanganyika and Malawi have shown the same rises in 1960’s and late 1970’s. This is curious considering the wide geographical spacing of these lakes, and
implies some large-scale climatic feature affecting the entire area. Lamb3 has concluded that a change in general wind circulation occurred in the late 1950’s to the early 1960’s, which has affected rainfall
patterns in many parts of the world.4
b) Sudd
The Jongley Canal, planned to bypass the Sudd, should connect the Bahr el Jebel at Bor straight to about Malakal on the White Nile and convey 20 million m3 per day at maximum. The construction work
of the canal began in 1978, with a total length planned at 360 km, but the works stoppeds in 1983, after 240 km.
c) White Nile
The Jebel Aulia Dam, with a capacity of 3 Km3, south of Khartoum was built in 1937, to improve the natural storage of the White Nile waters.
d) Blue Nile
At the beginning of this century plans were made to construct a dam and storage reservoir at Sennar on
the Blue Nile, to regulate the flow of the Nile. Its first phase was completed in 1925.
The Roseries Dam was completed in 1966 and designed to increase irrigated agriculture and power
generation in Northern Sudan.
Lake Tana , with a surface area of 3,673 Km2 is the largest lake of Ethiopia, in a depression of the
northwest plateau, 1,800 m above the sea level. It forms the main reservoir for the Blue Nile. The lake has a drainage area of 11,650 Km2; its maximum depth is 14 m.
1 Hydromet 1982, annex 7, page 39 2 Said Rushdi, 1993. 3 Lamb, 1966. 4 Kite, G. W., 1981.

Water Sharing in the Nile River Valley
32 UNEP/DEWA/GRID-Geneva - DR
e) Atbara
The Khashm el Girba Dam on the Atbara river was completed in 1965 and desighed to provide alternative livelihood to some 70,000 people displaced ny the rise of water level behind the High Aswan
Dam.
f) Main Nile
The Aswan High dam was completed in 1970. It is 111 m high, with a crest length of 3,830 m and a
volume of 44,300,000 m3, impounds a reservoir, Lake Nasser, that has a gross capacity of 169 109 m3.
Lake Nasser backs up the Nile about 320 km in Egypt and almost 160 km farther upstream in The
Sudan. The creation of the reservoir necessitated the costly relocation of the ancient Egyptian temple complex of Abu Simbel. Ninety thousand Egyptian fellahin and Sudanese Nubian nomads had to be
relocated.
The Aswan High Dam yields enormous benefits to the economy of Egypt. The dam impounds the
floodwaters, releasing them when needed to maximise their utility on irrigated land, to water hundreds of thousands of new acres, to improve navigation both above and below Aswan, and to generate
enormous amounts of electric power (the dam's 12 turbines can generate 10 billion kilowatt-hours annually). The reservoir, which has a depth of 90 m and averages 22 km in width, supports a fishing
industry.
The Aswan High Dam has produced several negative side effects, however, chief of which is a gradual
decrease in the fertility and hence the productivity of Egypt's riverside agricultural lands. This is because of the dam's complete control of the Nile's annual flooding. Much of the flood and its load of rich
fertilising silt is now impounded in reservoirs and canals; the silt is thus no longer deposited by the Nile's rising waters on farmlands. Egypt's annual application of about 1 million tons of artificial fertilizers is an
inadequate substitute for the 40 million tons of silt formerly deposited annually by the Nile flood.
An earlier dam, 6 km downstream from the Aswan High Dam, was completed in 1902, with its crest
raised in 1912 and 1933. This dam holds back about 4.9 109 m3 of water from the tail of the Nile flood in the late autumn. Once one of the largest dams in the world, it is 2,142 m long and is pierced by 180
sluices that formerly passed the whole Nile flood, with its heavy load of silt.

Water Sharing in the Nile River Valley
UNEP/DEWA/GRID-Geneva - DR 33
2.5 Population
The population now estimated at over 250 106 people, is increasing at an annual rate of about 3% and
is estimated to exceed 400 106 by the year 2025, and approach 1 109 by 2050.
Table 8. Population in the Nile Basin.1
Country
Basin Population Density
(hab/km2)
Basin Population [1990]
(millions)
Country Population
[1990]
(millions)
Country Population
[1998]
(millions)
% of the Country's
Population within the Nile Basin
Burundi 250 3.204 5.503 6.457 58
DR Congo 88 1.838 43.901 49.139 4
Egypt 163 47.599 56.312 65.978 85
Eritrea 36 0.918 3.082 3.577 30
Ethiopia 53 19.454 55.053 59.649 35
Kenya 178 9.129 28.261 29.008 32
Rwanda 276 5.731 7.952 6.604 72
Sudan 11 20.893 28.098 28.292 74
Tanzania 40 4.878 29.685 32.102 16
Uganda 67 15.999 21.297 20.554 75
Total 129.643 279.144 301.360 46
The relationship between population growth and poverty is important. If the growth of the economy is
not sufficient to absorb and remunerate rapidly expanding labour forces, poverty will not be reduced. The Nile basin countries have a very low financial base and are internationally indebted. Rapid
population growth combined with international debt raises the question of whether meaningful economic development is possible. Reducing population growth would be the single most beneficial development
in terms of addressing problems of feeding populations and enabling the formulation of sustainable and economic water use policies. Controlling population growth would also reduce political tensions over
water availability. It is urgent that a conceptual framework be developed linking population, including its socio-cultural systems, with the various functions of water in the landscape, elaborating the connection
between environment and development. Increases in populations and demand for higher standards of living dictate that natural resources be developed to the maximum benefit of humankind.2
1 Source: GRID - Sioux Falls Global Population Distribution Database 2 Smith Julie M., 1996.

Water Sharing in the Nile River Valley
34 UNEP/DEWA/GRID-Geneva - DR
Figure 13. Nile Basin Population Map
2.6 Water Resources utilisation
The patterns of water utilisation are determined by the amount of water carried by the river, which
fluctuates from year to year. The present-day unprecedented small flows of the river, caused by the drought that has been ravaging the Sahel region.
2.6.1 Agriculture
Egyptians lived primarily of agriculture. The Nile water was used to irrigate their fields with systems of dams, channels and the "chadouf " (system of noria allowing to draw the water of the Nile with jugs).
They cultivated corn, barley, beans, onions, garlic and lettuces. Every year the rising of the Nile, occurring in August and September, allowed the fertilisation of the fields bordering the river; and the silt
deposited even made it possible to manufacture bricks.
The major determinant of the Nile basin water balance remains the agricultural sector. The Nile has
provided the basis of agricultural development in Egypt and Sudan since the start of agriculture, about 7,000 years ago, and for political reasons, most East African nations have adopted policies of self-
sufficiency when dealing with food supplies. In the Nile basin agriculture accounts for at least 80% of all water consumption. Whereas a few litres of water per day are a basic minimum for human survival, at
least a ton per day is required to produce the food needed for a reasonable diet for just one person. 1 There are great losses of water in agriculture because this resource is not uses efficiently.
1 Smith Julie M., 1996

Water Sharing in the Nile River Valley
UNEP/DEWA/GRID-Geneva - DR 35
A good water management on quantitative level goes through an improvement of irrigation techniques, in
order to avoid wastage. The results of different countries show that farmers, who passed from furrow or spray irrigation to more efficient drip systems, have reduced their water consumption about 30 to 60 per
cent, while simultaneously increasing their productivity, and decreasing infiltration towards ground water. These drip systems, extensively used in countries like Israel, may be too expensive for the poorest
farmers, but research is made to make them cheaper.1 For example, in Egypt, the growing of rice and sugar cane, which both require a great deal of water, is questionable. In hot climates, the return on
agricultural yield per unit of water evaporated is poor and thus inefficient. Also, the most prevalent method of irrigation in the region is still the surface flooding of basins or furrows, a process that is, at
best, 50 percent efficient. This irrigation technique involves the needless percolation or runoff of half or more of the water delivered. As viable alternatives, sprinkler irrigation can be operated at an efficiency
of 70 percent or more, while drip irrigation can attain efficiency as high as 90 percent, if competently managed.
More and more farmers use ground waters to irrigate their cultures during the dry season. In the most arid zones, where precipitations are low and hardly predictable, ground waters can be the only supply
source for all types of farm activities.2 However, ground water resources are under pressure because the rapid population growth increases water demand and surface pollution. Unsustainable quantities of
water are being extracted in many areas and this is seriously diminishing the reservoirs. Moreover, phreatic waters are more and more polluted. The most common pollutants are nitrates, salt, soluble
organic compounds and, under some conditions, certain faecal pathogens. In Africa, there are some very large, but non-renewable aquifers (fossil water). It is said that they diminish 10,000 million cubic
metres a year.3
Land use also involves waste handling and the output of chemicals to the atmosphere, the soil, and the
water bodies, polluting the water circulating in the system. Proper management, therefore, demands land and water management to be integrated. As a result, the basin nations need to cooperate with each
other in their respective agricultural planning. A partial solution could lie in the distribution of different crops to areas of the basin where they would be most adapted. For example, water intensive or long
season crops could be grown in the upper basin while crops requiring less water and growing time could be produced in the lower basin.
2.6.2 Hydropower development
Ethiopia's potential for hydropower development is enormous. A proposition of far-reaching potential importance to the future of Nile water supplies would be the construction of a series of dams in
1 Postel, Sandra, 1996. 2 Foster, Stephen, 1996. 3 Postel, Sandra, 1996

Water Sharing in the Nile River Valley
36 UNEP/DEWA/GRID-Geneva - DR
Ethiopia. It is argued that Egypt's development is constrained more by lack of power than lack of water.
Thus, a mutually beneficial arrangement would appear to be possible with respect to water and power, whereby Egypt would agree to a greater water allocation for Ethiopia and to the construction of Blue
Nile Reservoirs on the condition that a certain percentage of the electricity generated would be sold to Egypt at a specified price. Because of Egypt's growing demands for electricity, the Blue Nile Reservoirs
may be more valuable for their hydroelectric power generation than for water regulation and storage. Reservoirs would also control Blue Nile floods, which could be particularly beneficial to Sudan. Added
upstream storage would facilitate expansion of Sudan's gravity-fed irrigated areas, which in turn would mean greater crop production. It could be possible to negotiate an arrangement whereby Ethiopia
would trade electricity to Egypt and Sudan in return for agricultural and/or industrial products.
2.6.3 Navigation
The Nile River is still a vital waterway for the transportation of people and goods. River steamers still
provide the only means of transport facilities, especially in Sudan south of latitude 15º N, where road transport is not usually possible from May to November, during the flood season. Most of the towns in
Egypt and Sudan are situated on or near riverbanks.
In Sudan steamer service on the Nile and its tributaries extends for about 3,800 km. Until 1962 the sole
link between the northern and southern parts of Sudan was stern-wheel river steamers of shallow draft. The main service is from Kusti to Juba. There are also seasonal and subsidiary services on the Dunqulah
reaches of the main Nile, on the Blue Nile, up the Sobat to Gambela in Ethiopia, and up the Al-Ghazal River in the high-water season. The Blue Nile is navigable only during the high-water season and then
only as far as Ar-Rusayris.
Because of the presence of the cataracts north of Khartoum, the river is navigable in Sudan only in three
stretches. The first of these is from the Egyptian border to the south end of Lake Nasser. The second is the stretch between the third and the fourth cataract. The third and most important stretch extends from
Khartoum southward to Juba.
In Egypt, the Nile is navigable by sailing vessels and shallow-draft river steamers as far south as Aswan.
2.7 Fauna and Flora
Tropical rain forest is found along the Nile-Congo divide, in parts of the Lake Plateau, and in south-western Ethiopia. Heat and copious rainfall produce thick forests with a great variety of tropical trees
and plants, including ebony, banana, rubber, bamboo, and coffee shrub. Mixed woodland and grassland (savanna), characterised by a sparse growth of thinly foliaged trees of medium height and a
ground covering of grass and perennial herbs, occurs in large parts of the Lake Plateau, in parts of the

Water Sharing in the Nile River Valley
UNEP/DEWA/GRID-Geneva - DR 37
Ethiopian Plateau, in the area that fringes the Blue Nile near Ar-Rusayris, and in the southern Al-Ghazal
River region.1
On the Sudanese plains, a mixture of thin bush, thorny trees, and open grassland prevails. This area is
swampy during the rainy season, particularly in the Sudd region of the south-central Sudan. The vegetation there includes papyrus, tall bamboo-like grasses, reed mace ambatch, or turor, water
lettuce, a species of convolvulus, and the South American water hyacinth.
North of latitude 10º N there occurs a belt of thorny savanna or orchard shrub country characterised by
small scattered tree stands, thorn-bush, and, after rain, grass and herbs. North of this, however, rainfall decreases and the vegetation thins out, so that the countryside is dotted with small thorny shrubs,
mostly acacias. From Khartoum northward there is true desert, with scanty and irregular rainfall and no permanent vegetation at all except for a few stunted shrubs. Grasses and small herbs may be scattered
along drainage lines after rainfall, but these die away in a few weeks. In Egypt the vegetation near the Nile is almost entirely the result of irrigation and cultivation.
Many varieties of fish are found in the Nile system. Notable among those found in the lower Nile system are the Nile perch, the bolti (a species of Tilapia), the barbel, several species of catfish, the
elephant-snout fish, and the tiger fish, or water leopard. Most of these species and the sardinelike Haplochromis, the lungfish, and mud-fish are found as far upstream as Lake Victoria. The common
eel penetrates as far south as Khartoum, and the spiny eel is found in Lake Victoria.
The Nile crocodile, found in most parts of the river, has not yet penetrated the lakes of the upper Nile
basin. Other reptiles found in the Nile basin include the soft-shelled turtle, three species of monitor lizard, and some 30 species of snakes, of which more than half are venomous. The hippopotamus,
once common throughout the Nile system, is now found only in the As-Sudd region and to the south.
Many schools of fish that fed in the waters of the Nile in Egypt during the flood season have been
reduced or have disappeared since the construction of the Aswan High Dam. Most of the species of the Nile fish were migrants, and the dam has prevented many from migrating to Lake Nasser. The
diminution in the number of anchovies in the eastern Mediterranean has also been attributed to the serious reduction in the outflow of waterborne nutrients due to the dam. Lake Nasser, however, has
been developed into a commercial fishery, where the Nile perch and other species thrive.
1 Encyclopædia Britannica.

Water Sharing in the Nile River Valley
UNEP/DEWA/GRID-Geneva - DR 38
3 NILE RIVER BASIN PROJECTS
3.1 Basin-Wide Cooperation
Basin-wide cooperation amongst the Nile river Basin countries was weak until the 1960’s when the Hydromet Survey Project was established as the first regional body for technical cooperation amongst
the riparian countries. This project operated for about twenty-five years, and was then followed by TECCONILE which operated for about six years. The transitional institutional mechanism succeeding
TECCONILE is now the Nile Basin Initiative (NBI).
Examples of development challenges which face the Nile Basin people are: combating drought and
desertification, early warning and preparedness for drought and flood, pollution control, protection of water quality, aquatic systems and biodiversity in lakes, rivers and aquifers, human resources
development, sharing of data and information.1
At present there are several projects operating on the Nile Basin, funded by international organisations
such as FAO, the United Nations Education, Science and Culture Organization (UNESCO), UNEP and by cooperation agencies such as the U.S. Agency for International Development (USAID), and the
Canadian International Development Agency (CIDA).
3.1.1 Hydromet Survey
The governments of Burundi, Egypt, Kenya, Rwanda, Sudan, Tanzania, Uganda and Zaire, and
Ethiopia as an observer, have cooperated in the Hydrometeorological survey of catchments of Lakes Victoria, Kyoga and Albert from 1967 to 1992. They established a mechanism of cooperation between
the riparian countries through a Technical committee, supported from time to time by the United Nations Development Programme (UNDP), the World Meteorological Organization (WMO), UNEP and other
organizations.
The objectives of the Hydromet Survey Project were the collection and analysis of hydrometeorological
data of the catchments in order to study the water balance of the Upper Nile. An integrated and coordinated system of data collection and processing was introduced. The data collected and their
study were expected to assist the riparian countries in water conservation planning and socio-economic development, and to provide groundwork for intergovernmental cooperation for the storage, regulation
and use of the Nile. The Hydromet Survey Project Technical Committee was the only institutional arrangement encompassing the representatives of all the Governments of the Nile Basin countries.
1 Kivugo, Mrischo M., March 1999.

Water Sharing in the Nile River Valley
UNEP/DEWA/GRID-Geneva - DR 39
3.1.2 TECCONILE
In December 1992, ministries responsible for water in the Nile basin countries met in Kampala and agreed that the future cooperation on water resources matters should be pursued transitionally under the
name of TECCONILE (Technical Cooperation Committee for the Promotion of the Development and Environmental Protection of the Nile Basin). The new objectives aimed at achieving in short term
development of infrastructure, capacity building and techniques for management of water resources and formulation of national master plans and their integration into a Nile Basin Action Plan. The long-term
objectives aimed at the development of the Nile Basin in an integrated and sustainable manner through basin-wide cooperation and the determination of equitable sharing of its waters.
TECCONILE came into being on 1 January 1993 with the signing of the Agreement to this effect by Ministers from six countries: Egypt, Sudan, Rwanda, Tanzania, Uganda and Zaire The remaining
riparian countries Burundi, Eritrea, Ethiopia and Kenya, were observers, although their opinions were heard and respected. The organisation had an elaborate organisational structure consisting of the
Council of Ministers of water affairs of the Nile basin countries (COM) as the highest authority, a Technical Committee (TC) of high-level experts from each member and observer country appointed by
respective governments, and a Secretariat.
Since its establishment, TECCONILE has been busily engaged in a number of essential activities all
directed towards accomplishment of its short and long term objectives. Some key activities include the following:
Water Resources Atlas of the River Nile Basin - With support from CIDA, TECCONILE has actively participated with SPIDER International in the preparation of an Atlas of the Nile basin,
concentrating on water resources and water use. Present day technologies: remote sensing and geographic information system applications offer an excellent medium to collect, update and disseminate
key information accurately and rapidly. A demonstration atlas was first prepared early in 1994 to test and verify the applicability of technologies and to show the potentials of its adoption. Responding to
demands by potential users the Atlas was further refined and printed in an easy to handle soft cover edition. The current edition contains the following information: Base maps and satellite images; Drainage
of the basin; Transportation networks; Population distribution and centres; Average annual precipitation; and Topography of the basin.
The Nile River Basin Action Plan - With CIDA support, TECCONILE organised two workshops, one in Entebbe, the other in Cairo, in 1994. The workshops were attended by representatives of the
Nile basin countries and were assisted by consultants. The delegates developed and elaborated the "Nile River Basin Action Plan - (NRBAP)" which includes 22 projects with a total estimated cost of US
$ 100 million. These projects aim to give an answer to priority needs and provide the foundations of future development (project implemented with a multilateral support). This plan includes: planning and

Water Sharing in the Nile River Valley
40 UNEP/DEWA/GRID-Geneva - DR
integrated management of water resources; reinforcement of the institutions and development of human
resources; a regional co-operation; the environment’s protection and improvement.
Reconstruction and Rehabilitation of TECCONILE Headquarters - TECCONILE headquarters
buildings in Entebbe have been completely rehabilitated and a new wing has been added to enable the organization to effectively and efficiently undertake its broad mandate.
Training Sessions - TECCONILE has initiated a series of training sessions for its own staff and staff members of water resources agencies of Nile basin countries. Introductory courses were given in
Entebbe in Geographical Information Systems (GIS) and Hydrological Modelling. A course in the Egyptian Monitoring, Forecasting, and Simulation system for the Nile was given in Cairo.
Nile 2002 Conferences - Nile 2002 is a series of conferences focusing on the Nile River water resources. These conferences are designed as a response to the needs expressed by people and
institutions interested in fostering sustainable development of the Nile River water resources. The first Nile 2002 Conference was held in Aswan, Egypt in 1993. Since then an international conference on the
Nile basin has been held each year in a different riparian country. The tenth conference will complete the first round of this series in the year 2002, and hence the name of the series is "Nile 2002".
Procurement of Vehicles, Equipment and Furniture - The TECCONILE Secretariat procured new vehicles, computers and ancillary equipment, and furniture for the new and renovated quarters. CIDA
has provided considerable support.
Negotiations for a NILE-HYCOS - The Director was involved in negotiations with WMO and the
basin countries for the establishment of a Hydrological Cycle Observation System to cover the Nile basin.
3.1.3 Nile Basin Initiative (NBI)
The transitional institutional mechanism which is succeeding TECCONILE is NBI, launched in Dar es Salaam in February 1999. This initiative is a regional partnership within which countries of the Nile basin
have united in common pursuit of the sustainable development and management of Nile waters. For the first time in history, all Nile basin countries have expressed a serious concern about the need for a joint
discourse. They have agreed to pursue this under a transitional arrangement (NBI) until a permanent legal framework is in place. Member countries are Burundi, Democratic Republic of Congo, Egypt,
Ethiopia, Kenya, Rwanda, Sudan, Tanzania and Uganda.
The NBI member states have embraced a Shared Vision: “To achieve sustainable socio -economic
development through the equitable utilisation of, and benefit from, the common Nile Basin water resources.”

Water Sharing in the Nile River Valley
UNEP/DEWA/GRID-Geneva - DR 41
The NBI structure comprises a Council of Ministers (Nile -COM) responsible for water affairs of the ten
riparian countries and a Technical Advisory Committee (Nile-TAC) with a maximum of two representatives form each Nile Basin Country, and a secretariat.
The Nile Basin Initiative is governed by a Council of Ministers, its highest decision-making organ. This Council is made up of water affairs ministers of the Nile basin states. Chairmanship of the Council is
rotated annually.
Supporting the Council is the Nile Technical Advisory Committee, which is made up of senior officials
from the various countries. The Technical Advisory Committee consists of one member from each country and an alternate.
The NBI maintains a secretariat (Nile-SEC) located in Entebbe, Uganda. The Secretariat started operations in June 1999. In addition to providing administrative, financial and logistical support and
services to Nile-TAC and the Nile-COM, the Secretariat is responsible for the co-ordination and monitoring of the Shared Vision Program working groups and Subsidiary Action Programs where
appropriate, and for providing logistic support to these activities.
3.1.4 INBA
The International Association of the Basin of the Nile (INBA) is an NGO which aims at increasing the
comprehension of the water resources of the basin.
A few years ago, a number of water resources specialists with interest in the Nile river basin got into a
discussion. It revolved around information exchange, the availability and reliability of data concerning water resources development of the Nile river basin. They noted that the Nile is probably the most
written about river in the world. However, for ordinary professionals, practitioners, scientists and educators, in the Nile basin, data and interested information are scarce, outdated and possibly
erroneous. The only possible way for many of them to obtain information about the Nile basin is to contact their counterparts at home or in other countries within the basin. Networking takes place
through membership in the larger international or regional organisations whether governmental or non-governmental. However, the specific Nile issues are diluted with others and the focus is lost. Ad-hoc
attempts are made from time to time to convene the Nile basin experts in workshops, seminars or conferences. These are held by invitation only and are not accessible by the public. Once such events
are over, the situation returns to its previous state. A vacuum definitely exists and a pressing need presents itself. The concept of creating a non-governmental organisation is perceived as one viable
solution to meet some of these needs. It is not perceived as a substitute to intergovernmental, multilateral or similar international organisations. It is to complement all of them. The INBA is specifically aimed to
assist in providing the necessary medium and facilities for interested parties to access data and information on the current thinking, technologies and developmental issues of water resources of the
Nile river basin.

Water Sharing in the Nile River Valley
42 UNEP/DEWA/GRID-Geneva - DR
This concept was further refined, presented and discussed at the second Nile 2002 conference held in
Khartoum in 1994. Many individuals expressed genuine support and provided valuable suggestions. A draft constitution for the INBA was prepared and is continuously being updated. Launching the INBA
became possible with the financial assistance of CIDA.
3.2 Monitoring, Forecasting and Simulation project (MFS)
Currently the National Oceanic and Atmospheric Administration (NOAA) is in process of completing a
river forecast system for the Nile river.1 This Monitoring, Forecasting and Simulation project (MFS) is funded by the USAID and the executing agency is FAO. The prime objective of the MFS project is to
predict the inflow into the High Aswan Dam with as much lead time as possible. An additional goal is to regionalise forecast capability so that many of the ten countries within the Nile basin could benefit from
use of the Nile River forecasts.2
Phase I of the project (September 1990-September 1993) involved initial development of a Nile
Forecasting System (NFS) for the Blue Nile River. Phase I was completed with the installation of the latest version of the NFS in July 1993. Phase II (September 1993-September 1995) involved
significant improvement of the accuracy and simulation of the NFS for the Blue Nile as well as expansion of the system to include the White Nile system. Version 2.1 of the NFS was installed in Cairo
in June 1994 and contains enhanced satellite calibration coefficients, a hydrologic calibration system, an enhanced reservoir operation system for the Blue Nile, an improved data assimilator and graphics
outputs. The FAO and the NOAA signed an agreement in April 1998 to implement Phase III of the MFS. Phase III is designed to provide additional improvements in the performance and capabilities of
the NFS.
Phase III will continue scientific and technological cooperation between FAO and NOAA related to the
provision of specialised services in the field of river forecasting, training in river forecasting, satellite precipitation estimation, hydro-meteorological forecasting, and software development.
Major tasks in Phase III for the first year are as follows:
§ Extending the range of the user community by identifying the system users, fulfilling their requirements and establishing the communication links between NFC and users and enhancing the
utilisation of information products;
§ Conducting comparison analyses of gridded precipitation obtained from a new estimation technique using satellite and precipitation gauge data developed by the Hydrologic Research Center (HRC)
versus gridded precipitation estimates obtained from the existing technique currently operational in the NFS;
1 http://hsp.nws.noaa.gov/oh/tt/projects/nile/nile.html 2 Koren V., and Barrett C. B.

Water Sharing in the Nile River Valley
UNEP/DEWA/GRID-Geneva - DR 43
§ Improving parameterisation and spatial calibration of the water balance models by creating an
NDVI-based index, and;
§ Running simulations of NFS output to compare estimated stream-flow values using the HRC, existing and merged precipitation grids as inputs.
Because of the lack of adequate hydro-meteorological data, the METEOSAT data was used to obtain more detailed spatial resolution of the distribution of precipitation over the basin. A distributed
hydrologic system was designed to take advantage of the satellite derived precipitation as well as known physical characteristics of the river basin from GIS.
3.3 FRIEND/Nile Project
FRIEND is an acronym for Flow Regimes from International Experimental and Network Data. FRIEND projects were launched during the fourth cycle on UNESCO's IHP Programme in various
river basins throughout the world. FRIEND projects now exist in Europe, Africa and Asia, and are under preparation in South and Central America.
The UNESCO Cairo Office and UNESCO Nairobi Office have launched the FRIEND Nile Project1 during a meeting in Dar-Es-Salaam in Tanzania in March 1996. The University of Dar-Es-Salaam was
selected as the coordination centre. Results from the meeting included a draft of a comprehensive action plan for the project indicating methods and means for the implementation of the plan.
The first phase of the project, from 1997 to the year 2000, concentrated on the following activities:
1. Formation of a regional data base;
2. Training and Capacity Building;
3. Research in the following subject areas: a) Sediment transport and watershed management; b) Flood frequency analysis; c) Rainfall runoff modelling; d) Drought and low flow analysis.
Institutes and universities in the Nile Basin countries are implementing the various components of the project in close cooperation with governments of all riparian countries, and with technical assistance
from counterparts outside the region. The project aims to achieve a better and more comprehensive understanding of the hydrological processes in the whole Nile Basin area as well as other basins in the
Nile countries.
1 Abdin Salih, from UNESCO Cairo Office.

Water Sharing in the Nile River Valley
44 UNEP/DEWA/GRID-Geneva - DR
3.4 Georgia Tech –Nile Basin Management
Dr. Aris Georgakakos, head of Georgia Institute of Technology Environmental Hydraulics and Water Resources Group and associate chair for research in the School of Civil and Environmental Engineering,
has developed a computer-based system to provide for equitable and sustainable water-resources management.
The project is sponsored by the USAID through a contract with FAO. It is a collaborative effort between Tech and the National Weather Service and is being conducted for the Egyptian government.
Figure 14. Georgia Tech's Decision Support System Presentation
Georgia Tech - Nile Basin Management (GT-NBM)1 is a comprehensive decision support software for the management of the Nile River. It includes many models comprising five major groups: (1) models
related to the management of the High Aswan Dam, (2) models of the Equatorial Lakes, (3) models of the White Nile, (4) models of the Blue Nile, and (5) models of the entire Nile system. The last two
groups are under development and not included in the current version (2.0).
GT-NBM is a user friendly software running on IBM-compatible personal computers under the
Microsoft Windows environment. Its graphical user interface (GUI) is written in Visual Basic, while its mathematical models are programmed in standard Fortran. The Water Resources Center of the Georgia
1 Georgakakos Aris P., 1995.

Water Sharing in the Nile River Valley
UNEP/DEWA/GRID-Geneva - DR 45
Institute of Technology has been developing a state-of-the-science decision support system that
encompasses the river reaches of the White, Blue and main Nile branches, along with the existing and proposed water conservation and development projects (Georgia Tech Nile Basin Management GT-
NBM). The system has a time resolution of ten days and includes models for inflow forecasting, river and reservoir routing, and reservoir control.
The integrated decision-support system attempts to quantify factors to produce accurate forecasting and efficient day-to-day management. It is built on hydro-meteorological data such as rainfall observations,
river-flow and stage hydrographs, soil moisture distribution and changes, and temperature and evapotranspiration. Once set up, a decision-support system can simulate the response of rivers and
reservoirs to different climatic inputs, water and power demands, and decision policies. The system is not intended to replace management authorities, but rather to quantify the tradeoffs among different
water uses.
Part of the system developed for the Nile is already in place at the Nile Forecast and Control Centre at
the Ministry of Public Works and Water Resources in Egypt.
3.4.1 Structure
The core of GT-NBM are the hydrologic forecasting and simulation modules together with the
associated data bases. The purpose of these modules is to simulate and predict the response of the Nile to various hydrological inputs. This information than becomes the basis for simulating environmental and
ecosystem response.
The next set of modules is intended to quantify the value of water availability to agriculture, hydropower,
ecology, and the human cultures that depend on it. These modules develop economic as well as social measures to implement decision processes for reservoirs, irrigation areas and power systems. The
purpose of the decision modules is to derive multi-objective trade-offs that provide integrated impact assessments useful to the Nile stakeholders in making decisions or establishing water use agreements.
The strategic system level presently encompasses the river reaches of the White and Main Nile along with the existing and proposed storage facilities (Equatorial lakes, Gebel el Aulia, High Aswan Dam).
The Blue Nile is modelled as a hydrologic input, as are the rivers Sobat and Atbara.
Streamflow forecasting and river routing are performed using statistical and neural network models (the
former providing linear input/output associations and the latter being able to represent more complex non-linear dynamics), while reservoir system management is based on control methods developed at the
Georgia Tech.

Water Sharing in the Nile River Valley
46 UNEP/DEWA/GRID-Geneva - DR
3.4.2 Decision Support for the High Aswan Dam
The decision Support System for the High Aswan Dam includes two primary components: inflow forecasting and reservoir control. The purpose of the first is to forecast the upcoming reservoir inflows
and provide an appreciation of the forecast uncertainty through multiple forecast traces. The user can choose among several forecasting possibilities including statistical, neural network, and physically-based
models. The reservoir control component is designed to address the needs of the management authorities from long-term to near real-time. To accomplish this, it includes three control modules. First
is the turbine load dispatching module which aims at optimising hydro plant efficiency by determining the power load of each turbine such that the total plant outflow is equal to a given discharge level and total
power is maximised. The inputs to this module include beginning-of-the-period reservoir elevations, various turbine and reservoir characteristics (e.g., elevation vs. storage and tailwater vs. discharge
relationships, power vs. net hydraulic head vs. discharge curves, and operational turbine ranges, among others), and minimum and maximum discharge requirements.
The second control module is concerned with the dynamic optimisation problem of determining the best hourly power sequences for the High Aswan Dam and Aswan I and II power stations over a period of
one month. This module aims at maximising the value of energy (measured by the cost savings of thermal plant fuel) subject to the water demands and operational constraints. It combines both short- and mid-
range features by having an hourly discretisation interval and a horizon of thirty days. The inputs to this module include reservoir inflows, physical reservoir layout and characteristics (e.g., storage vs. elevation
curves, storage and release constraints, etc.), the relationships between minimum discharge, reservoir elevation, and plant load, determined by the first module, weekday and weekend release and power
generation requirements, and the power system marginal energy generation costs .
Lastly, the purpose of the third, long range control module is (1) to quantify the operational tradeoffs of
the HAD/OAD complex and (2) identify the release sequences that realise the selections of the decision making authority. The tradeoffs are distinguished in those which relate to flood or normal hydrologic
conditions and those which pertain to dry periods. To accommodate the needs of the two main model users, the Ministry of Public Works and Water Resources and the Ministry of Electricity, this module is
designed to operate on weekly, decadal, or monthly time intervals.
The three modules constitute a multilevel control structure with an operational flow that follows two
directions: The lower level modules are activated first and generate information that is used by the upper levels regarding performance functions and bounds. At the end of this upward flow, the long range
control model generates appropriate operational tradeoffs evaluating the consequences of various long-term policies. At this point, the model halts and requests the input of the management authorities
regarding their most preferred policy selection. Once this has been decided, the lower control levels are again activated in the reverse order to generate the best turbine hourly sequences and load allocation
that implement this decision consistently across all relevant time scales.

Water Sharing in the Nile River Valley
UNEP/DEWA/GRID-Geneva - DR 47
3.4.3 Decision support for the Equatorial lakes
The purposes of the Equatorial lake decision system are to develop effective schemes for lake regulation, assess the water conservation value of lake regulation in connection with the Jonglei Canal
and examine the impact of the regulatio n on riparian lake uses.
The decision system includes three primary components: Inflow Forecasting, reservoir control and
integrated forecast-control-simulation. The purpose of the first is to forecast he upcoming lake inflows and provide an estimate of forecast uncertainty. Forecasting options include auto-regressive, neural
network, and physically based models. The purpose of the reservoir control is to determine lake elevation and release sequences which satisfy the system operation criteria. These include uniform lake
fluctuation, drought management, energy generation, and minimisation of water losses at the Sudd swamps. The forecast-control-simulation component can be used to assess the feasibility and value of
lake regulation.
3.4.4 Decision support for the White Nile
The decision support system for the White Nile includes four primary components: inflow forecasting,
river routing, control, and integrated forecast-control-simulation. The purpose of the first is to forecast the upcoming lake inflows and the Nile tributary flows, and provide an estimate of forecast uncertainty.
This is accomplished via statistical forecasting methods.
The river routing models include the models of the various reaches of the White and Main Nile from
Pakwatch (Lake Albert exit) to Dongola (HAD entrance). The models are of two types, one based on neural network theory and another based on linear regression methods. The White and Main Nile from
Pakwatch (Lake Albert exit) to Dongola (HAD entrance) are divided into five reaches according to their physical conditions: (1) from Pakwatch to Mongal, (2) from Mongala to Malakal, (3) from
Malakal to Melut, (4) from Melut to Mogren , and (5) from Mogren to Dongola (HAD Entrance). The reach from Melut to Mogren includes the Gebel El Aulia reservoir and is dominated by backwater
effects extending several hundred kilometres upstream. As the operation rules of Gebel El Aulia affect the transport of water through this reach, it is handled as a reservoir rather than a routing reach.
The purpose of reservoir control is to determine lake elevation and release sequences which satisfy the system operation criteria. These include uniform lake fluctuation, drought management, energy
generation, and minimisation of water losses at the Sudd swamps.

Water Sharing in the Nile River Valley
48 UNEP/DEWA/GRID-Geneva - DR
3.5 The UNDP Nile River Basin Cooperative Framework Project
The UNDP Cooperative Framework project1 aims at providing the support to the Nile River Basin countries in defining an adequate and acceptable framework for co-operation that may pave the way for
equitable and legitimate use of the Nile River Basin water resources. The immediate objective of the project is to attain a regional cooperative framework acceptable to all Basin countries in order to
promote Basin-wide cooperation in integrated water resources planning and management. In the long term, the project will pave the way for the Nile River Basin countries to achieve milestones which would
determine net equitable entitlements for each riparian country for the use of the Nile waters and therefore to enhance and promote the utilisation of the Nile waters for optimum sustainable socio-
economic benefits for the inhabitants of the Basin. This project was signed in October 1997 with pre-project workshops undertaken during 1997. Each Minister of Water Resources of the Nile Basin
Countries has appointed three Panel of Expert (POE) members, and these form the forum for dialogue on the development and design of the Cooperative Framework.
Six full POE meetings have taken place since project signature. These took place in Tanzania (April/May 98), Kenya (Nov. 98), Egypt (March 99 with continuation in Dakar, June 99), Uganda
(Kampala, Aug. 99),Uganda (Entebbe, Dec. 1999) and Sudan (Khartoum, Feb./March 2000). The POE has formed two Study Teams comprising the Legal/Institutional Study Team and the
Data/Information (Technical Resources) Study Team. Several reports have been prepared for POE consideration, and national reports have been prepared by the POE members of the two Study Teams.
The project is executed by the United Nations Office for Project Services (UNOPS).
3.6 FAO Nile Basin Water Resources Project
The FAO Nile Basin Water Resources Project2, implemented with funding from Italy, aims at
strengthening regional co-ordination and at increasing the capacity by Nile Basin countries to negotiate joint management, equitable sharing and utilisation of water resources and environmental protection of
the Nile basin in the interest of supporting regional cooperation under a wider Nile Basin Programme. The participating countries are Burundi, D. R. Congo, Ethiopia, Kenya, Rwanda, Sudan, Tanzania and
Uganda.
The project is implemented at national level through National Coordinators and Focal Point Institutions
appointed by the participating Governments. Activities are coordinated through the Project Headquarters, based in Entebbe, Uganda by the Chief Technical Adviser, two GIS experts and support
staff and through frequent visits to the participating countries. FAO provides technical and administrative backstopping.
1 http://www.undp.org/seed/water/region/nile.htm 2 http://www.fao.org/waicent/faoinfo/agricult/agl/AGLW/projects/nile/flyer286.htm

Water Sharing in the Nile River Valley
UNEP/DEWA/GRID-Geneva - DR 49
Several activities were defined to address the said long term objective, which can be grouped as
follows:
§ Strengthening of Focal Point Institutions in each country with communication facilities and equipment for national and regional co-ordination;
§ Capacity Building in Water Policy, International Law and Negotiation;
§ Establishment of a basic GIS unit at the FPI in each country with equipment, trained staff and a basic database;
§ Capacity Building in mathematical modelling in each country for analysing of alternative development scenarios using simulation and optimisation models;
§ Upgrade of meteorological and hydrological database and remote sensing capabilities for acquisition and use of improved data in water resources planning.
The main objective of the project is capacity building in order to enhance international cooperation between countries within the Nile river basin. For this purpose FAO has been given the mandate, with a
group of co-operating partners, including the World Bank, UNDP and CIDA, to organise capacity building meetings and workshops focused on river basin management.
3.7 FAO Lake Victoria Water Resources Project
The Lake Victoria Water Resources Project (LVWRP)1 is about development of water resources information systems, mathematical models and tools in support of a harmonised, regionally coordinated
water resources management in the Lake Victoria basin. It is a regional project funded by Japan, executed by FAO, and being implemented since January 1996 in the three riparian countries of the
Lake Victoria - Kenya, Tanzania and Uganda. The LVWRP was scheduled to complete all major activities and outputs by June 1999.
The LVWR project has initiated the establishment of a sustainable skeleton network of rain gauges and river gauges for Lake management. Ground data is being integrated with remote sensing data in a
geographically referenced database. The database is being used through a water resources simulation model for spatial estimation of the rainfall regime, rainfall-runoff and river flow simulation, and a
control/decision support system (DSS) for reservoir operation and water management. The DSS will assist the riparian countries in formulating a coordinated and mutually agreed upon management strategy
for the Lake, and promote the institutional process within which the three countries will continue cooperation and interaction in Lake management.2
One of the key outputs of the project is a water resources management decision support system (DSS) of the Lake Victoria basin; It is a user friendly modelling system which integrates all other components
1 http://www.fao.org/waicent/faoinfo/agricult/agl/aglw/projects/lakevic/default.htm 2 Wulf Klohn and Mihailo Andjelic.
Water Sharing in the Nile River Valley
50 UNEP/DEWA/GRID-Geneva - DR
and outputs and provides a powerful tool to managers and decision makers in the Lake Victoria region.
The development of the Lake Victoria decision support system is a collaborative effort of FAO and the Environmental Hydraulics and Water Resources Group at the Georgia Institute of Technology, in
Atlanta, Georgia.
All major activities of the project are implemented at national level in Kenya, Tanzania and Uganda -
through Focal Point Institutions and National Coordinators of the project designated by the Governments of the three participating counties. The activities are initiated and coordinated by the FAO
Chief Technical Adviser and his technical staff, presently consisting of two Associate Professional Officers from the Netherlands and supporting personnel all stationed at the Project Office in Entebbe,
Uganda. FAO provides technical and administrative backstopping while overall guidance and supervision of the project implementation rests on the Project Steering Committee.
3.8 Lake Victoria Environmental Management Project
The Lake Victoria Environmental Management Project (LVEMP) is a comprehensive programme aimed at rehabilitation of the lake ecosystems for the benefit of the people in the catchment and the
national economies of which they are part. The objectives of the programme are to:
(a) maximise the sustainable benefits to riparian communities from using resources within the basin
to generate food, employment and income, supply safe water, and sustain a disease-free environment, and
(b) conserve biodiversity and genetic resources (World Bank, 1996).
The first phase of the project, with funding at the level of US$ 80 million by the Global Environment
Facility (GEF), the World Bank, the three countries concerned and several donors, deals with fisheries management, water hyacinth management and control, management of lake pollution and water quality,
management of land use in the catchment, management of wetlands and support for institutions for lake-wide research and management and pollution disaster contingency planning. Implementation of the
LVEMP was initiated in mid-1997 and the first phase is to last five years.
3.9 Snowy Mountains Engineering Corporation
The Snowy Mountains Engineering Corporation has been developing Basin-wide models for the study
of alternative methods of developing the water resources of complete river basins. The Upper Nile basin model1 was developed to enable the effect of any project within the basin upon the flow of the Nile
River to be evaluated. It includes a total of 36 inter-linked computer programs with sub-models for the
1 http://www.smec.com.au/technical/water/rbm.htm

Water Sharing in the Nile River Valley
UNEP/DEWA/GRID-Geneva - DR 51
estimation of catchment daily discharges, the combined operation of the three equatorial lakes, and the
routing of the discharge down the Nile between them using a one-dimensional unsteady flow model.
3.10 NileSim - Maryland University
The Department of Civil Engineering, the Institute for Systems Research, and the Center for Teaching
Excellence at University of Maryland, College Park, realised an hydrologic simulator of the Nile River basin. This free simulator is available for download.1
Figure 15. Nile Sim Presentation
NileSim is a simulation-based learning environment, developed with SimPLE (Simulated Processes in a Learning Environment), that focuses on the hydrology of the Nile River basin. It is used in a University
of Maryland undergraduate World Course "To Stem the Flow - The Nile - Technology, Politics, and
1 http://www.ence.umd.edu/capstone.d/nile.exe

Water Sharing in the Nile River Valley
52 UNEP/DEWA/GRID-Geneva - DR
the Environment". NileSim can also have applications to the study of agriculture, economics, history, and
sustainability of the region, thus addressing social science as well as engineering issues.
Support for the development of NileSim has been provided by the University of Maryland and in part
by the National Science Foundation.
NileSim is a Windows-based graphical simulator of the complete Nile River Basin, which has been
developed principally for the pedagogical purpose of explaining complex river behaviour and management to non-technical people. The simulator has been developed in a cost-effective manner,
making use of modern software development tools from electronic design automation. This has provided a rigorously accurate tool, which is fast, graphically intuitive, and simple for people to use. The tool
supports interactive experimentation with a simulated Nile River Basin for users to learn by observation how that basin system works.
Upon starting NileSim, the user sees a GUI that shows a full-screen image of the Nile River basin from the Equatorial Lakes and Ethiopia to the delta. The GUI is the level at which information is sent to and
received from the underlying simulation. While the NileSim program is a complicated set of algorithms, the user only interacts with the GUI. This image is color-coded, so that lakes, rivers, and reservoirs
appear in dark blue, seas are light blue, political boundaries are yellow, and man-made features are red (figure 16).
Large regional sections are also outlined. When these sections are selected with the mouse, simulator controls and plots of flow and volume with time appear in pop-up windows. The large pop-up windows
correspond to the geographical regions of the Equatorial Lakes, el-Sudd, Lake Nasser, Upper Egypt, and Delta; smaller pop-up windows show controls and time-series plots for the Roseires dam, the Nile
River at Khartoum, and the Atbara River.
When the simulator is running, the user can view three types of dynamic flow condition data:
§ hydrographs of discharge vs. month since the start of the simulation at various locations on river reaches;
§ bar graphs of discharge in the major canals; and annual discharges and volumes for the previous calendar year at specific points.
Output is available for:
§ monthly and annual total reservoir volumes for Lake Nasser and the Roseires dam;
§ monthly and annual total reservoir volumes for proposed dams at Lakes Edward and Victoria;
§ monthly and annual flow rates at Lakes Edward, Victoria, and Albert, the Semliki river, el-Sudd, and confluences with the Achwa, Sobat, Atbara, Bahr el-Ghazel, and Blue Nile Rivers;
§ monthly water uses in upper Egypt and delta distributaries, canals, and rayahs.
Water Sharing in the Nile River Valley
UNEP/DEWA/GRID-Geneva - DR 53
River discharge as a function of time is tracked at a discrete number of points within the river network.
Hydrographs can be viewed by clicking on the corresponding section of the river on the Nile map. These hydrographs are dynamic and evolve as the user modifies the simulator conditions. Currently, the
discrete points at which hydrographs can be observed are coded directly in the simulation. In the future, the user will be able to click on any reach of any river in the basin and view its corresponding
hydrograph.
Along the course of the lower Nile in Egypt, flows can be distributed among the major existing canals
and branches of the river. At the head of the Delta, the main Nile River flow is divided among the Rosetta and Damietta branches of the river, and among the four major delta canals taking water off from
the river at the barrages just north of Cairo. Default values for the fractions of flow entering of these five distributaries1 are coded into the simulation but may be altered by the user.
The geographic and hydrologic features of the Nile River system were reduced to a flowchart schematic for the purpose of model development. Inflows from the White Nile and Blue Nile merge at Khartoum
and are joined by the Atbara further downstream. This is represented by a converging tree structure entering upstream of Lake Nasser.
Lake Nasser itself is modelled with four effluents: downstream flow to Egypt, water withdrawals by the Sudanese, losses to evaporation and seepage, and overflow released into the Toshka depression. These
inflows and outflows are summed at the node representing Lake Nasser.
Incorporation of existing flow containment structures, such as the Aswan high dam and the Roseires
dam, enables users to examine the effects of various flow release rates. In addition to the modification of flow rates from existing structures, the model also allows the construction of proposed flow control
structures within the time duration of a simulation. These future structures include canals near the Sobat marshes, Jonglei, Bahr el-Ghazel, and the Toshka depression, and dams at Lakes Edward and Victoria.
The simulator is based on a detailed description of the physical hydrology of the river system and is calibrated to empirical records of the basin. Its output reproduces the descriptive statistics of observed
hydrographs, reservoir levels, and travel times of flood waves along river reaches. The NileSim model incorporates monthly river flow variability from analyses described in the literature2. The monthly flow
and volume estimates include a stochastic component. The filling and draining of reservoirs obey mass balance, and the travel times of flood waves downstream are described by Manning’s equation and
geographically distributed reach geometries.
The underlying network simulation of the river basin was developed using VisSim (Visual Solutions,
Inc., 1995), a network simulation toolkit from the electrical engineering industry. VisSim combines a
1 Said, 1993. 2 Said, 1993; Shahin, 1985.

Water Sharing in the Nile River Valley
54 UNEP/DEWA/GRID-Geneva - DR
graphical development environment for rapidly building network diagrams with a set of mathematical
and logical tools for describing analytical relationships within such networks.
The NileSim GUI was built using Delphi3.0. The final code constructed using these tools was compiled
into a C-based executable for users to download from the Internet. This strategy of using CASE tools rather than writing original code allowed NileSim to be developed within a few months and to have both
the functionality and look-and-feel of standard Windows software; this consistency with industry standards is important in simplifying training and encouraging use.
3.11 NILE-HYCOS - WMO
The World Hydrological Cycle Observing System (WHYCOS), funded by WMO, aims to provide a scientific basis for water resources monitoring and assessment. Promotes integrated water resources
development and management at local, regional, national and international levels. WHYCOS is made up of electronically interconnected regional Hydrological Cycle Observing System (HYCOS) sub-
components such as SADC HYCOS and MED HYCOS. These regional components are supported by the national hydrological services within the region. The national hydrological authorities are voluntary
partners with sovereignty over all data and information they generate.
Figure 16. Status of WMO HYCOS Components1
At the request of TECCONILE, a project profile for a Nile-HYCOS was prepared in September
1996. It was endorsed by the TECCONILE Technical Committee and subsequently approved by the Council of Ministers for inclusion in the TECCONILE Action Plan. Due to the changes in the
institutional arrangements for the Nile Basin, progress with the development of the project has been
1 WMO/WHYCOS.

Water Sharing in the Nile River Valley
UNEP/DEWA/GRID-Geneva - DR 55
delayed. However, contact continues with the Nile Basin Initiative Secretariat to follow-up on the
proposal.
3.12 Nile Basin Society
The Nile River mailing list1 aims at promoting sustainable equitable water resources development of all
Nile riparian countries through basin-wide cooperation. The list hopes to achieve that through open discussions and sharing of information concerning Nile politics and environmental issues. They are
looking forward to people's active participation in sharing information, readings, news, web sites and opinions regarding the River Nile. There are no limits to the subjects that can be discussed. Some of the
topics that are welcome are those related to:
§ EIA of land and water resource projects in the Nile Basin.
§ The politics of Nile waters and the potential of conflict and efforts at conflict resolution.
§ Quality and quantity of the Nile waters.
§ Official Development Aid (OAD) for projects related to water and agricultural land resources development projects along the Nile.
§ History and geography of the Nile.
§ The effects of global warming and El-Niño on the Nile water.
§ International law and the Nile.
§ Book reviews.
§ Web sites review.
§ Articles published in National and international media.
3.13 Green cross International
Green Cross International (GCI) is an international NGO founded in 1993 with the goal of helping to create a sustainable future by cultivating harmonious relationships between humans and the environment.
GCI is currently concentrating its efforts on five major international programs, one of which is the Water and Desertification program. Through this program, GCI and its president, Mikhail Gorbachev, are
acting as mediators to help find cooperative solutions to existing and potential freshwater conflicts in the Middle East (Jordan River basin), North Africa (Nile River basin) and South America (Pilcomayo River
basin).

Water Sharing in the Nile River Valley
56 UNEP/DEWA/GRID-Geneva - DR
1 http://groups.yahoo.com/group/NileRiver

Water Sharing in the Nile River Valley
UNEP/DEWA/GRID-Geneva - DR 57
4 DATA
4.1 Generalities
Georeferenced information on water resources (climate, precipitation, radiation, soil properties, vegetation, etc) and socio-economic factors (population, agriculture, industries, land use, etc) represent
a key factor for the understanding of water availability within a watershed. This data can be fed into modelling tools, which will be used in scenarios dealing with climate and population changes possibly
inducing water-related disputes.
The data collected for the Nile Basin are described in this chapter. For this project the some data was
already available at GRID-Geneva and other data was collected via Internet. The data were clipped to fit in a box, covering the entire Nile basin. This Arc/Info Box cover, covers an 35N-5S degrees
latitude, and 20E-40E degrees longitude. Some data were directly incorporated to the project, other prepared and stored on magnetic bands.
4.2 DEM
At the U.S. Geological Survey's EROS Data Center, the USGS, the National Aeronautics and Space Administration (NASA), UNEP, and others are developing approximately 30 arc-second resolution
digital elevation models (DEMs). These DEMs are important because they provide the basic data as well as derivative information such as slope, aspect and flow characteristics that are critical in
environmental problems for hydrologic, biologic, and geologic studies.
The digital elevation model of Africa at a 30 arc second horizontal grid spacing (GTOPO30)1 used in
this project, was produced by incorporating the elevation information derived from the Digital Chart (DCW) of the World and Digital Terrain Elevation Data. The goal of the processing techniques that
were implemented was to maximise the amount of topographic information that could be derived from each source. The resulting digital elevation grid provides new topographic data with a level of detail and
accuracy suitable for many regional and continental applications.
A point spacing of 30 arc-seconds corresponds to approximately 1 kilometre in latitude, but varies in
longitude due to the convergence of meridians toward the poles. The 30 arc-seconds in longitude is approximately equal to 1 kilometre at the equator, 700 meters at 45N -45S degrees latitude, and 500
meters at 60N-60S degrees latitude.
1 http://edcdaac.usgs.gov/gtopo30/gtopo30.html
Water Sharing in the Nile River Valley
58 UNEP/DEWA/GRID-Geneva - DR
The DEM GRID was stored in the project with the name rectdem in geographic projection and
demlam in the Lambert Azimuthal projection.
4.3 Hydrological data
4.3.1 River Network
a) DCW
The Digital Chart of the World (DCW) is an Environmental Systems Research Institute, Inc. (ESRI) product originally developed for the U.S. Defense Mapping Agency (DMA) using DMA data. The
precision offered by the Digital Chart of the World (DCW) is of 1:1,000,000.
The Drainage network coverage DNNET was stored in the project with the name dnnet.
b) Arcworld
The ArcWorld database contains a broad range of data that can be used as inputs in water balance modelling. The Rivers and Water bodies layer (RIV3M) of the Arcworld 1:3 million database contains
hydrographic features. This coverage is made of both lines and polygons that represent perennial rivers, intermittent rivers, canals, lakes, reservoirs, perennial lakes, intermittent lakes, salt pans, lagoons, ice
shelves, and islands within inland water bodies.
The Rivers and Water bodies layers from ArcWorld were stored as shapefiles in the project:
rivttawp – shape – Inland waters rvntinta – shape – Perennial river network rvintawa – shape – Non-Perennial river network saltpans – shape – Salt Pans canals – shape – Canals
4.3.2 Basin and Sub-basins
HYDRO1k, developed at the U.S. Geological Survey's (USGS) EROS Data Center1, is a geographic database providing comprehensive and consistent global coverage of topographically derived data sets
(at a resolution of 1 km). The HYDRO1k package provides, for each continent, a suite of six raster and two vector data sets. The raster data sets are the hydrologically correct DEM, derived flow directions,
flow accumulations, slope, aspect, and a compound topographic (wetness) index. The derived streamlines and basins are distributed as vector data sets.
1 http://edcdaac.usgs.gov/gtopo30/hydro/

Water Sharing in the Nile River Valley
UNEP/DEWA/GRID-Geneva - DR 59
The basis of all of the data layers available in the HYDRO1k database is the hydrologically correct
DEM. This DEM is based on the GTOPO30 data set. However, to ensure that the DEM is able to reproduce the correct movement of water across its surface, the DEM is processed to remove elevation
anomalies that can interfere with hydrologically correct flow.1
The drainage basins distributed with the HYDRO1k data set are derived using the vector streamlines
along with the flow direction layer. The basins are seeded following procedures first articulated by Otto Pfafstetter and adapted for use in the HYDRO1k data set2. Each polygon in the basin data set has been
tagged with a Pfafstetter code uniquely identifying each sub-basin. The six-digit Pfafstetter code assigned to each basin carries basin linkage information.
The basin's layer was stored in the project:
nile_ba6 – shape – Nile sub-watersheds nile_ba8 – shape – Nile watershed nile_ba9 – shape – Nile subwatersheds
This methodology is reliable when the relief is clearly defined. However, flat areas induce a high degree of imprecision, and the theoretical river sometimes follows a completely different path from reality. Clear
examples concern Lake Victoria’s outlet in Uganda and the Sudd swamps in southern Sudan.
In the Sudd swamps, for example, the mouth of the River Sobat, one of the major tributaries of the Nile,
is located 200 km farther north in the model than in reality. The Bahr el Ghazal river network is also very different in the elevation-derived database, compared with the DCW. In that region, the Nile
divides into two branches for about 300 kilometers. This is clearly a situation a DEM-derived map cannot cope with. The basin delineation was therefore manually modified in order to respect the
hydrologic network presented in DCW and in ArcWorld.3 The modifications made are not correct .
4.4 Runoff Data
The runoff data used in the project were provided by the Global Runoff Data Centre (GRDC)4. The
centre operates under the auspices of WMO. It closely cooperates with other UN-agencies, International organisations and research institutes. Major activities of the GRDC include the collection
and dissemination of river discharge data on global scale, and the provision of data products and specialised services for the research community, water managers and water-related programmes of the
specialised agencies of the United Nations.
1 Danielson, J.J., 1996. 2 Verdin, 1997. 3 Booth, 1998. 4 http://www.bafg.de/grdc.htm
Water Sharing in the Nile River Valley
60 UNEP/DEWA/GRID-Geneva - DR
The data include 33 stations located in the Nile basin. The values provided by the centre do not all
concern the same period. These can be classified in four categories:
A. 1912-1982/84 Mostly for Sudan, and at the Aswan Dam since 1869. B. 1973-1981/84 Egypt, the other Sudanese stations, and 2 Ugandan stations.
C. 1946/48-1970 Other Ugandan stations, and a Tanzanian one. D. 4-6 year measurements Ethiopia (1969-75 or 1976-79).
The 33 runoff gauge stations are included in the awrivers Arc/Info cover.
4.5 Climate and Water Balance
4.5.1 DAWW
The Digital Atlas of World Water Balance (DAWWB)1, compiled at the University of Austin, contains
five types of data: precipitation, temperature, radiation, runoff and political boundaries. The precipitation, temperature and radiation data are depicted on a 0.5 x 0.5 degree grid spanning the earth
(720 cells East-West, and 360 cells North-South, or 259,200 cells in all), covering both the land surface and the oceans. Mean monthly and mean annual values of each variable are presented in the
form of ArcView shape files.
There are two global data available with precipitation figures in GRID format with cells of 0.5 degree
longitude by 0.5 degree latitude: the Legates-Willmott data set and the Leemans-Cramer data set. The Legates-Willmot data set covers the entire world, while the Leemans-Cramer set only the land surface
of the world (excluding oceans and small islenads). The DAWWB was compiled from the Legates-Willmot data series.
The data were added to the project in the following shapefiles:
niletm – shape – Mean annual temperature nileso – shape – Mean annual soil water holding nilepr – shape – Mean annual precipitation nilera – shape – Mean annual net radiation africa – table – Africa’s climatic and geographic data
4.5.2 Ahn and Tateishi
The Ahn and Tateishi dataset from GRID-Geneva (GNV 187) comprises 39 raster maps of annual and monthly Potential Evapotranspiration, Actual Evapotranspiration and Water Balance (all in mm units).
1 http://www.crwr.utexas.edu/gis/gishyd98/atlas/Atlas.htm

Water Sharing in the Nile River Valley
UNEP/DEWA/GRID-Geneva - DR 61
They cover the whole world at a resolution of 30 min (approximately 55 km), and are representative of
a time period extending from, approximately, 1920 to 1980. This compilation was published in 1994 by C.H. Ahn and R. Tateishi.
Monthly Potential Evapotranspiration was estimated applying the Priestley-Taylor formula to the following global datasets provided by US EPA (Global Ecosystems Database) and UNEP/GRID
Geneva:
§ Edwards Global Gridded Elevation and Bathymetry (ETOPO5);
§ IIASA Mean Monthly Cloudiness: LCCLD01 - LCCLD12;
§ Matthews Seasonal Albedo: MALBFA - MALBWN, from which monthly values were
interpolated;
§ Legates and Willmott Monthly Average Surface Air Temperature and Precipitation (re-
gridded): LCWPR01-LCWPR12, LWTMP01- LWTMP12;
§ Bouwmans Soil Water Holding Capacity.
Each member of the dataset consists of a 720 columns by 360 lines map, with information coded in two byte signed integers. Originally delivered as IDRISI *.img (518,400 bytes) and *.doc files, the data is
stored, at UNEP/ GRID, under a generic binary format. The map projection is Plate Carree.
The GRIDS were stored in the project as:
aetgrd –GRID – Actual Evapotranspiration petgrd – GRID – Potential Evapotranspiration wblgrd – GRID – Water Balance
4.6 Other Features
4.6.1 Population - UNEP/GRID Sioux Falls
The African administrative boundaries and population database from UNEP/GRID Sioux Falls, WRI and NCGIA, was compiled from a large number of heterogeneous sources1. The objective was to
compile a comprehensive database from existing sources and in a fairly short time period that is suitable for regional or continental scale applications. The resources available did not allow for in-country data
collection or collaboration with national census bureaus as was done, for example, in the WALTPS study. With few exceptions, the data sets do not originate from the countries themselves, and none of
the input boundary data have been officially checked or endorsed by the national statistical or mapping agencies.
1 http://grid.cr.usgs.gov/globalpop/africa/index.php3

Water Sharing in the Nile River Valley
62 UNEP/DEWA/GRID-Geneva - DR
The 1990 population database was added to the project. The other data on population were also
prepared. The 1990 population grid was stored as:
popd90bx – GRID – Population density
4.6.2 Vegetation/Land Cover
The USGS Africa land cover data base1 is one portion of a global land cover characteristics data base that is being developed on a continent-by-continent basis. All continents in the global data base share
the same map projections, have 1-km nominal spatial resolution, and are based on 1-km AVHRR data spanning April 1992 through March 1993. Each continental data base has unique elements that are
based on the salient geographic aspects of the specific continent. In addition, a core set of derived thematic maps produced through the aggregation of seasonal land cover regions are included in each
continental data base. These are:
§ Global Ecosystems (Olson, 1994a, 1994b)
§ IGBP Land Cover Classification (Belward, 1996)
§ U.S. Geological Survey Land Use/Land Cover System (Anderson and others, 1976)
§ Simple Biosphere Model (Sellers and others, 1986)
§ Simple Biosphere 2 Model (Sellers and others, 1996)
§ Biosphere-Atmosphere Transfer Scheme (Dickinson and others, 1986)
The IGBP Land Cover Classification was included in the project.
4.6.3 Agriculture
FAO has produced a study on agriculture in the Intergovernmental Authority on Drought and Desertification (IGADD) region2, which covers the Horn of Africa. The surveyed area includes a major
part of the Nile watershed: Eritrea, Ethiopia, Kenya, Sudan and Uganda. Cultivated areas have been located, and the ones which have the potential to host supplementary cultures should be where
agriculture is not intensive and where the soil quality is good. The FAO also focuses on the types of crops now cultivated and the water needs for each crop.
The FAOSTAT3 is an on-line and multilingual databases currently containing over 1 million time-series records covering international statistics in the following areas: production, trade, food balance sheets,
fertiliser and pesticides, land use and irrigation, forest products, fishery products, population, agricultural machinery and food aid shipments. Some of these data available online can be easily integrated in the
project.
1 http://edcdaac.usgs.gov/glcc/afdoc1_2.html 2 VAN VELTHUIZEN H., VERELST L., 1995. 3 http://apps.fao.org/

Water Sharing in the Nile River Valley
UNEP/DEWA/GRID-Geneva - DR 63
4.6.4 Boundaries
The country boundaries were taken from DCW. The coverage was stored as: ponet – cover – Nile’s basin countries boundaries
4.6.5 African Regions
The African administrative boundaries database from UNEP/GRID Sioux Falls, WRI and NCGIA was used. Due to the lack of high quality, published maps showing administrative boundaries for African
countries, this project made use of any available data set. For many of the national boundary coverages there was no information regarding source map scale available. The scales are estimated to vary
between 1:250,000 and 1:5 million.
In order to ensure a close match between different national coverages, and to obtain maximum
compatibility with other standard medium resolution data sets, all national boundaries and coastlines were replaced with the political boundaries template (PONET) of DCW.
4.6.6 Cities
The city shapefile was derived from the ArcWorld coverage. The data has been stored as: cities – shape – Biggest cities
4.6.7 Roads
Arcworld and DCW road coverages were prepared for the project.
4.6.8 Railroads
Arcworld and DCW railroad layers were also prepared for the project.
4.6.9 Airports
The 1999 ESRI Data & Maps is a five CD-ROM set of ready-to-use data that is bundled with
ArcView GIS 3.2, MapObjects, and Atlas GIS. Included are many types of map data at many scales of geography provided in a shapefile format. The data can be read directly from the CD-ROM.
Data from the CD such as airports were prepared for the project.

Water Sharing in the Nile River Valley
64 UNEP/DEWA/GRID-Geneva - DR
4.6.10 Mines
Some data resources are directly available on the USGS website. The mineral resources online spatial data1 offers various datasets. From these a shapefile on mines resource data was downloaded and
prepared for the project.
1 http://mrdata.usgs.gov/index.html

Water Sharing in the Nile River Valley
UNEP/DEWA/GRID-Geneva - DR 65
4.7 Map Projections
The projection chosen to process Lambert Azimuthal Equal-Area (reference latitude: 15°, central
meridian: 30°). This projection was developed by Lambert in 1772 and is typically used for mapping large regions like continents and hemispheres. It is an azimuthal, equal-area projection, but is not
perspective. Distortion is zero at the center of the projection, and increases radially away from this point.


Water Sharing in the Nile River Valley
UNEP/DEWA/GRID-Geneva - DR 67
PART II. RESULTS
5 ARCVIEW PROJECT DESCRIPTION
5.1 Generalities
The Nile Project is being carried out in the framework of GIS analysis and modelling, wherein physical
characteristics of the watershed are compared with human constraints. The methodology used is presented in several projects developed by the Center for Research in Water Resources (CRWR),
University of Texas at Austin. It consists of using geographically distributed parameters such as precipitation and evaporation to compute water balance within a watershed, which leads to an estimate
of runoff available as a surface water resource.
The ArcView 3.1 software with its Spatial Analyst and Hydrologic Modeling extensions was used to
develop the project.
5.2 Starting the project
While starting the GRID-Geneva Nile Project a window listing the different views available appears.
Figure. Start Window

Water Sharing in the Nile River Valley
68 UNEP/DEWA/GRID-Geneva - DR
5.3 Project views
The Project includes views for the presentation of each dataset and for each process of the water balance carried out. The views properties were set up in order to take into consideration the projection
of the data included in the project.
5.4 Scritps
All the scripts used in the different steps were added to the project. Some of these scripts, as the
clipping images ones, come from the ESRI scipts website 1, some were developed at CRWR and some were created at GRID-Geneva. Modifications to the avenue codes were made to some of the scripts
not developed at GRID.
5.5 Tables
The table included in the project are related to the attributes of some themes included in the project
(DAWW for Africa, Ahn & Tateishi, Subwatersheds) or were created by scripts used in the project (water balance). Some themes were created or modified by editing their table of attributes (adding
values). Effectively, by editing the table of attributes, one can easily add new fields to the theme (data can also be modified or created by editing the table in Excel).
1 http://gis.esri.com/arcscripts/scripts.cfm

Water Sharing in the Nile River Valley
UNEP/DEWA/GRID-Geneva - DR 69
6 WATERSHED DELINEATION
6.1 General methodology
The first step was the delineation of the Nile Basin and sub-basins within the Nile Basin. The method used to delineate the basins is described by Maidment et al.1. The sub-basins were delineated from the
30-arc-seconds DEM developed by the USGS.
The standard methodology for delineating streams and watersheds from DEMs is based on the eight
pour-point algorithm. This algorithm identifies the grid cell, out of the eight surrounding cells, towards which water will flow if driven by gravity. This methodology consists of:
(1) Filling the sinks of the DEM, i.e., increasing the elevation of the points that are fictitious pits.
(2) Determining the flow direction, i.e., identifying the cell towards which water will flow.
(3) Calculating the flow accumulation, i.e., evaluating the drainage area in units of grid cells.
(4) Identifying the stream cells, i.e., flagging those cells with a flow accumulation value greater than a certain user-defined threshold value.
(5) Labeling the links, i.e., assigning a label (number) to each reach of the stream network.
(6) Delineating the watershed for each link, i.e., determining the incremental drainage area associated with each link.
An extra and prior process can be added to this methodology. It consists of burning-in the digitized streams that have been observed in the field. This burning-in process consists of raising the elevation of
all the cells but those that coincide with the digitised streams. By doing this, water is forced to remain in the streams once it gets there; however, it is not forced to flow towards them. Extensive experience at
the CRWR has shown that the streams delineated using this improved methodology represent much better the real stream network. This process consists of:
(a) Converting the line coverage of digitised streams into a grid (with value 1 in the stream cells and NODATA elsewhere). Make sure that this grid presents continuous streams (no gaps), does not involve short circuits, and extends out of the study area.
(b) Adding a constant value to the DEM.
(c) Merging the two grids together, keeping the stream grid on top of the modified elevation grid, to obtain the burned-DEM.
After these three steps have been performed, the standard methodology described above is applied to the burned-DEM.
1 Maidment et al., 1997.

Water Sharing in the Nile River Valley
70 UNEP/DEWA/GRID-Geneva - DR
6.2 Projection
Before DEMs can be used in any type of spatial analysis, they must be projected from their original ellipsoid onto a flat surface. The DEM was projected using the Lambert Azimuthal Equal-Area
projection (see chapter 4). This map projection was chosen to preserve areas and the mutual relationship among the directions of the lines.
As projections of GRID cannot be done in ArcView 3.1, the DEM was projected in Arc/Info. The file obtained was called Demlam (figure 17).
Figure 17. DEM projected

Water Sharing in the Nile River Valley
UNEP/DEWA/GRID-Geneva - DR 71
6.3 Watershed delineation
6.3.1 Setting the DEM
This part consists of modifying the DEM, by burning-in the streams and by filling the sinks, so that ArcView hydrologic functions can be implemented. Assuming that the name of the working View
Window is SettingDEM, and that it contains the Arcworld stream coverage and the DEM grid (Demlam), to modify the DEM:
§ Select the arcs and polygons of the stream coverage that correspond to the Nile river system.
§ Create a shapefile of the selected arcs by going to Theme/Convert to Shapefile, writing a file name in the dialog box, and adding it as a new theme to the View.
§ Convert the theme into a grid-theme by making it active, going to Theme/Convert to Grid and selecting any field for the grid value.
§ Divide the grid by itself, so that all the cells are assigned value 1, by going to Analysis/Map Calculator and entering the corresponding mathematical operation in the map calculator dialog box.
§ Multiply the resulting grid by the DEM by going to Analysis/Map Calculator and entering the corresponding mathematical operation in the map calculator dialog box.
§ This grid-theme was named Streams DEM because it stores the DEM value only in the stream cells.
§ Add 5000 m to the DEM grid by going to Analysis/Map Calculator and entering the corresponding mathematical operation in the map calculator dialog box.
§ This grid-theme was named DEM Plus because it stores the DEM value increased by 5000 m.
§ Edit a Merge Grids script.
§ Compile the script by going to Script/Compile.
§ Run the script by going to Script/Run. A grid called Burndem and a theme called Burndem in the View will be created.
Fill the Burndlam grid by going to Hydro/Fill:
§ Use standard filling functions to fill the entire DEM without consideration of maintaining any sinks.
§ Determine areas of "sinks" in DEM by differencing the original and filled DEMs.
§ Create a mask of sink areas, group into uniquely numbered zones and calculate areal extent of sinks and maximum depth.
§ Threshold sink zones according to area or depth criteria.
§ Check sink areas and discard those that correspond to reservoirs and other non-sink features.
§ Place a NODATA seed at minimum elevation in each sink zone.
§ Fill the BurndeDEM, check, and iterate.

Water Sharing in the Nile River Valley
72 UNEP/DEWA/GRID-Geneva - DR
The Nile burndlam grid being too big (see chapter 4) to be processed with ArcView on a PC for the
selected box (temporary files generated during the computation 4 times bigger than original file), the grid was clipped (set nodata to parts of the box not included in the Nile Basin) in order to make its size
smaller(figure 18).
Figure 18. Filled Burndem
The Filled Burndem grid was saved by making it active, going to Theme/Save Data Set and writing the file name in the dialog box.
This Filled DEM (Fillburn) is the modified DEM.

Water Sharing in the Nile River Valley
UNEP/DEWA/GRID-Geneva - DR 73
6.3.2 Flow Direction and Flow Accumulation GRIDs
To determine the Flow Direction Grid the modified DEM (filledburn) must be the active theme, then from the Menu options the menu item Hydro / Flowdirection is selected. A new grid called Flow
Direction is computed. The grid was stored in the project with the name Fdir.
Figure 19. Flow Direction GRID
The flow accumulation grid is obtained wile the Flow Direction theme is active by selecting Hydro / Flow Accumulation from the View menu bar. This causes Arcview to run the Flow Accumulation
function, which counts the number upstream cells of each cell in the grid, and places the result in new grid. The new grid was stored in the project as Facc.

Water Sharing in the Nile River Valley
74 UNEP/DEWA/GRID-Geneva - DR
6.3.3 Delineating Streams and Watersheds
The stream and watershed delineation can be made by the Watersheds script developed at CRWR.
To run this script:
§ In the View window, make the Filled Burndem grid-theme active.
§ Open the script Watersheds, compile it if necessary by going to Script/Compile.
§ Run the script by going to Script/Run. Two grids, Wshed and Stream, have been created, and their corresponding grid -themes have been added to the View.
§ Vectorize the Wshed grid by making it active, going to Theme/Convert to Shapefile, and writing a file name in the dialog box.
§ The script, uses a threshold of 10,000 grid cells, i.e., 10,000 Km2. This number, though, can be changed manually in the script according to the user needs.
The intersect command yielded the extent of the drainage area in the territory of each country.
6.3.4 Using the Hydrologic Modeling Extension
To take full advantage of the Hydrologic Modeling Extension, the name of the flow-direction and flow-accumulation grids were entered in the Hydro/Properties dialog box. Once the name of these grids has
been entered, the buttons and the function become active.
Figure 20. Flow-Paths for the Nile River Bassin

Water Sharing in the Nile River Valley
UNEP/DEWA/GRID-Geneva - DR 75
After making active the Filled Burndem grid -theme, cliking the R button enables the flow-path function.
Clicking on any point of the View display area will generate a flow-path line that runs from the point to its pour point or out of the analysis area. More than one point might be cliked and all the flow-paths are
displayed at once. Figure 20 shows the results of applying the flow-path function in six points of the study area.
Clicking the W button with the Filled Burndem grid-theme active enables the watershed function. Clicking on any point of the View display area will generate a watershed grid for the selected point.
By choosing watersheds in the Hydro menu, one can also delineate the streams and watersheds, as described in point 6.3.3. The streams and watersheds, of the Nile River basin, delineated with this
methodology is shown in figure 22.
Figure 21.Nile River Streams and Watersheds

Water Sharing in the Nile River Valley
76 UNEP/DEWA/GRID-Geneva - DR
6.3.5 Vectorize watersheds and streams
Grids are excellent for cell based analysis, however, vector data are easier to use and store. Therefore the watersheds and streams grids were converted to vector format.
6.4 Discussion
While delineating the Nile River basin and sub-basins, problems were faced, due principally to the size of the basin and the DEM resolution.
The file size of the grids used created a lot of problems, due to the computer capacity (available when this stage of the project was developed). To compute filling, ArcView generates intermediary files with a
size several times bigger that the size of the initial file. A solution found to this problem was to clip the burned DEM in order to decrease the size of the file (set nodata to parts of the box not included in the
Nile Basin).
The DEM resolution of about 1 km is not accurate enough to compute modelling in such a complex
and extent basin. The drainage layers used in the project differ of distances bigger than 1 pixel (~1km). In an area such as the Lake Plateau and the Ethiopian Plateau this can make big differences when
burning the DEM. Also, considering the numerous projects already developed with success in the region, the model to be developed should be as accurate as possible. A suggestion would be to
proceed with the project, sub-basin by sub-basin, adapting the projection to the projections used at the scale of the region/country. In its local project FAO encouraged all the basin countries to develop their
own datasets at high resolution. Those include DEM and river network. Therefore project at the basin scale should use those data, available in each country. This would then imply a partnership with local
agencies and universities.
The Sudd swamps. flat, with its numerous water courses, is difficult to model with such a technique.
From Bor, the river enters in a swampy area. Water can be transported either by the Bahr el Jebel, either the Bahr el Zaraf, and important losses are observed. This region should therefore be considered
in the model as a lake.
Another problem is encountered with the Rosetta and Damietta branches, as this technique considers
that water only goes through an unique way. Therefore all basins determined with this method has as outlet the runoff station n.°1, situated at El Ekhsase.
There was not so much information permitting to decide which sinks should be eliminated. Every sink eliminates was stored in order to check the process implemented. Authors have different boundaries of
the Nile Basin.

Water Sharing in the Nile River Valley
UNEP/DEWA/GRID-Geneva - DR 77
As mentioned in the introduction, new products such as Arc/Info 8 have now been developed by ESRI.
These softwares offer new possibilities, therefore the applications should be developed with such products.

Water Sharing in the Nile River Valley
78 UNEP/DEWA/GRID-Geneva - DR
7 WATER BALANCE MODELLING
7.1 Soil Water Balance
For a basic soil water balance, it is necessary to have information on the following parameters:
§ precipitation on a monthly basis or preferably at shorter intervals;
§ actual evapotranspiration on the same time intervals as precipitation;
§ soil water storage capacity.
For a more advances soil water balance information is also necessary on other parameters such as:
§ groundwater seepage in the saturated zone (not available here);
§ land use;
§ advanced soil characteristics (soil conductivity and soil moisture content at different pressure heads), necessary to calculate the water balance and calculate the water balance of the unsaturated zone (not available here).
DAWW included the temperature, radiation, precipitation, and water holding capacity for Africa.
Avenue scripts developed at CRWR, which calculate potential evaporation and the soil moisture budget using the Priestley-Taylor equations, were used.
An Avenue script is used to calculate the soil water budget. The actual calculations are done on a daily basis in the program. Values of the monthly precipitation and potential evaporation are divided by the
number of days in the month to give average daily values. The runoff or water surplus in each day is found as the product of the precipitation and the ratio of the actual soil moisture level to the soil moisture
capacity. The evaporation in each day is found as the product of the potential evaporation and the ratio of actual soil moisture level to the soil moisture capacity. A trial calculation is done to find the end of day
storage and if this exceeds the soil moisture capacity, the excess soil moisture is added to the water surplus and the storage is reset to the soil moisture capacity before the next day's computations are
done. This algorithm is limited by the fact that it assumes that a month's rain falls as a gentle mist instead of in concentrated daily amounts with zero rainfall in between. This simplification is offset by allowing a
small amount of runoff or water surplus in each day, as occurs with a soil slowly draining to a stream. The algorithm used here can also be applied with daily data files when such data are available and then
its daily results are more realistic.
The climate data used are mean monthly values for the period of record. The computations are done for
the 12-month representative period several times in sequence, until the computed soil moisture levels in each month stabilise to constant values. These values represent expected monthly soil moisture levels.
The results included in the project were not satisfactory. The scripts sets negative values equal to 0. In a basin such as the Nile one, with the enormous losses observes, most of the values are negative. A new
script should be developed, using formulas already used with success in such a complex Basin.

Water Sharing in the Nile River Valley
UNEP/DEWA/GRID-Geneva - DR 79
7.2 Runoff
Runoff can be calculated by means of soil water balance or by means of runoff coefficients Calculating runoff by means of runoff coefficients is a conceptual way of calculating runoff while runoff coefficients
are obtained by comparing river discharges with precipitation statistics.
Calculation of runoff by means of a runoff coefficient is done according to (1):
(1) PrQrunoof ×=
where Qrunoff = runoff discharche
r = runoff coefficient P = precipitation
This step was not processed.
7.3 Estimation of Surface Water Yield by Using a Rainfall-Runoff Function
A first methodology was developed at CRWR.1 The model described is a grid-based spatially-
distributed mean-annual water balance model that uses time-averaged precipitation (in the form of grid) and flow at specific gauging stations (in the form of points) data, and topographic data (in the form of
digital elevation model). After delineating the river drainage area and determining the flow network within the basin (grid-cells connectivity), a relation between the potential flow Qp (calculated as if all
precipitation runoffs) and the actual flow Qa is determined. This relation has the form Qp = c Qa, in which c is a runoff coefficient dependent on the precipitation in the drainage area, and allows one to
estimate actual flow at any location of the basin.
This step was not processed in the project.
7.3.1 Contribution of the watershed to the main stream flow
Given the mean-annual precipitation grid (Legates and Willmott, 1990), the mean-annual actual flow at the flow gauging stations (obtained from the Global Runoff Data Center in Koblenz, Germany), and the
DEM, a methodology based on the runoff coefficient concept for determining the watershed contribution to the main stream was developed. This methodology considers that not all the water
entering the system as precipitation flows to the main river, and that only a small fraction of the total precipitation does so, while most of it is lost as evaporation.
1 Maidment & Al. 1995

Water Sharing in the Nile River Valley
80 UNEP/DEWA/GRID-Geneva - DR
7.4 River and Reservoir Routing Using the Rivers Model
Once the runoff has been calculated using the methods presented above, the flow needs to be routed to the watershed outlet, and then through the river system. The Rivers Model developed at CRWR is a
fairly comprehensive system for routing water in rivers, including the effects of reservoirs, water flow over the land surface and in the subsurface environment, and optimisation of watershed model
parameters. The model was originally developed by Zichuan Ye and David Maidment and contains methods developed by Francisco Olivera for watershed runoff routing. The reservoir water balance
component was subsequently developed by Kwabena Asante.
The model has five major components:
1. A pre-processor for modifying input coverages, and creating the output files required by the program.
2. A surface water simulator for interpolating missing rainfall records, computing surplus runoff and routing flows through the basin, in a map-based environment.
3. An optimisation model for determining the values of watershed runoff-response parameters that produce the best match between observed and generated runoff time series.
4. A reservoir simulator for inserting and removing dams and for performing monthly reservoir water balance within the map based environment.
5. A ground water simulator for computing water levels and flux across boundaries of cells defined over the aquifer region within the map environment.
7.5 Discussion
There was not enough time to purchase the objectives of this phase. The water balance scripts developed at CRWR cannot be used within the Nile Basin. New scripts based on the formulas used in
the region and mentioned in bibliography should be incorporated in new scripts.
Considering the remarks made in the previous chapter, the development of such a phase should also be
made at the scale of the sub-basin, considering area such as the Sudd swanps as a reservoir. A problem will be encountered at the Damietta and Rosetta branches.
The development of these phase should now be done using the new ESRI products, as mention previously.

Water Sharing in the Nile River Valley
UNEP/DEWA/GRID-Geneva - DR 81
TECHNICAL & OTHER RECOMMENDATIONS
The following recommendations are made for the eventual continuation of the GRID-Geneva Nile River
Valley project, or similar projects in other basins.
The first comment is that the development of such a project should be done with local partners. If
other similar projects should be developed at GRID, those should cooperate with existing projects in the region of interest. In the case of the Nile River Basin and related in this report, there are several
projects, probably the most interesting of which is FAO’s Nile Basin Water Resources project, which operates directly in the field, offers training and structures to the Nile Basin countries, and concentrates
on the entire basin. Universities and local administrations should also be contacted in the region.
This project was developed using ArcView software on a PC with little disk space. As the project files
are very large, due to the size of the Nile Basin and the resolution used, the intermediate files created by the scripts and modules used were up to > four times bigger that the initial files. Therefore, much long
time was lost. Today’s technology continues to develop rapidly and current computers have more disk space and rapid processors. It therefore becomes easier to use such software.
Any further continuation should be done with the Arc/Info software, which with its ArcGis Hydro Model gives the user many possibilities. Interesting developments are made at CRWR. Arc/Info also
permits the user to make projections of grids, which are not permitted in ArcView.
Some parts of the Nile Basin are difficult to access. Remote sensing technologies – used with
success by GRID – could be applied in such case studies.
Other data that could be used in such a project are those included in the FAO database. With the
development of the UNEP.Net portal, other interesting data will probably be accessible in the near future.
It is necessary to proceed sub-basin by sub-basin with DEMs of better resolution. Complex basin networks covering such flat areas need to be extrapolated from more detailed grid surfaces.
An environmental component which is water quality should be added to this project at a future stage.
The documents and links collected for this project should be integrated in a single website. At the
beginning of this project there was little information on other Nile River projects available on the Internet. Now several descriptions can be found, but there is still a lot of information missing, or not well
organized, even on the Nile Basin Initiative website.

Water Sharing in the Nile River Valley
82 UNEP/DEWA/GRID-Geneva - DR
CONCLUSIONS
General
Water is a truly strategic resource: vital, coveted and badly distributed. Moreover it is often very badly managed. This resource is subject to major pressures such as: demographic; economic; growth of
agglomerations; and ecological (degradation of the resource in quantity and quality). To this it is necessary to add structural, financial and technical constraints.
In order to mitigate the social, economic and environmental problems which may emerge due to water shortage, and could in the near future become a major limitation for agricultural production in the world
in general and particularly in Africa, it would be advisable to consider opportune measures. Development of GIS models can help people understand the problems they are facing and help
stakeholders to make decisions. It can be an important tool of communication and sharing knowledge, attributes which are now of high interest to international organisations and NGOs operating in the field.
Technical
Today, the development of Arc/Info 8 for PC, in which objects interact through interfaces designed
according to a common standard (with its module ArcGIS Hydro Data Model, which ESRI is developing in collaboration with partners), promises a rapid development of friendly GIS products for
water resources management. The use of ArcView for water management activities is therefore superseded, as the user now has more possibilities and advantages in using the Arc/Info software.
Not all the objectives fixed at the beginning of this project were fulfilled. This is due to the limited timeframe, the lengthy bibliography needed for its development and other problems encountered. The
fact that such techniques imply one route for the water routing makes it difficult to model some zones of the basin. Scripts for the project can be developed according to the formulas included in the
bibliography compiled during this phase.
During the elaboration of the present project, it was found that there already exist several very advanced
projects on the Nile River valley. To develop a project such as this one, considering the complexity of the basin, its size, physiography, political divisions and general situation, UNEP and GRID-Geneva
should envisage a partnership with projects implemented in the region, local agencies and universities. In the world of international cooperation, one should try to strengthen efforts in order to optimise
resources, so that local people could directly take advantage of such products and techniques.

Water Sharing in the Nile River Valley
UNEP/DEWA/GRID-Geneva - DR 83
BIBLIOGRAPHY
AKMANSOY SANDRA. 1996. Southeastern Anatolian Project, University of Texas at Austin Department of Civil Engineering, December 6, 1996.
APPELGREN, B. & KLOHN W. 1997. Management of Transboundary Water Resources for Water Security: Principles, Approaches and State Practices, in Natural Resources Forum, Special Issue on Transboundary Water Resources, May 1997.
BOOKMILLER, ROBERT J. & BOOKMILLER, KIRSTEN NAKJAVANI. 1996. Yearbook of the CIP 1996.
BOOTH J., JAQUET J.-M. 1998. A proposal for the Nile river Basin, UNEP/DEWA/GRID-Geneva, December 1998.
BRISCOE, JOHN AND GARN. HARVEY A. 1995. "Financing water supply and sanitation under Agenda 21." Natural Resources Forum 19.1 (1995).
CHARRIER BERTRAND, DINAR SHLOMI, & HINIKER MIKE. Water, Conflict Resolution and Environmental Sustainability in the Middle East.
DANIELSON, J.J. 1996. Delineation of drainage basins from 1 km African digital elevation data. In: Pecora Thirteen, Human Interactions with the Environment - Perspectives from Space, Sioux Falls, South Dakota, August 20-22, 1996.
DOWDESWELL, ELIZABETH. 1996. Our Planet. Volume 8. N. 3.
EL-ASHRY MOHAMED T. 1998. Finding Solutions to Water Disputes, "Water and Dispute Prevention: South Perspective" Center For The Global South The American University Washington, DC, March 10, 1998.
FAO. Systematic Index of International Water Resources Treaties, Declarations. Acts and Cases, by
Basin: Volume I. Legislative Study #15, 1978; #34, 1984.
FAO. 1993. A Water Polic ies and Agriculture, The State of Food and Agriculture, FAO Agriculture Series No. 26, FAO, Rome, Italy.
FAO. 1995. Dimensions of need. An atlas of food and agriculture. Rome, Italy.
FAO. 1997. Irrigation potential in Africa: A basin approach, FAO LAND AND WATER BULLETIN 4.
FAO. 1998. Monitoring, Forecasting and Simulation of the Nile River in Egypt - Phase III ; Project Status, July 1998.
FOSTER, STEPHEN. 1996. Ground for concern. Our Planet. Volume 8. N. 3.
GEORGAKAKOS, A.P. 1989. "Extended Linear Quadratic Gaussian (ELQG) control: Further extensions," Water Resources Research , 25(2), 191-201.

Water Sharing in the Nile River Valley
84 UNEP/DEWA/GRID-Geneva - DR
GEORGAKAKOS, A.P. 1991. A Computer-Aided Management of the Southeastern U.S. Reservoir System, in " Decision Support Systems," D.P. Loucks, ed., NATO ASI Series, Vol. G 26, pg. 407-428.
GEORGAKAKOS, A. P. 1993. Operational tradeoffs in reservoir control, Water Resources Research , 3801-3819, Vol. 29, Nov.
GEORGAKAKOS, A.P. & MARKS D.. 1987. A New Method for the Real-Time Operation of Reservoir System, Water Resources Research, 23(7), 1376-1390.
GEORGAKAKOS, A.P. & YAO H. 1995. A Decision Support System for the Equatorial Lakes, Technical Report No.GIT/CEE-HYDRO-95-7, School of Civil and Environmental Engineering, Georgia Tech, Atlanta, September 1995.
GEORGAKAKOS, A.P., YAO, H., and YU Y. 1996a. A Control Model for Dependable Hydropower Capacity Optimization, forthcoming, Water Resources Research.
GEORGAKAKOS, A.P. YAO H., & YU Y. 1996b. A Control Model for Hydroelectric Energy Optimization, forthcoming, Water Resources Research.
GEORGAKAKOS, A.P. YAO H., & YU Y. 1997. A Control Model for Hydroelectric Energy Value Optimization, ASCE J. for Wat. Res. Plan. and Mgt., Vol. 123, No. 1, pg. 30-38.
GEORGAKAKOS ARIS P. A Decision Support System for the Nile River Water Resources Center, School of Civil and Environ. Engineering, Georgia Tech, 790 Atlantic Drive, Atlanta, Georgia 30332, U.S.A. Wulf Klohn Land and Water Development Division, Food and Agriculture Organization, of the United Nations, Viale delle Terme di Caracalla, 00100 Rome, Italy.
INFOMUNDI. 1997. Planet Water, Documentation and Information Service about Developing Countries, March 1997.
ISLAM NURUL. 1996. Sure and sustainable. Our Planet. Volume 8. N. 4.
KITE, G. W. 1981. Recent changes in lake Victoria, 26, 3, 9/1981.
KIVUGO, MRISCHO M. 1999. Towards Technical Cooperation in the Nile Basin, Seventh Nile 2002 Conference, Cairo, Egypt, March 1999.
KLOHN WULF & MIHAILO ANDJELIC, Lake Victoria: A Case in International Cooperation, FAO.
KOREN V., Riverside Technology Inc. Denver, Co & BARRETT C. B. 1994. NOAA/NWS/OH/MFS Project Silver Spring, Md, Satellite Based Distributed Monitoring, Forecasting, And Simulation (MFS) System For The Nile River Application Of Remote Sensing In Hydrology (Proceedings of the Second International Workshop, NHRI Symposium No. 14, October, 1994) NHRI, Saskatoon.
KWABENA ASANTE, MAIDMENT DAVID R. GIS Based Reservoir Planning for the Souss Basin, Morocco prepared by and CRWR Online Report 97-7.
LAMB H.H. 1966. Lamb, 1966. The changing climate. Methuen (London), Chapter 5.
MAIDMENT D. & AL. 1995. Mean-Annual Water Balance of the Niger River, West Africa; Predicting the Water Balance of Surface and Ground Water Resources Over Large Are as UNESCO Symposium on Runoff Computations for Water Projects St. Petersberg, Russia, Oct. 30 - Nov. 3, 1995.

Water Sharing in the Nile River Valley
UNEP/DEWA/GRID-Geneva - DR 85
MAIDMENT D. & YE Z. Map-based Surface and Subsurface Flow Simulation Models: An Object Oriented and GIS Approach prepared by CRWR Online Report 96-5.
MAIDMENT DAVID R., OLIVERA FRANCISCO, REED SEANN, YE ZICHUAN, AKMANSOY SANDRA & MCKINNEY DAENE C. Water Balance of the Niger River Basin in West Africa prepared by, and presented at the 1997 ESRI User's Conference, San Diego, California.
OKIDI, C.O. 1990. History of the Nile and Lake Victoria Basins through Treaties, in The Nile: Resource Evaluation, Resource Management, Hydropolitical and Legal issues. eds. Howell and Allan. SOAS, University of London: London.
POSTEL, SANDRA. 1996. Worldwatch Institute.
SAHIN MAMDOUH. 1985. Hydrology of the Nile River Basin, Amsterdam.
SAID RUSHDI. 1993. The river Nile, Geology, Hydrology and Utilization, former head of the Geoogical Survey of Egypt, Pergamon press.
SMITH JULIE M. 1996. Nine Nations, One Nile, Population-Environment Dynamics: Ten Case Studies University Of Michigan Eih 575, Monograph, Fall Term.
SHI/UNESCO. 1999. http://webworld.unesco.org/water/ihp/db/shiklomanov/index_en.shtml
TOPFER KLAUS. 1997. Our Planet, Editorial, Vol. 9 N.°4.
UNEP. 2000. GEO 2000.
VAN VELTHUIZEN H., VERELST L., 1995, Crop Production System Zones of the IGADD Sub-Region. Intergovernmental Authority on Drought and Development and Food and Agriculture Organisation of the United Nations.
VERDIN KRISTINE L. AND JENSON SUSAN K. Development of Continental Scale Digital Elevation, Models and Extraction of Hydrographic Features.
WATERBURY J. 1987. Water Resources Development, p.92-104, Vol. 3, N. 2, 1987.
WHITTINGTON D. BAILEY C. 1987. Water Resources Development, Vol. 3, N. 2, 1987.
WIJKMAN, ANDERS. 1996. The stuff of life. Our Planet. Volume 8. N.3 1996.
WOLF AARON T. 1997. "Water Wars" and Water Reality: Conflict and Cooperation along International Waterways, Department of Geography, University of Alabama.