water-surface elevation and discharge measurement data … · 2016-08-24 · fargo diversion board...
TRANSCRIPT
U.S. Department of the InteriorU.S. Geological Survey
Prepared in cooperation with the Fargo Diversion Board of Authority
Water-Surface Elevation and Discharge Measurement Data for the Red River of the North and its Tributaries near Fargo, North Dakota, Water Years 2014–15
Open File Report 2016–1139
U.S. Department of the InteriorU.S. Geological Survey

Cover. Wild Rice River looking upstream from the bridge on County Road 16 near St. Benedict, North Dakota, October 13, 2011. Photograph by Rochelle A. Nustad, U.S. Geological Survey.
Water-Surface Elevation and Discharge Measurement Data for the Red River of the North and its Tributaries near Fargo, North Dakota, Water Years 2014–15
By William C. Damschen and Joel M. Galloway
Prepared in cooperation with the Fargo Diversion Board of Authority
Open File Report 2016–1139
U.S. Department of the InteriorU.S. Geological Survey

U.S. Department of the InteriorSALLY JEWELL, Secretary
U.S. Geological SurveySuzette M. Kimball, Director
U.S. Geological Survey, Reston, Virginia: 2016
For more information on the USGS—the Federal source for science about the Earth, its natural and living resources, natural hazards, and the environment—visit http://www.usgs.gov or call 1–888–ASK–USGS.
For an overview of USGS information products, including maps, imagery, and publications, visit http://store.usgs.gov.
Any use of trade, firm, or product names is for descriptive purposes only and does not imply endorsement by the U.S. Government.
Although this information product, for the most part, is in the public domain, it also may contain copyrighted materials as noted in the text. Permission to reproduce copyrighted items must be secured from the copyright owner.
Suggested citation:Damschen, W.C., and Galloway, J.M., 2016, Water-surface elevation and discharge measurement data for the Red River of the North and its tributaries near Fargo, North Dakota, water years 2014–15: U.S. Geological Survey Open-File Report 2016–1139, 16 p., http://dx.doi.org/10.3133/ofr20161139.
ISSN 2331-1258 (online)
iii
Contents
Abstract ...........................................................................................................................................................1Introduction.....................................................................................................................................................1Purpose and Scope .......................................................................................................................................1Methods...........................................................................................................................................................1
Water-Surface Elevations ...................................................................................................................4Discharge Measurements ...................................................................................................................4
Water-Surface Elevations and Discharge Measurements .....................................................................4Red River of the North ..........................................................................................................................4Sheyenne River ...................................................................................................................................10Wild Rice River ....................................................................................................................................12Maple River ..........................................................................................................................................15
Summary........................................................................................................................................................16References Cited..........................................................................................................................................16
Figures
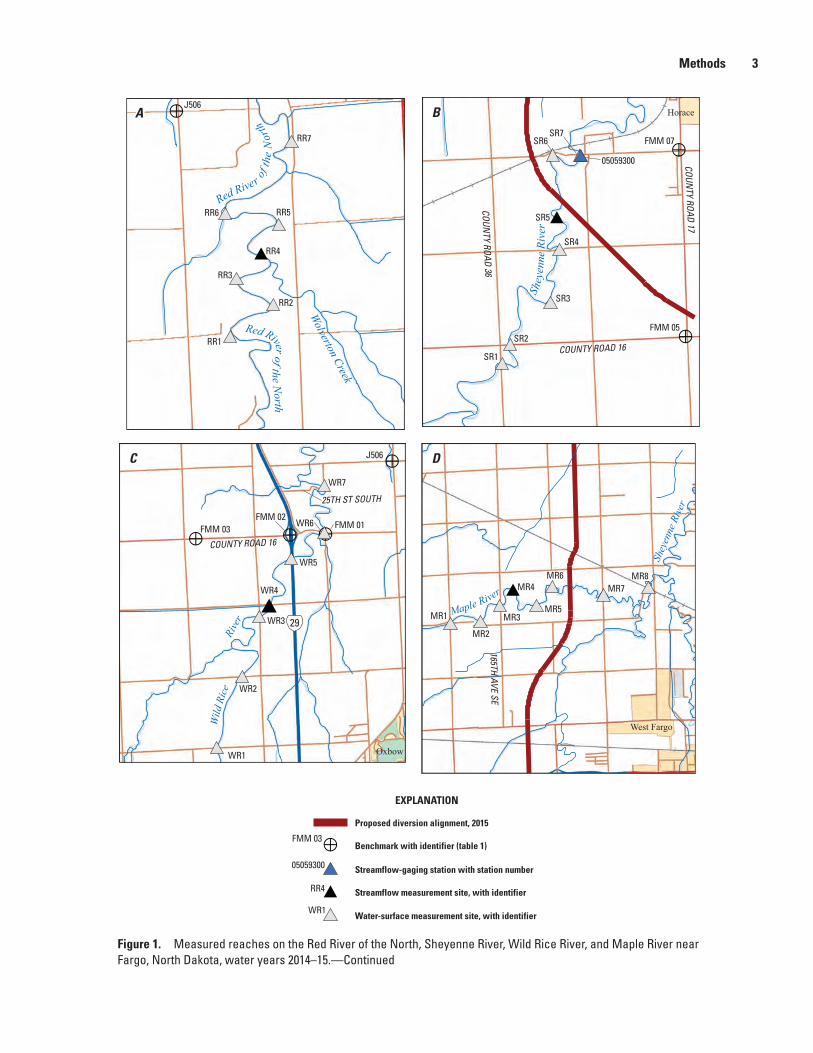
1. Maps showing measured reaches on the Red River of the North, Sheyenne River, Wild Rice River, and Maple River near Fargo, North Dakota, water years 2014–15 .........2
2. Graphs showing daily mean discharge and data collection dates for the Red River of the North, Sheyenne River, Wild Rice River, and Maple River near Fargo, North Dakota, water years 2014–15 ......................................................................................................8
3. Graph showing water-surface profiles from measurements made on the Red River of the North near Fargo, North Dakota, water years 2014–15 .............................................10
4. Graph showing water-surface profiles from measurements made on the Sheyenne River near Fargo, North Dakota, water years 2014–15 .........................................................12
5. Graph showing water-surface profiles from measurements made on the Wild Rice River near Fargo, North Dakota, water years 2014–15 .........................................................14
6. Graph showing water-surface profiles from measurements made on the Maple River near Fargo, North Dakota, water years 2014–15 .........................................................16
Tables
1. Location and verification of benchmarks used during reach surveys on the Red River of the North, Sheyenne River, Wild Rice River, and Maple River near Fargo, North Dakota, water years 2014–15 ...........................................................................................5
2. Discharge measurement summary for selected reaches on the Red River of the North, Sheyenne River, Wild Rice River, and Maple River near Fargo, North Dakota, water years 2014–15 .....................................................................................................................7
3. Water-surface elevations and discharge measurements made on the Red River of the North near Fargo, North Dakota, water years 2014–15 ...................................................9
4. Water-surface elevations and discharge measurements made on the Sheyenne River near Fargo, North Dakota, water years 2014–15 .........................................................11
5. Water-surface elevations and discharge measurements made on the Wild Rice River near Fargo, North Dakota, water years 2014–15 .........................................................13
6. Water-surface elevations and discharge measurements made on the Maple River near Fargo, North Dakota, water years 2014–15 ...................................................................15
iv
Conversion Factors
U.S. customary units to International System of Units
Multiply By To obtain
Length
foot (ft) 0.3048 meter (m)mile (mi) 1.609 kilometer (km)
Area
acre 4,047 square meter (m2)square mile (mi2) 2.590 square kilometer (km2)
Flow rate
cubic foot per second (ft3/s) 0.02832 cubic meter per second (m3/s)Hydraulic gradient
foot per mile (ft/mi) 0.1894 meter per kilometer (m/km)
Datum
Vertical coordinate information is referenced to North American Vertical Datum of 1988 (NAVD 88).
Horizontal coordinate information is referenced to North American Datum of 1983 (NAD 83).
Elevation, as used in this report, refers to distance above the vertical datum.
Supplemental Information
A water year (WY) is the period from October 1 to September 30 of the following year and is designated by the year in which it ends.
Abbreviations
GNSS Global Navigation Satellite System
NGS National Geodetic Survey
RTK real-time kinematic
USGS U.S. Geological Survey
Water-Surface Elevation and Discharge Measurement Data for the Red River of the North and its Tributaries near Fargo, North Dakota, Water Years 2014–15
By William C. Damschen and Joel M. Galloway
AbstractThe U.S. Geological Survey, in cooperation with the
Fargo Diversion Board of Authority, collected water-surface elevations during a range of discharges needed for calibration of hydrologic and hydraulic models for specific reaches of interest in water years 2014–15. These water-surface eleva-tion and discharge measurement data were collected for design planning of diversion structures on the Red River of the North and Wild Rice River and the aqueduct/diversion structures on the Sheyenne and Maple Rivers. The Red River of the North and Sheyenne River reaches were surveyed six times, and discharges ranged from 276 to 6,540 cubic feet per second and from 166 to 2,040 cubic feet per second, respectively. The Wild Rice River reach also was surveyed six times during 2014 and 2015, and discharges ranged from 13 to 1,550 cubic feet per second. The Maple River reach was surveyed four times, and discharges ranged from 16.4 to 633 cubic feet per second. Water-surface elevation differences from upstream to downstream in the reaches ranged from 0.33 feet in the Red River of the North reach to 9.4 feet in the Maple River reach.
IntroductionThe Red River of the North begins at Wahpeton,
North Dakota, at the confluence of the Otter Tail and Bois de Sioux Rivers (not shown), and flows north into Canada before emptying into Lake Winnipeg, Manitoba (fig. 1). The drainage area for the Red River of the North Basin is about 45,000 square miles (mi2) (excluding the Assiniboine River) and includes parts of eastern North Dakota, northeastern South Dakota and northwestern Minnesota in the United States, and southern Manitoba in Canada. The Red River of the North flows through several urban areas along its path, including the cities of Fargo, N. Dak.; Moorhead, Minnesota; Grand Forks, N. Dak.; East Grand Forks, Minn.; and Winnipeg, Manitoba. Tributaries to the Red River of the North near the Fargo-Moorhead metropolitan area include the Sheyenne, Maple, and Wild Rice Rivers (fig. 1).
The area around Fargo, N. Dak., and Moorhead, Minn., historically has been prone to flooding. Flood-fighting efforts have cost the region millions of dollars, and if these emer-gency flood-fighting efforts are overwhelmed, the results could be catastrophic (Flood Diversion Authority, 2015). The Fargo-Moorhead Area Diversion Project was established to develop permanent flood-protection measures for the region. The current (2015) plan includes a 20,000 cubic feet per second (ft3/s), 36-mile (mi) long diversion channel with 32,500 acres of upstream floodwater staging (Flood Diversion Authority, 2015). As the Fargo-Moorhead Area Diversion Project moves forward in the design phase, discharge and water-surface elevation data are needed where diversion structures are being planned. For design planning of diversion structures proposed for the Red River of the North and Wild Rice River, and the aqueduct/diversion structures proposed for the Sheyenne and Maple Rivers, the U.S. Geological Survey (USGS), in coop-eration with the Fargo Diversion Board of Authority, collected water-surface elevations during a range of discharges needed for calibration of hydrologic and hydraulic models for the specific reaches of interest in water year (WYs) 2014–15.
Purpose and ScopeThe purpose of this report is to describe the methods and
results for the collection of discharge and associated water-surface elevation data through reaches of the Red River of the North, Sheyenne, Wild Rice, and Maple Rivers (figs. 1A–1D). Discharge measurements and multiple water-surface eleva-tions along each reach were collected together during various hydrologic conditions in WYs 2014–15.
MethodsThe methods used to collect water-surface elevations
and discharge measurements for the Red River of the North, Sheyenne, Wild Rice, and Maple Rivers (fig. 1) in the Fargo-Moorhead metropolitan area are described in this section. Multiple measurements were made during a range of hydro-logic conditions in WYs 2014–15.

2 Water-Surface Elevation and Discharge Measurement Data, Red River of the North and its Tributaries
96°45’96°50’96°55’97°97°05’
47°
46°50’
46°40’
Rush
River
Lower BranchLower Branch
Maple River
Shey
enne
RiverRed River o f the North
Red River o f the North
Rush
Rive
r
Rush
Rive
r
J506J506
FMM 05FMM 05
FMM 22FMM 22
FMM 21FMM 21
FMM 20FMM 20
FMM 19FMM 19
FMM 07FMM 07
FMM 01FMM 01
FMM 02FMM 02
FMM 03FMM 03FMM 04FMM 04
0506010005060100
0505930005059300
0505400005054000
0505152205051522
NORTH DAKOTA
SOUTH DAKOTA
MINNESOTAMINNESOTA
Study area
MANITOBAMANITOBA
"
"
"
Red Riverof the North Basin
Grand Forks/East Grand Forks
Fargo
Wahpeton
Lake Winnipeg
" WinnipegAssiniboine Ri ver
BALDHILL DAM
Sheyenne River
Red River of the North
CANADAUNITED STATES
CANADAUNITED STATES
Base from U.S. Geological Survey digital data, 1983Road network from Esri World Street Map, 2016Albers Equal-Area Conic projectionStandard parallels 29°30’N and 45°30’N, central meridian 96°00’W
0 2 4 KILOMETERS
0 2 4 MILES
FargoFargoWest FargoWest Fargo
OakportOakport
STONEYSTONEY
MoorheadMoorhead
EXPLANATION
Proposed diversion alignment, 2015
Benchmark with identifier (table 1)
Streamflow-gaging station with station number
FMM 04FMM 04
94
94
29
29
75
75
DD
BB
AA
CC
0506010005060100
Figure 1. Measured reaches on the Red River of the North, Sheyenne River, Wild Rice River, and Maple River near Fargo, North Dakota, water years 2014–15.
Methods 3
0505930005059300
EXPLANATION
Proposed diversion alignment, 2015
Benchmark with identifier (table 1)
Streamflow-gaging station with station number
Streamflow measurement site, with identifier
Water-surface measurement site, with identifier
FMM 03FMM 03
Red River of the North
Maple River
Shey
enne
Rive
r
Rive
r
Wolverton Creek
Shey
enne
Riv
er
Red Rive r of t
he N
orth
Wild
Ric
e
FMM 05
FMM 07
J506
FMM 01FMM 02
FMM 03
J506
SR1
SR2
SR3
SR4
SR5
SR6SR7
05059300
MR8MR7
MR6
MR5
MR4
MR3
MR2
MR1
WR7
WR6
WR5
WR4
WR3
WR2
WR1
RR7
RR6 RR5
RR4
RR3
RR2
RR1COUNTY ROAD 16
COUNTY ROAD 17
COUNTY ROAD 36
165TH AVE SE
25TH ST SOUTH
West Fargo
Horace
Oxbow
WR1
RR4
29
BB
CC
AA
DD
COUNTY ROAD 16
Figure 1. Measured reaches on the Red River of the North, Sheyenne River, Wild Rice River, and Maple River near Fargo, North Dakota, water years 2014–15.—Continued
4 Water-Surface Elevation and Discharge Measurement Data, Red River of the North and its Tributaries
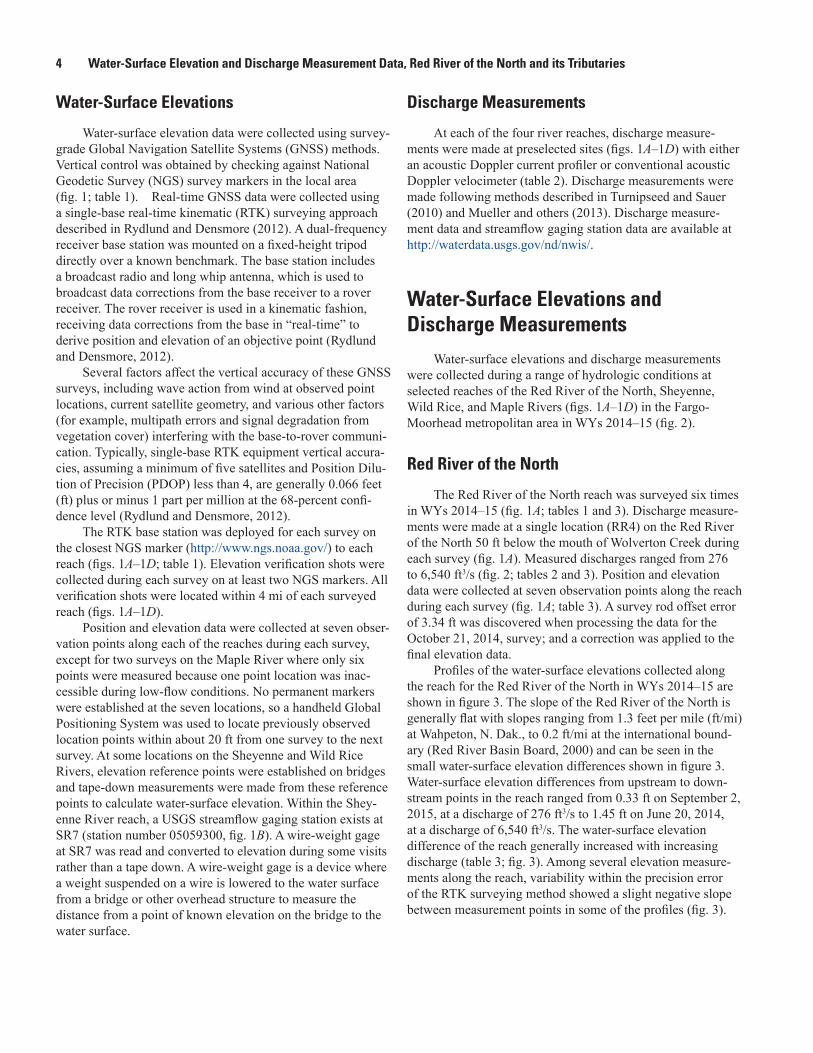
Water-Surface Elevations
Water-surface elevation data were collected using survey-grade Global Navigation Satellite Systems (GNSS) methods. Vertical control was obtained by checking against National Geodetic Survey (NGS) survey markers in the local area (fig. 1; table 1). Real-time GNSS data were collected using a single-base real-time kinematic (RTK) surveying approach described in Rydlund and Densmore (2012). A dual-frequency receiver base station was mounted on a fixed-height tripod directly over a known benchmark. The base station includes a broadcast radio and long whip antenna, which is used to broadcast data corrections from the base receiver to a rover receiver. The rover receiver is used in a kinematic fashion, receiving data corrections from the base in “real-time” to derive position and elevation of an objective point (Rydlund and Densmore, 2012).
Several factors affect the vertical accuracy of these GNSS surveys, including wave action from wind at observed point locations, current satellite geometry, and various other factors (for example, multipath errors and signal degradation from vegetation cover) interfering with the base-to-rover communi-cation. Typically, single-base RTK equipment vertical accura-cies, assuming a minimum of five satellites and Position Dilu-tion of Precision (PDOP) less than 4, are generally 0.066 feet (ft) plus or minus 1 part per million at the 68-percent confi-dence level (Rydlund and Densmore, 2012).
The RTK base station was deployed for each survey on the closest NGS marker (http://www.ngs.noaa.gov/) to each reach (figs. 1A–1D; table 1). Elevation verification shots were collected during each survey on at least two NGS markers. All verification shots were located within 4 mi of each surveyed reach (figs. 1A–1D).
Position and elevation data were collected at seven obser-vation points along each of the reaches during each survey, except for two surveys on the Maple River where only six points were measured because one point location was inac-cessible during low-flow conditions. No permanent markers were established at the seven locations, so a handheld Global Positioning System was used to locate previously observed location points within about 20 ft from one survey to the next survey. At some locations on the Sheyenne and Wild Rice Rivers, elevation reference points were established on bridges and tape-down measurements were made from these reference points to calculate water-surface elevation. Within the Shey-enne River reach, a USGS streamflow gaging station exists at SR7 (station number 05059300, fig. 1B). A wire-weight gage at SR7 was read and converted to elevation during some visits rather than a tape down. A wire-weight gage is a device where a weight suspended on a wire is lowered to the water surface from a bridge or other overhead structure to measure the distance from a point of known elevation on the bridge to the water surface.
Discharge Measurements
At each of the four river reaches, discharge measure-ments were made at preselected sites (figs. 1A–1D) with either an acoustic Doppler current profiler or conventional acoustic Doppler velocimeter (table 2). Discharge measurements were made following methods described in Turnipseed and Sauer (2010) and Mueller and others (2013). Discharge measure-ment data and streamflow gaging station data are available at http://waterdata.usgs.gov/nd/nwis/.
Water-Surface Elevations and Discharge Measurements
Water-surface elevations and discharge measurements were collected during a range of hydrologic conditions at selected reaches of the Red River of the North, Sheyenne, Wild Rice, and Maple Rivers (figs. 1A–1D) in the Fargo-Moorhead metropolitan area in WYs 2014–15 (fig. 2).
Red River of the North
The Red River of the North reach was surveyed six times in WYs 2014–15 (fig. 1A; tables 1 and 3). Discharge measure-ments were made at a single location (RR4) on the Red River of the North 50 ft below the mouth of Wolverton Creek during each survey (fig. 1A). Measured discharges ranged from 276 to 6,540 ft3/s (fig. 2; tables 2 and 3). Position and elevation data were collected at seven observation points along the reach during each survey (fig. 1A; table 3). A survey rod offset error of 3.34 ft was discovered when processing the data for the October 21, 2014, survey; and a correction was applied to the final elevation data.
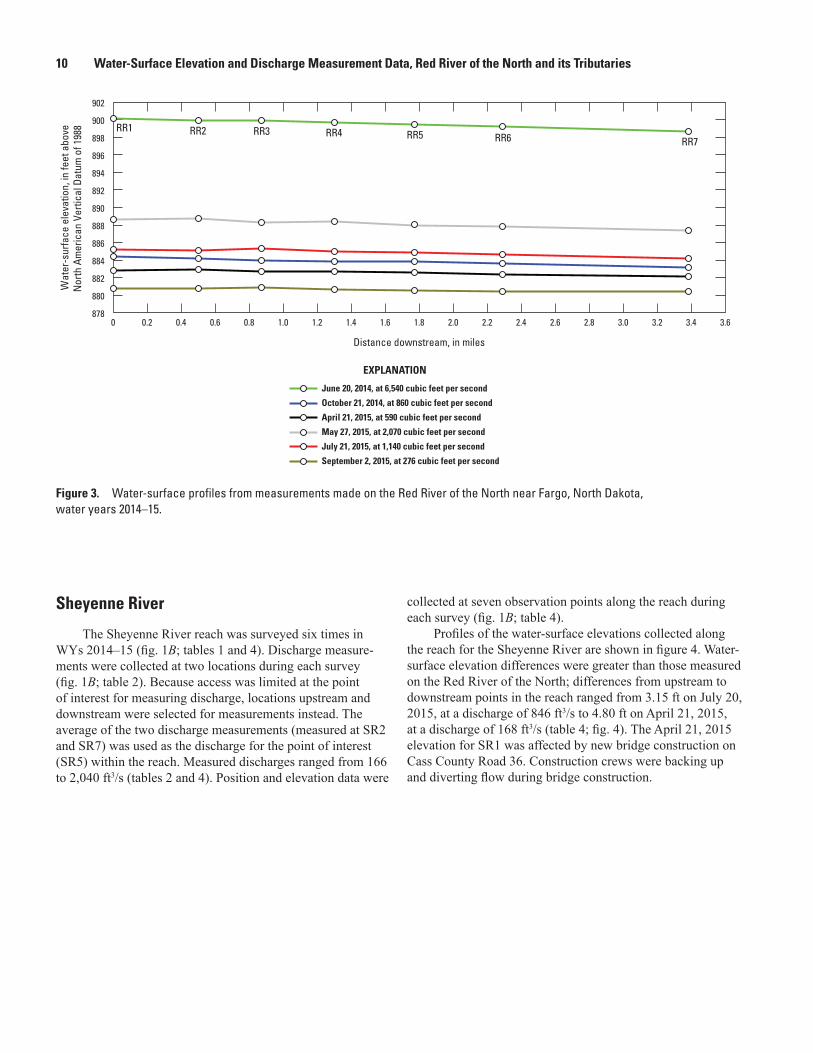
Profiles of the water-surface elevations collected along the reach for the Red River of the North in WYs 2014–15 are shown in figure 3. The slope of the Red River of the North is generally flat with slopes ranging from 1.3 feet per mile (ft/mi) at Wahpeton, N. Dak., to 0.2 ft/mi at the international bound-ary (Red River Basin Board, 2000) and can be seen in the small water-surface elevation differences shown in figure 3. Water-surface elevation differences from upstream to down-stream points in the reach ranged from 0.33 ft on September 2, 2015, at a discharge of 276 ft3/s to 1.45 ft on June 20, 2014, at a discharge of 6,540 ft3/s. The water-surface elevation difference of the reach generally increased with increasing discharge (table 3; fig. 3). Among several elevation measure-ments along the reach, variability within the precision error of the RTK surveying method showed a slight negative slope between measurement points in some of the profiles (fig. 3).
Water-Surface Elevations and Discharge Measurements 5
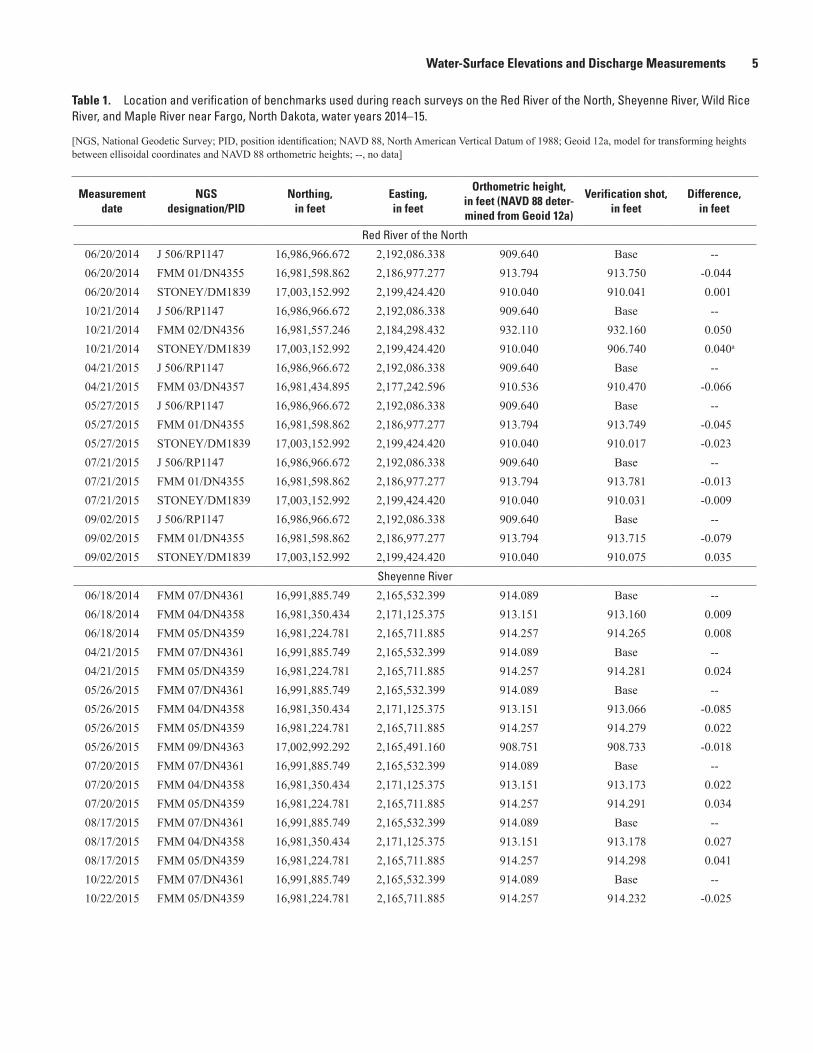
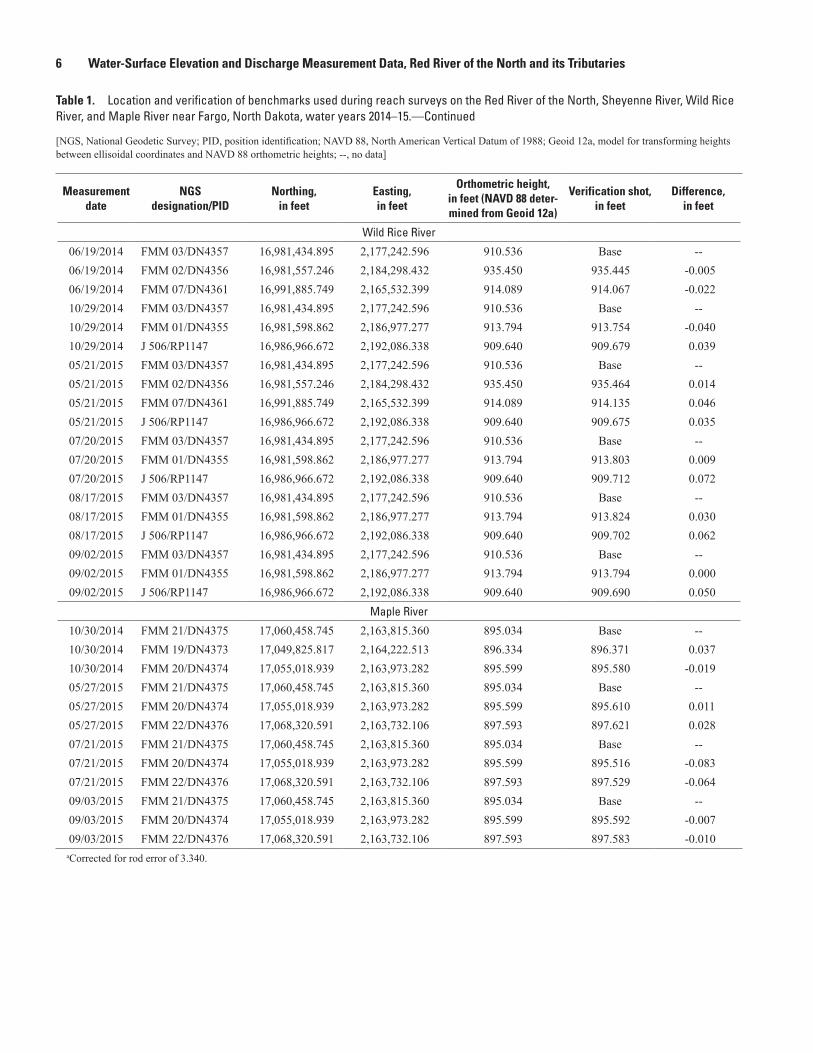
Table 1. Location and verification of benchmarks used during reach surveys on the Red River of the North, Sheyenne River, Wild Rice River, and Maple River near Fargo, North Dakota, water years 2014–15.
[NGS, National Geodetic Survey; PID, position identification; NAVD 88, North American Vertical Datum of 1988; Geoid 12a, model for transforming heights between ellisoidal coordinates and NAVD 88 orthometric heights; --, no data]
Measurement date
NGS designation/PID
Northing, in feet
Easting, in feet
Orthometric height, in feet (NAVD 88 deter-mined from Geoid 12a)
Verification shot, in feet
Difference, in feet
Red River of the North
06/20/2014 J 506/RP1147 16,986,966.672 2,192,086.338 909.640 Base --06/20/2014 FMM 01/DN4355 16,981,598.862 2,186,977.277 913.794 913.750 -0.04406/20/2014 STONEY/DM1839 17,003,152.992 2,199,424.420 910.040 910.041 0.00110/21/2014 J 506/RP1147 16,986,966.672 2,192,086.338 909.640 Base --10/21/2014 FMM 02/DN4356 16,981,557.246 2,184,298.432 932.110 932.160 0.05010/21/2014 STONEY/DM1839 17,003,152.992 2,199,424.420 910.040 906.740 0.040a
04/21/2015 J 506/RP1147 16,986,966.672 2,192,086.338 909.640 Base --04/21/2015 FMM 03/DN4357 16,981,434.895 2,177,242.596 910.536 910.470 -0.06605/27/2015 J 506/RP1147 16,986,966.672 2,192,086.338 909.640 Base --05/27/2015 FMM 01/DN4355 16,981,598.862 2,186,977.277 913.794 913.749 -0.04505/27/2015 STONEY/DM1839 17,003,152.992 2,199,424.420 910.040 910.017 -0.02307/21/2015 J 506/RP1147 16,986,966.672 2,192,086.338 909.640 Base --07/21/2015 FMM 01/DN4355 16,981,598.862 2,186,977.277 913.794 913.781 -0.01307/21/2015 STONEY/DM1839 17,003,152.992 2,199,424.420 910.040 910.031 -0.00909/02/2015 J 506/RP1147 16,986,966.672 2,192,086.338 909.640 Base --09/02/2015 FMM 01/DN4355 16,981,598.862 2,186,977.277 913.794 913.715 -0.07909/02/2015 STONEY/DM1839 17,003,152.992 2,199,424.420 910.040 910.075 0.035
Sheyenne River
06/18/2014 FMM 07/DN4361 16,991,885.749 2,165,532.399 914.089 Base --06/18/2014 FMM 04/DN4358 16,981,350.434 2,171,125.375 913.151 913.160 0.00906/18/2014 FMM 05/DN4359 16,981,224.781 2,165,711.885 914.257 914.265 0.00804/21/2015 FMM 07/DN4361 16,991,885.749 2,165,532.399 914.089 Base --04/21/2015 FMM 05/DN4359 16,981,224.781 2,165,711.885 914.257 914.281 0.02405/26/2015 FMM 07/DN4361 16,991,885.749 2,165,532.399 914.089 Base --05/26/2015 FMM 04/DN4358 16,981,350.434 2,171,125.375 913.151 913.066 -0.08505/26/2015 FMM 05/DN4359 16,981,224.781 2,165,711.885 914.257 914.279 0.02205/26/2015 FMM 09/DN4363 17,002,992.292 2,165,491.160 908.751 908.733 -0.01807/20/2015 FMM 07/DN4361 16,991,885.749 2,165,532.399 914.089 Base --07/20/2015 FMM 04/DN4358 16,981,350.434 2,171,125.375 913.151 913.173 0.02207/20/2015 FMM 05/DN4359 16,981,224.781 2,165,711.885 914.257 914.291 0.03408/17/2015 FMM 07/DN4361 16,991,885.749 2,165,532.399 914.089 Base --08/17/2015 FMM 04/DN4358 16,981,350.434 2,171,125.375 913.151 913.178 0.02708/17/2015 FMM 05/DN4359 16,981,224.781 2,165,711.885 914.257 914.298 0.04110/22/2015 FMM 07/DN4361 16,991,885.749 2,165,532.399 914.089 Base --10/22/2015 FMM 05/DN4359 16,981,224.781 2,165,711.885 914.257 914.232 -0.025
6 Water-Surface Elevation and Discharge Measurement Data, Red River of the North and its Tributaries
Table 1. Location and verification of benchmarks used during reach surveys on the Red River of the North, Sheyenne River, Wild Rice River, and Maple River near Fargo, North Dakota, water years 2014–15.—Continued
[NGS, National Geodetic Survey; PID, position identification; NAVD 88, North American Vertical Datum of 1988; Geoid 12a, model for transforming heights between ellisoidal coordinates and NAVD 88 orthometric heights; --, no data]
Measurement date
NGS designation/PID
Northing, in feet
Easting, in feet
Orthometric height, in feet (NAVD 88 deter-mined from Geoid 12a)
Verification shot, in feet
Difference, in feet
Wild Rice River
06/19/2014 FMM 03/DN4357 16,981,434.895 2,177,242.596 910.536 Base --06/19/2014 FMM 02/DN4356 16,981,557.246 2,184,298.432 935.450 935.445 -0.00506/19/2014 FMM 07/DN4361 16,991,885.749 2,165,532.399 914.089 914.067 -0.02210/29/2014 FMM 03/DN4357 16,981,434.895 2,177,242.596 910.536 Base --10/29/2014 FMM 01/DN4355 16,981,598.862 2,186,977.277 913.794 913.754 -0.04010/29/2014 J 506/RP1147 16,986,966.672 2,192,086.338 909.640 909.679 0.03905/21/2015 FMM 03/DN4357 16,981,434.895 2,177,242.596 910.536 Base --05/21/2015 FMM 02/DN4356 16,981,557.246 2,184,298.432 935.450 935.464 0.01405/21/2015 FMM 07/DN4361 16,991,885.749 2,165,532.399 914.089 914.135 0.04605/21/2015 J 506/RP1147 16,986,966.672 2,192,086.338 909.640 909.675 0.03507/20/2015 FMM 03/DN4357 16,981,434.895 2,177,242.596 910.536 Base --07/20/2015 FMM 01/DN4355 16,981,598.862 2,186,977.277 913.794 913.803 0.00907/20/2015 J 506/RP1147 16,986,966.672 2,192,086.338 909.640 909.712 0.07208/17/2015 FMM 03/DN4357 16,981,434.895 2,177,242.596 910.536 Base --08/17/2015 FMM 01/DN4355 16,981,598.862 2,186,977.277 913.794 913.824 0.03008/17/2015 J 506/RP1147 16,986,966.672 2,192,086.338 909.640 909.702 0.06209/02/2015 FMM 03/DN4357 16,981,434.895 2,177,242.596 910.536 Base --09/02/2015 FMM 01/DN4355 16,981,598.862 2,186,977.277 913.794 913.794 0.00009/02/2015 J 506/RP1147 16,986,966.672 2,192,086.338 909.640 909.690 0.050
Maple River
10/30/2014 FMM 21/DN4375 17,060,458.745 2,163,815.360 895.034 Base --10/30/2014 FMM 19/DN4373 17,049,825.817 2,164,222.513 896.334 896.371 0.03710/30/2014 FMM 20/DN4374 17,055,018.939 2,163,973.282 895.599 895.580 -0.01905/27/2015 FMM 21/DN4375 17,060,458.745 2,163,815.360 895.034 Base --05/27/2015 FMM 20/DN4374 17,055,018.939 2,163,973.282 895.599 895.610 0.01105/27/2015 FMM 22/DN4376 17,068,320.591 2,163,732.106 897.593 897.621 0.02807/21/2015 FMM 21/DN4375 17,060,458.745 2,163,815.360 895.034 Base --07/21/2015 FMM 20/DN4374 17,055,018.939 2,163,973.282 895.599 895.516 -0.08307/21/2015 FMM 22/DN4376 17,068,320.591 2,163,732.106 897.593 897.529 -0.06409/03/2015 FMM 21/DN4375 17,060,458.745 2,163,815.360 895.034 Base --09/03/2015 FMM 20/DN4374 17,055,018.939 2,163,973.282 895.599 895.592 -0.00709/03/2015 FMM 22/DN4376 17,068,320.591 2,163,732.106 897.593 897.583 -0.010
aCorrected for rod error of 3.340.
Water-Surface Elevations and Discharge Measurements 7
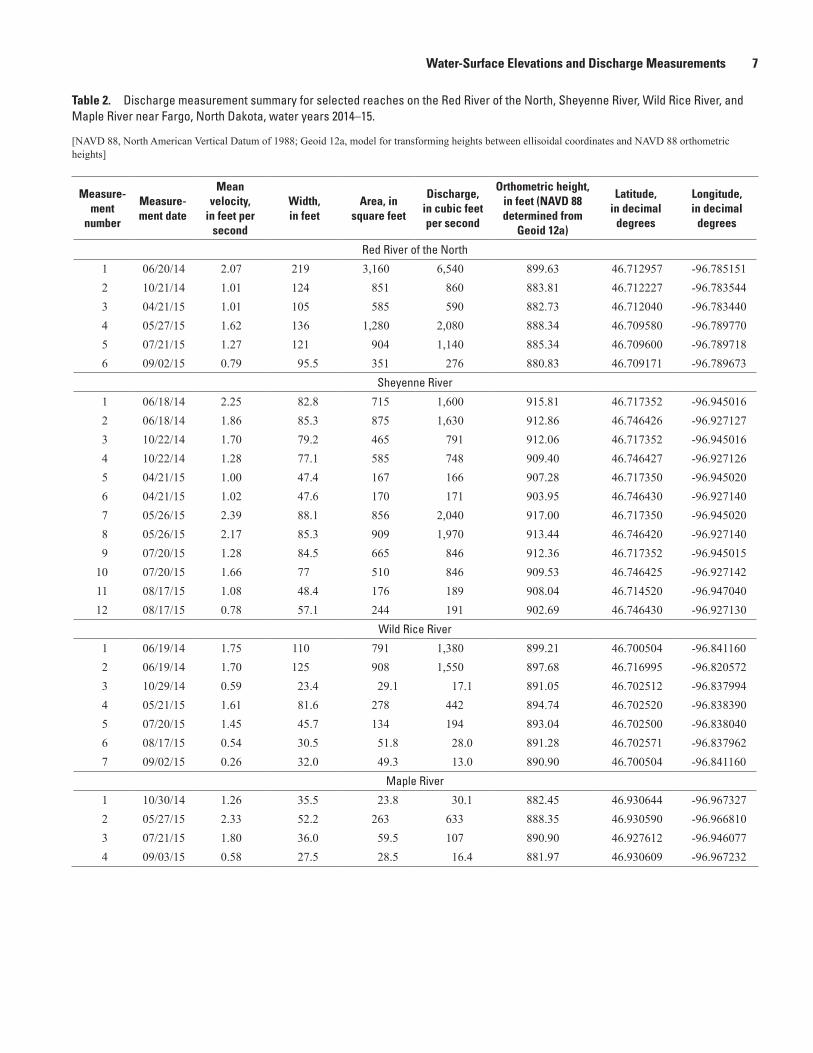
Table 2. Discharge measurement summary for selected reaches on the Red River of the North, Sheyenne River, Wild Rice River, and Maple River near Fargo, North Dakota, water years 2014–15.
[NAVD 88, North American Vertical Datum of 1988; Geoid 12a, model for transforming heights between ellisoidal coordinates and NAVD 88 orthometric heights]
Measure-ment
number
Measure-ment date
Mean velocity,
in feet per second
Width, in feet
Area, in square feet
Discharge, in cubic feet per second
Orthometric height, in feet (NAVD 88 determined from
Geoid 12a)
Latitude, in decimal
degrees
Longitude, in decimal
degrees
Red River of the North
1 06/20/14 2.07 219 3,160 6,540 899.63 46.712957 -96.7851512 10/21/14 1.01 124 851 860 883.81 46.712227 -96.7835443 04/21/15 1.01 105 585 590 882.73 46.712040 -96.7834404 05/27/15 1.62 136 1,280 2,080 888.34 46.709580 -96.7897705 07/21/15 1.27 121 904 1,140 885.34 46.709600 -96.7897186 09/02/15 0.79 95.5 351 276 880.83 46.709171 -96.789673
Sheyenne River
1 06/18/14 2.25 82.8 715 1,600 915.81 46.717352 -96.9450162 06/18/14 1.86 85.3 875 1,630 912.86 46.746426 -96.9271273 10/22/14 1.70 79.2 465 791 912.06 46.717352 -96.9450164 10/22/14 1.28 77.1 585 748 909.40 46.746427 -96.9271265 04/21/15 1.00 47.4 167 166 907.28 46.717350 -96.9450206 04/21/15 1.02 47.6 170 171 903.95 46.746430 -96.9271407 05/26/15 2.39 88.1 856 2,040 917.00 46.717350 -96.9450208 05/26/15 2.17 85.3 909 1,970 913.44 46.746420 -96.9271409 07/20/15 1.28 84.5 665 846 912.36 46.717352 -96.945015
10 07/20/15 1.66 77 510 846 909.53 46.746425 -96.92714211 08/17/15 1.08 48.4 176 189 908.04 46.714520 -96.94704012 08/17/15 0.78 57.1 244 191 902.69 46.746430 -96.927130
Wild Rice River
1 06/19/14 1.75 110 791 1,380 899.21 46.700504 -96.8411602 06/19/14 1.70 125 908 1,550 897.68 46.716995 -96.8205723 10/29/14 0.59 23.4 29.1 17.1 891.05 46.702512 -96.8379944 05/21/15 1.61 81.6 278 442 894.74 46.702520 -96.8383905 07/20/15 1.45 45.7 134 194 893.04 46.702500 -96.8380406 08/17/15 0.54 30.5 51.8 28.0 891.28 46.702571 -96.8379627 09/02/15 0.26 32.0 49.3 13.0 890.90 46.700504 -96.841160
Maple River
1 10/30/14 1.26 35.5 23.8 30.1 882.45 46.930644 -96.9673272 05/27/15 2.33 52.2 263 633 888.35 46.930590 -96.9668103 07/21/15 1.80 36.0 59.5 107 890.90 46.927612 -96.9460774 09/03/15 0.58 27.5 28.5 16.4 881.97 46.930609 -96.967232

8 Water-Surface Elevation and Discharge Measurement Data, Red River of the North and its Tributaries
Daily mean discharge
Water-surface elevation and discharge data collection dates
EXPLANATION
A. 05051522 Red River of the North at Hickson, N. Dak. B. 05053000 Wild Rice River near Abercrombie, N. Dak.
C. 05059300 Sheyenne River above Sheyenne River Diversion near Horace, N. Dak.
D. 05060100 Maple River below Mapleton, N. Dak.
Date
Oct. Dec. Feb. Apr. June Aug. Oct. Dec. Feb. Apr. June Aug. Oct.
2013 2014 2015Date
Oct. Dec. Feb. Apr. June Aug. Oct. Dec. Feb. Apr. June Aug. Oct.
2013 2014 2015
Stre
amflo
w d
isch
arge
, in
cubi
c fe
et p
er s
econ
d
0
2,000
4,000
6,000
8,000
0
1,000
2,000
3,000
4,000
5,000
0
500
1,000
1,500
2,000
2,500
0
500
1,000
1,500
2,000
2,500
Figure 2. Daily mean discharge and data collection dates for the Red River of the North, Sheyenne River, Wild Rice River, and Maple River near Fargo, North Dakota, water years 2014–15.

Water-Surface Elevations and Discharge Measurements 9
Table 3. Water-surface elevations and discharge measurements made on the Red River of the North near Fargo, North Dakota, water years 2014–15.
[NAVD 88, North American Vertical Datum of 1988; --, no data, RTK, real-time kinematic]
Point nameMeasurement
dateLatitude, in
decimal degreesLongitude, in
decimal degreesWater-surface elevation,
in feet above NAVD 88Discharge, in cubic
feet per secondMeasurement
description
RR1 06/20/14 46.702849 -96.791407 900.11 -- RTKRR2 06/20/14 46.706490 -96.783446 899.92 -- RTKRR3 06/20/14 46.709936 -96.789792 899.89 -- RTKRR4 06/20/14 46.712957 -96.785151 899.63 6,540 RTKRR5 06/20/14 46.716469 -96.781729 899.48 -- RTKRR6 06/20/14 46.718065 -96.791356 899.19 -- RTKRR7 06/20/14 46.726642 -96.778710 898.66 -- RTKRR1 10/21/14 46.702861 -96.791143 884.36 -- RTKRR2 10/21/14 46.706527 -96.783635 884.14 -- RTKRR3 10/21/14 46.709597 -96.789242 883.97 -- RTKRR4 10/21/14 46.712227 -96.783544 883.81 860 RTKRR5 10/21/14 46.716534 -96.781926 883.82 -- RTKRR6 10/21/14 46.717369 -96.790319 883.64 -- RTKRR7 10/21/14 46.726586 -96.778792 883.20 -- RTKRR1 04/21/15 46.703230 -96.791460 882.86 -- RTKRR2 04/21/15 46.706200 -96.783960 882.90 -- RTKRR3 04/21/15 46.709480 -96.789710 882.68 -- RTKRR4 04/21/15 46.712040 -96.783440 882.73 590 RTKRR5 04/21/15 46.716520 -96.781950 882.54 -- RTKRR6 04/21/15 46.717360 -96.790300 882.41 -- RTKRR7 04/21/15 46.726570 -96.778810 882.08 -- RTKRR1 05/27/15 46.702890 -96.791240 888.65 -- RTKRR2 05/27/15 46.706500 -96.783560 888.70 -- RTKRR3 05/27/15 46.709580 -96.789770 888.34 -- RTKRR4 05/27/15 46.711940 -96.783310 888.42 2,080 RTKRR5 05/27/15 46.716640 -96.781790 888.01 -- RTKRR6 05/27/15 46.717340 -96.790340 887.87 -- RTKRR7 05/27/15 46.726630 -96.778750 887.35 -- RTKRR1 07/21/15 46.702813 -96.791109 885.26 -- RTKRR2 07/21/15 46.706578 -96.783654 885.04 -- RTKRR3 07/21/15 46.709600 -96.789718 885.34 -- RTKRR4 07/21/15 46.712040 -96.783420 884.94 1,140 RTKRR5 07/21/15 46.716490 -96.781967 884.88 -- RTKRR6 07/21/15 46.717325 -96.790177 884.61 -- RTKRR7 07/21/15 46.726544 -96.778805 884.23 -- RTKRR1 09/02/15 46.702959 -96.791236 880.77 -- RTKRR2 09/02/15 46.706423 -96.783605 880.74 -- RTKRR3 09/02/15 46.709171 -96.789673 880.83 -- RTKRR4 09/02/15 46.711864 -96.783344 880.62 276 RTKRR5 09/02/15 46.716453 -96.782136 880.52 -- RTKRR6 09/02/15 46.717310 -96.790000 880.47 -- RTKRR7 09/02/15 46.726571 -96.778821 880.44 -- RTK
10 Water-Surface Elevation and Discharge Measurement Data, Red River of the North and its Tributaries
EXPLANATION
Distance downstream, in miles
0 0.2 0.4 0.6 0.8 1.0 1.2 1.4 1.6 1.8 2.0 2.2 2.4 2.6 2.8 3.0 3.2 3.4 3.6
Wat
er-s
urfa
ce e
leva
tion,
in fe
et a
bove
Nor
th A
mer
ican
Ver
tical
Dat
um o
f 198
8
878
880
882
884
886
888
890
892
894
896
898
900
902
June 20, 2014, at 6,540 cubic feet per second
October 21, 2014, at 860 cubic feet per second
April 21, 2015, at 590 cubic feet per second
May 27, 2015, at 2,070 cubic feet per second
July 21, 2015, at 1,140 cubic feet per second
September 2, 2015, at 276 cubic feet per second
RR1 RR2 RR4RR3 RR5 RR6 RR7
Figure 3. Water-surface profiles from measurements made on the Red River of the North near Fargo, North Dakota, water years 2014–15.
Sheyenne River
The Sheyenne River reach was surveyed six times in WYs 2014–15 (fig. 1B; tables 1 and 4). Discharge measure-ments were collected at two locations during each survey (fig. 1B; table 2). Because access was limited at the point of interest for measuring discharge, locations upstream and downstream were selected for measurements instead. The average of the two discharge measurements (measured at SR2 and SR7) was used as the discharge for the point of interest (SR5) within the reach. Measured discharges ranged from 166 to 2,040 ft3/s (tables 2 and 4). Position and elevation data were
collected at seven observation points along the reach during each survey (fig. 1B; table 4).
Profiles of the water-surface elevations collected along the reach for the Sheyenne River are shown in figure 4. Water-surface elevation differences were greater than those measured on the Red River of the North; differences from upstream to downstream points in the reach ranged from 3.15 ft on July 20, 2015, at a discharge of 846 ft3/s to 4.80 ft on April 21, 2015, at a discharge of 168 ft3/s (table 4; fig. 4). The April 21, 2015 elevation for SR1 was affected by new bridge construction on Cass County Road 36. Construction crews were backing up and diverting flow during bridge construction.
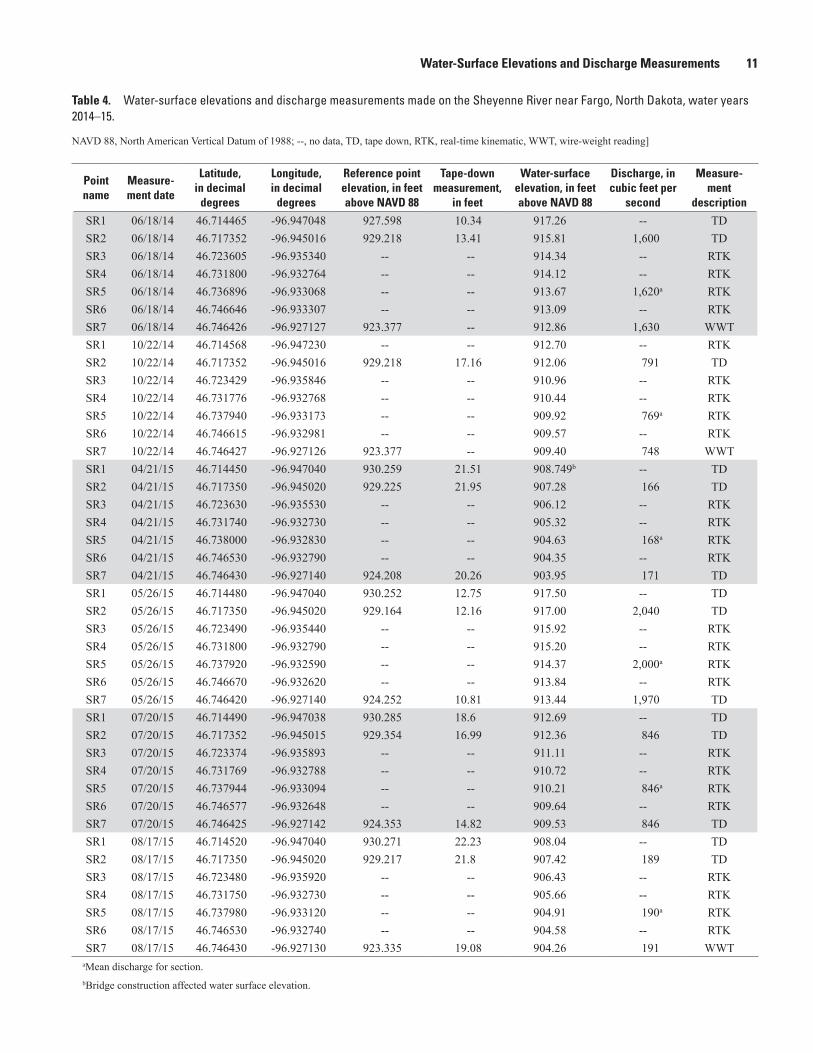
Water-Surface Elevations and Discharge Measurements 11
Table 4. Water-surface elevations and discharge measurements made on the Sheyenne River near Fargo, North Dakota, water years 2014–15.
NAVD 88, North American Vertical Datum of 1988; --, no data, TD, tape down, RTK, real-time kinematic, WWT, wire-weight reading]
Point name
Measure-ment date
Latitude, in decimal
degrees
Longitude, in decimal
degrees
Reference point elevation, in feet above NAVD 88
Tape-down measurement,
in feet
Water-surface elevation, in feet above NAVD 88
Discharge, in cubic feet per
second
Measure-ment
descriptionSR1 06/18/14 46.714465 -96.947048 927.598 10.34 917.26 -- TDSR2 06/18/14 46.717352 -96.945016 929.218 13.41 915.81 1,600 TDSR3 06/18/14 46.723605 -96.935340 -- -- 914.34 -- RTKSR4 06/18/14 46.731800 -96.932764 -- -- 914.12 -- RTKSR5 06/18/14 46.736896 -96.933068 -- -- 913.67 1,620a RTKSR6 06/18/14 46.746646 -96.933307 -- -- 913.09 -- RTKSR7 06/18/14 46.746426 -96.927127 923.377 -- 912.86 1,630 WWTSR1 10/22/14 46.714568 -96.947230 -- -- 912.70 -- RTKSR2 10/22/14 46.717352 -96.945016 929.218 17.16 912.06 791 TDSR3 10/22/14 46.723429 -96.935846 -- -- 910.96 -- RTKSR4 10/22/14 46.731776 -96.932768 -- -- 910.44 -- RTKSR5 10/22/14 46.737940 -96.933173 -- -- 909.92 769a RTKSR6 10/22/14 46.746615 -96.932981 -- -- 909.57 -- RTKSR7 10/22/14 46.746427 -96.927126 923.377 -- 909.40 748 WWTSR1 04/21/15 46.714450 -96.947040 930.259 21.51 908.749b -- TDSR2 04/21/15 46.717350 -96.945020 929.225 21.95 907.28 166 TDSR3 04/21/15 46.723630 -96.935530 -- -- 906.12 -- RTKSR4 04/21/15 46.731740 -96.932730 -- -- 905.32 -- RTKSR5 04/21/15 46.738000 -96.932830 -- -- 904.63 168a RTKSR6 04/21/15 46.746530 -96.932790 -- -- 904.35 -- RTKSR7 04/21/15 46.746430 -96.927140 924.208 20.26 903.95 171 TDSR1 05/26/15 46.714480 -96.947040 930.252 12.75 917.50 -- TDSR2 05/26/15 46.717350 -96.945020 929.164 12.16 917.00 2,040 TDSR3 05/26/15 46.723490 -96.935440 -- -- 915.92 -- RTKSR4 05/26/15 46.731800 -96.932790 -- -- 915.20 -- RTKSR5 05/26/15 46.737920 -96.932590 -- -- 914.37 2,000a RTKSR6 05/26/15 46.746670 -96.932620 -- -- 913.84 -- RTKSR7 05/26/15 46.746420 -96.927140 924.252 10.81 913.44 1,970 TDSR1 07/20/15 46.714490 -96.947038 930.285 18.6 912.69 -- TDSR2 07/20/15 46.717352 -96.945015 929.354 16.99 912.36 846 TDSR3 07/20/15 46.723374 -96.935893 -- -- 911.11 -- RTKSR4 07/20/15 46.731769 -96.932788 -- -- 910.72 -- RTKSR5 07/20/15 46.737944 -96.933094 -- -- 910.21 846a RTKSR6 07/20/15 46.746577 -96.932648 -- -- 909.64 -- RTKSR7 07/20/15 46.746425 -96.927142 924.353 14.82 909.53 846 TDSR1 08/17/15 46.714520 -96.947040 930.271 22.23 908.04 -- TDSR2 08/17/15 46.717350 -96.945020 929.217 21.8 907.42 189 TDSR3 08/17/15 46.723480 -96.935920 -- -- 906.43 -- RTKSR4 08/17/15 46.731750 -96.932730 -- -- 905.66 -- RTKSR5 08/17/15 46.737980 -96.933120 -- -- 904.91 190a RTKSR6 08/17/15 46.746530 -96.932740 -- -- 904.58 -- RTKSR7 08/17/15 46.746430 -96.927130 923.335 19.08 904.26 191 WWT
aMean discharge for section.bBridge construction affected water surface elevation.

12 Water-Surface Elevation and Discharge Measurement Data, Red River of the North and its Tributaries
EXPLANATION
Distance downstream, in miles
0 0.2 0.4 0.6 0.8 1.0 1.2 1.4 1.6 1.8 2.0 2.2 2.4 2.6 2.8 3.0 3.2 3.4 3.6 3.8 4.0 4.2 4.4 4.6
Wat
er-s
urfa
ce e
leva
tion,
in fe
et a
bove
N
orth
Am
eric
an V
ertic
al D
atum
of 1
988
902
904
906
908
910
912
914
916
918
June 18, 2014, at 1,620 cubic feet per second
October 22, 2014, at 770 cubic feet per second
April 21, 2015, at 168 cubic feet per second
May 26, 2015, at 1,890 cubic feet per second
July 20, 2015, at 846 cubic feet per second
August 17, 2015, at 190 cubic feet per second
SR1
SR2
SR4SR3SR5
SR6 SR7
Figure 4. Water-surface profiles from measurements made on the Sheyenne River near Fargo, North Dakota, water years 2014–15.
Wild Rice River
The Wild Rice River reach was surveyed six times in WYs 2014–15 (fig. 1C; tables 1 and 5). Discharge measure-ments were collected at a single location (WR4) for five of the six surveys and at two locations (WR3 and WR6) for the sur-vey on June 19, 2014, during a high-flow event (fig. 1C). The average of the two discharge measurements during the high-flow event was used as the discharge for the point of interest (WR4) within the reach (table 5). Measured discharges ranged from 13 to 1,550 ft3/s (tables 2 and 5). Position and elevation data were collected at seven observation points along the reach during each survey (fig. 1C; table 5).
Profiles of the water-surface elevations collected along the reach for the Wild Rice River are shown in figure 5. Water-surface elevation differences from upstream to down-stream points in the reach ranged from 3.57 ft on September 2, 2015, at a discharge of 13 ft3/s to 5.85 ft on May 21, 2015, at a discharge of 442 ft3/s (table 5). There are two distinct rock and gravel riffles affecting the slope during low-flow condi-tions within the reach between WR5 and WR6 on the Wild Rice River (fig. 5; profiles measured on October 22, 2014, and August 17 and September 2, 2015). These riffles seem to be part of the bridge construction and are 20–50 ft upstream from the Interstate 29 Bridge and at the remediated 25th Street South Bridge 1.2 mi downstream (fig. 1).
Water-Surface Elevations and Discharge Measurements 13
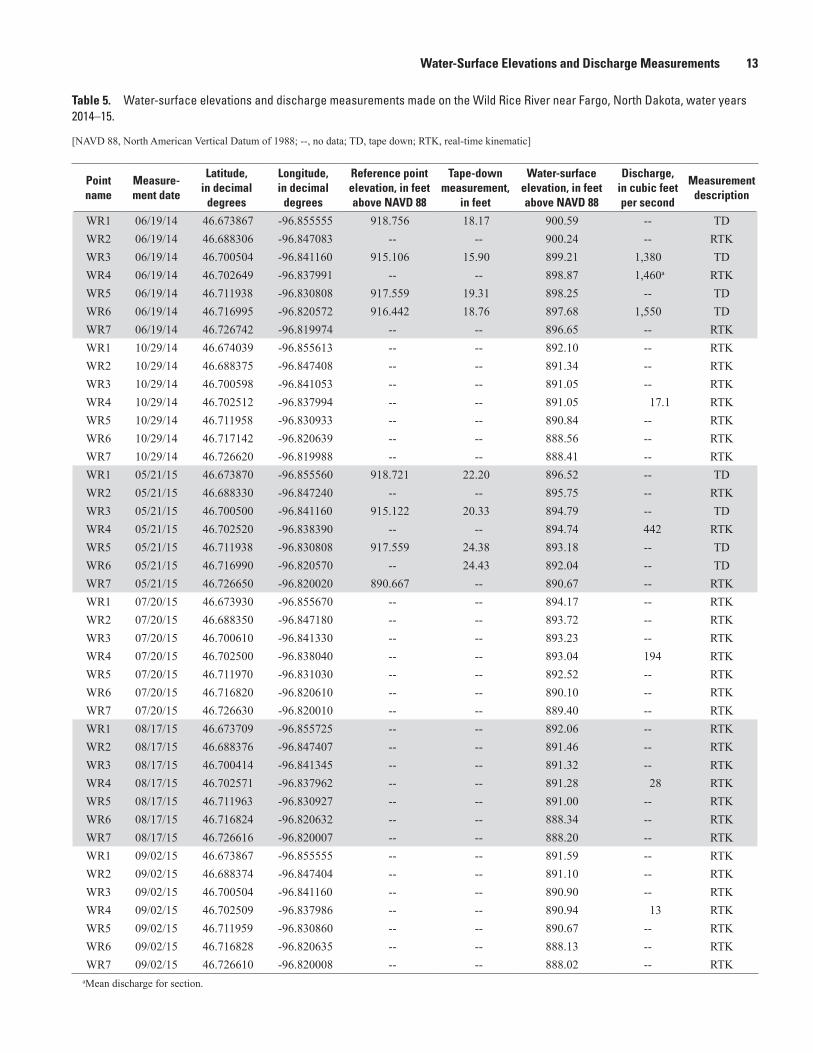
Table 5. Water-surface elevations and discharge measurements made on the Wild Rice River near Fargo, North Dakota, water years 2014–15.
[NAVD 88, North American Vertical Datum of 1988; --, no data; TD, tape down; RTK, real-time kinematic]
Point name
Measure-ment date
Latitude, in decimal
degrees
Longitude, in decimal
degrees
Reference point elevation, in feet above NAVD 88
Tape-down measurement,
in feet
Water-surface elevation, in feet above NAVD 88
Discharge, in cubic feet per second
Measurement description
WR1 06/19/14 46.673867 -96.855555 918.756 18.17 900.59 -- TDWR2 06/19/14 46.688306 -96.847083 -- -- 900.24 -- RTKWR3 06/19/14 46.700504 -96.841160 915.106 15.90 899.21 1,380 TDWR4 06/19/14 46.702649 -96.837991 -- -- 898.87 1,460a RTKWR5 06/19/14 46.711938 -96.830808 917.559 19.31 898.25 -- TDWR6 06/19/14 46.716995 -96.820572 916.442 18.76 897.68 1,550 TDWR7 06/19/14 46.726742 -96.819974 -- -- 896.65 -- RTKWR1 10/29/14 46.674039 -96.855613 -- -- 892.10 -- RTKWR2 10/29/14 46.688375 -96.847408 -- -- 891.34 -- RTKWR3 10/29/14 46.700598 -96.841053 -- -- 891.05 -- RTKWR4 10/29/14 46.702512 -96.837994 -- -- 891.05 17.1 RTKWR5 10/29/14 46.711958 -96.830933 -- -- 890.84 -- RTKWR6 10/29/14 46.717142 -96.820639 -- -- 888.56 -- RTKWR7 10/29/14 46.726620 -96.819988 -- -- 888.41 -- RTKWR1 05/21/15 46.673870 -96.855560 918.721 22.20 896.52 -- TDWR2 05/21/15 46.688330 -96.847240 -- -- 895.75 -- RTKWR3 05/21/15 46.700500 -96.841160 915.122 20.33 894.79 -- TDWR4 05/21/15 46.702520 -96.838390 -- -- 894.74 442 RTKWR5 05/21/15 46.711938 -96.830808 917.559 24.38 893.18 -- TDWR6 05/21/15 46.716990 -96.820570 -- 24.43 892.04 -- TDWR7 05/21/15 46.726650 -96.820020 890.667 -- 890.67 -- RTKWR1 07/20/15 46.673930 -96.855670 -- -- 894.17 -- RTKWR2 07/20/15 46.688350 -96.847180 -- -- 893.72 -- RTKWR3 07/20/15 46.700610 -96.841330 -- -- 893.23 -- RTKWR4 07/20/15 46.702500 -96.838040 -- -- 893.04 194 RTKWR5 07/20/15 46.711970 -96.831030 -- -- 892.52 -- RTKWR6 07/20/15 46.716820 -96.820610 -- -- 890.10 -- RTKWR7 07/20/15 46.726630 -96.820010 -- -- 889.40 -- RTKWR1 08/17/15 46.673709 -96.855725 -- -- 892.06 -- RTKWR2 08/17/15 46.688376 -96.847407 -- -- 891.46 -- RTKWR3 08/17/15 46.700414 -96.841345 -- -- 891.32 -- RTKWR4 08/17/15 46.702571 -96.837962 -- -- 891.28 28 RTKWR5 08/17/15 46.711963 -96.830927 -- -- 891.00 -- RTKWR6 08/17/15 46.716824 -96.820632 -- -- 888.34 -- RTKWR7 08/17/15 46.726616 -96.820007 -- -- 888.20 -- RTKWR1 09/02/15 46.673867 -96.855555 -- -- 891.59 -- RTKWR2 09/02/15 46.688374 -96.847404 -- -- 891.10 -- RTKWR3 09/02/15 46.700504 -96.841160 -- -- 890.90 -- RTKWR4 09/02/15 46.702509 -96.837986 -- -- 890.94 13 RTKWR5 09/02/15 46.711959 -96.830860 -- -- 890.67 -- RTKWR6 09/02/15 46.716828 -96.820635 -- -- 888.13 -- RTKWR7 09/02/15 46.726610 -96.820008 -- -- 888.02 -- RTK
aMean discharge for section.
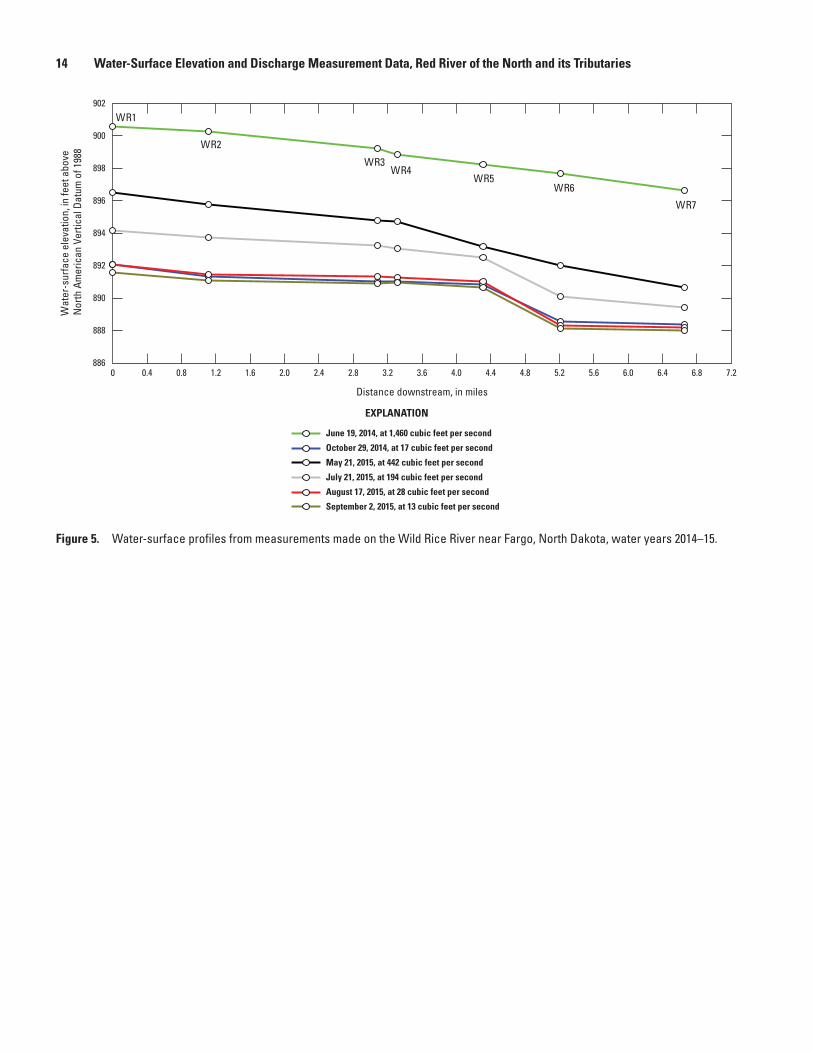
14 Water-Surface Elevation and Discharge Measurement Data, Red River of the North and its Tributaries
EXPLANATION
Distance downstream, in miles
0 0.4 0.8 1.2 1.6 2.0 2.4 2.8 3.2 3.6 4.0 4.4 4.8 5.2 5.6 6.0 6.4 6.8 7.2
Wat
er-s
urfa
ce e
leva
tion,
in fe
et a
bove
N
orth
Am
eric
an V
ertic
al D
atum
of 1
988
886
888
890
892
894
896
898
900
902
June 19, 2014, at 1,460 cubic feet per second
October 29, 2014, at 17 cubic feet per second
May 21, 2015, at 442 cubic feet per second
July 21, 2015, at 194 cubic feet per second
August 17, 2015, at 28 cubic feet per second
September 2, 2015, at 13 cubic feet per second
WR1
WR2
WR4WR3
WR5WR6
WR7
Figure 5. Water-surface profiles from measurements made on the Wild Rice River near Fargo, North Dakota, water years 2014–15.

Water-Surface Elevations and Discharge Measurements 15
Maple River
The Maple River reach was surveyed four times in WYs 2014–15 (fig. 1D; tables 1 and 6). Discharge measurements were collected at MR6 for three of the surveys and at MR5 for the survey on July 21, 2015 because MR6 was inacces-sible (fig. 1D; table 6). Measured discharges ranged from 16.4 to 633 ft3/s (tables 2 and 6). Six surveys were planned, but only four surveys were completed because of issues with land access and frequent low-flow conditions. Position and elevation data were collected along six or seven observation points along the reach during each survey (fig. 1D; table 6). Some observation points were inaccessible during low-flow conditions.
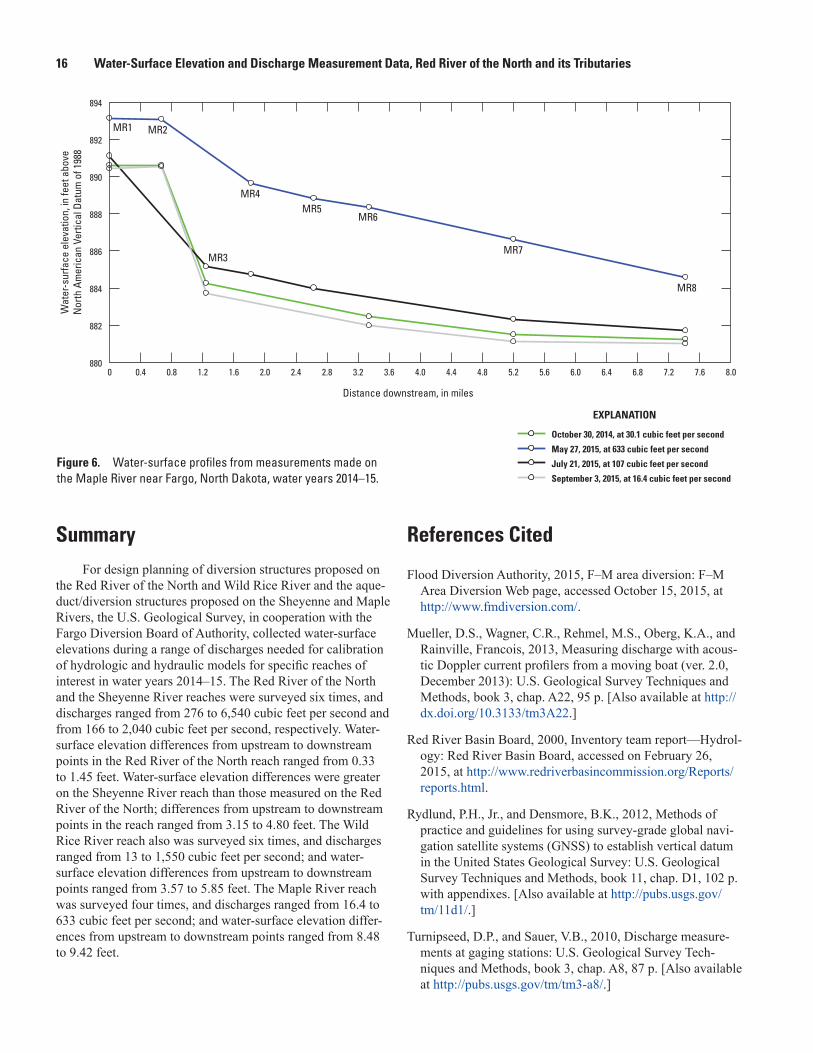
Profiles of the water-surface elevations collected along the reach for the Maple River are shown in figure 6. Among all the reaches measured on the Red River of the North and its tributaries in WYs 2014–15 (fig. 1), the greatest water-surface elevation differences were measured on the Maple River reach. Water-surface elevation differences from upstream to downstream points in the Maple River reach ranged from 8.48 ft on May 27, 2015, at a discharge of 633 ft3/s, to 9.42 ft on September 3, 2015, at a discharge of 16.4 ft3/s (table 6). There is an abrupt change in water-surface elevation (about 3.4 to 6.8 ft) in the reach between MR2 and MR3 (fig. 6). From field observations, a small rubble dam 1 mi downstream from the 165th Avenue SE Bridge causes the abrupt change in the slope for flows less than about 2,000 ft3/s on the Maple River (fig. 6).
Table 6. Water-surface elevations and discharge measurements made on the Maple River near Fargo, North Dakota, water years 2014–15.
[NAVD 88, North American Vertical Datum of 1988; --, no data, RTK, real-time kinematic]
Point name
Measurement date
Latitude, in decimal degrees
Longitude, in decimal degrees
Water-surface elevation, in feet above NAVD 88
Discharge, in cubic feet per second
Measurement description
MR1 10/30/14 46.921513 -97.009946 890.62 -- RTKMR2 10/30/14 46.921798 -96.997447 890.60 -- RTKMR3 10/30/14 46.925869 -96.989176 884.26 -- RTKMR6 10/30/14 46.930644 -96.967327 882.45 30.1 RTKMR7 10/30/14 46.927617 -96.946110 881.48 -- RTKMR8 10/30/14 46.929088 -96.927552 881.24 -- RTKMR1 05/27/15 46.921510 -97.009810 893.13 -- RTKMR2 05/27/15 46.921780 -96.997450 893.07 -- RTKMR4 05/27/15 46.930240 -96.983540 889.63 -- RTKMR5 05/27/15 46.925410 -96.974130 888.82 -- RTKMR6 05/27/15 46.930590 -96.966810 888.35 633 RTKMR7 05/27/15 46.927710 -96.945870 886.62 -- RTKMR8 05/27/15 46.929270 -96.927670 884.59 -- RTKMR1 07/21/15 46.921503 -97.009947 891.10 -- RTKMR3 07/21/15 46.925826 -96.989096 885.13 -- RTKMR4 07/21/15 46.927612 -96.946077 884.75 -- RTKMR5 07/21/15 46.929137 -96.927463 884.00 107 RTKMR7 07/21/15 46.930190 -96.983477 882.33 -- RTKMR8 07/21/15 46.925381 -96.974506 881.70 -- RTKMR1 09/03/15 46.921514 -97.009924 890.42 -- RTKMR2 09/03/15 46.921776 -96.997671 890.53 -- RTKMR3 09/03/15 46.925830 -96.989077 883.72 -- RTKMR6 09/03/15 46.930609 -96.967232 881.97 16.4 RTKMR7 09/03/15 46.927623 -96.946149 881.11 -- RTKMR8 09/03/15 46.929133 -96.927477 881.00 -- RTK
16 Water-Surface Elevation and Discharge Measurement Data, Red River of the North and its Tributaries
Distance downstream, in miles
0 0.4 0.8 1.2 1.6 2.0 2.4 2.8 3.2 3.6 4.0 4.4 4.8 5.2 5.6 6.0 6.4 6.8 7.2 7.6 8.0
Wat
er-s
urfa
ce e
leva
tion,
in fe
et a
bove
Nor
th A
mer
ican
Ver
tical
Dat
um o
f 198
8
880
882
884
886
888
890
892
894
MR1 MR2
MR4
MR3
MR5MR6
MR7
MR8
October 30, 2014, at 30.1 cubic feet per second
May 27, 2015, at 633 cubic feet per second
July 21, 2015, at 107 cubic feet per second
September 3, 2015, at 16.4 cubic feet per second
EXPLANATION
Figure 6. Water-surface profiles from measurements made on the Maple River near Fargo, North Dakota, water years 2014–15.
SummaryFor design planning of diversion structures proposed on
the Red River of the North and Wild Rice River and the aque-duct/diversion structures proposed on the Sheyenne and Maple Rivers, the U.S. Geological Survey, in cooperation with the Fargo Diversion Board of Authority, collected water-surface elevations during a range of discharges needed for calibration of hydrologic and hydraulic models for specific reaches of interest in water years 2014–15. The Red River of the North and the Sheyenne River reaches were surveyed six times, and discharges ranged from 276 to 6,540 cubic feet per second and from 166 to 2,040 cubic feet per second, respectively. Water-surface elevation differences from upstream to downstream points in the Red River of the North reach ranged from 0.33 to 1.45 feet. Water-surface elevation differences were greater on the Sheyenne River reach than those measured on the Red River of the North; differences from upstream to downstream points in the reach ranged from 3.15 to 4.80 feet. The Wild Rice River reach also was surveyed six times, and discharges ranged from 13 to 1,550 cubic feet per second; and water-surface elevation differences from upstream to downstream points ranged from 3.57 to 5.85 feet. The Maple River reach was surveyed four times, and discharges ranged from 16.4 to 633 cubic feet per second; and water-surface elevation differ-ences from upstream to downstream points ranged from 8.48 to 9.42 feet.
References Cited
Flood Diversion Authority, 2015, F–M area diversion: F–M Area Diversion Web page, accessed October 15, 2015, at http://www.fmdiversion.com/.
Mueller, D.S., Wagner, C.R., Rehmel, M.S., Oberg, K.A., and Rainville, Francois, 2013, Measuring discharge with acous-tic Doppler current profilers from a moving boat (ver. 2.0, December 2013): U.S. Geological Survey Techniques and Methods, book 3, chap. A22, 95 p. [Also available at http://dx.doi.org/10.3133/tm3A22.]
Red River Basin Board, 2000, Inventory team report—Hydrol-ogy: Red River Basin Board, accessed on February 26, 2015, at http://www.redriverbasincommission.org/Reports/reports.html.
Rydlund, P.H., Jr., and Densmore, B.K., 2012, Methods of practice and guidelines for using survey-grade global navi-gation satellite systems (GNSS) to establish vertical datum in the United States Geological Survey: U.S. Geological Survey Techniques and Methods, book 11, chap. D1, 102 p. with appendixes. [Also available at http://pubs.usgs.gov/tm/11d1/.]
Turnipseed, D.P., and Sauer, V.B., 2010, Discharge measure-ments at gaging stations: U.S. Geological Survey Tech-niques and Methods, book 3, chap. A8, 87 p. [Also available at http://pubs.usgs.gov/tm/tm3-a8/.]


Damschen and Gallow
ay—W
ater-Surface Elevation and Discharge M
easurement D
ata, Red River of the North and its Tributaries—
Open-File Report 2016–1139
ISSN 2331-1258 (online)http://dx.doi.org/10.3133/ofr20161139