water treatment plant for biota removal and inactivation ... · pdf filewater treatment plant...
TRANSCRIPT

Water Treatment Plant for Biota Removal and Inactivation - Appraisal Level Design & Cost Estimates
Northwest Area Water Supply Project, North Dakota Great Plains Region
U.S. Department of the Interior Bureau of Reclamation Technical Service Center Denver, CO September 2007

Mission Statements The mission of the Department of the Interior is to protect and provide access to our Nation’s natural and cultural heritage and honor our trust responsibilities to Indian Tribes and our commitments to island communities. The mission of the Bureau of Reclamation is to manage, develop, and protect water and related resources in an environmentally and economically sound manner in the interest of the American public.

U.S. Department of the Interior Bureau of Reclamation Technical Service Center Water Treatment Engineering and Research Group Denver, Colorado September 2007
Water Treatment Plant For Biota Removal and Inactivation - Appraisal Level Design & Cost Estimates Northwest Area Water Supply Project, North Dakota Great Plains Region

Project Information
Client: Dean Karsky, Dakotas Area Office WOID: 6B865 Status: Final Report Date Submitted to Client: September 24, 2007
/s/ 06/04/07 Prepared: Steve Dundorf Date Environmental Engineer, Water Treatment Engineering & Research Group 86-68230
/s/ 06/04/07 Checked: Robert A. Jurenka, P.E. Date Team Leader, Water Treatment Engineering & Research Group 86-68230
/s/ 06/04/07 Peer Review: Harry Remmers, P.E. Date Water Treatment Engineering & Research Group 86-68230

Contents Page
Acronyms and Abbreviations ............................................................................ vii Executive Summary............................................................................................. ix 1.0 Introduction............................................................................................... 1 2.0 Water Quality Regulations....................................................................... 3 3.0 Water Quality............................................................................................ 5
3.1 Primary Standards................................................................................. 6 3.2 Secondary Standards............................................................................. 6
4.0 Water Treatment Plant Design Overview .............................................. 7 4.1 Alternative A: Chlorination ................................................................. 9 4.2 Alternative B: Coagulation / Sedimentation ........................................ 9 4.3 Alternative C: Coagulation / DAF / Media Filtration........................ 12 4.4 Alternative D: Coagulation / Microfiltration ..................................... 13 4.5 Disinfection: UV, Chlorine, Chloramines ......................................... 14 4.6 Existing Site Constraints..................................................................... 14
5.0 Treatment Alternative “A” .................................................................... 16 6.0 Water Treatment Plant Design.............................................................. 20
6.1 Equalization Tank ............................................................................... 21 6.2 Chemical Injection, Rapid Mix, Coagulation Process ........................ 21 6.3 Flocculation Process ........................................................................... 21 6.4 Sedimentation, Flotation, or Filtration Process................................... 22
6.4.1 Inclined Plate Settlers (IPS)............................................... 22 6.4.2 Dissolved Air Flotation and Media Filtration ................... 22 6.4.3 Microfiltration Process ...................................................... 23
6.5 Disinfection Process............................................................................ 23 6.5.1 Chlorine/Chloramines System and Clearwell ................... 23
Equipment & Layout......................................................... 23 Log Inactivation for the Chlorine/Chloramines System............. 24 6.5.2 UV Reactor System ........................................................... 25
6.6 Backwash and Sludge Processing....................................................... 26 Waste Stream Sedimentation Process ........................................ 26 Sludge Dewatering Process ........................................................ 27
6.7 Site ...................................................................................................... 27 Environmental and Aesthetics.................................................... 27 Arrangement of Water Treatment Plant Site .............................. 28 Access......................................................................................... 28
6.8 Treatment Building & Concrete Tanks............................................... 29 6.8.1 Structural Components ...................................................... 29
Plant Structure................................................................... 29 Buried Tanks..................................................................... 29 Miscellaneous Structures .................................................. 30
6.8.2 Heating and Ventilation Systems ...................................... 30 6.8.3 Auxiliary Mechanical Equipment and Systems ................ 30 6.8.4 Electrical Equipment ......................................................... 32
v

6.9 Sustainability – Energy & Environment ............................................. 33 Energy......................................................................................... 33
Energy Reduction.............................................................. 33 Renewable Energy ............................................................ 33
Environment ............................................................................... 33 Chemical Use .................................................................... 33 Transportation Minimization ............................................ 34
7.0 Costs ......................................................................................................... 36 7.1 Cost Assumptions ............................................................................... 36 7.2 Cost Results ........................................................................................ 38
8.0 References................................................................................................ 40 Attachments A – Water Quality Data
B – Water Quality Graphs C – Drawings D – Heat Analysis
E – Cost Assumptions F – Cost Estimates G – Design Parameter Summary
H – Geotechnical Memorandum I – Ductile Iron Pipe Memorandum
vi

Acronyms and Abbreviations ac-ft acre feet CaCO3 calcium carbonate CaO calcium oxide or quicklime cfs cubic feet per second cfm cubic feet per minute CIP clean-in-place CMU concrete masonary unit CT free chlorine residual, mg/L x time, min CWS community water system DAF dissolved air flotation DBP disinfection by-products DKAO Bureau of Reclamation – Dakotas Area Office DOC dissolved organic carbon EPA U.S. Environmental Protection Agency EIS Environmental Impact Statement FBRR filter backwash recycling rule ft foot gal gallon gpcd gallons per capita per day gpd gallons per day gpm gallons per minute hp horsepower hr hour IESWTR Interim Enhanced Surface Water Treatment Rule IPS inclined plate settler kW kilowatt L&CR Lead & Copper Rule lb pound LT1ESWTR Long Term 1 Enhanced Surface Water Treatment Rule LT2 Long Term 2 Enhanced Surface Water Treatment Rule MCL maximum contaminant level MCLG maximum contaminant level goal MF microfiltration MGD million gallons per day mg/L milligrams per liter (parts per million) min minute MRDL maximum residual disinfectant level MWH Montgomery Watson Harza NF nanofiltration NOM natural organic matter NTU nephelometric turbidity units OM&R operation, maintenance, and replacement
vii

PNR Public Notification Rule PWS public water system Reclamation Bureau of Reclamation RO reverse osmosis rpm revolutions per minute SCADA Supervisory Control And Data Acquisition sec second SDWA Safe Drinking Water Act SOP standard operating procedure Stg 1 D/DBPR Stage 1 Disinfectants/Disinfection By-Products Rule Stg 2 D/DBPR Stage 2 Disinfectants/Disinfection By-Products Rule SWTR Surface Water Treatment Rule TDH total dynamic head TDS total dissolved solids TSC Bureau of Reclamation – Technical Service Center TOC total organic carbon UF ultrafiltration USGS U.S. Geological Survey μg/L micrograms per liter (parts per billion) UV ultraviolet VFD variable frequency drive yd yard yr year
viii

Executive Summary The Bureau of Reclamation, Great Plains Region, Dakotas Area Office is preparing an environmental impact statement on the Northwest Area Water Supply (NAWS) project. The environmental impact statement evaluates water treatment alternatives to minimize the risk of transfer of non-native biota from the Missouri River basin to the Hudson Bay basin. The NAWS project is a bulk water distribution system for local communities and rural water systems in northwestern North Dakota. The water source for this system is Lake Sakakawea, a reservoir created by the Garrison Dam on the Missouri River. In the spring of 2006, the Dakotas Area Office of the Great Plains Region requested a design and cost analysis for water treatment options for the NAWS project. This report provides an Appraisal level design and cost analysis for three types of water treatment systems for biota removal and inactivation at a peak product flow of 26 MGD. Concerns over the transfer of invasive species from the Missouri River basin to the Hudson Bay basin, have led to the development of treatment alternatives to address this issue and evaluate the potential environmental impacts of the alternatives. There are no regulations in place that govern the removal/inactivation of invasive species. EPA drinking water standards provide the best reference point for biota removal/inactivation, but can not be considered the regulatory standard. Water Quality - Water quality results show the water from Lake Sakakawea is typical for surface water. The water is characterized by occasional high turbidity spikes, mainly occurring during the summer time, and is considered hard. The lake has total dissolved solids and sulfate concentrations slightly above EPA Secondary standards for potable water. The lake surface will freeze in the winter. Water Treatment – The treatment process selected for the NAWS project during a previous evaluation of the project included chlorination in the Missouri River basin portion of the project followed by final treatment, including ultraviolet disinfection in the Hudson Bay basin portion of the project. This treatment regime is the no action alternative in the environmental impact statement referred to as “Alternative A”. The consulting engineer for the project sponsor had previously designed Alternative A at the 50% design. The alternative is discussed from a treatment standpoint in this report, but no new cost estimates were developed.
ix

Three other treatment systems being evaluated as part of the environmental impact statement were designed, and cost estimates were developed as part of this report. These treatment system alternatives include:
Alternative B) Coagulation, Sedimentation Alternative C) Coagulation, Dissolved Air Flotation, Media Filtration Alternative D) Coagulation, Microfiltration
All alternatives designed by Reclamation incorporate UV, chlorine, and chloramines for microbial inactivation Results – Section 7.0 details the cost estimating methods used to determine the 2007 costs for both construction and operation, maintenance, and replacement aspects of each of the three alternatives considered. The construction costs are:
Alternative B) $64 million Alternative C) $71 million Alternative D) $88 million
x

1.0 Introduction This report provides an Appraisal level design and cost analysis for a 26 MGD water treatment system in the Northwest Area Water Supply (NAWS) project in North Dakota
Figure 1.1: Overview map of the Missouri River Basin and Hudson Bay Basin delineation line, pipeline route, and water treatment plant location at Max, ND. During a previous evaluation of the project (2001) the selected chlorine treatment system (Alternative A) for the NAWS pipeline was designed by Montgomery Watson Harza (MWH), a consulting engineering firm for the project sponsor. A predesign report “NAWS Project Pretreatment System Predesign Evaluation” (Houston Engineering & MWH, 2003) was completed in February 2003, and a 50% design submittal was completed in January 2004. Prior to this, in October 2002, the Province of Manitoba, Canada filed a legal challenge in U.S. District Court challenging the NAWS Environmental Assessment and the Finding of No Significant Impact that were completed in 2001. The court ruled that the Department of Interior should complete additional environmental analyses on the possibility of leakage and the potential consequences of the failure to fully treat Missouri River water at
1
Lake Sakakawea

its source. In response to the court order, Reclamation initiated the preparation of an environmental impact statement (EIS) in compliance with the National Environmental Policy Act. This resulted in a re-evaluation of the chlorination treatment design and the consideration of additional treatment alternatives. This appraisal level report includes a brief review of Alternative A and three new water treatment system alternatives for biota removal and inactivation. An Appraisal level design determines if there is a solution that appears to be economically and environmentally sound and compares relative costs of the alternatives. This level of report uses existing or limited new data and does not go into detailed design or detailed cost analysis. A “Feasibility Study” is the subsequent step to develop the design of the favored alternative(s) and to estimate a funding appropriation. This evaluation commenced with a site visit by Technical Service Center engineers to the proposed treatment plant location at Max, ND. The TSC was tasked with performing an assessment of the no-action alternative (Alternative A) and appraisal level designs with sub-feasibility details for 3 other water treatment process trains. All treatment options are for biota treatment of water from Lake Sakakawea and were designed around the flow rates in Table 1.1. Flow MGD CFS Average Daily 10.5 16.2 Peak Daily 26.0 40.3 - Bold values were original design parameters Table 1.1: Matrix of product flow rates (peak flow). There are two flow scenarios per treatment
alternative.
2
There are no treatment standards for the transfer of water between basins to reduce the risk of transferring invasive species, therefore; the best available information can be found in the SDWA. Treatment design goals for Alternative A are described in the NAWS EIS. Treatment design goals for the other 3 alternatives follow the Safe Drinking Water Act requirements including turbidity limits and biological removal/inactivation.

2.0 Water Quality Regulations There currently are no Federal water quality regulations for biota treatment for ecological protection prior to inter-basin transfer. Giardia lamblia, Cryptosporidium, and viruses are regulated as human health pathogens by the EPA under the Safe Drinking Water Act (SDWA). In the absence of standards for treatment of invasive species associated with potential inter-basin water transfers, minimum treatment levels are compared to existing EPA Primary standards for Giardia lamblia, Cryptosporidium, and viruses. Contaminants can be divided into two categories:
• Biological contaminants • Organic and inorganic contaminants
The SDWA and the National Primary Drinking Water Regulations (NPDWR) that specifically pertain to surface water and set reduction standards for the biological contaminants affecting human health. The first in a succession of rules pertaining to systems that use surface water is the Surface Water Treatment Rule requires 3 log removal/inactivation of Giardia and 4 log removal/inactivation of viruses. The Interim Enhanced Surface Water Treatment Rule required 2 logs of removal of Cryptosporidium. Most recently the Long Term Two Enhanced Surface Water Treatment Rule (LT2) requires up to 2.5 logs of additional reduction (removal and/or inactivation) depending upon the levels of Cryptosporidium found in the source water. Treatment for organic and inorganic contaminants which may fall under Primary standards or Secondary standards are considered, but only from an end use perspective. Since there is no surface water discharge of transfer water before further treatment in Minot, receiving water compatibility issues are not considered.
3

4

3.0 Water Quality The water source for the NAWS project is Lake Sakakawea using the Snake Creek Pumping Plant (Figure 3.1).
Figure 3.1: Intake location Water quality data from Lake Sakakawea at the Snake Creek Pumping Plant (1990 – 2003) were analyzed for trends over time and absolute values. The water quality data from the USGS online database and the USGS report “Quality of Streams in the Red River of the North Basin, Minnesota, North Dakota, and South Dakota” report (Tornes) were combined to form a table of water quality data (Attachment A). Data were graphed to determine trends over time (Attachment B).
5

Data that were not available consisted primarily of Primary contaminants. However, the available data and communication with the City of Bismarck (downstream of Lake Sakakawea on the Missouri River) did not indicate problems with any other Primary contaminants. Other pollution sources may exist along Lake Sakakawea, although such sources are unlikely given the rural nature, mainly agriculture uses, and review of 1995 aerial imagery for contamination sources. The available data provided sufficient information for the level of detail of this Appraisal study; therefore, additional water quality data were not collected.
3.1 Primary Standards
The available data for Lake Sakakawea do not show any values that exceed Primary standards with the exception of occasional turbidity. Elevated biological contaminants may exist, but data such as Giardia and Cryptosporidium were not readily available. If a Feasibility level study occurs, we recommend that data for all regulated contaminants be obtained at that point.
3.2 Secondary Standards
The available data show the exceedance of some Secondary standards (TDS & sulfate). The TDS of 470 mg/L average value was below the Secondary standard (500 mg/L). However, the 810 mg/L maximum concentration exceeded this standard. These values indicate some blending or desalination may be needed in the treatment process at Max or at Minot. The sulfate average concentration of 199 mg/L was below the Secondary standard (250 mg/L). However, the 341 mg/L maximum concentration exceeded this standard. The water is considered “very hard” with a hardness range from 170 to 260 mg/L (Table 3.1).
Degree of Hardness
Concentration mg/L as CaCO3
Soft 0 – 60 Moderately Hard 60 – 120 Hard 120 – 180 Very Hard 180+
6
Table 3.1: General hardness rating scale

4.0 Water Treatment Plant Design Overview This section presents an overview of the three water treatment processes designed by Reclamation. Section 5.0 provides a review of Alternative A which was designed by MWH. Detailed descriptions of individual unit processes for Alternatives B, C, and D can be found in Section 6.0. Treatment processes selected vary from basic oxidation treatment to more complex physical removal and inactivation/oxidation (Table 4.1).
Purpose of Treatment Plant Components
Alternative Purpose Biological Removal Biological Inactivation
A - Primary Biological Contaminants - Chlorine/Chloramines
B - Primary Biological Contaminants - Coagulation
- Sedimentation - UV - Chlorine/Chloramines
C - Primary Biological Contaminants - Natural Organic Matter
- Coagulation - Air Flotation - Media filtration
- UV - Chlorine/Chloramines
D - Primary Biological Contaminants - Natural Organic Matter
- Coagulation - Microfiltration
- UV - Chlorine/Chloramines
A – Chlorination B – Coagulation / Sedimentation C – Coagulation / DAF / Media Filtration D – Coagulation / Microfiltration Table 4.1: Water treatment plant alternatives and their components The biological contaminant removal / inactivation for the treatment alternatives is shown below (Table 4.2). Data were not available for Cryptosporidium concentrations to determine the corresponding bin in the LT2. However, it was assumed that the water quality will result in a bin 1 classification due to the rural nature of Lake Sakakawea and currently imposed regulations for any wastewater treatment plant outfalls. A bin 1 classification does not require any additional treatment for Cryptosporidium.
7

Treatment Credit
Alte
rnat
ive
Coa
gula
tion
&
Sedi
men
tatio
n
Coa
gula
tion,
DA
F,
Med
ia F
iltra
tion
MF1
UV
Chl
orin
e
Chl
oram
ines
(Pip
elin
e)
Tota
l
SWTR
Reg
ulat
ions
2
Giardia 0.2 2.9
Cumulative Credit 0.2 3.1 3.1 3.0
Viruses 6 0.5
Cumulative Credit 6.0 6.5 6.5 4.0
Cryptosporidium 0 0
A 3
Cumulative Credit 0 0 0 5.5
Giardia 0.5 3 0.34 0.29
Cumulative Credit 0.5 3.5 3.84 4.13 4.1 3.0
Viruses 0.5 0 15 0.5
Cumulative Credit 0.5 0.5 15.5 16.0 16 4.0
Cryptosporidium 0.5 3 0 0
B
Cumulative Credit 0.5 3.5 3.5 3.5 3.5 5.5
Giardia 2.5 3 0.34 0.29
Cumulative Credit 2.5 5.5 5.84 6.13 6.1 3.0
Viruses 2 0 15 0.5
Cumulative Credit 2 2 17 17.5 17.5 4.0
Cryptosporidium 2.5 3 0 0
C
Cumulative Credit 2.5 5.5 5.5 5.5 5.5 5.5
Giardia 4 3 0.34 0.29
Cumulative Credit 4 7 7.34 7.63 7.6 3.0
Viruses 0.5 0 15 0.5
Cumulative Credit 0.5 0.5 15.5 16.0 16.0 4.0
Cryptosporidium 4 3 0 0
D
Cumulative Credit 4 7 7 7 7.0 5.5 A – Chlorination B – Coagulation / Sedimentation C – Coagulation / DAF / Media Filtration D – Coagulation / Microfiltration 1 – Determined by the State and specific to the manufacturer. MF shown for Siemens-Memcor filter and are California DHS approved removal values. 2- Treatment requirements under the Surface Water Treatment Rule (SWTR, LT1ESWTR, IESWTR, LT2). Assumed a worse case Cryptosporidium scenario of Bin 4 classification. 3 – Estimated using the MWH design criteria, actual WTP location, and the 1995 Chloramine Challenge Study - Chlorine / Chloramines numbers calculated based on CT values achieved Note: The log inactivation/removal credits shown above are based on “expected values” for appraisal-level water treatment plant designs and may change during final designs. Table 4.2: Log inactivation/removal credit provided from a drinking water regulation standpoint
8

The four treatment processes in Table 4.2 are also shown in Figure 4.1. The majority of the waste streams are recycled due to the location of the treatment plant and lack of receiving water. Brief descriptions of the four alternatives follows. Alternatives B, C, and D include disinfection using UV, chlorine, and chloramines, which is discussed in Section 4.5. Finally, existing site constraints are listed briefly in section 4.6.
4.1 Alternative A: Chlorination
Alternative A provides baseline treatment using chlorination prior to the water crossing the continental divide into the Hudson Bay basin. Additional treatment at the Minot WTP would result in water which meets all the requirements of the SDWA. Designed by MWH (consultant of the NAWS project sponsor), this alternative provides basic disinfection with 5 min of free chlorine contact time at 3.5 mg/L residual. This is followed by ammonia addition to form chloramines with 2.3 hours of contact time in the pipe before reaching the drainage divide at an estimated 4 mg/L. This alternative is not intended to meet all SDWA requirements before the water is transferred into the Hudson Bay basin.
4.2 Alternative B: Coagulation / Sedimentation
This alternative involves coagulation, flocculation, sedimentation, and disinfection. The process begins with the addition of ferric chloride coagulant, rapid mix and 3-stage tapered vertical shaft flocculation. Flocculated particles are then removed through inclined plate settlers (IPS). Through jar testing and field verification, the process is optimized to remove as much natural organic matter as possible. Sludge from the IPS is dewatered by a centrifuge. Centrate from the centrifuge is recycled to the front of the plant. This alternative provides limited removal of particles. Without some type of filtration, turbidity spikes in the source water may lead to spikes in effluent turbidity. Careful monitoring of coagulant and polymer (if used) would improve overall treatment and in particular, reduce spikes in effluent turbidity. The coagulation/flocculation/sedimentation step is not commonly used without filtration in a SDWA compliant WTP. The water treatment regulations show that the overall treatment process satisfies log reduction requirements. However, the coagulation step has the potential to have a negative impact. An American Water Works Association (AWWA) journal article reported that the UV light following sedimentation will achieve some log inactivation of Cryptosporidium, even in high turbidity water (Clancy, 2000). However, without the sedimentation step there is the risk associated with the amount of overall turbidity which would not be removed prior to UV treatment. Coagulation/sedimentation has a dual purpose, particle removal to meet turbidity standards and natural organic matter removal, essential to lowering disinfection by product (DBP) levels.
9
The sedimentation step significantly reduces the overall turbidity and associated risk, but may introduce turbidity and risk in the form of a large coagulated particle that escapes the sedimentation basin and shields microbial contaminants from the UV light. This large

10
particle would pass undetected if it is not part of the turbidimeter side stream. If such a particle and encased microbe makes it through the UV system in a viable state, the only protection remaining would be chlorine/chloramines which are not effective at inactivating Cryptosporidium. It is unknown if the risk of biological passage is greater or lower with the sedimentation system in place, but it is needed if the NOM concentration is to be reduced. Sludge generated from sedimentation is sent through a centrifuge which separates the water portion and generates a solid waste. The solid waste is trucked to the nearest landfill in the Missouri River Basin (estimated at 20 miles) or a landfill will be established close to the site. Centrifuge centrate is recycled to the front of the treatment plant.

11
Alternative A Chlorine
UV
Alternative B
UV
Alternative C
Media Filter
Backwash Waste (5%)
Coagulation Flocculation
Sludge Waste (1%)
Alternative D
Figure 4.1: Process block diagram for treatment alternatives (Note: % waste shown is the percentage of the feed to that process component.
UV Coagulation Flocculation
MF
Chloramines
Ammonia
Chlorine
Chloramines
Ammonia
Chlorine
Chloramines
Ammonia
Chlorine
Clearwell Chloramines
Ammonia
Clearwell
Clearwell
Clearwell
Feed Tank
Dissolved Air Flotation
Feed Tank
Feed Tank Coagulation Flocculation
Sedimentation
Dewatered Sludge Disposal Sludge
Dewatering
Sludge Waste (1%)
Dewatered Sludge Disposal
Waste Treatment
Sludge Dewatering
Backwash Waste (5%)
Dewatered Sludge Disposal
Waste Treatment
Sludge Dewatering

4.3 Alternative C: Coagulation / DAF / Media Filtration
This alternative involves coagulation, flocculation, dissolved air flotation (DAF), media filtration, and disinfection. The DAF process begins with the addition of ferric chloride coagulant, rapid mix and two-stage vertical shaft flocculation. The flocculated particles are then removed through DAF where they float to the top using very fine air bubbles. Particles that are not removed by flotation are removed by a dual media filter. The process is optimized to remove as much NOM as possible. Media filter backwash water and skimmings from the DAF are thickened by a packaged IPS producing backwash waste IPS sludge. The backwash waste IPS sludge is dewatered by a centrifuge and trucked off site to the nearest landfill in the Missouri River basin. Effluent from the packaged IPS and centrate from the centrifuge is recycled to the front of the plant. DAF is a type of sedimentation and an alternative to gravity sedimentation which relies on particles floating instead of settling. DAF is a proven technology; however it has far less installations in the United States than gravity sedimentation. The process has advantages for low turbidity waters which can be expected from this lake source. Disadvantages of DAF are increased maintenance and power costs when compared to sedimentation. When DAF is combined with media filtration, it may have a stacked or separated process configuration. The stacked configuration, where the DAF process is in the same tank and directly above the media filtration, has a smaller foot print and may be less expensive to construct. However, the ductile iron pipeline has been installed between the Snake Creek Pumping Plant and the treatment plant site at Max, ND and the conditions at this location are limited hydraulically. The hydraulic grade line at the treatment plant inlet controls the hydraulic grade line of the WTP. This limitation will likely result in an increased excavation depth. Taking into account this limitation and the high groundwater at the site, our design incorporates a side by side arrangement for the WTP alternative.
12
Dual media filtration typically uses a combination of sand and coal (anthracite) and sometimes includes a top thinner layer of activated carbon. Conventional media filtration has been widely used in the U.S. and has been the standard treatment for many years. However, it is an older technology which has been surpassed by membranes in treatment performance, but not necessarily in cost. Media filters provide good removal of particles, although less than membranes, and will eliminate the shielding issue associated with microbial contaminants identified in Alternative B. Media filters are affected by influent turbidity spikes which are connected to sedimentation basin performance. Media filters are backwashed using product water. The backwash water is returned to the front of the treatment train. Backwash water is subject to the Filter Backwash Recycling Rule which reduces the possibility of a high microorganism loading on the media filters.

4.4 Alternative D: Coagulation / Microfiltration
This alternative involves coagulation, flocculation, microfiltration (MF), and disinfection. The process begins with the addition of ferric chloride coagulant, rapid mix, and two-stage vertical shaft flocculation to form pin-floc. The coagulant is added with sufficient time to form pin-floc which is not large enough to settle, but can be easily removed by the membrane. The pin-floc increase organic matter removal by the membranes and can improve flux through the membrane. The use of a coagulant has the down side of solids separation and disposal requirements. The microfiltration membrane removes suspended particles and is certified for 4 log removal of Giardia and Cryptosporidium, and 1.5 log removal of viruses. The system chosen uses a pressurized, dead end, outside-in configuration. A 2nd stage MF system is used to further concentrate the backwash water solids before going to an IPS. The backwash waste IPS sludge is dewatered by a centrifuge and trucked off site to the nearest landfill in the Missouri River basin. Effluent from the packaged IPS and centrate from the centrifuge are recycled to the front of the plant. MF membranes are cleaned periodically with acid and base. The cleaning waste, generated monthly, is neutralized and disposed. An option is to truck the cleaning waste and discharge into Lake Sakakawea (12 miles away), under the requirements of a discharge permit issued by the ND State Health Department. The MF design uses tubular membranes with an approximately 0.1 μm pore size in a dead end filtration scheme. Depending on the type of membrane, they are operated under a pressurized or vacuum regime. Vacuum configurations use open tanks to house the membrane racks and can accommodate higher solids loading. Pressure configurations use cylindrical membrane modules which are mounted on a skid (Figure 4.2). Figure 4.2: MF treatment skid In addition, there are cross flow or dead end configurations and inside-out or outside-in flow directions. In dead end operation, the feed flow contacts the membrane surface at a perpendicular angle and the permeate flow is equal to the feed flow. In an outside-in
13
Courtesy of Siemens/Memcor

system, the feed flow surrounds the membrane, and the filtrate is collected inside the hollow tube fibers (Pilutti and Nemeth, 2003). An air scour is typically used to prevent solids buildup on the membrane surface. In addition, an automatic backwash, which may be chlorinated, occurs every ~20 min. Typically, MF membranes need to be chemically cleaned on a monthly basis. When possible, it is recommended that the waste be discharged instead of recycled. MF systems are very effective against both Cryptosporidium and Giardia.
4.5 Disinfection: UV, Chlorine, Chloramines
Disinfection provides log inactivation credit for any remaining log reduction requirements and a disinfectant residual to reduce the chance of re-growth of organisms in the pipeline. The first step in the disinfection process included in each alternative except Alternative A, is the UV reactors. UV is a very effective disinfectant against Giardia and Cryptosporidium without DBP formation. It provides system flexibility by allowing lower chlorine concentrations or clearwell contact times thereby reducing the potential for DBP formation. UV disinfection is not very effective against viruses and does not provide a disinfection residual in the effluent. Virus inactivation is possible, but only at the cost of significant increased energy usage (~3 times). Disinfection against viruses and a residual will therefore be provided by the chlorine system. The number of active UV units is based on the log credits provided by the systems upstream of the UV system and by the log inactivation provided by the chlorine/chloramines system. The UV and chlorine/chloramines system was designed for a peak flow of 26 MGD for all three alternatives and is based on the CT tables recommended by the EPA. The second step in the disinfection process is chemical disinfection with chlorine/chloramines. Chlorine has a 30 min maximum reaction time in the clearwell before entering the distribution system pipeline, which in this case is a supply system (pipeline). Liquid ammonia is injected into the product water after it leaves the clearwell to form chloramines. The advantage of chloramines is a stable residual and reduced DBP formation potential. The remaining contact time is achieved in the 9.0 miles of distribution system pipeline between the WTP location and the drainage divide. Chloramines are a less effective disinfectant than chlorine, but are also less reactive in forming disinfection byproducts. As with biota treatment, the requirements for a disinfectant residual in the distribution system are undefined. Therefore, the potable water requirement for distribution system disinfection is used. This is at least 0.2 mg/L disinfectant residual leaving the treatment plant, and a detectable residual throughout the distribution system pipeline; which is a requirement for drinking water systems that use surface water.
4.6 Existing Site Constraints
14
The State’s design engineer, MWH, indicated that the new water treatment plant at Max should not contain a water surface higher than 2107.90. We were told that exceeding this surface would place excessive pressure on the 36” DIP waterline which connects the Snake
Creek pumping plant and the water treatment plant. To provide for some factor of safety this limit was incorporated into the plant’s first tank, the equalization tank, by using a design water surface of 2106. Flow through the plant is by gravity to downstream units.
15
The Max water treatment plant site contains appreciable standing groundwater. A soils investigation by MWH contained 16 bore holes. They concluded that along the ridge, a number did not encounter groundwater, however, other holes did which is likely a result of intercepting sand lenses. They also concluded that the general groundwater table in the area appears to be 2095 ft. Based on site topography maps provided, the approximate existing ground elevation at the plant ranges from 2102 to 2110.

5.0 Treatment Alternative “A” Alternative A was designed and cost estimated by Montgomery Watson Harza (MWH). This is detailed in the MWH technical memorandum “Booster Pump Station / Pretreatment Facility Predesign” (February 24, 2003) and the Houston Engineering/MWH report “NAWS Project Pretreatment System Predesign Evaluation” (February 2003). This section summarizes the water treatment design related aspects of the MWH report. The MWH treatment system design consists solely of a chlorine/chloramines system. Chlorine is injected into the line before entering a clearwell with 15 min of contact time (CT=15 mg/L*min). Upon exiting the clearwell, ammonia is added to form chloramines with additional contact time before reaching the drainage divide. This design evaluation focuses on the source of the log inactivation data (Table 5.1). The MWH design uses the 1995 Chloramine Challenge Study (CCS) as the basis for its disinfection system design. The CCS uses actual disinfection data for Giardia inactivation which provided significantly more disinfection credit than the EPA CT tables. For example, 5 min of free chlorine contact time followed by chloramines achieves 3 log Giardia inactivation with a CT of 500 mg/L*min in the CCS. This is compared to 2000 mg/L*min required in the EPA CT tables, although these are based on only chloramines with no free chlorine contact time. The use of the CCS should satisfy regulators and other parties since it relies on actual data. The CCS assumed a contact time of 5.9 hours to the drainage divide while actual conditions with the WTP at Max, ND would only achieve 2.3 hours. Therefore, the safety factor of 2 assumed by MWH for Giardia inactivation is greatly reduced. The MWH design does not indicate the difference in contact times nor the expected temperature of the feedwater. Given the distance traveled in the pipeline before treatment, it is a reasonable assumption that the feedwater will be near 4 oC vs. the conservative <0.5 oC used in the Reclamation designs. While the safety factor with the reduced contact time is closer to 1, a safety factor is not required and the MWH design is still likely valid. In addition, the MWH design allows for a chlorine contact time up to 10 min under some flow conditions which improves the safety factor. The MWH design values in Table 5.1 with the current WTP location were recalculated in the CCS study to determine the Alternative A log inactivation values presented in Table 4.2.
16
Reclamation’s designs for the other three treatment alternatives use a more conservative and flexible approach with a longer contact time (up to 30 min). The <0.5 oC (vs. the next higher 5 oC) EPA table is used as the basis with consideration taken from the CCS. The chlorine residual is lower (0.5 mg/L) and the CT achieved (45 mg/L*min) and log inactivation (0.34 log) are reduced. The additional inactivation from chloramines between the WTP and the drainage divide is 0.29 log. The additional inactivation required to achieve 3.0 log is handled by the UV system. This larger clearwell in Reclamation’s designs also achieves a

17
simultaneous benefit of more storage to handle short term treatment system disruptions and still provides continuous product flow to Minot, ND.

Contact Time Chlorine Chloramines
Source Temp pH Chlorine Chloramines Total Dose
(mg/L) Residual(mg/L)
Dose (mg/L)
Residual (mg/L)
Chloramine Challenge Study 4 8.2 5 min 3 hours - 4.5 3.8 4.5 ? (4.0) 2 MWH Design ? (4) 5 min/10
min max ? 5.9
hours 4.5 3.5 (3.5) 3 (3.2) 4
Actual Conditions for use in MWH Design
? 1 8.2 (5 min) 2.3 hours 1 - (4.5) (3.5) (3.5) (3.2)
Reclamation Design <0.5 8.2 30 min 2.3 hours - 4.0 3.0 3.0 2.7 ? indicates and unknown value. ( ) indicates an assumed or estimated value. 1 Based on 9.0 miles to drainage divide and 26 MGD flow. 2 There is an unclarified discrepancy in the CCS report text. It states that chloramines residuals are located in Appendix A while the units in Appendix A are “chlorine residuals”. Assuming units in the Appendix are correct and no chloramines residual info is available, then a reasonable assumed chloramines value is 4.0 mg/L. 3 Assume sufficient to achieve a 4:1 Cl2:N ratio. Assume chloramines dose is the same as the chlorine residual. 4 Assume chloramines demand is 0.3.
18
Table 5.1: Chlorine/Chloramines inactivation results

19

6.0 Water Treatment Plant Design Where applicable, water treatment plant design specifications (Attachment G) were verified against guidelines provided in Recommended Standards For Water Works, 2003 Edition, commonly referred to as The Ten States Standards. In cases where guidelines were not provided The Ten States Standards, design specifications were verified against reputable sources such as water treatment textbooks and manufacturer recommendations. Manufacturer recommendations were backed by previous design experience and similar plant or pilot data. Design feed flows (Table 6.1) are based on the required product flow (26 MGD) in addition to any losses or backwash flows that the system requires.
Alternative Design Feed Flow
(MGD) 1 Flow per Flocculation
Train (MGD) B 26.1 4.35 C 27 4.5 D 26 4.33
1 - Actual flow in pipeline may be limited to 26 MGD; additional hydraulic analysis will be done to determine maximum flows in final design B – Coagulation / Sedimentation C – Coagulation / DAF / Media Filtration D – Coagulation / Microfiltration Table 6.1: Design feed flow Alternative B assumes a 1% loss of the raw feedwater in the sedimentation sludge. Alternative C requires an additional 1 MGD on top of the product flow to backwash the media filters. Alternative D also requires nearly 1 MGD for backwashing, however most of this water is recovered by the second stage microfiltration system. Detailed design drawings are found in Attachment C (Drawings 1 – 14). As mentioned in section 4.6, Alternatives B, C, and D, accommodate a limiting elevation by using a water surface of 2106 ft in the first tank. The elevation is limited by the pressure rating of the pipeline. The vertical placement of all downstream units which are fed by gravity from the upstream units are affected by this limitation. In a site where high groundwater exists, the limitation has substantial cost impacts in that it leads to increased excavation and backfill around structures and it may increase the amount of dewatering required. Ductile iron pipe thickness class is chosen after a review of expected pressures, loads and trench conditions. The ductile iron pipe between the Snake Creek Pumping plant and the site at Max, ND that was installed in 2006 is a 36 inch, class 200, cement lined pipe. Calculations performed by MWH indicate the system head at the Snake Creek Pumping Plant, at 26 MGD, is about 211 psi. Although this pressure is close to the rating of the pipe,
20
it is well below the maximum design strength of the pipe when surge is considered. In section 6.7, it is recommended that the limitation imposed on the treatment plant design be re-evaluated in a later design phase.
6.1 Equalization Tank
A 1,125,000 gal equalization tank reduces the risk of insufficient water from emergencies such as equipment failure or power outage. It also provides gravity flow to downstream processes thereby dampening fluctuations in the feedwater flow from the Snake Creek Pumping Plant. The retention time of the equalization tank is 60 min. The equalization tank is 100 ft square by 17 ft high with a maximum water depth of 15 ft.
6.2 Chemical Injection, Rapid Mix, Coagulation Process
Chemical addition is 38% strength ferric chloride at a concentration of 10 mg/L for Alternatives B, C, and D. In addition, DADMAC cationic polymer is used for Alternatives B and C; polymer will not be used for Alternative D due to the potential of fouling the microfiltration membranes. The ferric chloride and polymer are mixed into the process stream with impeller type rapid mixers. The peak and average flow rates of ferric chloride are 190 gal/day and 75 gal/day, respectively. The peak and average flow rates of polymer are 26 gal/day and 10 gal/day, respectively. The ferric chloride and polymer are injected using diaphragm metering pumps. The ferric chloride is stored in a 6,000 gal fiberglass reinforced plastic (FRP) tank, while polymer is stored in vendor supplied 330 gal plastic totes. The chemicals are mixed with the raw influent with a 10 hp impeller type mixer in a concrete rapid mix tank. The dimensions of the rapid mix tank are 10 ft in length by 10 ft in width with a 13.5 ft water depth. There is one active rapid mix tank and one inactive redundant rapid mix tank.
6.3 Flocculation Process
Alternative B – Tapered three stage vertical shaft flocculation is used for Alternative B. There are 6 active trains; however if one train is taken off-line, the flow is redistributed between the remaining 5 trains. The plant must meet minimum Ten States Standards flocculation times (30 min per train) and not exceed maximum cross-sectional flow through velocities (1.5 ft/min) with 5 trains running at peak flow. Assuming 5 trains running at peak flow, the total detention time for one train is 50 min and a flow through velocity of 1.5 ft/min. The total detention time with 6 trains running is 60 min and a flow through velocity of 1.24 ft/min. The flocculation tanks are 25 ft square with a water depth of 13 ft. The flocculator mixer G-values per stage are 40, 18, and 5 sec-1 and were obtained from jar tests conducted by MWH in November 2005. Alternatives C and D – Tapered two-stage vertical shaft flocculation is used to form pin-floc required for Alternatives C & D. The detention time per stage is 10 min, with a total
21

detention time of 20 min per train. The Ten States Standards do not provide flocculation design guidelines for the formation of pin-floc. Consultation with B.F. Leopold, Inc., confirmed that a 20 min total detention time is sufficient to form the pin floc required for DAF. There are 6 active flocculation tank trains; however if one train is taken off-line, the flow is redistributed between the remaining 5 trains. The dimension of the flocculation tanks are 18 ft L x 19.3 ft W with a 12 ft water depth. The flocculation design provided for DAF was also used for the pin-floc required for microfiltration.
6.4 Sedimentation, Flotation, or Filtration Process
6.4.1 Inclined Plate Settlers (IPS) Alternative B – Sedimentation is accomplished through inclined plate settler (IPS) packs installed in concrete basins. There are 6 active IPS trains, however if one train is taken off-line, the flow is redistributed between the remaining 5 trains (Attachment C, Drawings 1 – 4). The flow per train is 3,022 gpm (4.35 MGD). The Ten States Standards specify that maximum plate loading rates should be 0.5 gpm/ft2 based on 80 percent of the projected horizontal plate area. The plate loading rate for Alternative B is 0.3 gpm/ft2 with five trains running and 0.25 gpm/ft2 with six trains running. Each IPS tank is similar in width to the flocculation tanks (25.0 ft), has a length of 60 ft, and a water depth of 16 ft.
6.4.2 Dissolved Air Flotation and Media Filtration Alternative C – This design incorporates a side by side DAF and filter arrangement based on the limitations described in Section 4.3. DAF is an effective alternative to sedimentation because it uses minute air bubbles to float light flocculated particles; the floated solids are skimmed off, leaving clear water near the bottom of the tank. The time required for flocculation is shorter than for conventional settling processes, and the surface loading rate is generally 10 times or more than for conventional sedimentation tanks (Kawamura, 2000). DAF is categorized as a “high rate clarification process” by The Ten States Standards. The Ten States Standards provide no design guidelines, but rather require that pilot studies or documentation of full scale plant operation with similar raw water quality demonstrate satisfactory performance. F.B Leopold, Inc., a company with considerable design experience in DAF and media filtration, was consulted during the design of Alternative C. There are 6 active DAF and media filter trains, however if one train is taken offline, the flow is redistributed between the remaining 5 trains (Attachment C, Drawings 5 - 8). The DAF loading rate is 12 gpm/ft2 with five trains running and 9.5 gpm/ft2 with six trains running. Pilot studies conducted by F.B. Leopold, Inc. at other sites indicate that a loading rate as high as 20 gpm/ft2 can be maintained while still producing high quality effluent. Each DAF tank is similar in width to the flocculation tanks (18.0 ft), has a length of 23 ft, and a depth of 12 ft. Media filtration will consist of 12 inches of silica sand below 18 inches of anthracite coal. The bed surface area is 760 ft2 (20 ft W x 38 ft L) which provides a surface loading rate of 4.9 gpm/ft2 with 5 trains running and 4.1 gpm/ft2 with 6 trains running. The Ten States
22
Standards do not specify a minimum loading rate, but rather state that “the filter rate must be proposed and justified by the design engineer to the satisfaction of the reviewing authority prior to the preparation of final plans and specifications”. The 4.1 and 4.9 gpm/ft2 loading rates are within the range (4 to 10 gpm/ft2) for high rate dual (coal-sand) or trimedia (coal-sand-garnet) filters given in Kawamura (2000). The media filter beds are backwashed at a rate of 20 gpm/ft2 for a duration of 15 min per the minimum requirements of The Ten States Standards. Air scour of the media is provided at an air flow rate of 4 scfm/ft2. The water depth above the media will vary between 1.4 ft and 9 ft depending on whether the media is clean or dirty.
6.4.3 Microfiltration Process Alternative D – The microfiltration system has two stages (Attachment C, Drawings 9 – 12). Backwash wastewater from the first stage is the feedwater for the second stage, thereby reducing backwash waste volume and increasing total system recovery. The first stage microfiltration system consists of 9 active skids and 1 redundant skid with each skid containing 324 membrane modules. The second stage microfiltration system consists of 1 active and 1 redundant skid with each skid containing 144 membrane modules. The backwash process uses a low-pressure air scour and air-assisted liquid backwash to remove accumulated particles from the membrane fibers. The backwash lasts approximately 90 seconds and occurs at an interval of every 25 min. In addition to backwashes, a 30 min maintenance wash is performed daily and consists of a dilute chlorine and dilute acid or base solution. A monthly clean-in-place (CIP) is an extended cleaning (duration 2 hours) and is designed to recover membrane permeability. The CIP consists of a chlorine solution and a more concentrated acid solution. The backwash and maintenance wash water can be recycled to the front of the water treatment plant following treatment by the waste stream sedimentation process. The chlorine portion of the CIP waste can be recycled to the front of the plant, however the acid portion must be pumped to the neutralization system and hauled away. According to Seimens Water Technology, a concentrated acid solution (even after neutralization) recycled to the front of the plant can potentially cause adverse effects due to interactions with coagulants (Seimens, 2006). A CIP waste holding tank is located outside of the main treatment building and holds 64,000 gallons or approximately one month of neutralized CIP wastewater.
6.5 Disinfection Process
Disinfection is provided by UV and chlorine. For clarity, the chlorine/chloramines system and clearwell will be discussed before the UV system.
6.5.1 Chlorine/Chloramines System and Clearwell
Equipment & Layout The majority of the disinfection provided by the chlorine/chloramines system is provided by free chlorine and its contact time with water in the clearwell. After leaving the clearwell,
23
ammonia is mixed with chlorine to form chloramines which provide additional disinfection in the pipeline from Max to Minot. The chlorine dose for all the alternatives is 4.0 mg/L assuming a 1.0 mg/L chlorine demand and a 3.0 mg/L free chlorine residual in the clearwell. The chlorine demand of 1 mg/L was extrapolated from bench test data provided by Houston Engineering, Inc. (1995). At a plant peak flow of 26 MGD, the chlorine flow rate is 900 lb/day. At the plant average flow of 10.5 MGD, the chlorine flow rate is approximately 350 lb/day or 10,500 lb/month. As required by The Ten States Standards, there are two active and one redundant chlorine feeders (500 lb/day each). The ratio of the peak flow chlorine flow rate (900 lb/day) to the minimum chlorine flow rate (174 lb/day) is about 5:1. Two chlorine cylinders are in on-line mode and two cylinders are in standby mode. As the set of on-line cylinders empty, the set of standby cylinders are brought on-line. There are 8 sets of one ton cylinder trunnions. Four full cylinders are on the trunions and four empty trunions are available for cylinder change out. The plant will have 6 one ton chlorine cylinders in storage (4 on trunnions, 2 standby on scales) in addition to the 2 active chlorine cylinders which combined will provide more than a months supply based on average flow. The ammonia dose for all alternatives is 1.00 mg/L assuming a 4:1 ratio of chlorine to ammonia. This will form predominantly (99%) monochloramine. At peak flow, the ammonia feed rate is 225 lb/day or 102 gal/day assuming a density of 7.48 lb/gal of 29.4% aqua ammonia. At average flow, the ammonia feed rate is 88 lb/day or 40 gal/day. The plant will have one 6,000 gal ammonia tank that will provide a supply of 150 days when full. The clearwell was sized to provide a theoretical contact time of 60 min at full capacity. At a peak flow of 26 MGD and 60 min contact time, the volume of the clearwell was determined to be 1,100,000 gal The dimensions of the clearwell are 150 ft L x 100 ft W with a maximum 10 ft water depth. Baffling walls are provided in the clearwell to prevent short circuiting of the flow. The water level in the clearwell varies between 5 ft and 10 ft. At least 5 ft (550,000 gallons) of water must be maintained in the clearwell in case of extended plant shutdown. This 5 ft of water is reserved for backwashing the media filters and microfiltration skids upon plant restart for Alternatives C and D.
Log Inactivation for the Chlorine/Chloramines System Log inactivation of Giardia and viruses by the chlorine/chloramines system were determined using EPA guidelines (2003). According to EPA (2003), chlorine contact time is based on the peak flow to the clearwell, the minimum water level in the clearwell and the clearwell baffling factor. The baffling walls in the clearwell are assumed to provide at least average baffling (baffling factor = 0.5) as defined by Appendix G of EPA (2003). Using a peak flow of 26 MGD, a minimum water level of 5 ft and a baffling factor of 0.5, the disinfectant contact time in the clearwell was determined to be 15 min. The CT using a 3 mg/L chlorine residual and a 15 min contact time was calculated to be 45 min-mg/L. The design temperature used is <0.5 oC which is conservative. A pipe heat transfer analysis would be required to more effectively predict the water temperature by the time it reaches the treatment plant.
24
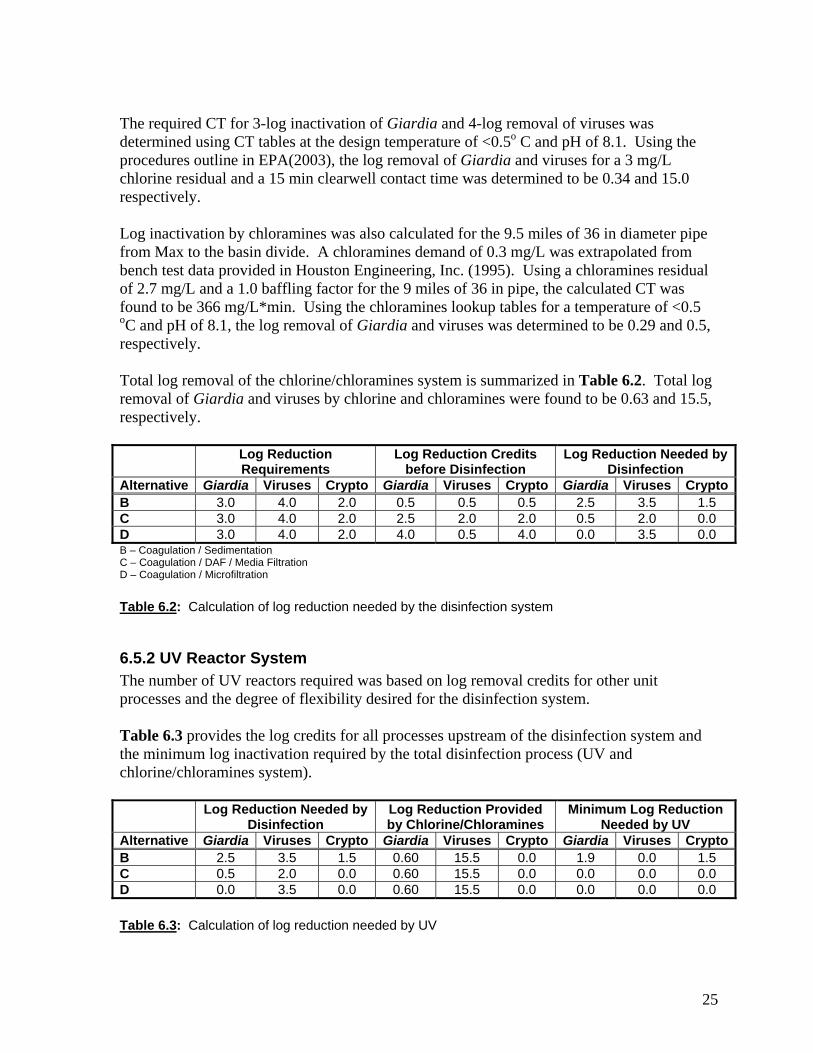
The required CT for 3-log inactivation of Giardia and 4-log removal of viruses was determined using CT tables at the design temperature of <0.5o C and pH of 8.1. Using the procedures outline in EPA(2003), the log removal of Giardia and viruses for a 3 mg/L chlorine residual and a 15 min clearwell contact time was determined to be 0.34 and 15.0 respectively. Log inactivation by chloramines was also calculated for the 9.5 miles of 36 in diameter pipe from Max to the basin divide. A chloramines demand of 0.3 mg/L was extrapolated from bench test data provided in Houston Engineering, Inc. (1995). Using a chloramines residual of 2.7 mg/L and a 1.0 baffling factor for the 9 miles of 36 in pipe, the calculated CT was found to be 366 mg/L*min. Using the chloramines lookup tables for a temperature of <0.5 oC and pH of 8.1, the log removal of Giardia and viruses was determined to be 0.29 and 0.5, respectively. Total log removal of the chlorine/chloramines system is summarized in Table 6.2. Total log removal of Giardia and viruses by chlorine and chloramines were found to be 0.63 and 15.5, respectively.
Log Reduction Requirements
Log Reduction Credits before Disinfection
Log Reduction Needed by Disinfection
Alternative Giardia Viruses Crypto Giardia Viruses Crypto Giardia Viruses CryptoB 3.0 4.0 2.0 0.5 0.5 0.5 2.5 3.5 1.5 C 3.0 4.0 2.0 2.5 2.0 2.0 0.5 2.0 0.0 D 3.0 4.0 2.0 4.0 0.5 4.0 0.0 3.5 0.0 B – Coagulation / Sedimentation C – Coagulation / DAF / Media Filtration D – Coagulation / Microfiltration Table 6.2: Calculation of log reduction needed by the disinfection system
6.5.2 UV Reactor System The number of UV reactors required was based on log removal credits for other unit processes and the degree of flexibility desired for the disinfection system. Table 6.3 provides the log credits for all processes upstream of the disinfection system and the minimum log inactivation required by the total disinfection process (UV and chlorine/chloramines system).
Log Reduction Needed by Disinfection
Log Reduction Provided by Chlorine/Chloramines
Minimum Log Reduction Needed by UV
Alternative Giardia Viruses Crypto Giardia Viruses Crypto Giardia Viruses CryptoB 2.5 3.5 1.5 0.60 15.5 0.0 1.9 0.0 1.5 C 0.5 2.0 0.0 0.60 15.5 0.0 0.0 0.0 0.0 D 0.0 3.5 0.0 0.60 15.5 0.0 0.0 0.0 0.0 Table 6.3: Calculation of log reduction needed by UV
25

The minimum log inactivation required by UV is given by the minimum log inactivation required by the total disinfection process minus the log inactivation provided by the chlorine/chloramines system. It was determined that Alternative B will require 2 active UV reactors (with 1 redundant) which provide a 3-log removal of both Giardia and Cryptosporidium. The 2 active UV reactors meet the minimum 1.9 log inactivation required for Giardia and 1.5 log inactivation required for Cryptosporidium for Alternative B (Table 6.3). In addition to meeting the minimum requirements, there is at least 1 additional log removal provided by the UV system for both Giardia and Cryptosporidium. This additional 1-log removal provides flexibility to lower chlorine dosages if desired and also provides a safety factor in the event future water quality requirement become more stringent. Alternatives C and D both have 1 active and 1 redundant UV reactor. The 1 active reactor provides 2-log inactivation of Giardia and Cryptosporidium. There are no minimum log inactivation requirements for the UV system in Alternatives C and D. Therefore, the UV system provides a safety factor and flexibility for the entire disinfection process. All three alternatives have 30 in diameter UV reactors containing 10 medium pressure lamps per reactor. The UV dosage per reactor is 24 mJ/cm2. Each UV reactor also requires a control panel.
6.6 Backwash and Sludge Processing
Waste Stream Sedimentation Process Backwash wastewater from the Alternative C media filters and the Alternative D second stage microfiltration skid is treated with packaged IPS units (Attachment C, Drawing 14). The IPS units contain a rapid mix tank, flocculation tank, IPS sedimentation basin, and sludge thickener tank. The percent solids of the thickened sludge are about 1 percent. Treated effluent from the IPS units are recycled back to the front of the water treatment plant. Sludge from the IPS units is pumped to the sludge storage tank next to the sludge dewatering building. Flow to the backwash waste sedimentation process for Alternative C is about 1.5 MGD (1,042 gpm). Alternative C requires 2 active and 1 redundant IPS units, each with a capcity of 0.75 MGD. A 380,000 gal concrete tank of dimensions 71 ft L x 71 ft W x 12 ft H (10 ft water depth) provides equalization of the backwash wastewater. The backwash wastewater is pumped to the IPS units by vertical turbine pumps. For Alternative D, backwash wastewater from the second stage microfiltration skid is estimated to be 55,000 gpd. In addition to the backwash flow, Alternative D also has 159,000 gpd of maintenance wash water. The sum of the backwash and maintenance wash water is 214,000 gpd. Alternative D requires 2 active and 1 redundant IPS units, each with a capacity of 0.1 MGD. A concrete tank of dimensions 71 ft L x 71 ft W x 12 ft H (10 ft water depth) provides equalization of the backwash waste and maintenance wash water.
26

Sludge Dewatering Process Sludge from Alternatives B, C, or D are dewatered at the Sludge Dewatering Building (Attachment C, Drawing 13). For Alternative B, sludge is generated by the main process flow IPS units. Sludge for Alternative C is produced by the DAF skimmings and also from the backwash waste IPS units. For Alternative D, sludge is generated by the backwash waste IPS units. Sludge for all alternatives is stored in a 80,000 gal cylindrical concrete tank (37 ft diameter, 12 ft high). The sludge is dewatered by a 73 gpm centrifuge (1 active, 1 redundant) located in the Sludge Dewatering Building. The dewatered sludge is conveyed from the centrifuge into a roll away bin via a screw conveyer. The centrate from the centrifuge is recycled to the front of the plant. The centrifuge equipment was sized using equations of dry sludge weight and wet sludge volume. Dry sludge weights were estimated from an equation provided by Kawamura (2000) for dry ferric chloride production rate. Dry Sludge Weight (lb/MGD) = (ferric chloride dose (mg/l) x (0.66 * 8.34)] + [raw water turbidity (ntu) x
1.3 x 8.34] where the ferric chloride dosage was 10 mg/L for Alternatives B , C and D. The raw water turbidity was taken to be 10 NTU for worse case water quality and 5 NTU for normal water quality. Wet sludge volume was taken from an equation by Metcalf and Eddy (1991): Wet Sludge Volume (ft3/day) = dry sludge weight (lb/day)
(sensity H2O x specific gravity of sludge x percent solids) where the density of water is 62.4 lb/ft3, the specific gravity of sludge was assumed to be 1.01, and the percent solids was assumed to be 1% for Alternatives B, C and D. Estimated dry weights and wet volumes of sludge for the three alternatives and for average and maximum turbidities were calculated. Maximum conditions were used for sizing the filter press while average conditions were used for operation, maintenance, and replacement (OM&R) purposes.
6.7 Site
The WTP site for each alternative is located east and next to U.S. Highway 83 and north of State Highway 53 near Max, North Dakota. This site was recently purchased by the State of North Dakota and offers simple, direct access and the potential for least impact in regard to visual and operational concerns for the surrounding community. This site also provides the necessary acreage for the facility access road, visitor parking, and suitable access to all treatment buildings, tanks, and equipment. The location considered for the WTP facility is shown in Attachment C, Drawings 1, 5 and 9.
Environmental and Aesthetics The WTP site is predominately an undisturbed natural flood plain grassland. Suitable soil from the plant structures, tanks, and process piping excavations will be disposed of on-site by
27

constructing naturally shaped berms around the facility service yard. These features will help reduce the visual impact of the water treatment plant superstructures and chain link fencing around the service yard. The berms will have gradual outside slopes of 6:1 to help blend them into the surrounding lands and will be reseeded with grass species now existing on site. All other areas of the service yard surrounding the buildings, equipment foundations or around buried tanks will include 6-inches of gravel surfacing.
Arrangement of Water Treatment Plant Site The WTP and associated process buildings and tanks for alternatives B, C, and D are arranged as shown on Drawings 1, 5 and 9, respectively. The arrangement of the structures provides for efficient hydraulic gravity flow from the existing intake piping through the treatment processes. The top of the concrete floor for the main WTP building for each alternative is at elevation 2103.0. The WTP and service yard are located and sized to provide access into and around the structures to facilitate all the anticipated operation and maintenance requirements for this facility. Based on each alternative, other features included within the service yard area are the equalization tank, clearwell, sludge handling building, sludge storage tank, backwash treatment building, electrical switchgear, flow measurement vaults, and engine generators. The service yard will include outdoor security lighting. The site is sloped to allow surface water drainage away from the structures. As previously described in section 6.0, the designs for Alternatives B, C, and D, are limited vertically by the grade of the installed pipeline. The resultant earthwork for the buried concrete tanks and interconnecting pipes and drains can be decreased if the entire plant could be raised 10 to 20 feet. Four feet of compacted free draining engineered fill is assumed under all structures at the current excavation depths. Included with this design was a brief investigation of the pipeline and this hydraulic limitation. Attachment I is documentation of a conversation the TSC had with two DIPRA regional engineers, Jeff Giddings and Allen Cox. This record describes their opinions on the effects of increased pressure on the pipeline. They concluded that the magnitude of added pressure (4 .3 to 8.6 psi) should not adversely affect the 36” DIP between the SCPP and the proposed WTP. Therefore, it is recommended that these site conditions including the types of pipe connections and flange ratings used at the SCPP be re-examined during final design of any of the three alternatives.
Access A paved access road was included between State Highway 53 and the WTP service yard (see Drawings 1, 5 and 9). Employee and visitor parking is provided outside of the main water treatment building. Access to the WTP service yard is secured with a 7 ft high chain link fence and 24 ft wide, double swing gates. The WTP service yard includes paved access roads with sufficient clearances around all structures for larger vehicles such as tractor-trailer rigs and mobile cranes. The service yard will also provide access and staging areas for personnel and vehicles during operation and maintenance activities at the facility. All paved access roads consist of a suitable graded road base material and 3 in bituminous pavement.
28

6.8 Treatment Building & Concrete Tanks
The treatment building houses the rapid mix, flocculation, sedimentation/DAF/media filters/microfiltration units, UV, chlorine / chloramines systems, and chemical storage. It also houses the control room, offices, laboratory, reception area, break room, restrooms, and equipment storage.
6.8.1 Structural Components
Plant Structure The foundation for the main WTP building consists of a reinforced cast in place concrete slab, trenches, walls, stem walls, and footings to accommodate the superstructure frame, water treatment equipment, equipment access, piping, offices and storage. The floor slab is sized to support a 500 lb/ft2 live load. Based on the condition of the existing soils, the treatment plant foundation must be placed upon 4 ft of compacted free draining engineered fill material. A geotechnical review including dewatering requirements is presented in Attachment H. The superstructure consists of a welded steel rigid frame that has been sized to provide a full building width span. The design for Alternative B eliminates the need for interior columns. The width of the buildings for Alternatives C and D are greater than Alternative B and will require interior columns. Each steel frame requires two interior columns located at one-third the span length from each end. The interior columns are not shown on the drawings and may require slight adjustments in the arrangement of water treatment foundation and equipment. The eave height of the superstructure is approximately 20 ft. The roof pitch is approximately 4:12 and the total height of the rigid frame at the peak is approximately 45 ft. The rigid frames are spaced at 20 ft center to center. A 20 ft wide platform is suspended from the center of the roof to provide area for HVAC equipment. A monorail hoist is provided and suspended from the rigid frames. Typical wide flange purlins are W10x26 and have been sized to provide the roof support system between rigid frames. All exterior and interior walls have been designed using concrete masonry units (CMU). All of these walls are designed as reinforced. All exterior walls and walls higher than 20 ft use a 12 in deep CMU and all interior walls that are 20 ft or less in height use an 8 in deep CMU. The roof of the structure consists of pre-insulated corrugated metal roof panels with a built-up roof system. 10 ft wide overhead doors have been provided for equipment access into and out of the building. No roof access hatches have been included in this estimate, but can be provided if required. Corrugated metal wall panels similar to the metal roof panels are included above the exterior walls at the gable ends of the building.
Buried Tanks The equalization tank, clearwell, sludge storage tank, and backwash equalization tank are all constructed with a reinforced concrete base slab, walls, interior columns and cover slab. The overall dimensions and elevations for the tanks are shown on the drawings (Attachment C, Drawings 2, 3, 6, 7, 10, 11, and 14).
29

Miscellaneous Structures The foundation for the backwash waste treatment building and the sludge handling building consists of a reinforced cast in place concrete slab, trenches, walls, stem walls, and footings to accommodate the pre-engineered metal building superstructure and equipment. The pre-engineered metal buildings include a 20 ft eave height and a 3:12 roof pitch with the base plan dimensions shown on the drawings. Similar to the main treatment plant building, these building foundations must be placed upon 4 ft of compacted free draining engineered fill material.
6.8.2 Heating and Ventilation Systems An energy cost analysis was performed for the two existing energy sources available for heat at the WTP site: propane & electric. Costs include both capital and energy costs for heating only (Table 6.4). The relatively small 13% difference allowed for a more qualitative decision on the energy source. The electric option was chosen to coincide with electric heat selected for Alternative A, the potential for renewable energy incorporation, and low maintenance. The propane option would have some operation and maintenance aspects associated with frequent propane truck deliveries. Since overall heating costs are substantial in the cold North Dakota climate more detailed designs should investigate a variety of renewable energy sources that might reduce energy costs and reduce the environmental impact. Such systems would include passive and active solar, ground source heat pump heating/cooling, and wind energy. A more detailed summary of the energy cost analysis can be found in Attachment D.
Principal Yearly Principal
Payment Energy Cost
per year Total Cost per Year
Electric $1,035,000 $67,328 $525,639 $592,967 Propane $1,250,000 $81,314 $434,206 $515,520 Cost Difference $ 77,447 13%
Table 6.4: Electric and propane heating costs
6.8.3 Auxiliary Mechanical Equipment and Systems The auxiliary mechanical systems for the WTP and associated structures consist of a gravity drainage system, building interior domestic water and sanitary waste system, fire suppression system, portable compressed air system and an auxiliary backup electrical power engine generator system. Hoisting and workshop/machine shop equipment is also provided for the repair and maintenance of facility components. The gravity drainage pipe system consists of floor drains in the restrooms and interior floor areas of the water treatment plant and auxiliary structures where water leakage from equipment can be expected. Sloped cast iron hub and spigot soil pipe will collect waste water from the floor drains and convey the water by gravity to the sanitary waste system.
30

A domestic and sanitary waste plumbing system is provided for the men’s and women’s restrooms in accordance with the International Plumbing Code and state and local regulations. The various laboratories are provided with a plumbing system that consists of the required water supply fixtures and disposal waste product collection equipment. The fire suppression system in the WTP consists of portable, multi-purpose, wall-mounted, dry chemical fire extinguishers and a wet pipe sprinkler system to extinguish fires in flammable materials and equipment in the interior of the plant. An automatic clean agent gas, life sustaining, fire extinguishing system is provided in the control room. Water of a sufficient pressure and quantity for fire suppression is available from North Prairie Rural Water which eliminates the need for a fire pump to be installed. However, the water line yard pipe is not included in the cost estimates of the alternatives. Monorail hoists of various capacities within the main treatment building and auxiliary structures are provided for maintenance and replacement of equipment and devices in the flocculation, sedimentation, media filtration, microfiltration, and chlorine storage areas. The workshop is supplied with a drill press, pedestal grinder, welder, hydraulic press, belt/disk sander, metal band saws and a milling machine in addition to work benches and storage cabinets for the maintenance and repair of process and building equipment and components. A portable compressed air system is provided for the interior of the pumping plant. The system consists of a wheeled 10 ft3/min air compressor operating at 125 lb/in2 with a 20 gallon receiver tank and flexible air hose for use by plant personnel in the use of pneumatic tools and other maintenance activities. Weatherproof engine generator equipment is located on the exterior of the main treatment building to provide auxiliary backup electrical power for the control room SCADA system, building fire suppression system, portions of the building heating, ventilating and lighting systems (including hazardous chemicals ventilation equipment) and other essential building equipment in the event of primary power failure. There are two engine generators provided, one on each end of the main treatment building along with a fuel storage tank for each. Each 75 kW engine generator is propane fueled and supplied from a 250 gal propane storage tank equipped with the required pressure reducing and regulating valves and cold weather vaporization equipment. A full 250 gal propane storage tank should operate an engine generator for at least 12 hours. Two smaller propane fueled engine generator sets for each main treatment building alternative were selected versus one larger diesel fueled, 150 kW, engine generator due to the size of the various electrical supply cables, cold weather fuel problems, specific engine generator usage requirements, auxiliary building locations and the large size of the main treatment building. Further study of the auxiliary power system should be made during final design after a specific alternative is selected to see if one larger engine generator in lieu of two smaller engine generators would be more appropriate.
31

6.8.4 Electrical Equipment Incoming Power and Unit Substation: Incoming power from the local utility is from a transformer outside of the facility. It is assumed that a non-segregated-phase bus is used to bring the power from the transformer to the switchgear being provided as part of this facility. The switchgear will include four transformers which will convert the voltage from 4,160 volts to 480 volts. Four transformers are used to minimize the current supplied to each section of the facility. The switchgear also includes 480-volt circuit breakers. Non-segregated phase bus will also be used from the switchgear to the power distribution panels. HVAC Power Distribution Panels: There are six 480-volt distribution panels provided which will service plant HVAC loads. Each HVAC panel is rated for 1,200 amps load at 480 volts and has secondary breakers which will feed individual HVAC equipment in the plant. Each panel is provided power through 1,200 ampere non-segregated phase bus which originates from the secondary section of a unit substation. Main Plant 480 Volt Power Distribution Panel: There is one main plant 480-volt distribution panel which services all plant loads associated with the process and other station service loads. The 480 volt main plant distribution panel services motor control center loads, air compressor systems, 750 kVA station service transformer, centrifuge skid, UV reactor skids, and other plant loads. The 750 kVA station service transformer transforms 480 volts down to 120/208 volts which is provided to various panelboards which service lighting, receptacles and other low voltage plant loads. 600-Volt Motor Control Centers: A 600 volt motor control center is utilized for the starting sludge motors, forwarding motors, and drain forwarding motors. Another 600 volt motor control center is utilized for the starting the fixed or variable frequency drive (VFD) rapid mixer tank motors and fixed or VFD flocculation motors. The motor control centers contain the standard equipment, including draw out fuses, starters, control power transformers, selector switches, pushbuttons, and all unit protective and control devices for operating the motors in the plant. Non-segregated Phase Bus: Non-segregated phase bus rated 480 volts, 1,200 ampere will transmit power from the outgoing sections of various unit substations provided at the plant to the six HVAC distribution panels and the main plant distribution panel. Plant Control: A programmable logic controller is installed in the control room. This device will monitor the flow meters, filtration system, dissolved air floatation system, IPS treatment, and sludge handling. Fire Detection and Alarm: A design was not performed for this, but the devices and cabling were included in the cost estimate. Lighting Systems: The lighting systems provides general and task illumination in the plant process area and the plant office areas. Convenience 120 volt receptacles have been provided throughout the plant to facilitate routine inspection, maintenance, and operation.
32

Ground fault circuit interrupter type receptacles are provided in damp areas and for exterior receptacles.
6.9 Sustainability – Energy & Environment
Sustainability from an energy and environmental perspective is incorporated into the design of each of the alternatives. Sustainable practices do not necessarily cost more, and may save costs in the long term. It is the intention to take both a local and global perspective when incorporating sustainability. Many features that would incorporate sustainable building and process practices are part of more detailed designs. However, appraisal designs incorporate some sustainability components.
Energy Sustainable energy involves reducing energy use and use of renewable energy supplies. It incorporates natural lighting. The net benefit is typically lower OM&R costs and lower lifecycle costs. Lower energy use typically reduces environmental impacts. Energy Reduction The process uses a gravity flow scenario that minimizes the number of pumps needed. There is an initial higher cost of more excavation, but this is considered a reasonable trade off for the energy and maintenance benefits. Outside tanks are partially or fully buried to prevent the need for heating for freeze protection. The building walls are insulated with R-18 and the ceilings with R-35 to reduce heat loss. The main process area is heated only to minimal levels with spot heaters in place that allow for increased heat use only where needed while working on processes.
Renewable Energy The building incorporates a solar wall and a heat exchanger to preheat the incoming ventilation air in the winter. Other aspects such as natural lighting, solar, wind and geothermal energy will be incorporated into future designs.
Environment Sustainable environment focuses on waste reduction, recycling, use of less chemicals that are toxic, minimized transportation, and minimized emissions.
Chemical Use The coagulation chemicals are non-hazardous. Disinfection is a balance between UV that requires electrical energy and chlorine gas which is toxic, requires energy to produce, and involves transportation. In addition there are some inactivation capabilities that are better suited to UV. The majority of the disinfection is handled by the UV system which has more potential for renewable energy use at a reasonable cost. The chemical use will be optimized once the WTP is online.
33

Transportation Minimization The dewatered backwash waste roll-off container was sized for shipment at full truck capacity to minimize the amount of trips required to the landfill. Chlorine storage allows for a full truckload of chlorine to be unloaded each trip.
34

35

7.0 Costs
7.1 Cost Assumptions
The Appraisal level cost estimates prepared for this report were generated using industry-wide accepted cost estimate methodology, standards and practices. Appraisal level cost estimates, which are intended for planning and preliminary budgetary purposes, are typically developed from approximate quantities, existing design data, preliminary general designs and drawings.
Pricing sources include manufacturer’s quotes and catalog list prices, published cost estimating guides, such as RSMeans, and Reclamation’s historical costs databases and cost curves. The prices derived from historical data were indexed to January 2007 values using the Reclamation Construction Cost Trends as a basis. Labor rates were assumed to meet or exceed minimum values published in the most recent Davis-Bacon decision for the construction area.
It is assumed that the contract will be issued under full and open bidding conditions and that it will be awarded to a civil construction firm (prime contractor) with subcontractors utilized for electrical, mechanical and other specialty work. For these items, appropriate prime contractor overhead and profit mark-ups were added.
Appraisal cost estimates are often utilized to determine whether more detailed investigations of the project are justified. Appraisal cost estimates are not suitable for requesting authorization or construction fund appropriations from Congress. These estimates are normally used as an aid in selecting the most economical plan by comparing alternative features such as intake locations, pipeline routes, treatment plant types, etc. Costs presented are broken down into the following categories and are computed in the order presented:
• Vendor Costs • Installation • Installed Cost • Mobilization (5%) • Unlisted (10%) • Contract Cost • Contingencies (21%) • Field Cost • Non-Contract Costs (25%) • Construction Cost
These costs factors and assumptions are described in detail in Attachment E.
36

As discussed in section 6.7, the hydraulic limitation recommended by MWH should be re-evaluated in final design, since the earthwork quantities are significant on all alternatives, an increase in elevation may substantially reduce construction costs. Operation, maintenance, and replacement costs unit costs were obtained from various sources including chemical costs from a local chemical supplier (Table 7.1).
1 (Hawkins, 2006) – Delivered cost to Max, ND
Item Cost Units Source Coagulant – FeCl3 $1.47 per gal Hawkins 1 Polymer $8.59 per gal Hawkins 1 Chlorine gas $670.00 per 1 ton cylinder Hawkins 1 Ammonia – Liquid $1.27 per gal Hawkins 1 Centrifuge Polymer $11.60 per gal Siemens Primary MF Cleaning Chem. $0.015 per 1000 gal produced Siemens/Memcor Secondary MF Cleaning Chem. $0.001 per 1000 gal produced Siemens/Memcor MF Membrane replacement costs (14.3% per year) $34,760 per year Siemens/Memcor
Rapid Mixers $30,000 ea (every 10 years) Chemineer First Stage Flocculators $22,460 ea (every 10 years) Chemineer Second Stage Flocculators $14,568 ea (every 10 years) Chemineer Third Stage Flocculators $14,568 ea (every 10 years) Chemineer UV Replacement Lamps $509 ea (18 per year) Trojan Chemical Metering Pumps $2,700 ea (every 10 years) municipaltreatment.com Ammonia Metering Pumps $18,800 ea (every 10 years) municipaltreatment.com Filter Media $200,000 all media Leopold Employee – Supervisor $100,000 per year TSC 8230 – Operator $80,000 per year TSC 8230 – Chemist (1/2 time) $40,000 per year TSC 8230 – Secretary (1/2 time) $25,000 per year TSC 8230 Electricity – Peak Demand Charge $10.79 peak KW per month Electric Service report 2 – Energy Charge $0.025179 per KW-hr used Electric Service report 2 – Monthly Service Charge $250 per month Electric Service report 2
2 (Houston Engineering and Montgomery Watson, 2005) Table 7.1: OM&R cost assumptions
37

7.2 Cost Results
The results of the detailed Appraisal designs are shown in Tables 7.2 and 7.3.
Alternative Contract
Cost Construction
Cost A - - B $41,000,000 $62,000,000C $45,000,000 $69,000,000D $56,000,000 $85,000,000
A – Chlorination B – Coagulation / Sedimentation C – Coagulation / DAF / Media Filtration D – Coagulation / Microfiltration Table 7.2: Summary of capital costs Alternative Cost per Year Cost per 1000 gal
A - - B $1,653,000 $0.43C $1,661,000 $0.43D $1,948,000 $0.51
Table 7.3: Summary of OM&R costs A detailed breakdown of costs are presented in Attachment F. Life cycle costs for the WTP facilities are not part of this report, but are useful as a check against other existing water treatment plants. This cost using a 6% interest rate, a conservative 25 year life, and adding in OM&R costs are, $1.70, $1.84, and $2.24 per 1000 gal produced for Alternatives B, C, and D, respectively.
38

39

8.0 References Arman Engineering (2003, July 15), A Geotechnical Evaluation Report for Houston
Engineering, Inc., Proposed Booster Pump Station/Pretreatment Facility, Max, ND.
Clancy, Jennifer L, Zia Bukhari, Thomas M. Hargy, et al. “Using UV to Inactivate Cryptosporidium”. Jour. AWWA. September 2000.
Houston Engineering (1995), North Dakota State Water Commission and the Garrison Division Conservancy District, Northwest Area Water Supply Project Chloramine Challenge Study Final Report, Houston Engineering, American Engineering, Montgomery Watson, December 1995.
Houston Engineering and Montgomery Watson (2003), North Dakota State Water
Commission and the Garrison Division Conservancy District, Northwest Area Water Supply Project Pretreatment System Predesign Evaluation. 2003.
Houston Engineering and Montgomery Watson (2005), North Dakota State Water
Commission and the Garrison Division Conservancy District, Northwest Area Water Supply Project Electric Service Evaluation. 2005.
Kawamura, S. (2000), Integrated Design and Operation of Water Treatment Facilities,
Second Edition, J. Wiley and Sons Publishing. Metcalf and Eddy (1991), Wastewater Engineering, Treatment, Disposal Reuse, McGraw-
Hill, 1991. Montgomery Watson Harza (2003, February 24), North Dakota State Water Commission and
the Garrison Division Conservancy District, Northwest Area Water Supply Project Pretreatment System Predesign Evaluation. [Technical Memorandum].
NDDOH. Chapter 33-16-02.1, “Standards of Quality for Waters of the State”.. http://www.state.nd.us/lr/information/acdata/pdf/33-16-02.1.pdf
Pilutti, Michael and Nemeth, Julia (2003), Technical and Cost Review of Commercially Available MF/UF Membrane Products, International Desalination Association BAH03-029.
Recommended Standards For Water Works, 2003 Edition, Policies for the Review and Approval of Plans and Specifications for Public Water Supplies, A Report of the Water Supply Committee of the Great Lakes--Upper Mississippi River Board of State and Provincial Public Health and Environmental Managers, MEMBER STATES AND PROVINCE Illinois Indiana Iowa Michigan Minnesota Missouri New York Ohio Ontario Pennsylvania Wisconsin.
40

Seimens(2006), Max. ND – NAWS (Northwest Area Water Supply) Quote Number
07PS5039CMM & 07PS5040CMM, Seimens Water Technology, Memo dated November 3, 2006
Tchobanoglous, G., Burton, F. (1991), Wastewater Engineering, Treatment Disposal Reuse, Third Edition, Metcalf and Eddy, Inc., Irwin/McGraw Hill Publishing.
Tornes, Lan H. “Quality of Streams in the Red River of the North Basin, Minnesota, North Dakota, and South Dakota”. USGS draft report, 2004.
41

Attachments
42

Attachment A:Water Quality DataLast Update: 09/10/06 1990 - 2003
Lake SakakaweaUsed for
WTP DesignUsed for
WTP O&M
pH - - - 6.5 - 8.5 8.1 (7.1- 8.8) 8.1 8.1 Affects coagulation, DBPs, etc. -
Temperature oC - - - 10.8 (0.1 - 23.0) 0.1 10.8 Affects coagulation, DBPs, disinfection credit, etc -
Conductivity μmhos/cm - - - 500 - 810 * 810 700 Correlates to TDS -
TSS mg/L - - - Affects filter fouling, possible pathogen sites Total suspended solids
TDS (dissolved = 0.45 um) mg/L - - 500 470 (342 - 805) 805 470 Affects coagulation Total Dissolved Solids (Inorganic salts, mainly: Ca 2+, Mg2+, Na+, K+, Cl-, HCO2, CO32-, SO42-, NO3-, + some dissolved organic matter)
Alkalinity (total) [as CaCO3] mg/L - - - 183 (144 - 305) 305 183 Affects coagulation Sum of HCO3-, CO3
2-, OH-, H+
Carbonate (CO3-2) mg/L - - - Affects coagulation -
Bicarbonate (HCO3-) mg/L - - - Affects coagulation -
Hardness (total) [as CaCO3] mg/L - - - 170 - 260 * 260 220 Affects coagulation, aesthetic property, scaling Sum of all multivalent metallic cations. Mainly Ca 2+ & Mg2+. Also Fe2+, Mn2+,Al3+, etc. <75 = soft, 75 - 150 = moderately hard, 150 - 300 = hard, >300 = very hard
DOC (dissolved = 0.45 um) mg/L - - - Indicator of pathogen removal, DBP formation, filter efficiency, etc. Dissolved organic carbon
TOC mg/L - - - 3.6 (5.5 - 3.3) 5.5 3.6 Indicator of pathogen removal, DBP formation, filter efficiency, etc. Total organic carbon
UV254 1/cm - - - Indicator of DOC type and DBP formation UV absorbance at 254 nm
Color color units - - 15 General indicator of Iron and/or organic content, aesthetic requirement -
Odor TON - - 3 Aesthetic property -
Foaming Agents mg/L - - 0.5 -
Corrosivity - - - non corr. Infrastructure effects distribution system deterioration) -
Chemical Oxygen Demand (COD) mg/L - - - -
Silica (SiO2) (total) mg/L - - - Causing permanent fouling of membranes -
Silica (SiO2) (reactive) mg/L - - - Causing permanent fouling of membranes -
Silica (SiO2) (dissolved) mg/L - - - Causing permanent fouling of membranes -
Silt Density Index (SDI) - - - - Indicator of membrane fouling potential in ####### membranes -
Oxygen (O2) mg/L - - - -
Ammonia (NH3) mg/L - - - 0.14 (0.02 - 0.33) 0.33 0.14
Carbon Dioxide (CO2) mg/L - - - -
Hydrogen Sulfide (H2S) mg/L - - - -
Iron (Fe) mg/L - - 0.3 Aesthetic property (taste, staining of fixtures) -
Manganese (Mn) mg/L - - 0.05 0.07 0.04 Aesthetic property (taste, staining of clothes), possible health effects -
Phosphorous (total) (P) mg/L - - - Sum of orthophosphate, polyphosphate, organic phosphate
Ammonium (NH4+) mg/L -
Aluminum (Al+3) mg/L - - 0.05 to 0.2 30 -
Boron (B) mg/L
Calcium (Ca+2) mg/L - - - 54 (44-84) 84 54 Affects coagulation, aesthetic property, scaling -
Magnesium (Mg+2) mg/L - - - 23 (18 - 35) 35 23 Affects coagulation, aesthetic property, scaling -
Iron (Fe+2) mg/L - - - Aesthetic property (taste, staining of fixtures) -
Manganese (Mn+2) mg/L - - - Aesthetic property (taste, staining of clothes), possible health effects -
Nickel (Ni) mg/L - - - Potential Health effects (nervous system, liver, hear, dermal), formerly regulated -
Phosphorous (total) (P) mg/L - - - Sum of orthophosphate, polyphosphate, organic phosphate
Potassium (K+) mg/L - - - 4.4 (2.4 - 7.1) 7.1 4.4 -
Silver (Ag) mg/L - - 0.10 -
Sodium (Na+) mg/L - - - 69 (25 - 160) 160 69 Aesthetic property (taste) -
Strontium (Sr+2) mg/L - - - -
Zinc (Zn+2) mg/L - - 5 Aesthetic property (taste) -
Bromide (Br-) mg/L - - - Effects brominated DBP formation -
Chloride (Cl-) mg/L - - 250 11 (7 - 16) 16 11 -
Orthophosphate (PO4-3) mg/L - - - 0.03 (0.01 - 0.14) 0.14 0.03 Indicator of nutrients in lake PO4
3-, HPO42-, H2PO4
-, H3PO4
Sulfate (SO4-2) mg/L - - 250 199 (128 - 341) 341 199 Aesthetic property (taste), health effects (laxative) -
Sulfide mg/L - - - -
Sampling Date
Sampling Location (
diss
olve
d - 0
.45
um)
Cat
ions
tota
lG
ener
alD
isso
lved
G
ases
(di
ssol
ved
- 0.4
5 um
)
Unr
egul
ated
Con
stitu
ents
Ani
ons
Definition - NotesReason for SamplingWQ
Type Parameter Units MCLSecondary
LimitMCLG

Last Update: 09/10/06 1990 - 2003
Lake SakakaweaUsed for
WTP DesignUsed for
WTP O&M
Sampling Date
Sampling Location
Antimony (Sb) mg/L 0.006 0.006 - Health effects (decreased longevity, blood) -
Arsenic (As) mg/L 0.01 0 - Health effects (carcinogen, cardio, dermal) -
As+5 (arsenate) mg/L - - - Health effects (carcinogen, cardio, dermal), more treatable form of arsenic
As+3 (arsenite) mg/L - - - Health effects (carcinogen, cardio, dermal), greater carcinogen, more difficult to treat
Asbestos MFL 7 7 - Health effects (benign intestinal polyps) -
Barium (Ba) mg/L 2 2 - Health effects (circulatory, gastrointestinal) -
Beryillium (Be) mg/L 0.004 0.004 - Health effects (carcinogen, bone, lung) -
Cadmium (Cd) mg/L 0.005 0.005 - Health effects (liver, kidney, bone, circulatory) -
Chromium (total) (Cr) mg/L 0.1 0.1 - Health effects (liver, kidney, circulatory) -
Chromium VI mg/L - - -
Copper (Cu) mg/L 1.3 A,8 1.3 1.0 Health effects (gastrointestinal, liver, kidney) -
Cyanide (free) (CN-) mg/L 0.2 0.2 - Health effects (thyroid, nervous system) -
Fluoride (F-) mg/L 4.0 4.0 2.0 Health effects (skeletal), Beneficial for teeth (below a certain level) -
Lead (Pb) mg/L 0.015 A,8 0 - Health effects (carcinogen, kidney, nervous system) -
Mercury (inorganic) (Hg) mg/L 0.002 0.002 - Health effects (kidney) -
Nitrate (NO-3) (as N) mg/L 10 10 - 0.1 (0.1 - 0.3) 0.3 0.1 Health effects in infants (cynanosis) -
Nitrite (NO-2) (as N) mg/L 1 1 - ND = 0.02 (ND - 0.02) 0 0 Health effects in infants (cynanosis), Indicator of nutrients in lake -
Selenium (Se) mg/L 0.05 0.05 - Health effects (nervous system, kidney, liver, circulatory) -
Se+4 mg/L
Se+6 mg/L
Thallium (Tl) mg/L 0.002 0.0005 - Health effects (kidney, liver, brain, gastrointestinal) -
Combined Radium (Ra-226 & Ra-228) pCi/L 5 7 0 - Health effects (carcinogen) -
Gross Alpha (excluding Ra & U) pCi/L 15 7 0 - Health effects (carcinogen) -
Beta Particle & Photon Emitters mrem/year 4 7,10 0 - Health effects (carcinogen) -
Uranium g/L / pCi/L 30 / 20 0 - Health effects (carcinogen, kidney) -
Turbidity NTU 0.3 3 - - 0.2 - 10 * 10 5 Indicator of pathgen removal, filter efficiency -
Particle Counts - - - Indicator of pathgen removal, filter efficiency -
Cryptosporidium % reduction 99 3 100 - Regulated Pathogen -
Giardia % reduction 99.9 3 100 - Regulated Pathogen -
Viruses % reduction 99.99 3 100 - Regulated Pathogen
Heterotrophic Plate Count Colonies/L 500 3 - - Indicator of the variety of bacteria -
Total Coliforms (incl fecal colif. & E.Coli) positive 5% 4 0 - Indicator of the potentially harmful bacteria -
A = action levelMFL = million fibers per literTON = threshold odor number# (# - #) = average or median value (minimum value - maximum value)
Calculated ParametersLSI mg/L - - Indication of membrane CaCO3 scaling potential, more accurate than Stiff & Davis for fresh water Finished water LSI should be ~ +0.2 to 0.3 so obtain a little scale on pipes in distribution system
Stiff & Davis mg/L - - Indication of membrane particulate fouling potential, more accurate than LSI for seawater
Footnote# Footnote
Maximum Contaminant Level (MCL) - The highest level of a contaminant that is allowed in drinking water. MCLs are set as close to MCLGs as feasible using the best available treatment technology and taking cost into consideration. MCLs are enforceable standards.Maximum Contaminant Level Goal (MCLG) - The level of a contaminant in drinking water below which there is no known or expected risk to health. MCLGs allow for a margin of safety and are non-enforceable public health goals.Maximum Residual Disinfectant Level (MRDL) - The highest level of a disinfectant allowed in drinking water. There is convincing evidence that addition of a disinfectant is necessary for control of microbial contaminants.Maximum Residual Disinfectant Level Goal (MRDLG) - The level of a drinking water disinfectant below which there is no known or expected risk to health. MRDLGs do not reflect the benefits of the use of disinfectants to control microbial contaminants.Treatment Technique - A required process intended to reduce the level of a contaminant in drinking water.
2 Units are in milligrams per liter (mg/L) unless otherwise noted. Milligrams per liter are equivalent to parts per million.EPA's surface water treatment rules require systems using surface water or ground water under the direct influence of surface water to (1) disinfect their water, and (2) filter their water or meet criteria for avoiding filtration so that the following contaminants are controlled at the following levels:Cryptosporidium (as of1/1/02 for systems serving >10,000 and 1/14/05 for systems serving <10,000) 99% removal.Giardia lamblia: 99.9% removal/inactivationViruses: 99.99% removal/inactivationLegionella: No limit, but EPA believes that if Giardia and viruses are removed/inactivated, Legionella will also be controlled.Turbidity: As of January 1, 2002, turbidity may never exceed 1 NTU, and must not exceed 0.3 NTU in 95% of daily samples in any month. Previous rule: At no time can turbidity (cloudiness of water) go above 5 nephelolometric turbidity units (NTU); systems that filter must ensure that the turbidity go no higher than 1 NTU (0.5 NTU for conventional or direct filtration) in at least 95% of the daily samples in any month.HPC: No more than 500 bacterial colonies per milliliter.Long Term 1 Enhanced Surface Water Treatment (Effective Date: January 14, 2005); Surface water systems or (GWUDI) systems serving fewer than 10,000 people must comply with the applicable Long Term 1 Enhanced Surface Water Treatment Rule provisions (e.g. turbidity standards, individual filter monitoring, Cryptosporidium removal requirements, updated watershed control requirements for unfiltered systems).Filter Backwash Recycling; The Filter Backwash Recycling Rule requires systems that recycle to return specific recycle flows through all processes of the system's existing conventional or direct filtration system or at an alternate location approved by the state.
4 more than 5.0% samples total coliform-positive in a month. (For water systems that collect fewer than 40 routine samples per month, no more than one sample can be total coliform-positive per month.) Every sample that has total coliform must be analyzed for either fecal coliforms or E. coli if two consecutive TC-positive samples, and one is also positive for E.coli fecal coliforms, system has an acute MCL violation.5 Fecal coliform and E. coli are bacteria whose presence indicates that the water may be contaminated with human or animal wastes. Disease-causing microbes (pathogens) in these wastes can cause diarrhea, cramps, nausea, headaches, or other symptoms. These pathogens may pose a special health risk for infants, young children, and people with severely compromised immune systems.
Although there is no collective MCLG for this contaminant group, there are individual MCLGs for some of the individual contaminants:Trihalomethanes: bromodichloromethane (zero); bromoform (zero); dibromochloromethane (0.06 mg/L). Chloroform is regulated with this group but has no MCLG.Haloacetic acids: dichloroacetic acid (zero); trichloroacetic acid (0.3 mg/L). Monochloroacetic acid, bromoacetic acid, and dibromoacetic acid are regulated with this group but have no MCLGs.
7 MCLGs were not established before the 1986 Amendments to the Safe Drinking Water Act. Therefore, there is no MCLG for this contaminant.8 Lead and copper are regulated by a Treatment Technique that requires systems to control the corrosiveness of their water. If more than 10% of tap water samples exceed the action level, water systems must take additional steps. For copper, the action level is 1.3 mg/L, and for lead is 0.015 mg/L.
Each water system must certify, in writing, to the state (using third-party or manufacturer's certification) that when acrylamide and epichlorohydrin are used in drinking water systems, the combination (or product) of dose and monomer level does not exceed the levels specified, as follows:Acrylamide = 0.05% dosed at 1 mg/L (or equivalent)9
1
3
6
Rad
ionu
clid
es
Reg
ulat
ed P
rimar
y C
onta
min
ants
Bio
logi
cal &
Fou
ling
Pote
ntia
lIn
orga
nic
(dis
solv
ed -
0.45
um
)

Last Update: 09/10/06 1990 - 2003
Lake SakakaweaUsed for
WTP DesignUsed for
WTP O&M
Sampling Date
Sampling Location
Epichlorohydrin = 0.01% dosed at 20 mg/L (or equivalent)10 4 mrem/year is limit (a dose) which is approximated by 50 piC/L (an activity)11 USGS data sporadic over sampling period with some parameters sampled more than others* data obtained directly from report "Design Criteria, Red River Valley Water Supply Project, Needs and Options Study Element" by MWH Aprill 2004** 2000 - 2004 USGS data
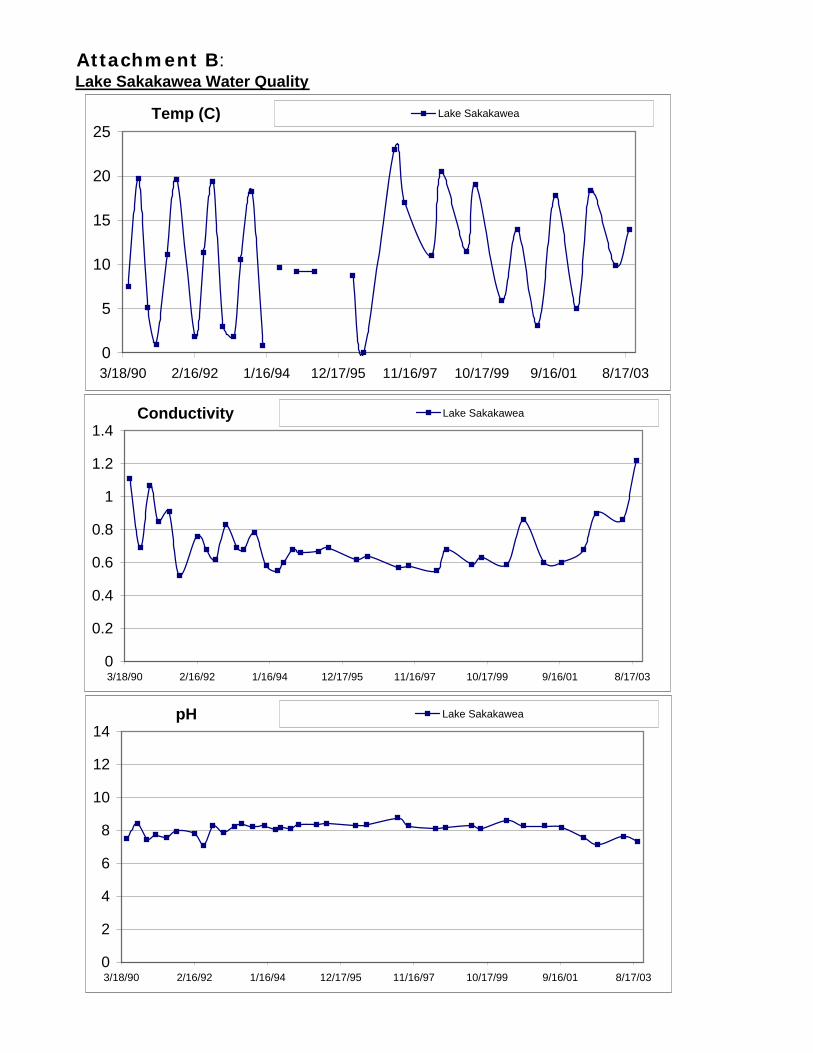
Attachment B:Lake Sakakawea Water Quality
Temp (C)
0
5
10
15
20
25
3/18/90 2/16/92 1/16/94 12/17/95 11/16/97 10/17/99 9/16/01 8/17/03
Lake Sakakawea
Conductivity
0
0.2
0.4
0.6
0.8
1
1.2
1.4
3/18/90 2/16/92 1/16/94 12/17/95 11/16/97 10/17/99 9/16/01 8/17/03
Lake Sakakawea
pH
0
2
4
6
8
10
12
14
3/18/90 2/16/92 1/16/94 12/17/95 11/16/97 10/17/99 9/16/01 8/17/03
Lake Sakakawea

SO4 (mg/L)
0
50
100
150
200
250
300
350
400
3/18/90 2/16/92 1/16/94 12/17/95 11/16/97 10/17/99 9/16/01 8/17/03
Lake Sakakawea
Cl (mg/L)
0
2
4
6
8
10
12
14
16
18
3/18/90 2/16/92 1/16/94 12/17/95 11/16/97 10/17/99 9/16/01 8/17/03
Lake Sakakawea
Alk. (mg/L as CaCO3)
0
50
100
150
200
250
300
350
3/18/90 2/16/92 1/16/94 12/17/95 11/16/97 10/17/99 9/16/01 8/17/03
Lake Sakakawea
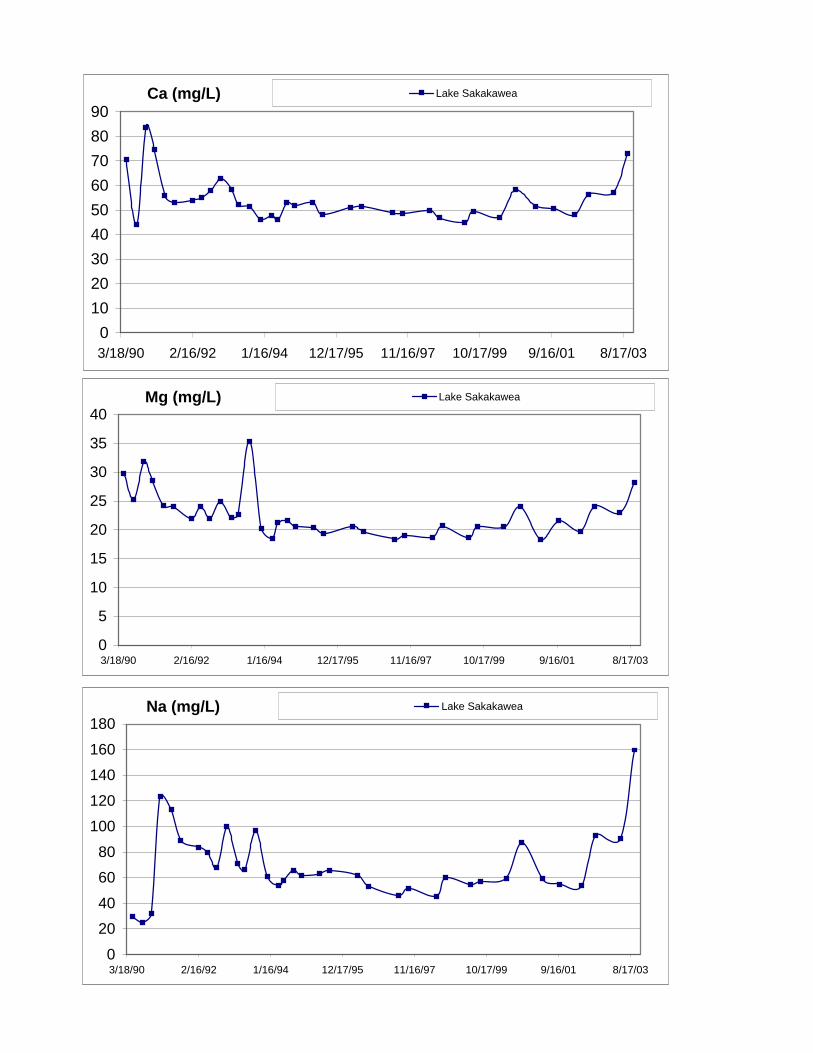
Ca (mg/L)
0102030405060708090
3/18/90 2/16/92 1/16/94 12/17/95 11/16/97 10/17/99 9/16/01 8/17/03
Lake Sakakawea
Mg (mg/L)
0
5
10
15
20
25
30
35
40
3/18/90 2/16/92 1/16/94 12/17/95 11/16/97 10/17/99 9/16/01 8/17/03
Lake Sakakawea
Na (mg/L)
0
20
40
60
80
100
120
140
160
180
3/18/90 2/16/92 1/16/94 12/17/95 11/16/97 10/17/99 9/16/01 8/17/03
Lake Sakakawea

K (mg/L)
0
1
2
3
4
5
6
7
8
3/18/90 2/16/92 1/16/94 12/17/95 11/16/97 10/17/99 9/16/01 8/17/03
Lake Sakakawea
NO2 (mg/L as N)
-0.005
0
0.005
0.01
0.015
0.02
0.025
3/18/90 2/16/92 1/16/94 12/17/95 11/16/97 10/17/99 9/16/01 8/17/03
Lake Sakakawea
NO3 (mg/L as N)
-0.05
0
0.05
0.1
0.15
0.2
0.25
0.3
0.35
3/18/90 2/16/92 1/16/94 12/17/95 11/16/97 10/17/99 9/16/01 8/17/03
Lake Sakakawea

NH3 (mg/L as N)
0
0.05
0.1
0.15
0.2
0.25
0.3
0.35
3/18/90 2/16/92 1/16/94 12/17/95 11/16/97 10/17/99 9/16/01 8/17/03
Lake Sakakawea
PO4 (mg/L as P)
0
0.02
0.04
0.06
0.08
0.1
0.12
0.14
0.16
3/18/90 2/16/92 1/16/94 12/17/95 11/16/97 10/17/99 9/16/01 8/17/03
Lake Sakakawea
TDS (mg/L)
0
100
200
300
400
500
600
700
800
900
3/18/90 2/16/92 1/16/94 12/17/95 11/16/97 10/17/99 9/16/01 8/17/03
Lake Sakakawea
Secondary Standard

Attachment C Drawings


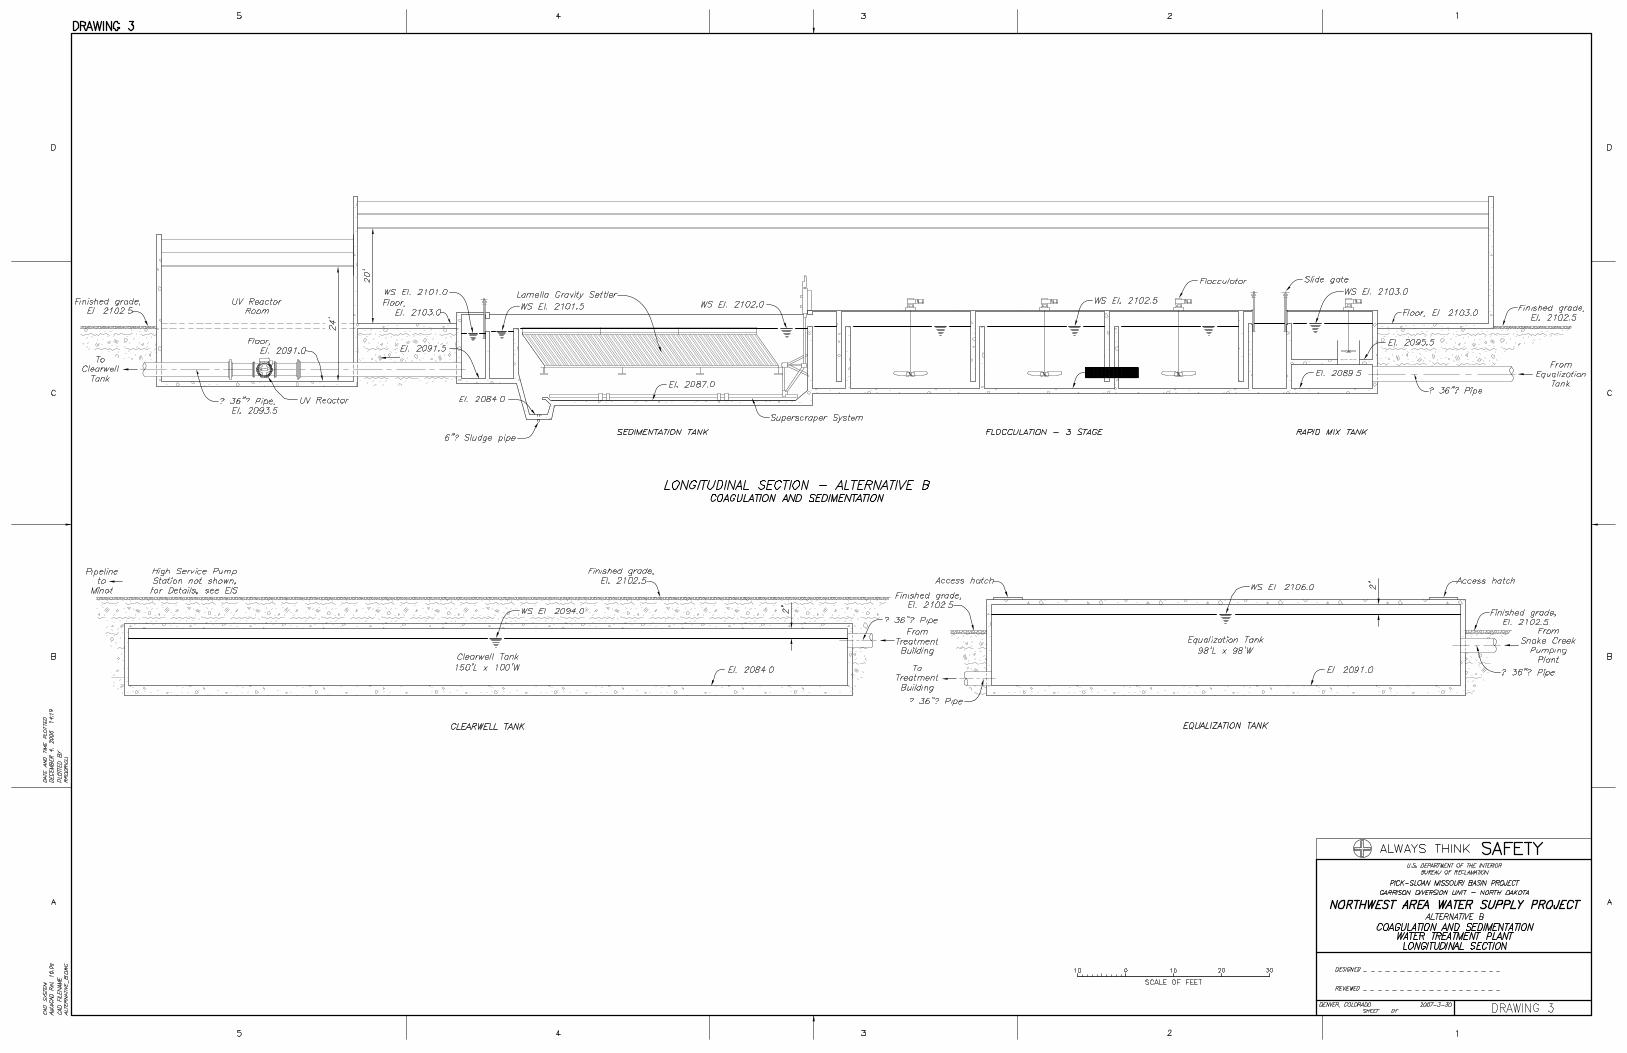


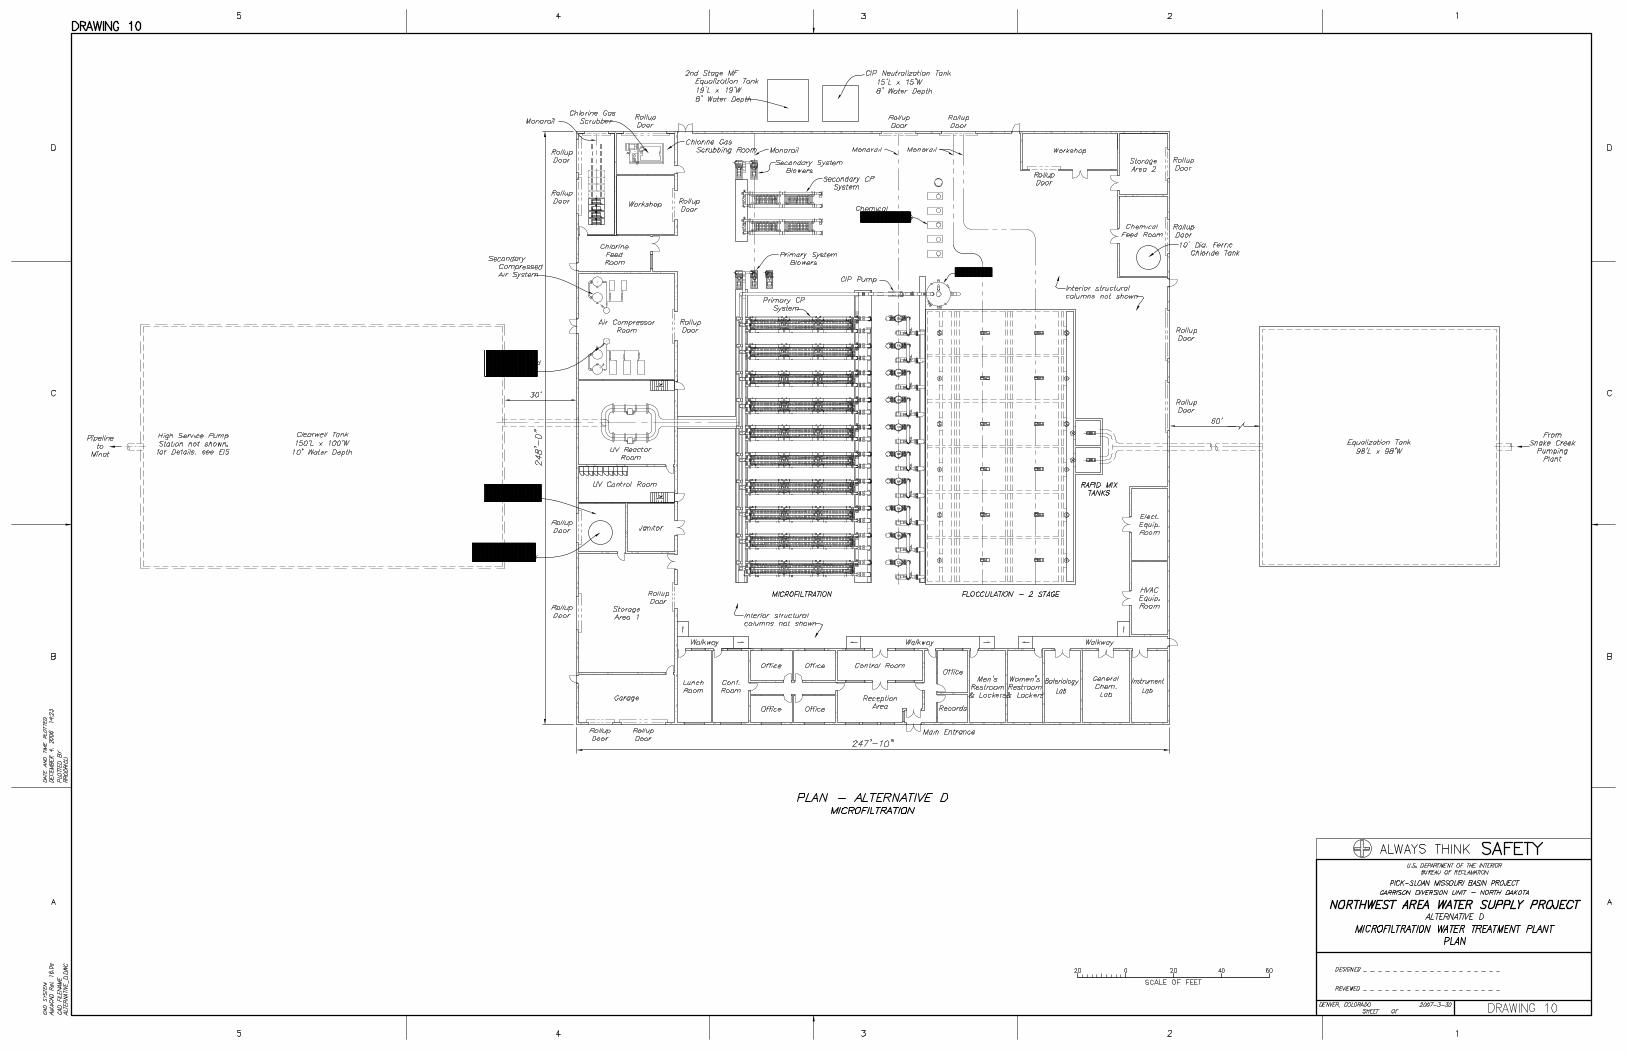


Attachment D
Energy - Heat Analysis
An energy analysis was performed for the two existing energy sources available for heat at the NAWS WTP site: propane & electric. Costs included both capital and energy costs for heating only (Table A1).
Principal Yearly Principal
Payment Energy Cost
per year Total Cost per Year
Electric $1,035,000 $67,328 $525,639 $592,967 Propane $1,250,000 $81,314 $434,206 $515,520 Cost Difference $ 77,447 13%
Table A1: Electric and propane heating costs The interest rate used was 5%. The lifespan was 30 years. O&M cost (except for energy use) were not included. The results show that propane presents a 13% cost savings over electric. However, propane increases operator time in handling 32 deliveries per year (not included). In addition, electric use allows for the incorporation of renewable energy sources (e.g. wind & solar) and without pollution associated with truck transport. The energy costs presented, assume the use of a 40% efficient heat recovery unit for warming incoming air with warmer exhaust air. This efficiency may be as high as 80%, but 40% is a conservative value for this level of analysis. The heat required was determined referencing average monthly minimum temperatures for Minot. The delivered propane cost is $0.95 per gal. The energy costs use the values presented in the Feb. 2005 Electric Service Evaluation of: - Monthly Service Charge: $250.00 - Demand Charge: $10.79 /kw (monthly basis) - Energy Charge: $0.025179 /kwh The high demand charge makes peak electric demand events very costly. Load limiting devices and control logic are recommended to avoid spikes in electric power use (e.g. all electric heaters turning on at once).
1 of 4

Heating & Total Energy Cost: w/ Electric Heat & Heat Recovery Unit Peak demand charge during each month = $10.79 times instantaneous peak kW that month Power charge for January 30, 2007 per kW = $0.025179 per kW-hr used Service Charge per month = $250.00 per month
Annual Operating Cost = Service charge/yr +Sum peak demand charges/yr + Power used/yr chargeAnnual Operating Cost = $3,000.00 /yr
Annual Process Power in kW--hr/yr = Average process power in (kW-hr /hr ) * 24-hr/day * 365.25 days/yr Process =750-kW lights + 750 *40% = 1,140 kW-hr average use /hr for 24-hr/day for 365.25-day/yr = 9,993,240 kW/yrAnnual Process Power used/ yr = 9,993,240 -kW-hr used /yr Annual Process Power cost = Energy used * Power charge rateAnnual Process Power cost = $251,619.79 /yr
Annual HVAC power used in kW-hr/yr = = Sum kW-hr for each month *(1- Energy recovered with heat wheel=40% total)Annual HVAC Power kW/yr = ( 14,000,000 -4,480,000 )-kW-hr used/yr = 9,520,000 -kW -kW-hr used /yr Annual HVAC Power cost = Energy used * Power charge rateAnnual HVAC Power cost = $239,704.08 /yr
Note: Heating energy used for HVAC varies directly with the average monthly degree days.Note: Peak heating energy used for HVAC varies directly with the average monthly temperature extreme
as a ratio of low peak temperature minus the indoor temperature to the design temperature difference Column 2 = Average monthly extreme low temperatures for Minot North Dakota in °FColumn 3 = Average monthly extreme low temperatures for Bismarck North Dakota in °FColumn 4 = Estimated average extreme low monthly temperature Column 5 = (% total hvac heating operating )Column 5 = Heaters or Fan+compressor motors set peak estimated percent power to AC units & fans.Column 6 = ( max heat energy (= 4.5-kW) * Column 5 in MWColumn 6A = Estimated Heat wheel energy recovered in MW. (Reduces energy needed in Column 6.)Column 7 = HVAC peak energy during month = heat/AC(=Col6-Col 6A) + Other HVAC ~continuous (=0.5MW)Column 8 = Monthly HVAC Demand charge = column 7 * Demand charge/peak kW
(See tables HVACheat hvac HVAC Lights Water50%of extremes. heat wheel total Demand 750-kW Process Est. low.) % heat/ac MW power MW charge $ 50% total for pumps Process demand
Month column 2 Column 3 Column 4 Column 5 Col 6 Col 6A Col 7 Column 8 process in % Q CostsJanuary 0 -2 -30 100 4.5 2 3 $32,370.00 100.00% 20.00% $9,711.00February 4 2 -20 100 4.5 2 3 $32,370.00 100.00% 20.00% $9,711.00March 14 13 5 85 3.9 1.6 2.8 $30,212.00 100.00% 20.00% $9,711.00April 26 25 10 75 3.8 1.5 2.8 $30,212.00 100.00% 20.00% $9,711.00May 38 37 32 35 1.5 0.5 1.5 $16,185.00 100.00% 40.00% $11,329.50June 49 48 40 20 0.9 1.4 $15,106.00 100.00% 80.00% $14,566.50July 56 55 55 10 0.4 0.9 $9,711.00 100.00% 100.00% $16,185.00August 58 54 55 10 0.4 0.9 $9,711.00 100.00% 80.00% $14,566.50September 51 43 32 35 1.5 0.5 1.5 $16,185.00 100.00% 40.00% $11,329.50October 40 32 20 75 3.8 1.5 2.8 $30,212.00 100.00% 20.00% $9,711.00November 27 17 10 80 4 1.6 2.9 $31,291.00 100.00% 20.00% $9,711.00December 12 4 -30 100 4.5 2 3 $32,370.00 100.00% 20.00% $9,711.00
4.80 $135,954.00Total HVAC Demand Charge = Sum of monthly demand charges = $285,935.00 40.00% annual avg. process use
Annual cost for HVAC power with electric heating = Demand charge + power used chargeAnnual cost for HVAC power with electric heating = $525,639.08 = Total HVAC $/ kW-hr Then average annual cost/kW for HVAC = $0.0552 per kW-hr
Energy for other process equipment and uses = 1,500 kW-hr peak use /hr in summer (100%) down to 20% min. winter w/ 40% annual avg. Process =750-kW lights + 750 *40% = 1,140 kW-hr Average use /hr for 24-hr/day for 365.25-day/yr = 9,993,240 kW/yrThen power charge power other than HVAC= $251,792.01Demand charge power other than HVAC = $135,954.00Total power other than HVAC = $387,746.01
$0.0388 per kW-hr averageNext line sums process and HVAC electric use:Total annual electric power with electric heat = $913,385.09 @
$0.0468 per kW-hr
HVAC Cost $525,639.08
2 of 4

Heating & Total Energy Cost: w/ Propane Heat & Heat Recovery Unit Peak demand charge during each month = $10.79 times instantaneous peak kW that month Power charge for January 30, 2007 per kW = $0.025179 per kW-hr used Service Charge per month = $250.00 per month
Annual Operating Cost = Service charge/yr +Sum peak demand charges/yr + Power used/yr chargeAnnual Operating Cost = $3,000.00 /yr
Annual Process Power in kW--hr/yr = Average process power in (kW-hr /hr ) * 24-hr/day * 365.25 days/yr Average Process Power = -kW-hr used /hr Annual Process Power used/ yr = 0 -kW-hr used /yr Annual Process Power cost = Energy used * Power charge rateAnnual Process Power cost = $0.00 /yr
Annual HVAC power used in kW-hr/yr = = Sum electric for hvac (=350-kW-hr/hr) + heat wheel (=150-kW-hr/hr)Annual HVAC Power kW/yr = ( 3,068,100 + 1314900 )-kW-hr used/yr = 4,383,000 -kW-hr used /yr Annual HVAC Power cost = Energy used * Power charge rateAnnual HVAC Power cost = $110,359.56 /yr
Note: Heating energy used for HVAC varies directly with the average monthly degree days.Note: Peak heating energy used for HVAC varies directly with the average monthly temperature extreme
as a ratio of low peak temperature minus the indoor temperature to the design temperature difference Column 2 = Average monthly extreme low temperatures for Minot North Dakota in °FColumn 3 = Average monthly extreme low temperatures for Bismarck North Dakota in °FColumn 4 = Estimated average extreme low monthly temperature for peak electric demand °FColumn 5 = (% total hvac heating operating ) in MW. (None where porpane used for heat.)Column 5 = Fan+compressor motors set peak estimated percent power to AC units & fans.Column 6 = ( max cooling AC energy (= 4.5-kW) * Column 5 Column 6A = Estimated Heat wheel motors energy in MWColumn 7 = HVAC peak energy during month = heat/AC + Other HVAC ~continuous (=0.5MW)Column 8 = Monthly HVAC Demand charge = column 7 * Demand charge/peak kWColumn 5-8 = (% total hvac heating operating * max heat energy (=4.5-kW) ) + Other HVAC ~continuous (=0.5MW)
(See tables HVAC heat hvac HVAC Lights Water50%of extremes. cool wheel total Demand 750-kW Process Est. low.) % heat/ac MW power MW charge $ 50% total for pumps Process demand
Month column 2 Column 3 Column 4 Column 5 Col 6 Col 6A Col 7 Column 8 process in % Q CostsJanuary 0 -2 -30 0 0 0.2 0.5 $5,395.00 100.00% 20.00% $9,711.00February 4 2 -20 0 0 0.2 0.5 $5,395.00 100.00% 20.00% $9,711.00March 14 13 5 0 0 0.2 0.5 $5,395.00 100.00% 20.00% $9,711.00April 26 25 10 0 0 0.2 0.5 $5,395.00 100.00% 20.00% $9,711.00May 38 37 32 0 0 0.2 0.5 $5,395.00 100.00% 40.00% $11,329.50June 49 48 40 8 0.2 0.2 0.7 $7,553.00 100.00% 80.00% $14,566.50July 56 55 55 8 0.4 0.2 0.9 $9,711.00 100.00% 100.00% $16,185.00August 58 54 55 8 0.4 0.2 0.9 $9,711.00 100.00% 80.00% $14,566.50September 51 43 32 8 0.4 0.2 0.9 $9,711.00 100.00% 40.00% $11,329.50October 40 32 20 0 0 0.2 0.5 $5,395.00 100.00% 20.00% $9,711.00November 27 17 10 0 0 0.2 0.5 $5,395.00 100.00% 20.00% $9,711.00December 12 4 -30 0 0 0.2 0.5 $5,395.00 100.00% 20.00% $9,711.00
AC motor start 4.80 $135,954.00Total HVAC Demand Charge = Sum of monthly demand charges = $79,846.00 40.00% annual avg. process use
Annual cost for HVAC power with electric heat= Demand charge + power used chargeAnnual cost for HVAC power with propane heat= $190,205.56 plus cost of propane.Then average annual cost/kW for HVAC = Total $/ kW-hr = $0.043 per kW-hr
Energy for other process equipment and uses = 1,500 kW-hr peak use /hr in summer (100%) down to 20% min. winter w/ 40% annual avg. Process =750-kW lights + 750 *40% = 1,140 kW-hr Average use /hr for 24-hr/day for 365.25-day/yr = 9,993,240 kW/yrThen power charge = $251,792.01Demand charge = $135,954.00Total power other than HVAC = $387,746.01Next line sums process and HVAC electric use:Total annual electric power with propane heat = $577,951.57 plus cost of propane
$0.0402 per kW-hrAnnual liquid propane w/ 40% recovery from heat wheel = 256,000.00 gal/yrAnnual cost propane w/ 40% recovery from heat wheel = $244,000.00 @ $.95/gal liquid propaneTotal of electric and propane costs = $821,951.57
HVAC cost $434,205.56
Detailed HVAC Description
3 of 4

The heating and ventilating system consists of air handling units with duct heaters or furnaces and energy recovery (heat wheel) units, fans, louvers, dampers, ductwork, unit heaters, radiant heaters, instrumentation, controls and accessories. This system provides ventilation in accordance with ASHRAE standards for the interior of the water treatment plant and various associated vaults and process buildings. These associated vaults and buildings consist of the sludge handling building, backwash (IPS) building, and recycle water pump vault. Heaters provide warmth to the interior of all structures and prevent freezing during the winter months. These heaters could be natural gas, propane (LP) gas, or electric. Heat recovery wheels reduce net operating cost. Solar walls on the south wall of the building to temper ventilation air were estimated to provide additional energy savings. The offset in cost effectiveness of the solar wall in conjunction with the heat recovery units was beyond our scope. Operation of the plant and associated structures occurs with outdoor temperature extremes from below negative 40-degrees to over 100 degrees Fahrenheit. Air conditioning systems provide a suitable air environment for the control/communication rooms, laboratories, and office/administration areas. Electric heat power requirements were used for the base design cost estimate. The estimates assumed a maximum of a 1-hour power outage and no backup heating in the process areas or general offices. Backup power from the engine generators for HVAC systems was provided for critical life safety and temperature sensitive equipment including: control dampers and instrumentation; fan motors for ventilation of the chlorine and ammonia rooms; laboratory hood exhaust fans; and auxiliary heating in the control room and laboratories. With electric heat, 250-gallon tanks will provide about a 12-hour fuel supply for propane engine generators. If propane heat is provided, the backup generators can provide sufficient power to operate the additional controls and fans to run propane heaters required to maintain the building temperature as long as fuel is available. Without the heat recovery units operating in a year with average January daily temperatures, a full 30,000-gallon propane tank with the required 15-percent expansion area would last approximately 7 days. It could be kept filled with three 8000-gallon deliveries per week using a 10,000-gallon propane truck (8500-gallon actual capacity with legal expansion allowance). With the heat recovery units operating in a year with average January daily temperatures, a full 30,000-gallon propane tank with the required 15-percent expansion area should last 14 to 20 days. The overall system efficiency of the units needs to be investigated. In an extreme temperature period, a full tank would provide approximately 4 days operation at maximum heat load without the heat recovery units and 7 to 10 days operation with the heat recovery units. A second propane storage tank was required to allow time for delivery delays. Estimated operating energy load savings for operating the HVAC system with 40-percent net energy recovery are as follows: Source
Non-heat Electric $191,000Heat Electric $335,000
Electric Heat Option Total Electric $526,000
Non-heat Electric $191,000Heat Propane $244,000
Propane Heat Option Total Electric & Propane $435,000
4 of 4

Attachment E Cost Assumptions and Factors Escalation The estimate worksheets list costs with an effective price level of January 2007. The estimates contain a modest percentage for escalation during a two year maximum period of construction. Scope of Costs Costs listed on the estimate worksheets include furnishing and installing the item complete and in place. These installed costs include furnishing all labor, equipment, materials, incidentals and appurtenances required to comply with typical Bureau of Reclamation Construction Specifications. Mobilization Mobilization costs include mobilizing contractor personnel and equipment to the project site during initial project start-up. The 5% value for mobilization reflects a value based on experience with similar projects. Unlisted Per Reclamation Cost Estimating Handbook guidelines, the allowance for unlisted items in appraisal estimates should be at least 10%. A value of 10% was used for this report based upon the completeness of the cost estimate listed items. (Unlisted = 0.1 x (subtotal + installation + mobilization)). The Reclamation Manual Temporary Release FAC-TRMR-9 (available on the internet at http://www.usbr.gov/recman/temporary_releases/factrmr-9.pdf ), states in part that depending on the level of cost estimate, it is often not practical to identify all items associated with a project. Because of this, various classifications of estimates including appraisal, feasibility, and percent-design estimates shall contain a percentage allowance shown as a separate line item to account for the cost of these minor items of work. This item is also considered a contingency for potential minor design changes. This allowance for unlisted items represents the amount required to achieve comparability between these preliminary estimates and the prevalidation estimate or IGCE. Professional judgment is to be used in assigning reasonable percentage allowances for unlisted items, but in general, the less refined the estimate, the higher the percentages used. The availability and quality of applicable design data and the magnitude of the work items that may be affected by deficient design data shall be considered when establishing the percentage allowance to be used for the unlisted items.

Contract Cost The contract cost is intended to represent the estimated cost of the contract at time of bid or award. This value will include mobilization and allowances for unlisted items but not contingencies. (Contract Cost = subtotal + installation + mobilization + unlisted) Allowance for Procurement Strategies Allowances for procurement strategies are not included in the costs of this project. Estimated costs assume all procurement will consist of full and open competition. Additional costs may be incurred by special solicitations for construction classified and set aside under socio-economic programs, along with solicitations that may limit competition or allow award to other than the lowest bid or proposal. Contingencies This cost estimate was prepared in accordance with Reclamation Manual requirements for appraisal level estimates. This estimate includes a percentage allowance for contingencies as a separate item to cover minor differences in actual and estimated quantities, unforeseeable difficulties at the site, changed site conditions, possible minor changes in plans, and other uncertainties. Estimated quantities or unit prices were not to be increased as a means for including contingencies. The allowance used was based on engineering judgment of the major pay items in the estimate, reliability of the data, adequacy of the projected quantities, and general knowledge of site conditions. The allowance is related to the certainty of the engineering and geological information and data. A value of 21 percent was added for contingencies for all the features cost estimated. (Contingencies = 0.21 x Contract Cost) Field Cost Field cost is an estimate of the capital costs of a feature or project from award to construction closeout. The field cost equals the contract cost plus contingencies. (Field Cost = subtotal + installation + mobilization + unlisted + contingencies) Non-Contract Cost Non-contract costs refer to the costs of work or services provided by Reclamation staff and/or service contractors in support of the project. Non-contract costs are included to cover work or services provided in support of the contract such as design and specifications development, procurement services, contract administration, construction supervision, etc. Reclamation historical data supports that these costs generally run at a minimum of 30% of the Field Costs. However, local data provided by the client for similar ongoing work on the Northwest Area Water Supply (NAWS) project (long pipeline runs and the use of state and federal oversight) suggests that a reduced value be employed. It was determined that 25% be added for non-contract costs, assuming this project is locally contracted and administered. (Non-Contract Cost = 0.25 x Field Cost)

General Note Part of the standard cost estimating methodology used by Reclamation may include rounding and back calculating of some values. Therefore the direct sequential application of percentages to each cost will not produce the same values as shown.

Attachment F Detailed Cost Breakdown


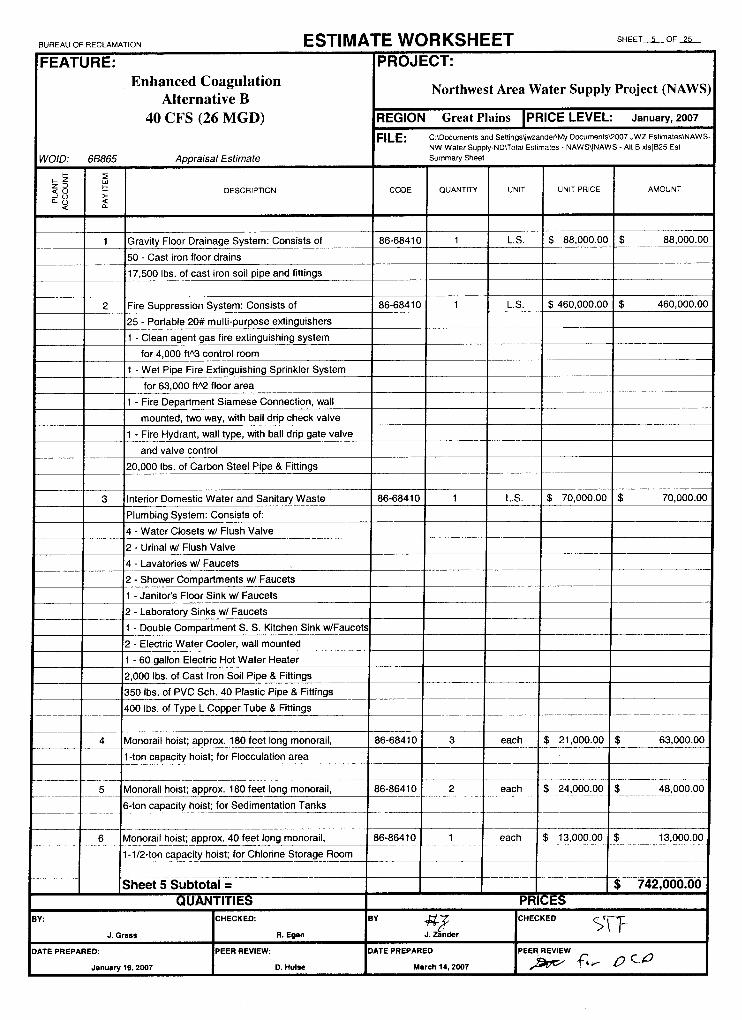


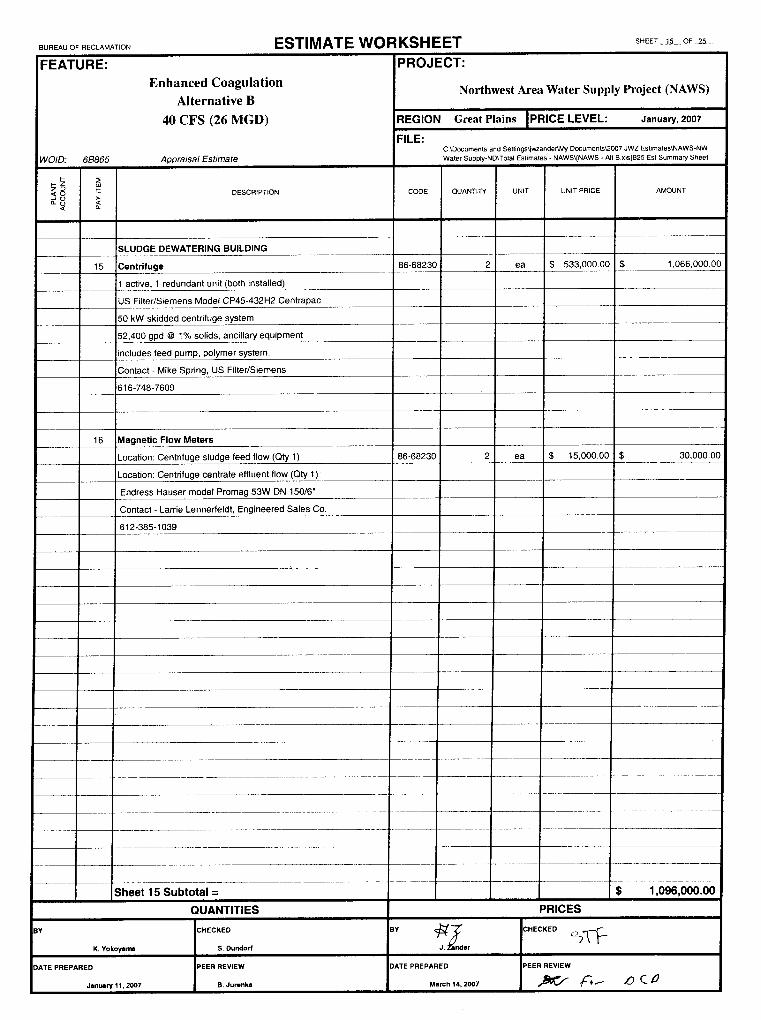


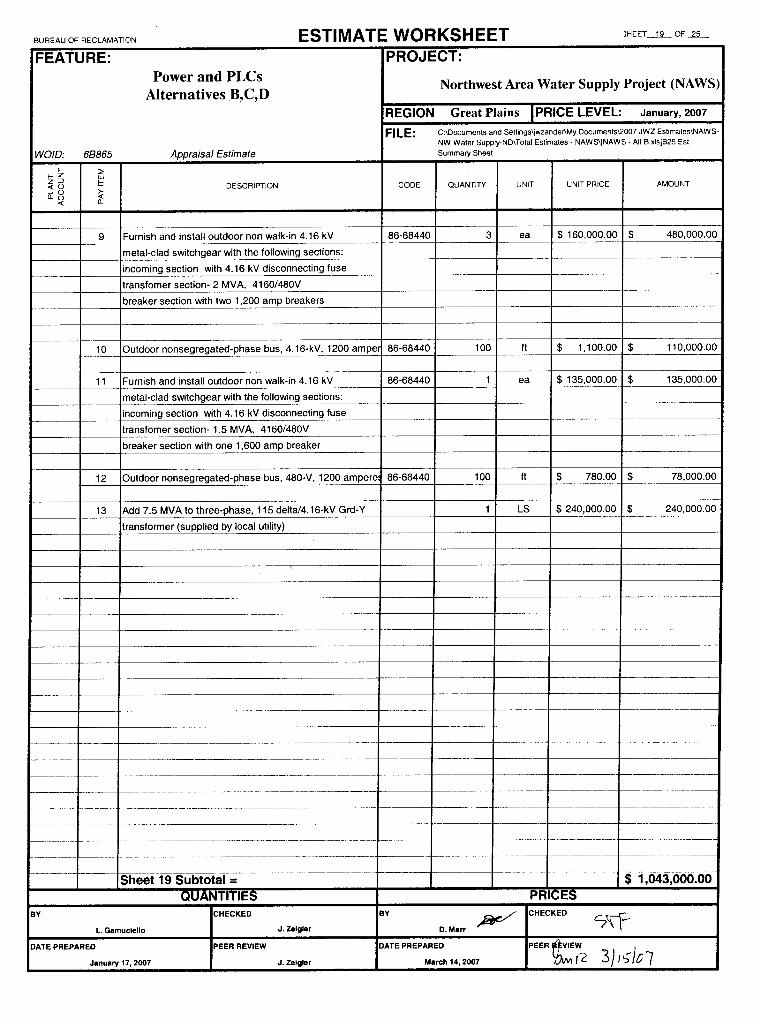


OF RECLAMATION ESTI MATE WORKSHEET SHEET2 OF 25
FEATURE:Estimate Summary Sheet
Enhanced Coagulation
PROJECT:
Northwest Area Water Supply Project (NAWS)
Alternative B__________________REGION Great Plains
__________________________IPRICE LEVEL January, 2007
40 CFS (26 MGD)WOID: 6B865 Appraisal Estimate
FILE:J:\2007 JWZ Estlmates\NAWS-NW Water Supply-ND\Total Esftmate\JNAWS - Alt B -RevOl xls]B25 Est Summary Sheet
I-
DESCRIPTION CODE QUANTITr' UNIT UNIT PRICE AMOUNT
______Sheets 1 - 3 - (Site Work and Bldgs.)
______ _______ ______ ________ $ 18,425,690.00
____Sheet 4 - (Pipe and Valves) = ______ _______ ______ ________ $ 925,010.00
Sheets 5 - 7- (Plumbing, Fire Suppression, Shop Eqpt.)=____ ________ $ 945,100.00
_____
_____Sheets 8 - 9 - (Pumps)
______ _______ ______ ________ $ 167,710.00
Sheets 10- 11 - (Mixers, Plate Settlers, UV Reactors) = $8,142,000.00_______ ______ ________
Sheets 12 - 13 - (Chemical Feeders and Tanks) = $ 352,000.00_______ ______ ________
Sheets 14 - 15 - (Polymer Feeder, Flow Meters and Centr fuge) = _______ _________ $ 1,246,000.00
_________ I II ____________ [ __________ _____________ ___________ ____________
______ Sheets 16 - 17 - (Distribution Panels, Motor Controls, Wiring & Conduit ) = _________ $ 1,730,500.00
-Sheets 18 - 19-(Fiber Optic Cable, PLC, Conduit, Bus, Transformer) =
________ $ 1,198,400.00
______Sheets 20 - 21 - (HVAC System Electric Heat ) = _______ $1,393,250.00
_____ _____
Sheets 22 - 23 - (H&V System, Solar Wall)______ _______ _______ _______ $ 230,000.00
______Sheet 24 - (Dewatering) = _______ $ 780,000.00
_______ ________
______Subtotal all Sheets = $ 35,535,660.00
______ ______ _______ _______ ________
Additonal Unlisted Items % ( <5%) broken out per client d irection = $ 1,800,000.00Subtotal
________
______
$ 37,335,660.00Mobilization (+1-5%)
_______ ______
$ 1,850,000.00Subtotal
______
______ ________
_______
_______
________
________ $ 39,185,660.00
_____Unlisted items (+1-5%) $ 1,814,340.00
_____ _____CONTRACT COST
_______
$ 41,000,000.00Contingencies (+1-21%)
______ ______ _______
$ 9,000,000.00________________
___________FIELD COST
______ ________ ______ ________
$ 50,000,000.00______
Noncontract Costs (+1- 25%)______ ________
$ 12,000,000.00_____ ________
CONSTRUCTION COST______ ________ _____ ________
$ 62,000,000.00______ _______
QUANTITIES PRICESBY CHECKED B''
zaner
CHECKED 2-( /l( O"f
DATE PREPARED: PEER REVIEW: DATE PREPARED
AprIl 24, 2007
PEER REVIEW


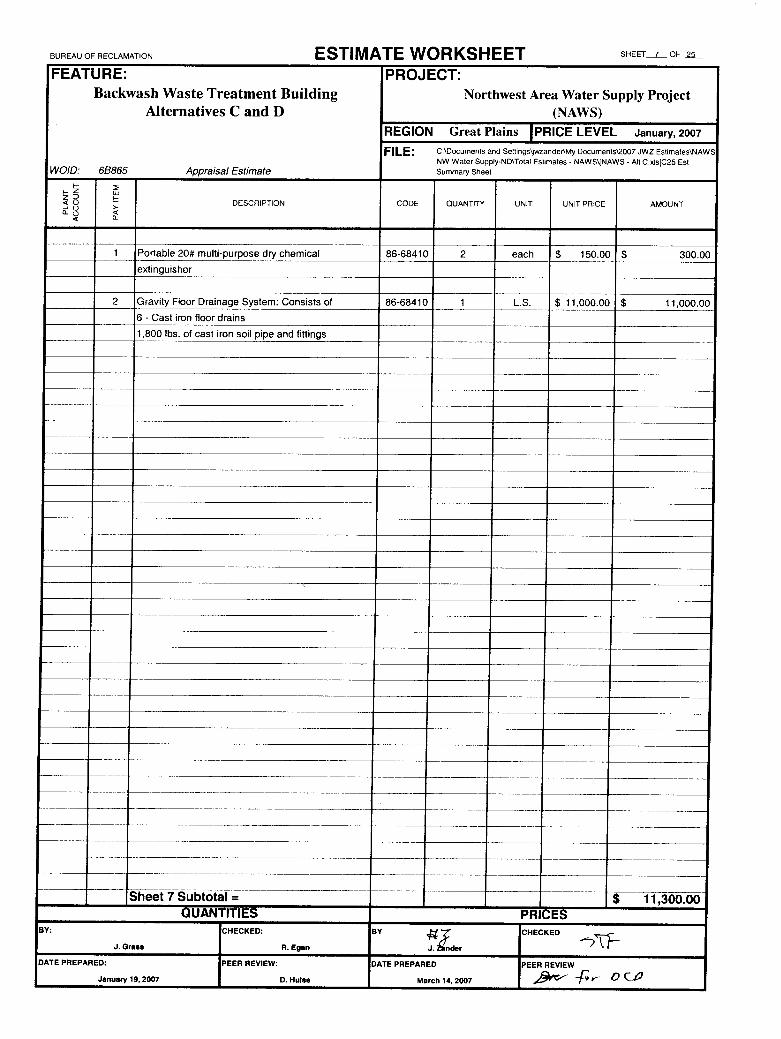


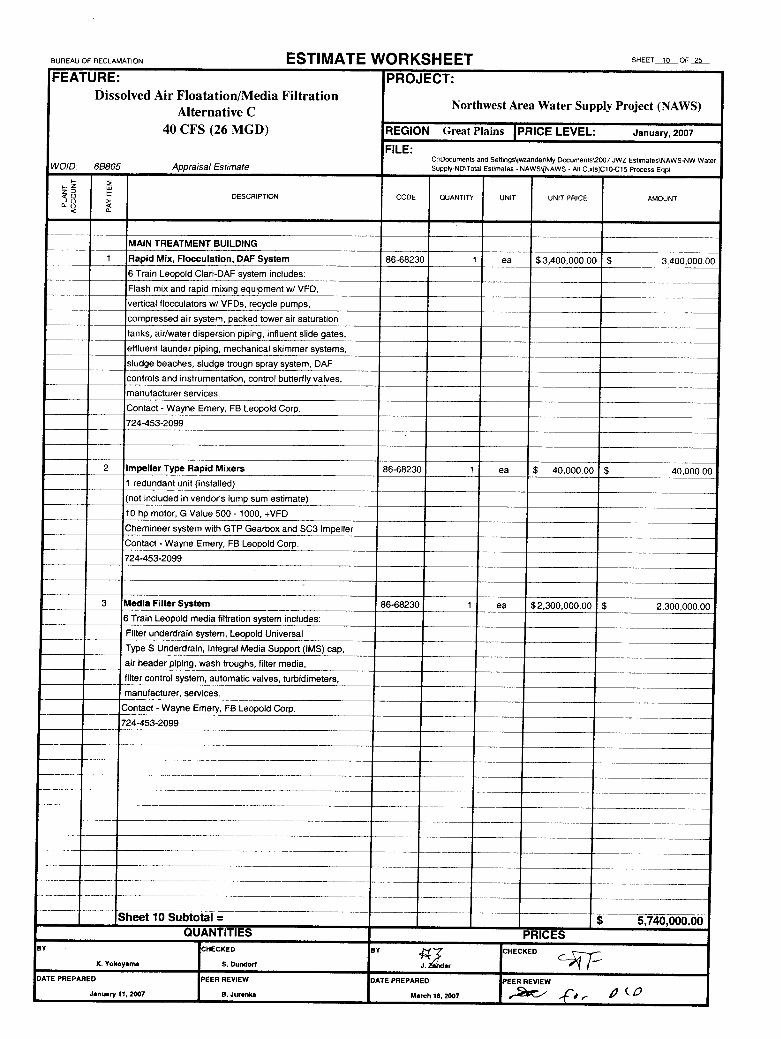
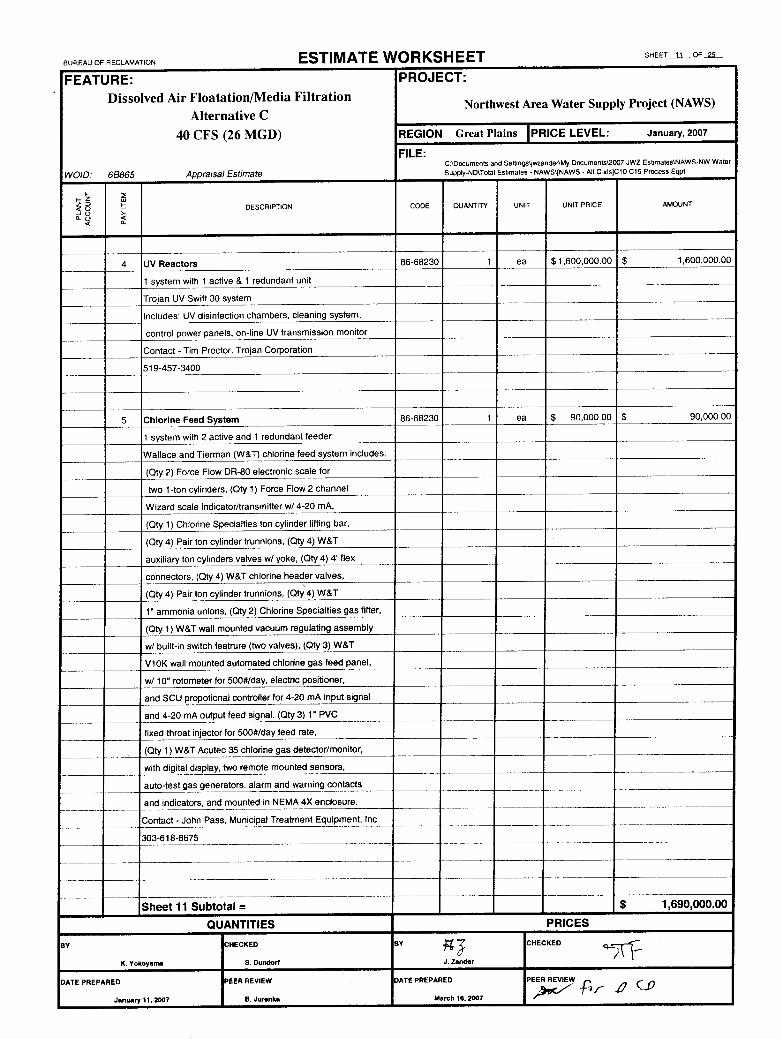


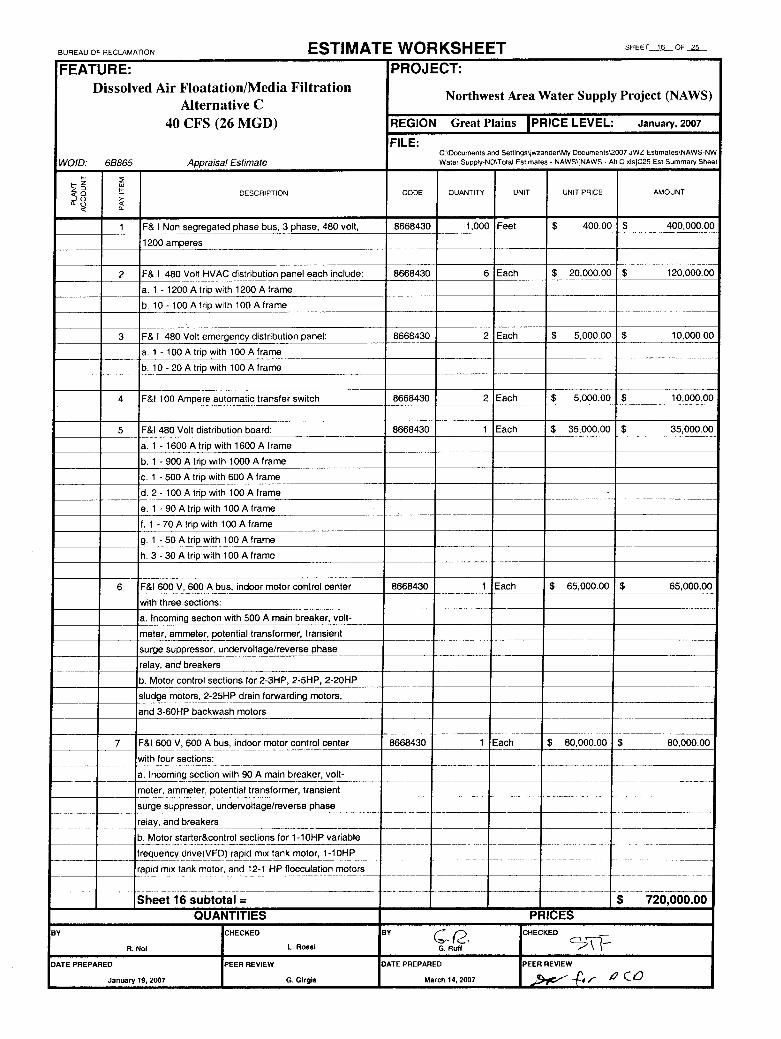


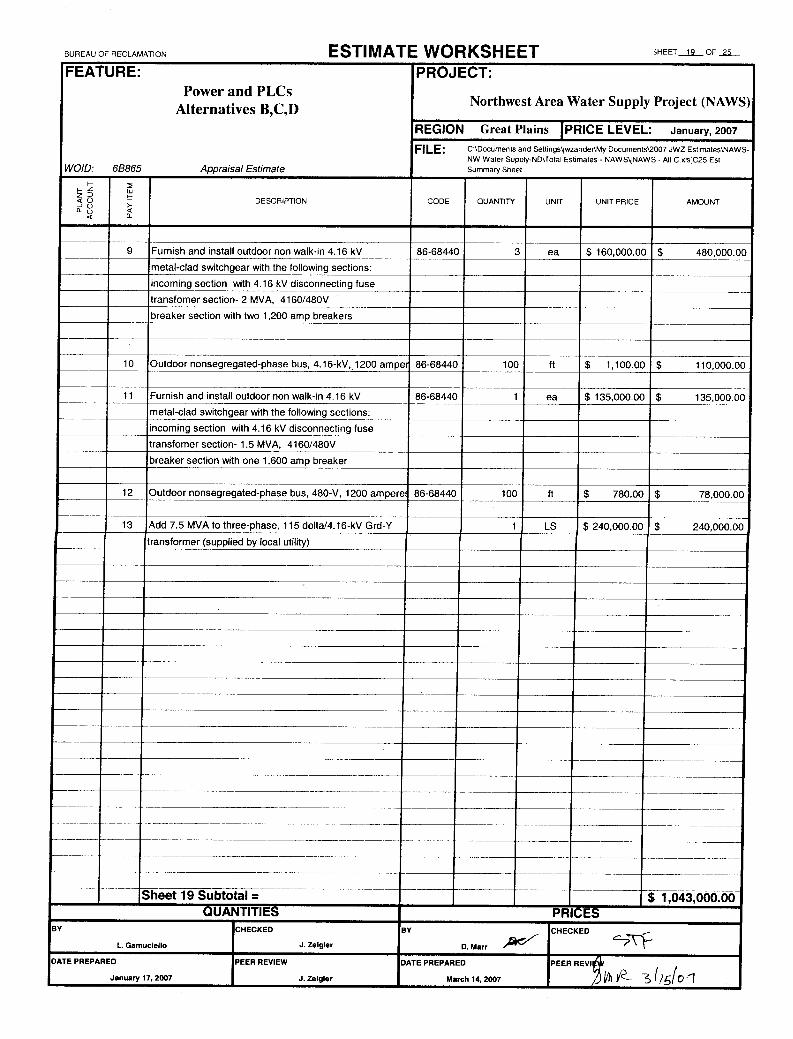


BUREAU OF RECLAMATION ESTI MATE WORKSHEET SHEET25 OF 2&
__
_
_
_
FEATURE:Estimate Summary Sheet
Dissolved Air Floatation/Media Filtration
PROJECT:
Northwest Area Water Supply Project (NAWS)
Alternative C REGION Great Plains IPRICE LEVEL January, 2007
40 CFS (26 MGD)
WOID: 6B865 Appraisal Estimate
FILE:J:\2007 JWZ Bstimates\NAWS-NW Water Suppty-ND\Total Estimate\{NAWS - Aft C -RevOl xIsJC25 Eat Summary Sheet
I-
z
_JQa_o
w
>-<
DESCWPTION CODE QUANTITY UNIT UNIT PRICE AMOUNT
_____Sheets 1 - 3 - (Site Work and Bldgs.) = ______ ________ ______ ________ $ 20,568,500.00
Sheets 4 - 6 - (Plumbing, Fire Suppression, Shop Eqpt.)_______ ________ $ 2,365,280.00
_____Sheets 7 - 8 - (Floor Drains, Hoist)
_____ $ 33,600.00
Sheets 9- 10- (DAF System, Plate Settlers, Media Filters) =______ ________ $ 6,450,100.00
_____
Sheets 11 - 12 - (Chemical Feeders, Chlorine Scrubber,Tank)_______ ________ $ 1,982,000.00
_____
I _ __ -__
Sheets 13 - 14 - (Chem. Feeders, Tank, Flow Meters and Centrifuge)________ $ 1,338,000.00
_ ____ I I I _ __
_____ Sheets 15- 16- (Plate Settler, 3 Phase Bus, Distribution Panels)________ $ 1,935,000.00
I I _
Sheets 17- 18- (Lighting, Transformer, PLC, Conduit) =
_
$ 845,800.00
____LI_
_____
__ __Sheets 19 -20- (Switchgear, Transformer, HVAC System) =
__________
____$ 2,363,000.00
I I ISheets 21-22-(H&V System Sludge Bldg., IPS Waste System') =
__
$ 76,000.00______ ________
______Sheets 23 - 24 - (Solar Walls, Dewatering)
________ _______ _________ $1,157,375.00
Subtotal all Sheets = ________________ $ 39,114,655.00________
______Additonal Unlisted Items % (<5%) broken out per client direction
_________ $ 1,950,000.00Subtotal $ 41,064,655.00
_____
______Mobilization (+1-5%)
______
______
_______
_______
______
$ 2,100,000.00______ ______
Subtotal______ _______
_____
$43,164,655.00______
Unlisted items (^1- 5%)_________ _______
______ ________
835,345.00$ 1CONTRACT COST
_______ _________
$ 45,000,000.00_____
Contingencies (+1-21%)____
______
______
_______
______
______
_______
$ 10,000,000.00
_____FIELD COST______
_____
______
$ 55,000,000.00-
________
Noncontract Costs (+1- 25%)______ _______
_____
_______
_______
14,000,000.00$_____
CONSTRUCTION_CO ST $ 69,000,000.00______ _______
QUANTITIES PRICESBY CHECKED BY
J. Zander
CHECKED
4. c__________________
DATE PREPARED:_______________PEER REVIEW: DATE PREPARED
Aptil 24, 2007
PEER REVIEW
/
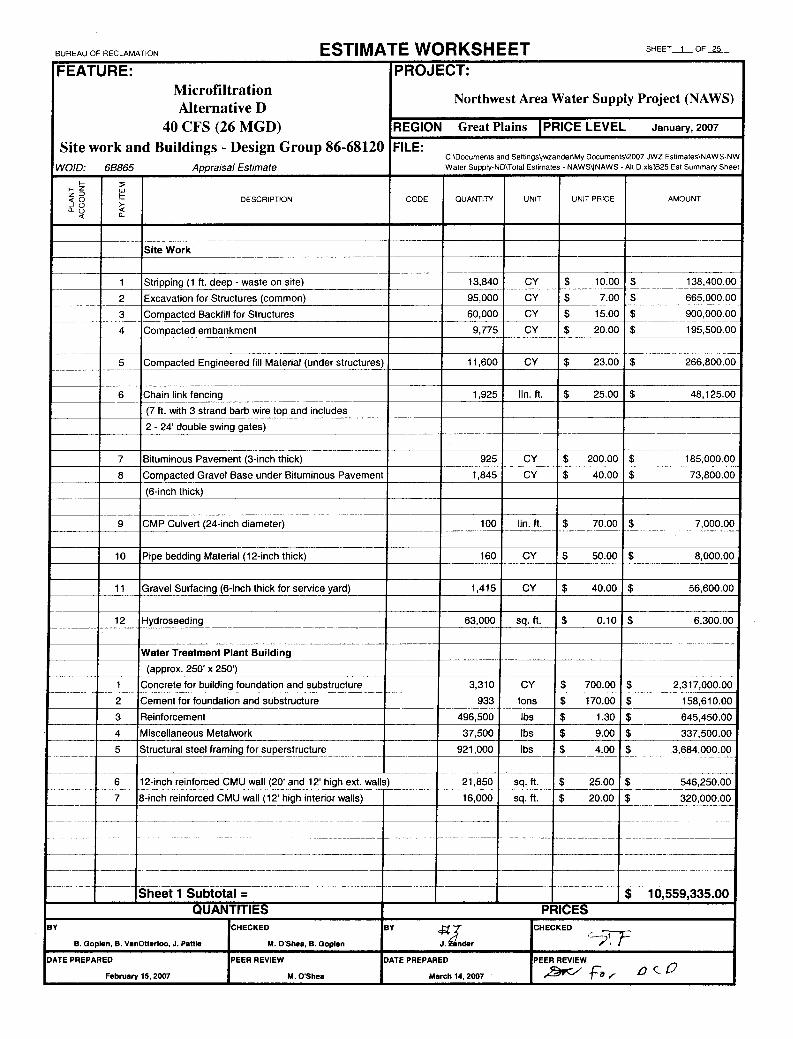


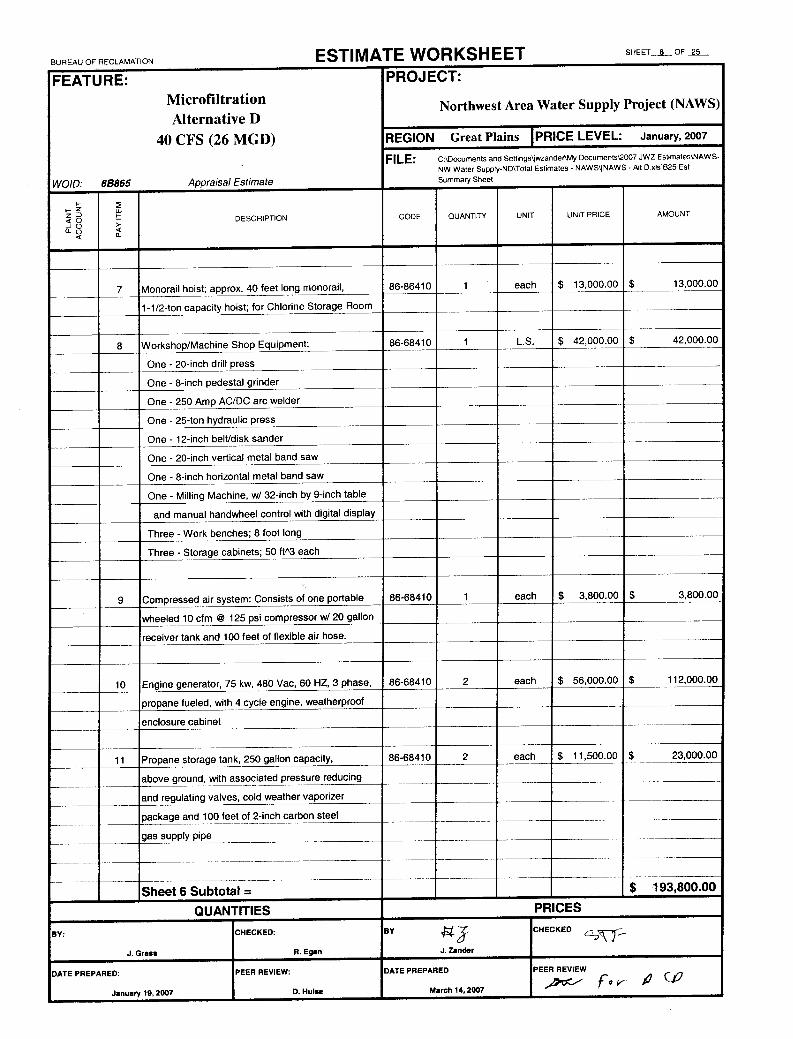
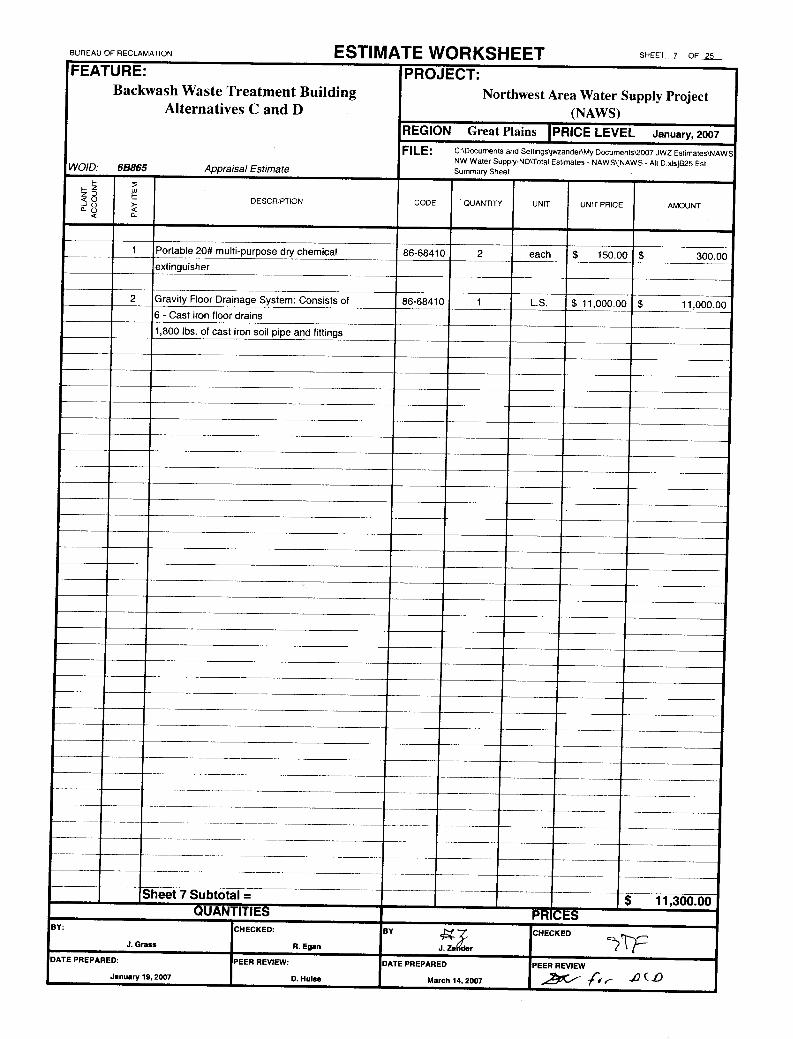


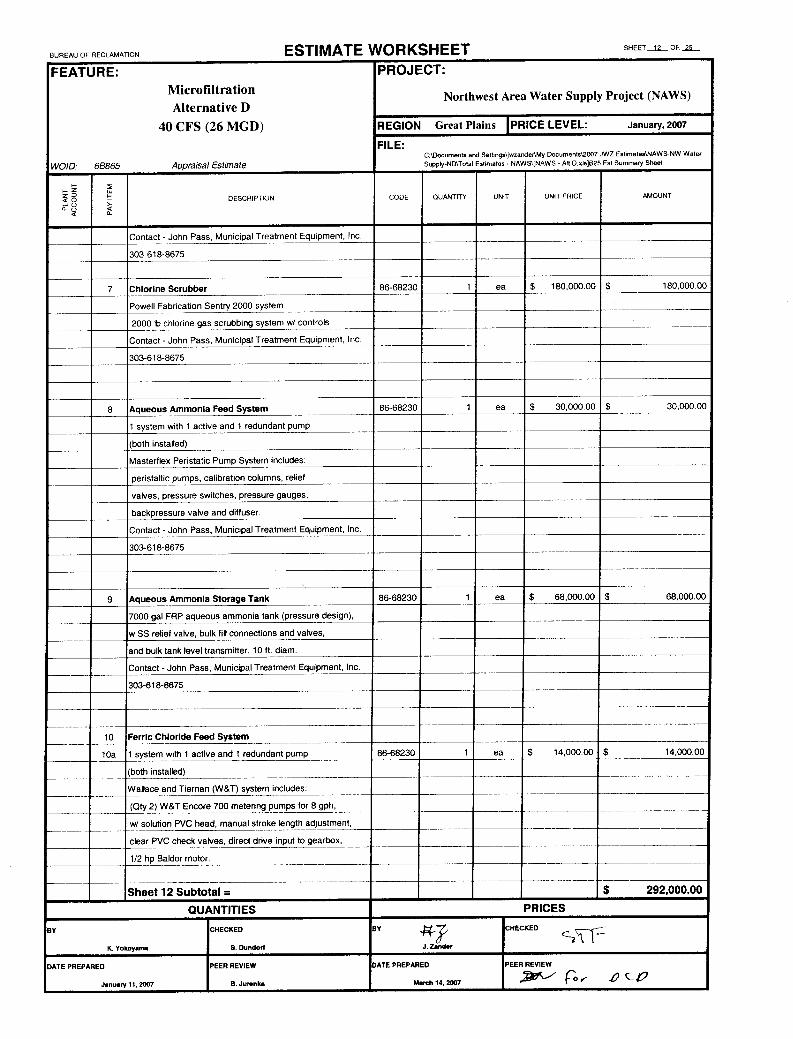


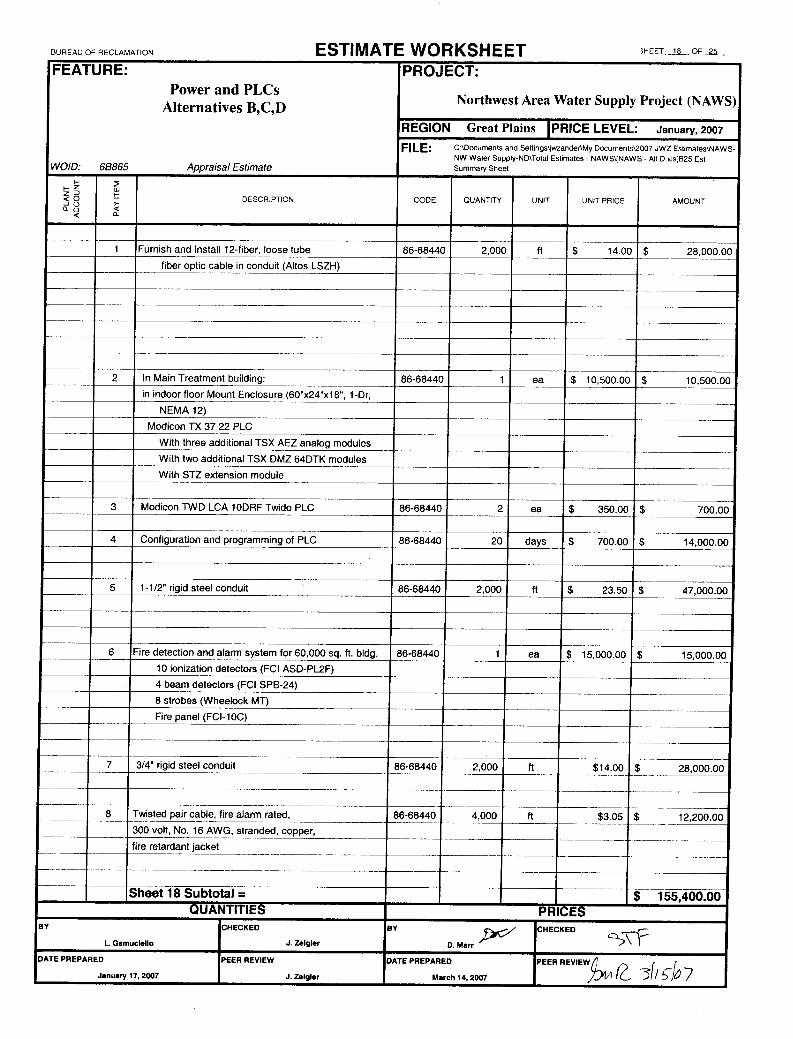


BUREAU OF RECLAMATION ESTI MATE WORKS H E ET SNEET5 OF 25
FEATURE:Estimate Summary Sheet
MicrofiltratLon
PROJECT:
Northwest Area Water Supply Project (NAWS)
Alternative D REGION Great Plains IPRICE LEVEL January, 2007
40 CFS (26 MGD)WOlD: 6B865 Appraisal Estimate
FILE:J:\27 JWZ Est,rnates\1IAWS-NW Water Supply-ND\Totat Estimate\4NAWS - Alt D -RevOl ,ds]B2S Eat Summary Sheet
0Jo<
->-
DESCRIPTION CODE QUANTITY UNIT UNIT PRICE AMOUNT
Sheets 1 - 3 - (Site Work and Bldgs.) = $ 18,725,180.00_____ ______ _______ ______ ________
Sheet 4- (Pipe and Valves) = ______ ______ ______ _______ $ 1,199,408.00
Sheets 5 - 7 - (Plumbing, Fire Suppression, Shop Eqpt.) = $ 912,300.00________
______Sheets 8 - 9 - (Inclined Plate Settlers, Pumps) = ______ $ 203,600.00
Sheets 10 - 11 - (Microfiltration System, UV Reactors) = ______ ________ $ 19,810,000.00_ ___ I _ ___
Sheets 12 - 13 - (Chlorine Scrubbers and Storage Tanks) = ______ ________ $ 352,000.00_ _ I __ _
Sheets 14- 15- (Meters, Centrifuge and Inclined Plate Settlers) = ________
_
$ 1,937,000.00_ __ I -
Sheets 16- 17- (Distribution Panels, Motor Controls, Wiring & Conduit ) ________
____
$ 1,687,500.00
_____Sheets 18- 19- (Conduit, Switchgear and Transformer) = $ 1,198,400.00
______ ________
_____Sheets 20 - 21 - (HVAC System Electric Heat ) = _______ ______ $ 1,403,000.00
_____Sheets 22 - 23 - (H&V System, Solar Wall) = _______ ______ ________ $ 298,125.00
Sheet 24 - (Dewatering) = ______ _______ $ 890,000.00________
_____Subtotal all Sheets = ______ ________ $ 48,616,513.00
______Additonal Unlisted Items % ( < 5%) broken out per client direction = $ 2,400,000.00
Subtotal_________ _____ $ 51,016,513.00
______Mobilization (+1-5%)
______ ________
______ ________
$ 2,600,000.00- _________
Subtotal______ _______ ______
________
$ 53,616,513.00______
Unlisted items (+1- 5%)__________ $ 2,383,487.00
_____ CONTRACT COST_____
______ ________
$ 56,000,000.00Contingencies (+1-21%)
______ _______
_____ _______
$ 12,000,000.00_____ FIELD COST
______ ________
$ 68,000,000.00______ Noncontract Costs (+1- 25%)
______
______
_______
________
________
$ 17,000,000.00CONSTRUCTION COST
______
________
$ 85,000,000.00_______
QUANTITIES i-RICESBY
________________
CHECKED
______________
BY
J.Zander
CHECKEDLç,O
DATE PREPARED: PEER REVIEW: DATE PREPARED
AprIl 24, 2007
PEER REVIEW

Attachment G
NAWS Design Parameter SummaryAlternative B
Unit Process Units
NAWS Design Parameter
Used
10-States Standards
Requirement
Other Reputable Source
RecommendationRapid Mix Number of Rapid Mix Tanks (including 1 redundant unit) # tanks 2 minimum 2 Number of Chemical Feeders (including 1 redundant unit) # units 2 minimum 2 Ferric Chloride Dosage mg/L 10 5 to 15 1
Storage Volume for Coagulant (storage volume/tanker truck volume) ratio 1.5 minimum 1.5
Flocculation Number of Flocculation Tanks # tanks 6 minimum 2 Detention time per train - 5 Trains Running minutes 50 minimum 30 Cross Sectional Flow Velocity - 5 Trains Running ft/s 1.49 0.5 < V < 1.5 Detention time per train - 6 Trains Running minutes 60 minimum 30 Cross Sectional Flow Velocity - 6 Trains Running ft/s 1.24 0.5 < V < 1.5 Velocity Gradient - Stage 1 40 40 1
Velocity Gradient - Stage 2 18 18 1
Velocity Gradient - Stage 3 5 5 1
D/T Ratio (determines impeller diameter) ratio 0.4 0.2 to 0.4 2
Sedimentation (Inclined Plate Settlers) Number of Settling Tanks # tanks 6 minimum 2 Loading Rate per Settling Tank - 5 Trains Running gpm/ft2 0.30 maximum 0.5 Loading Rate per Settling Tank - 6 Trains Running gpm/ft3 0.25 maximum 0.5
UV Disinfection Number of UV Reactor Units (including 1 redundant unit) # units 3 Trojan 3
UV Dosage per Reactor mJ/cm2 24 Trojan 3
Log removal Giardia log 3 Trojan 3
Log Removal Cryptosporidium log 3 Trojan 3
Chlorine Disinfection Number of Chlorine Feeders (including 1 redundant unit) # units 3 minimum 2 Log Removal Giardia log 0.34 Log Removal Viruses log 15.0 Max Chlorine Dosage at Peak Flow mg/L 4.0 1 to 5 2
Estimated Chlorine Residual in Clearwell mg/L 3.0 minimum 2.0 Supply of Chlorine Gas days 34 minimum 30
Chloramine Disinfection Number of Ammonia Feeders (including 1 redundant unit) # units 2 minimum 2 Log Removal Giardia log 0.29 Log Removal Viruses log 0.5 Max Ammonia Dosage at Peak Flow mg/L 1.0 0.2 to 1.5 2
% of Ammonia to Chlorine NH3/Cl2 25% 25 to 30% of Cl22
Storage Volume for Ammonia (storage volume/tanker truck volume) ratio 1.5 minimum 1.5
Footnotes1. From MWH (2005), NAWS Pretreatment Design Criteria Study - Bench Scale Treatability Study, Memorandum, Nov 25, 2005.2. From Kawamura (2000), Integrated Design and Operation of Water Treatment Facilities, Second Edition3. UV Reactor Design provided by Trojan Technologies, Inc.

Attachment G
NAWS Design Parameter SummaryAlternative C
Unit Process UnitsNAWS Design
Parameter Used10-States Standards
RequirementOther Reputable Source
RecommendationRapid Mix Number of Rapid Mix Tanks (including 1 redundant unit) # tanks 2 minimum 2 Number of Chemical Feeders (including 1 redundant unit) # units 2 minimum 2 Ferric Chloride Dosage mg/L 10 5 to 15 1
Storage Volume for Coagulant (storage volume/tanker truck volume) ratio 1.5 minimum 1.5
Flocculation Number of Flocculation Tanks # tanks 6 minimum 2 Detention time per train - 6 Trains Running minutes 20 Leopold 2
Cross Sectional Flow Velocity - 6 Trains Running ft/s 1.94 Leopold 2
Dissolved Air Flotation Number of Settling Tanks # tanks 6 minimum 2 Loading Rate per Settling Tank - 5 Trains Running gpm/ft2 12.0 none 3 Leopold 4
Loading Rate per Settling Tank - 6 Trains Running gpm/ft3 9.5 none 3 Leopold 4
Media Filtration Number of Media Filter Beds # units 6 minimum 2 Loading Rate per Media Filter - 5 Trains Running gpm/ft2 #N/A none 3 4 to 10 5
Loading Rate per Media Filter - 6 Trains Running gpm/ft2 4.1 none 3 4 to 10 5
Filter Width ft #N/A 10 to 20 5
Filter Length to Width Ratio ( # Length: 1 Width) ratio #N/A 2:1 to 4:1 5
Backwash Rate gpm/ft2 #N/A 20 recommended 18 to 22 5
Backwash Duration min 15 minimum 15 Air Scour Rate scfm #N/A 3 to 5
UV Disinfection Number of active UV Reactor Units (including 1 redundant unit) # units 2 Trojan 6
UV Dosage per Reactor mJ/cm2 24 Trojan 6
Log removal Giardia log 3 Trojan 6
Log Removal Cryptosporidium log 3 Trojan 6
Chlorine Disinfection Number of Chlorine Feeders (including 1 redundant unit) # units 3 minimum 2 Log Removal Giardia log 0.34 Log Removal Viruses log 15.0 Max Chlorine Dosage at Peak Flow mg/L 4.0 1 to 5 5
Estimated Chlorine Residual in Clearwell mg/L 3.0 minimum 2.0 Supply of Chlorine Gas days 34 minimum 30
Chloramine Disinfection Number of Ammonia Feeders (including 1 redundant unit) # units 2 minimum 2 Log Removal Giardia log 0.29 Log Removal Viruses log 0.5 Max Ammonia Dosage at Peak Flow mg/L 1.0 0.2 to 1.5 5
% of Ammonia to Chlorine NH3/Cl2 25% 25 to 30% of Cl2 5
Storage Volume for Ammonia (storage volume/tanker truck volume) ratio 1.5 minimum 1.5
Backwash Wastewater Treatment (Inclined Plate Settlers) Loading Rate per IPS Unit gpm/ft2 0.26 0.2 to 0.39 7
Footnotes1. From MWH (2005), NAWS Pretreatment Design Criteria Study - Bench Scale Treatability Study , Memorandum, Nov 25, 2005.2. Flocculators based on FB Leopold recommendation for pin floc formation. Ten States Standards does not pertain to pin floc.3. Ten States Standards provides no guidance, but recommends that pilot testing or negotiation with reviewing authorities be performed.4. DAF based on FB Leopold recommendation of max surface loading of 12 gpm/ft 2.5. From Kawamura (2000), Integrated Design and Operation of Water Treatment Facilities, Second Edition6. UV Reactor Design provided by Trojan Technologies, Inc.

Attachment G
NAWS Design Parameter SummaryAlternative D
Unit Process UnitsNAWS Design
Parameter Used
10-States Standards
RequirementOther Reputable Source
RecommendationRapid Mix Number of Rapid Mix Tanks # tanks 2 minimum 2 Number of Chemical Feeders # units 2 minimum 2 Ferric Chloride Dosage mg/L 10 5 to 15 1
Storage Volume for Coagulant (storage volume/tanker truck volume) ratio 1.5 minimum 1.5
Flocculation Number of Flocculation Tanks # tanks 6 minimum 2 Detention time per train - 6 Trains Running minutes 20 Leopold 2
Cross Sectional Flow Velocity - 6 Trains Running ft/s 1.94 Leopold 2
Microfiltration Number of First Stage MF Skids (including 1 redundant unit) # units 10 US Filter / Siemens 3
Number of Second Stage Stage MF Skids (including 1 redundant unit) # units 2 US Filter / Siemens 3
Instananeous Flow per Skid (First Stage) gpm 2,296 US Filter / Siemens 3
Instantaneous Flow per Membrane Module (First Stage) gpm 7.1 US Filter / Siemens 3
Flux (First Stage) gfd 25 US Filter / Siemens 3
Instananeous Flow per Skid (Second Stage) gpm 759 US Filter / Siemens 3
Instantaneous Flow per Membrane Module (Second Stage) gpm 5.3 US Filter / Siemens 3
Flux (Second Stage) gfd 18.5 US Filter / Siemens 3
UV Disinfection Number of active UV Reactor Units (excluding 1 redundant unit) # units 2 Trojan 4
UV Dosage per Reactor mJ/cm2 24 Trojan 4
Log removal Giardia log 3 Trojan 4
Log Removal Cryptosporidium log 3 Trojan 4
Chlorine Disinfection Number of Chlorine Feeders # units 3 minimum 2 Log Removal Giardia log 0.34 Log Removal Viruses log 15.0 Max Chlorine Dosage at Peak Flow mg/L 4.0 1 to 5 5
Estimated Chlorine Residual in Clearwell mg/L 3.0 minimum 2.0 Supply of Chlorine Gas days 34 minimum 30
Chloramine Disinfection Number of Ammonia Feeders # units 2 minimum 2 Log Removal Giardia log 0.29 Log Removal Viruses log 0.5 Max Ammonia Dosage at Peak Flow mg/L 1.0 0.2 to 1.5 5
% of Ammonia to Chlorine NH3/Cl2 25% 25 to 30% of Cl2 5
Storage Volume for Ammonia (storage volume/tanker truck volume) ratio 1.5 minimum 1.5
Backwash Wastewater Treatment (Inclined Plate Settlers) Loading Rate per IPS Unit gpm/ft2 0.16 0.2 to 0.39 6
Footnotes1. From MWH (2005), NAWS Pretreatment Design Criteria Study - Bench Scale Treatability Study, Memorandum, Nov 25, 2005.2. Flocculators based on FB Leopold recommendation for pin floc formation. Ten States Standards does not pertain to pin floc.3. Microfiltration design based on US Filter/Siemens proposed design for NAWS.4. UV Reactor Design provided by Trojan Technologies, Inc.5. From Kawamura (2000), Integrated Design and Operation of Water Treatment Facilities, Second Edition6. EPA (2002), Filter Backwash Recycling Rule Technical Guidance Manual, EPA 816-R-02-014, December 2002, pg 82-83.

Attachment H Geotechnical Memo 86-68320 PRJ-1.10
MEMORANDUM
To: Group Manager, Water Treatment Engineering and Research Group Attn: 86-68230 (Jurenka) From: Jeffrey A Farrar, P.E., Geotechnical Engineer Subject: Geotechnical Review of NAWS Booster Pump/Treatment Facilities Options – Northwest Area Water Supply Project – Pick Sloan Missouri Basin Project - Garrison Diversion Unit, North Dakota
INTRODUCTION The purpose of this memorandum is to review geotechnical considerations for construction of several water treatment plant schemes. A geotechnical report dated July 15, 2003, was written for Houston Engineering by Arman Engineering. The geotechnical investigations were for the chlorination plant Option A. We also had a conference call with Arman Engineering to discuss any questions we had regarding the explorations. This memo will review Arman’s explorations, results, and recommendations and then add my comments and recommendations for other treatment plant Options B, C, and D. Besides the conclusions section at the end, the format of this memorandum will be to re-state recommendations by Arman and then comment on those recommendations in italics. General Summary of Results of Arman’s Investigations: Sixteen standard penetration test borings were performed along an alignment selected by Houston Engineering. Borings P1 through P5 encountered sand layers ranging from 7 to 15 feet below the upper fat clay soils and these sands were water bearing. Ground water is 7 to 10 feet below ground surface at this location. Borings P-8 through P-13 encountered fat clays to 25 feet in depth with only a few instances of thinner sand zones at the bottom of the excavation. The deeper borings are where they were going to excavate for the plant, pump vault, and wet wells. No ground water was encountered in the borings. These deeper borings revealed all fat clay and based on that, their recommendation for excavations was that un-watering with sumps would be sufficient.

2
For Option A, if the location remains the same, this recommendation is correct because the deep excavations are located all in fat clay with no ground water encountered. Treatment Options B, C, and D call for deeper excavations up to 30 feet due to hydraulic grade line restrictions and locations for the deeper excavations occur further to the north and west were the borings are only 15 feet deep and encountered sands. Additional, deeper borings will be required for final design. Their dewatering recommendations do not apply if our site has moved to the north and west where water bearing sand layers are present. The geology of the site is glacial deposits with potholes. The sand layers could be rather heterogeneous with regards to continuity of layers and lenses. In a conference call with Arman, we discussed the sand bearing layers. They agreed that if sands were encountered, they would likely be water bearing and would require de-watering for a stable excavation. Therefore, we must assume de-watering will be required. Dewatering with rows of well points in the sand will be required. Inspection of aerial images in the vicinity of the plant shows a nearby lake on the eastern edge of the site which could feed water too the sand layers that intersect the excavation or pass below but near the base of the excavation. If there is a hydraulic connection to the lake, it could tax the dewatering system. The possibility exists that some form of cutoff wall (slurry wall, sheet piling, etc.) could be needed if the sands are hydraulically connected to the lake. For our current estimates we will not include a cutoff wall. Specific Recommendations by Sections in Arman’s Report 1. Proposed Construction Features: Option A – includes a pump vault, wet well, treatment building and detention pond. This
design has a very small foot print. The excavations are not as deep as the other options at only 7-14 feet deep.
Options B, C, and D – include a wet well up to 30 feet deep, main treatment building with
some deep tanks within it, sludge tank, dewatering facilities, and an equalizing tank. The sludge handling systems are connected with small diameter piping up to 16 inches. Feed and product water pipes entering and leaving the plant are 36 inch diameter.
- The building is expected to be supported by conventional foundation system
consisting of strip footings. Foundation loads are light, less than 3 klf. Wet well base load is 1500 psf or less. Concur and the same applies to Options B, C, and D.
2. Discussion:
- The treatment building floor should be supported on a minimum of 4 feet of engineered fill. Concur for all options and sludge storage tank building too.
- Floor slabs should be placed in continuous pours. Concur.

3
- For the wet well and pump excavations the usual practice of using granular base below these floor slabs is not recommended. Use of a working slab (mud slab) as a construction platform in place is recommended. This recommendation is for foundations resting on fresh stiff fat clays. Use of a granular base under the clear wells and tanks could serve to wet the clays and cause expansion. In the conference call it was explained that a “mud slab” consists of using flowable fill or lean concrete for construction of the those slabs. These materials would stabilize the fat clays and reduce swell tendencies. I concur with these recommendations.
3. Site Preparation and Grading:
- General fill should be compacted to 95 percent compaction and +/- 2 percent of optimum as determined by ASTM D698. Do not use fat clay under parking lots, entrance slabs, building foundations. Use an engineered fill in those locations. Any clay soil to be used as engineered fill should be compacted wet of optimum. I concur with these recommendations.
− Use of fat clay under parking lots or entrance slabs is considered risky unless properly placed at the recommended moisture content. Given the clay is likely dry of optimum I doubt it could be conditioned wet enough to be used as backfill in these situations. In these locations free draining coarse sand gravel backfill should be used to prevent frost heave.
− Excavation can be performed with a backhoe. Concur. − Un-watering can be performed through the use of sumps and small pumps. This is
only true for option A if the location for deep excavation remains in fat clay. For Options B, C, and D, dewatering with well points in sand layers will be required.
− Sub-excavation: Existing fat clays should be removed to a depth of 4 feet below the bottom of all footings and floors. Concur.
− Engineered fill; Sandy gravel, sand, silty sand or a clay with PI less than 15 may be used. Compact to 95 percent of proctor. Clay compacted from optimum to plus 4 percent. Concur. We’ll have to use engineered fill in different areas for different purposes. We must consider frost heave in some locations, or expansive clays in other locations. Re-compacted Fat Clay should only be used for surfical site grading.
− Existing Soils: If the owner elects to use existing soils in lieu of engineered fill over excavate a minimum of 1 foot below bottoms of footings, wet well floor or pumping plant floors. Use flowable fill to backfill. We should stick to the 4 feet over excavation and replacement with engineered fill.
− Fat clay can be used for general site grading. Permanent slopes for grading with fat clays should not exceed 3:1.
− Site grading should be sloped such that all runoff goes away from the structure. Concur.
4. Foundations:
- Recommend conventional foundation system consisting of strip footings and column pads. Sufficient reinforcing steel should be placed in the foundation walls and strip footings to span the potential loss of support over a zone 15 feet long at any point along the walls (grade beam reaction) or over zone10 feet long at the corners (cantilever action). This should reduce the width of possible cracks created by shrinkage or localized movement. Concur.

4
- Wet well and tank floors should be essentially mat foundations with sufficient reinforcing steel and placed in a single pour to reduce potential for shrinkage cracking. Concur.
- Depth; recommend the building foundations bear at a minimum of 4-1/2 feet below exterior grade or 5 feet below finished floor elevations for frost protection. Concur. Exterior pipe runs should be 7.5 feet below grade for frost protection.
- Subgrade, bearing capacity, settlement: At these depths the foundations/slab will likely bear on naturally occurring fat clay. Foundations can be designed for bearing pressures of up to 2,500 psf. It is likely portions of the deep excavations may rest in sands below grade. In those cases the areas should be cleaned and stabilized with crushed rock and proof rolled to form a base for the slab. If near grade floor slabs are in fat clay then over-excavate 4 feet place on compacted engineered fill. For deep excavations in fat clay a mud slab (flowable fill/lean concrete) will be used to form the foundations for the floor slabs. Design bearing capacity of 2,500 psf is acceptable. Total settlements of 1 inch and differential settlements of ½ inch are anticipated.
5. Lateral Earth Pressure: Use equivalent fluid pressure of 90 lb/ft3. Concur since some wall backfill is recommended to be low permeability engineered fill.
6. Foundation Wall Backfill:
- Interior backfill against wet well and deep tanks in the interior of the building should be backfilled with fat clay compacted 2-4 percent wet of optimum to 92 to 96 percent compaction. Do not over-compact the fat clay dry of optimum or it might be expansive. Backfill to within 4 feet of plant slab. This recommendation is based on the premise that floor slabs would be on fresh fat clay, and backfill with fat clay will prevent any free water from getting to the base of the slabs and preventing expansion. I do not concur with the recommendation to use the fat clay for wall compaction. The clay is too difficult to condition and compact. Instead we should use and engineered sand and gravel fill material which has at least 20 percent fines. This backfill should have a minimum plasticity index of 10 to be frost resistant.
- Building Floor: Recommend free draining backfill under interior floor slabs. This conflict with the 4 foot of overexcavation and replacement with engineered fill that can contain fines. I assume the final 1 foot should be free draining materials.
- Exterior Backfill: Recommend re-compacted fat clay to 90 percent proctor and 2-4 percent wet of optimum. Concur. The purpose it to prevent water getting to the bottom of slabs founded on fresh fat clay to prevent expansion.
7. Floors:
- Subgrade: Compacted engineered fill. Concur. - Subgrade modulus: Modulus of subgrade reaction of 150 lb/in2 of per inch of
deflection can be used for design purposes. Concur. - Vapor Barrier: Normally a vapor barrier is placement beneath the floor slab, but it
might induce shrinkage cracking and curling. A granualar vapor barrier should be used. The engineered fill will act as a vapor barrier. Concur. I assume we have 1 foot of free draining material beneath the slabs then 3 foot of engineered fill.

5
8. Exterior Slabs: - Frost Protection: Replace fat clay with free draining backfill with less than 5 percent
fines, use polystyrene insulation, or structurally support exterior slabs. This free draining back fill has to be very clean. We should over-excavate 6 inches and replace with clean free draining backfill such as a blend of C 33 coarse and fine aggregate. The excavations and final grades should be such that free water does not collect in this drain material
- Apron Subgrades: Apron subgrades are anticipated to consist of compacted engineered fill (free draining). A modulus of subgrade reaction of 100 lb/in2 per inch of deflection can be used for design purposes. Concur.
9. Concrete:
- Use a Type I/II Modified cement with fly ash replacement for added sulfate resistance. Limit fly ash to 20 percent in wet well and pump vault for structural considerations. Concur.
10. Drain Tile:
- Typically drain tile is not recommended for applications in fat clay but given the nature of the project it would be advisable to ring the wet well and pump vault deep excavations with a drain tile backfilled with 2 feet of crushed rock and wrapped in filter fabric. Place drain tile directly on mud slab and sump to well accessed to the interior of the plant. Concur. We will have numerous deeper tanks. They should be supplied with drains and sumps too.
11. Site grading and Drainage:
- They recommend sloping 6 inches in 10 feet near the water reservoir and that concrete slabs be sloped 1-1/2 inches in 10 feet. It’s not clear if the concrete slabs mentioned are exterior slabs. I think they are. I concur with this recommendation and note that the fat clay permanent slopes be flatter than 3H:1V
12. Detention Ponds (Option A):
- Fat clay is acceptable for lining any detention ponds. The fat clay must be compacted 2 to 6 percent wet of optimum and to 95 percent compaction. Fat clay with 4 to 6 percent wet of optimum is difficult to compact. I would recommend optimum to 3 percent wet of optimum.
CONCLUSIONS
1. Exploration General - The geotechnical recommendations for Option A are satisfactory for the small plant design placed in fat clay. Maximum excavation depths for this option are only 7 to 14 feet deep and no sand layers are present under the footprint of the plant.
2. Exploration General - The depths and locations of explorations are not sufficient in the layout areas for our large plants in Options B, C, and D. Additional deeper explorations will be required for final design.
a. Five to 10 more new drill holes are required prior to final design. Additional drill holes should be drilled to depth of at least 60 feet.

6
b. Tests to be conducted in the new drill holes and samples from the drill holes should include Standard Penetration Test at 2.5 feet intervals, (index properties) grain size and Atterberg limits tests for the soils, especially the sands c. Pump-out tests should be performed to determine the properties of the sand bearing layers.
3. The location of our larger plants requires we locate on clays underlain by water bearing sands. The geology is not addressed in Arman’s report. Review of some crude aerial photography indicates pot and kettle glacial till topography where there are numerous lakes in the area. It is not known if the sand bearing layers connect with these water sources or they are discontinuous. In a phone interview, Arman said excavations in water bearing sands would require de-watering. We have to assume de-watering of water bearing sands using well points.
a. For our current estimates we will assume the excavations can be de-watered without the need for a cutoff wall. If a cutoff wall is included it could be a significant cost increase over our estimate.
4. Due to hydraulic grade line limitations the maximum excavation depths will be 30 feet, with a majority of excavations about 20 feet in depth. Temporary cut slopes for excavations can be 1.5H:1V. Excavations greater that 7 feet and reaching to 20 feet should have a bench at 5 feet depth for a row of well points. Excavations extending greater than 20 feet should provide another 5 feet wide bench at a depth of 20 feet for another row of well points.
- During peer review the reviewers recommended cut slopes of 2:1 in the stiff clays. Excavation quantities in for options B, C, and D are based on 1.5;1 cut slopes. The extra cost of flattening cut slopes should not be too significant.
5. The plant site is founded in stiff fat clays with swell potential.
- It is recommended to over excavate 4 foot under slabs close to grade and replace with engineered fill or free draining material. - Tank slabs on fat clays should not be backfilled with free draining materials as water
could swell the clays. A mud slab construction consisting of lean concrete or flowable fill should be used for foundations on the stiff clay. Perimeters of larger tank should be constructed with drains and sumps.
6. Summary - Important items for estimating quantities for our options as outlined in this report are: Excavation quantities for deep structures and 4 foot of overexcavation for near grade structures
- Well point system and pumping rates for excavations deeper than 10 feet. - Select backfill for near grade over excavation areas. - Free draining backfill under plant slabs.
- Lean concrete or flowable fill or lean concrete as leveling mud slabs. - Type I/II Modified cement. - Extra structural reinforcement to reduce shrinkage cracking and additional wall and
footing support.

7
- Fat clay backfill and free draining backfill against walls. - Coarse free draining backfill for exterior slabs. - Drain tiles around major tanks. - 7.5 feet embedment depth for exterior piping.
7. Once the excavation outline for dewatering benches is provided, I will have a dewatering expert design the pumping system requirements and costs. cc: 84-21300 (Archives), 86-68120 (Goplen), 86-68230 (Dundorf), 86-68320 (Farrar) WBR:JFarrar:kw:03/29/07:303-445-2333 C:Kwasik:Nawsgeotechmemofinal032907FARRAR

Attachment I Ductile Iron Pipe Memorandum
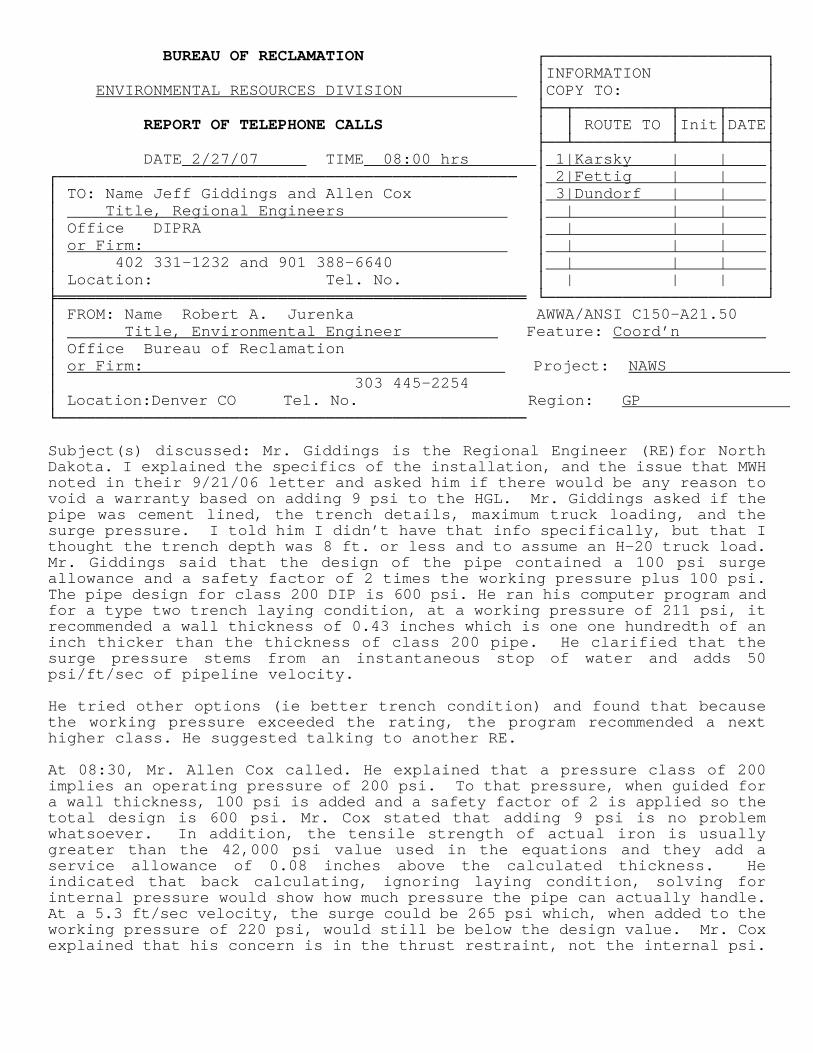
BUREAU OF RECLAMATION ┌───────────────────────┐ │INFORMATION │ ENVIRONMENTAL RESOURCES DIVISION │COPY TO: │ ├──┬──────────┬────┬────┤ REPORT OF TELEPHONE CALLS │ │ ROUTE TO │Init│DATE│ ├──┴──────────┴────┴────┤ DATE 2/27/07 TIME 08:00 hrs │ 1|Karsky | | │ ┌──────────────────────────────────────────────── │ 2|Fettig | | │ │ TO: Name Jeff Giddings and Allen Cox │ 3|Dundorf | | │ │ Title, Regional Engineers │ | | | │ │ Office DIPRA │ | | | │ │ or Firm: │ | | | │ │ 402 331-1232 and 901 388-6640 │ | | | │ │ Location: Tel. No. │ | | | │ ╞═════════════════════════════════════════════════ └───────────────────────┘ │ FROM: Name Robert A. Jurenka AWWA/ANSI C150-A21.50 │ Title, Environmental Engineer Feature: Coord’n │ Office Bureau of Reclamation │ or Firm: Project: NAWS │ 303 445-2254 │ Location:Denver CO Tel. No. Region: GP └───────────────────────────────────────────────── Subject(s) discussed: Mr. Giddings is the Regional Engineer (RE)for North Dakota. I explained the specifics of the installation, and the issue that MWH noted in their 9/21/06 letter and asked him if there would be any reason to void a warranty based on adding 9 psi to the HGL. Mr. Giddings asked if the pipe was cement lined, the trench details, maximum truck loading, and the surge pressure. I told him I didn’t have that info specifically, but that I thought the trench depth was 8 ft. or less and to assume an H-20 truck load. Mr. Giddings said that the design of the pipe contained a 100 psi surge allowance and a safety factor of 2 times the working pressure plus 100 psi. The pipe design for class 200 DIP is 600 psi. He ran his computer program and for a type two trench laying condition, at a working pressure of 211 psi, it recommended a wall thickness of 0.43 inches which is one one hundredth of an inch thicker than the thickness of class 200 pipe. He clarified that the surge pressure stems from an instantaneous stop of water and adds 50 psi/ft/sec of pipeline velocity. He tried other options (ie better trench condition) and found that because the working pressure exceeded the rating, the program recommended a next higher class. He suggested talking to another RE. At 08:30, Mr. Allen Cox called. He explained that a pressure class of 200 implies an operating pressure of 200 psi. To that pressure, when guided for a wall thickness, 100 psi is added and a safety factor of 2 is applied so the total design is 600 psi. Mr. Cox stated that adding 9 psi is no problem whatsoever. In addition, the tensile strength of actual iron is usually greater than the 42,000 psi value used in the equations and they add a service allowance of 0.08 inches above the calculated thickness. He indicated that back calculating, ignoring laying condition, solving for internal pressure would show how much pressure the pipe can actually handle. At a 5.3 ft/sec velocity, the surge could be 265 psi which, when added to the working pressure of 220 psi, would still be below the design value. Mr. Cox explained that his concern is in the thrust restraint, not the internal psi.