waterfowl management program - welcome to nyc. · pdf file13 introduction the management of...
TRANSCRIPT
New York City Department of Environmental Protection Bureau of Water Supply
Waterfowl Management Program
September 30, 2017
Prepared in accordance with Section 4.1 of the NYSDOH Revised 2007 Filtration Avoidance Determination
A Waterfowl Management Program was developed to evaluate and mitigate pollutant impacts (fecal coliform bacteria) from migratory and resident waterbirds (waterfowl, gulls and cormorants). The purpose of this report is to evaluate the trends in bird numbers and their effect on fecal coliform bacteria levels from August 1, 2016 to July 31, 2017
Prepared by: Christopher A. Nadareski, Section Chief, Wildlife Studies DEP, Bureau of Water Supply Division of Watershed Water Quality Operations

Waterfowl Management Program
2
THIS PAGE LEFT INTENTIONALLY BLANK
Filtration Avoidance Determination, Section 4.1, Waterfowl Management Program
3
TABLE OF CONTENTS List of Figures 4-7 List of Tables 8 Acknowledgments 11 Introduction 13-14 Methods 15-22 Results and Discussion 23-69 Conclusions 71-72 References 75-78 Appendix A (reservoir maps with bird zones and water sampling locations) 81-91
Waterfowl Management Program
4
LIST OF FIGURES Page Number Figure 1. Kensico Reservoir waterbird totals. 24 Figure 2. Kensico Reservoir Surface Water Treatment Rule compliance
(fecal coliforms 100mL-1 at DEL18/DEL18DT/DEL18DTD and CATLEFF). 25 Figure 3. DEP contractor staff conducting waterbird dispersal actions discharging
pyrotechnics at Kensico Reservoir. 26 Figure 4. Mute Swan being dispersed by DEP contractors using motorboats at Kensico. 28 Figure 5. Kensico Reservoir fecal coliforms 100mL-1 at DEL18DT
vs. total waterbirds (8/1/2016 to 7/31/2017). 29 Figure 6. Kensico Reservoir fecal coliforms 100mL-1 at DEL18/DEL18DT vs. total
waterbirds (8/1/2015 to 7/31/2016). 30 Figure 7. Kensico Reservoir total annual waterbirds (8/1/2015 to 7/31/2016). 30 Figure 8. Kensico Reservoir total annual waterbirds (8/1/2016 to 7/31/2017). 31 Figure 9. Kensico Reservoir Bird Zone 2 waterbirds (8/1/2016 to 7/31/2017). 31 Figure 10. Kensico Reservoir Bird Zone 3 waterbirds (8/1/2016 to 7/31/2017). 32 Figure 11. Kensico Reservoir Bird Zone 4 waterbirds (8/1/2016 to 7/31/2017). 32 Figure 12. a. Herring Gull, b. Great Black-backed Gull, and c. Ring-billed Gull 33 Figure 13. Biondo Airboat for bird dispersal activities at Kensico. 34 Figure 14. Kensico Reservoir total waterbirds by groups (8/1/2015 to 7/31/2016). 35 Figure 15. Kensico Reservoir total waterbirds by groups (8/1/2016 to 7/31/2017). 35 Figure 16. a. DEP conducting Canada goose egg depredation via puncturing method
at Kensico Reservoir and b. probe used to puncture viable eggs. 37 Figure 17. Whitetail deer scat identified and collected at Kensico for pre-storm
Sanitary surveys. 38
Filtration Avoidance Determination, Section 4.1, Waterfowl Management Program
5
LIST OF FIGURES (continued) Page Number Figure 18. West Branch Reservoir total waterbirds (8/1/2015 to 4/15/2016). 42 Figure 19. West Branch Reservoir total waterbirds (8/1/2016 to 4/15/2017). 42 Figure 20. West Branch Reservoir fecal coliforms 100mL-1 at CWB1.5 vs.
total waterbirds (8/1/2012 to 7/31/2017). 43 Figure 21. Rondout Reservoir fecal coliforms 100mL-1 at Rondout Effluent vs.
total waterbirds (8/1/2012 to 7/31/2017). Waterbird surveys were discontinued on 4/30/2013. 45
Figure 22. Public viewing of the Bald Eagle nest at Rondout Reservoir. 47 Figure 23. Ashokan Reservoir fecal coliforms 100mL-1 at Ashokan Effluent (EARCM)
vs. total waterbirds (8/1/2012 to 7/31/2017). Waterbird surveys were discontinued on 4/30/2013. 50
Figure 24. Bald Eagle nesting at the Ashokan Reservoir West Basin. 51 Figure 25. Croton Falls Reservoir fecal coliforms 100mL-1 at Croton Falls Effluent
vs. total waterbirds (8/1/2012 to 7/31/2017). Waterbird surveys were discontinued on 4/30/2013. 52
Figure 26. Pair of Mute Swans nesting on NYC Reservoirs. 53 Figure 27. Cross River Reservoir fecal coliforms 100mL-1 at Cross River Effluent
vs. total waterbirds (8/1/2012 to 7/31/2017). Waterbird surveys were discontinued on 4/30/2013. 54
Figure 28. Reservoir islands are often used by Canada Geese to nest. 55 Figure 29. Overhead bird deterrent wires installed on 15’ stanchions with Daddy-
Long-Legs installed to prevent waterbirds from roosting and loafing 57 Figure 30. Dispersal of Ruddy Ducks using remote control motorboats and
pyrotechnics. 58
Waterfowl Management Program
6
LIST OF FIGURES (continued) Page Number Figure 31. Hillview Reservoir total waterbirds nocturnal counts (8/1/2016 to 7/31/2017). 59 Figure 32. Hillview Reservoir total waterbirds diurnal counts (8/1/2016 to 7/31/2017). 59 Figure 33. Hillview Reservoir number of positive E. coli (grab sample) at water
Sampling Site 1 (8/1/2016 to 7/31/2017). 61 Figure 34. Hillview Reservoir number of positive E. coli (grab sample) at water
Sampling Site 3 versus total waterbirds (8/1/2016 to 7/31/2017). 61 Figure 35. Wildlife Studies staff setting mammal traps (left) and Eastern Gray Squirrel
Caught on remote sensing camera (right) 64 Figure 36. Mammal species trapped at Hillview Reservoir (8/1/2016 to 7/31/2017). 67 Figure 37. Occurrences of remote nighttime photography of animals recorded on the
reservoir catwalk and dividing wall versus trapping success (8/1/2016 to 7/31/2017). 67
Figure 38. Mallard ducklings hatch at Hillview before being transported to a
Wildlife rehabilitation facility. 68 Figure 39. Coyotes photographed on a remote sensing camera along the outer
Perimeter fence. 69

Filtration Avoidance Determination, Section 4.1, Waterfowl Management Program
7
LIST OF FIGURES (continued) Page Number Appendix A. 81 Figure 40. Map of New York City Water Supply – East of Hudson. 82 Figure 41. Map of New York City Water Supply – West of Hudson. 83 Figure 42. Map of Kensico Reservoir bird zones. 84 Figure 43. Map of West Branch Reservoir bird zones. 85 Figure 44. Map of Rondout Reservoir bird zones. 86 Figure 45. Map of Ashokan Reservoir bird zones. 87 Figure 46. Map of Croton Falls Reservoir bird zones. 88 Figure 47. Map of Cross River Reservoir bird zones. 89 Figure 48. Map of Hillview Reservoir bird zones. 90 Figure 49. Map of Hillview Reservoir water sampling locations. 91

Waterfowl Management Program
8
List of Tables Page Number Table 1. Revised 2007 FAD Activity and reporting requirements (NYSDOH 2014) 16 Table 2. Frequency of bird observation surveys by reservoir 2016/2017 17 Table 3. Reservoir bird mitigation (8/1/2016 – 7/31/2017) 20 Table 4. 2017 Canada Geese, Mute Swan, and Mallard nest census and egg-
depredation 22
Table 5. Highest fecal coliforms 100mL-1 results, precipitation events, and bird counts at Kensico Reservoir keypoint water sampling locations (DEL18DT) 27
Table 6. Wildlife sanitary surveys conducted at DEL18DT Effluent 38 Table 7. West Branch Reservoir - Daytime bird observations at Delaware
Effluent (Shaft 10) 41 Table 8. Rondout Reservoir - Daytime bird observations at Rondout Effluent 46 Table 9. Ashokan Reservoir - Daytime bird observations at Ashokan East
Effluent 48 Table 10. Ashokan Reservoir - Daytime bird observations at Ashokan West
Effluent 49 Table 11. Mammal trapping summary 8/1/2016 through 7/31/2017 65
Table 12. Trapping success summary for Hillview Reservoir (August 2011 to
July 2017) 66

Filtration Avoidance Determination, Section 4.1, Waterfowl Management Program
9
THIS PAGE LEFT INTENTIONALLY BLANK

Waterfowl Management Program
10
THIS PAGE LEFT INTENTIONALLY BLANK

Filtration Avoidance Determination, Section 4.1, Waterfowl Management Program
11
ACKNOWLEDGMENTS Special thanks to DEP wildlife biologists Mike Reid and Sean Camillieri, Wildlife
Studies Section, who reviewed this document, assisted with data collection and analysis, and participated in contract management.
Thanks goes to the DEP contractor, HDR – Henningson, Durham, and Richardson P.C. (HDR), including James Morrison, (Vice President and contract Project Manager), Katherine Drury, (contract Assistant Project Manager), Don Henshaw, (Laboratory Director), Ben Wood, (Field Site Supervisor), and numerous other HDR contractor staff for implementing the Waterfowl Management Program Contract.
Thanks to Lori Emery, Chief of Watershed Water Quality Operations (WWQO) for a critical review of the document and logistical support and Steven Schindler, Director of Water Quality, DEP Bureau of Water Supply (BWS), for document review. Additional thanks to Andrew P. Bader, Deputy Chief, WWQO, Dale Borchert, Deputy Chief, WWQO, and Brian O’Malley, Section Chief, Data Management, WWQO, and staff from WWQO field and laboratory for providing water quality data for Kensico, West Branch, Rondout, Ashokan, Croton Falls, and Cross River Reservoirs. Thanks to the Aqueduct Monitoring Group, WWQO for daytime bird counts. Thanks to Salome Freud, Chief, Distribution Water Quality Operations (DWQO), Virginia Murray, Deputy Chief, DWQO, Aspa Capetanakis, Research Scientist, DWQO, and DWQO staff for providing Hillview Reservoir water quality data. Thanks to Will Melendez, Chief – Water Treatment Operations South and operations staff from DEP Bureau of Water Supply for maintenance of the bird deterrent equipment at Hillview Reservoir. Thanks to the Source Water Operations Directorate (James Porter, PhD, Kenneth DeRose, and Glenn Horton) for meteorological data. Noted thanks to Karen Moore, PhD and Jim Mayfield from Water Quality Science and Research for assistance on a variety of data questions and document formatting.
DEP would also like to acknowledge the United States Department of Agriculture, Animal and Plant Health Inspection Service, Wildlife Services (USDA), NYS Director, Allen Gosser and staff for implementation of the Hillview Duck Management Contract. The author, Mr. Christopher A. Nadareski, is a City Research Scientist and DEP’s Section Chief of Wildlife Studies and Contract Project Manager. He is responsible for the Waterfowl Management Program development and implementation including data management, field data collection, and contract administration.
Waterfowl Management Program
12
THIS PAGE LEFT INTENTIONALLY BLANK
Filtration Avoidance Determination, Section 4.1, Waterfowl Management Program
13
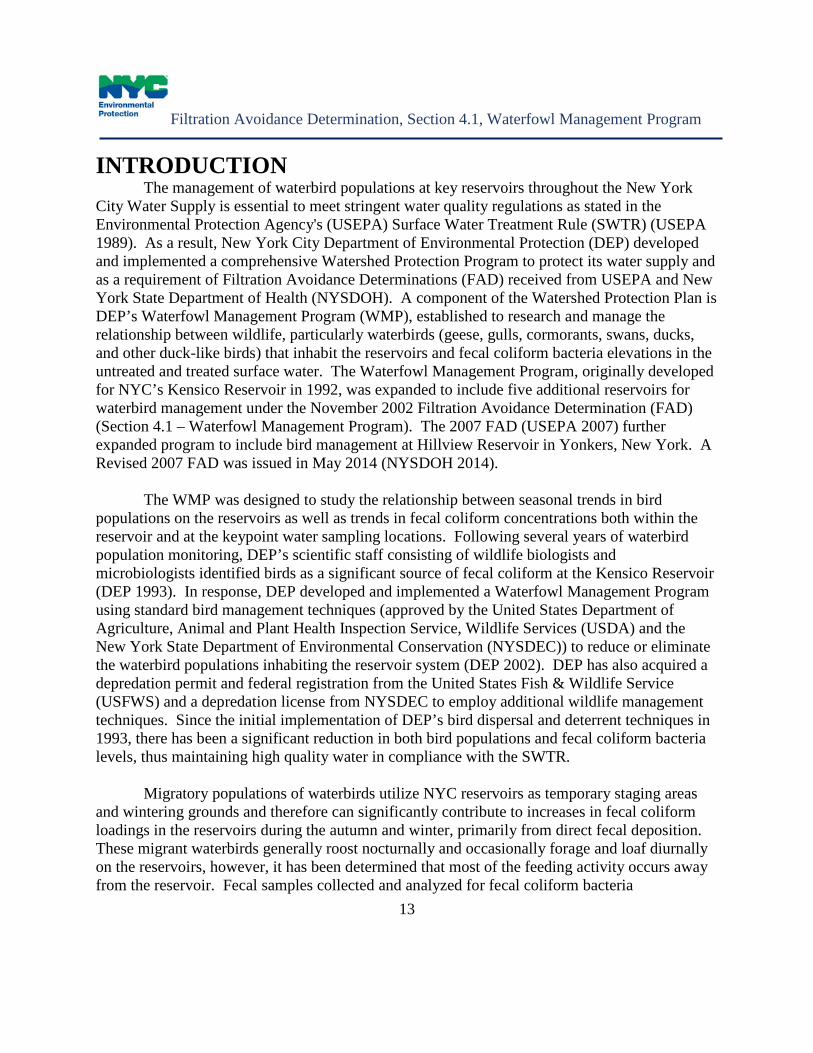
INTRODUCTION The management of waterbird populations at key reservoirs throughout the New York
City Water Supply is essential to meet stringent water quality regulations as stated in the Environmental Protection Agency's (USEPA) Surface Water Treatment Rule (SWTR) (USEPA 1989). As a result, New York City Department of Environmental Protection (DEP) developed and implemented a comprehensive Watershed Protection Program to protect its water supply and as a requirement of Filtration Avoidance Determinations (FAD) received from USEPA and New York State Department of Health (NYSDOH). A component of the Watershed Protection Plan is DEP’s Waterfowl Management Program (WMP), established to research and manage the relationship between wildlife, particularly waterbirds (geese, gulls, cormorants, swans, ducks, and other duck-like birds) that inhabit the reservoirs and fecal coliform bacteria elevations in the untreated and treated surface water. The Waterfowl Management Program, originally developed for NYC’s Kensico Reservoir in 1992, was expanded to include five additional reservoirs for waterbird management under the November 2002 Filtration Avoidance Determination (FAD) (Section 4.1 – Waterfowl Management Program). The 2007 FAD (USEPA 2007) further expanded program to include bird management at Hillview Reservoir in Yonkers, New York. A Revised 2007 FAD was issued in May 2014 (NYSDOH 2014).
The WMP was designed to study the relationship between seasonal trends in bird populations on the reservoirs as well as trends in fecal coliform concentrations both within the reservoir and at the keypoint water sampling locations. Following several years of waterbird population monitoring, DEP’s scientific staff consisting of wildlife biologists and microbiologists identified birds as a significant source of fecal coliform at the Kensico Reservoir (DEP 1993). In response, DEP developed and implemented a Waterfowl Management Program using standard bird management techniques (approved by the United States Department of Agriculture, Animal and Plant Health Inspection Service, Wildlife Services (USDA) and the New York State Department of Environmental Conservation (NYSDEC)) to reduce or eliminate the waterbird populations inhabiting the reservoir system (DEP 2002). DEP has also acquired a depredation permit and federal registration from the United States Fish & Wildlife Service (USFWS) and a depredation license from NYSDEC to employ additional wildlife management techniques. Since the initial implementation of DEP’s bird dispersal and deterrent techniques in 1993, there has been a significant reduction in both bird populations and fecal coliform bacteria levels, thus maintaining high quality water in compliance with the SWTR.
Migratory populations of waterbirds utilize NYC reservoirs as temporary staging areas and wintering grounds and therefore can significantly contribute to increases in fecal coliform loadings in the reservoirs during the autumn and winter, primarily from direct fecal deposition. These migrant waterbirds generally roost nocturnally and occasionally forage and loaf diurnally on the reservoirs, however, it has been determined that most of the feeding activity occurs away from the reservoir. Fecal samples collected and analyzed for fecal coliform bacteria

Waterfowl Management Program
14
concentrations from both Canada Geese (Branta canadensis) and Ring-billed Gulls (Larus delawarensis) revealed that fecal coliform concentrations are high per gram of feces. Alderisio and DeLuca (1999) sampled 236 Canada Geese and 249 Ring-billed Gulls to determine fecal coliform counts per gram of feces. The results identified average bacteria levels as follows: Canada Geese (1.53 x 10⁴ FC/g) and for Ring-billed Gulls (3.68 x 10⁸ FC/g).
Water samples collected near waterbird roosting locations have shown fecal coliform
increases concurrent with waterbird populations at several NYC reservoirs in annual DEP reports (DEP 1992 - 2016). Since waterbirds have been associated with elevated fecal coliform bacteria levels found in various reservoirs and lakes (Gould and Fletcher 1978, Hussong et al. 1979, Standridge et al. 1979, Benton, et al. 1983, DEP 1992 and 1993, Levesque et al. 1993, Hatch, 1996), a program to discourage waterbird activity was developed for Kensico Reservoir in the autumn of 1993 and is expected to continue indefinitely. The bird dispersal program was expanded in 2004 to allow for “as-needed” waterbird management at five additional reservoirs (Rondout, West Branch, Ashokan, Croton Falls, and Cross River). Since that time, the “as-needed” program has been implemented six times with actions at Rondout Reservoir during the winters of 2002/2003, 2003/2004 and 2005/2006, West Branch Reservoir in 2007 and 2010/2011, and at Croton Falls Reservoir (conducted under an emergency program prior to the issuance of the Final Environmental Impact Statement) during the winter of 2001/2002. To assure DEP’s program activities remained in compliance with all federal, state, and local laws including effects on local communities and environmental conditions including endangered species, an Environmental Impact Statement was completed for Kensico in 1996 and second one in the spring of 2004 for the five additional “as-needed” reservoirs. The Final Environmental Impact Statement including a “findings statement” can be found on the DEP website identifying program impacts and required mitigation to meeting implementation standards for the expanded WMP (DEP 2004). This report is a requirement of the current Revised 2007 FAD.
The purpose of this report is to evaluate further the downtrend observed in waterbird populations and its impact on fecal coliform bacteria concentrations because of DEP’s Waterfowl Management Program for the period August 1, 2016 through July 31, 2017.

Filtration Avoidance Determination, Section 4.1, Waterfowl Management Program
15
METHODS Waterfowl Management Program
The Waterfowl Management Program was initiated in 1993 by the City for the Kensico Reservoir in response to elevated fecal coliform bacteria levels contained in the Reservoir. DEP determined that the water leaving Kensico reported higher levels of bacteria than the water entering Kensico from source reservoirs and as a result focused on identifying and mitigating local inputs of bacterial pollution (DEP 1992). Preliminary waterbird surveys conducted by DEP staff in 1992 demonstrated a seasonality effect with increased numbers of roosting birds and elevated fecal coliform bacteria levels. By December 1993, DEP started a daily (24-hour/day) program which was further refined to a pre-dawn to post-dusk bird dispersal effort in 1994. The bird dispersal program evolved into a tri-season effort from August through March annually. The program was subsequently expanded to include additional reservoirs.
The 2002 FAD required that the City continue this program for the Kensico Reservoir on
an annual basis and expand the program to an “as-needed” basis for five additional reservoirs. Three of these five reservoirs (West Branch, Rondout, and Ashokan) routinely supply Kensico with its source water (Figures 40 and 41). The remaining two reservoirs (Cross River and Croton Falls), while in the Croton System (Figure 40), may also provide Kensico with source water under certain conditions and with permission from the New York State Department of Health. The objective of the program is to minimize the fecal coliform loading to the reservoirs that result from roosting birds during the migratory season. The program includes three activities: avian population monitoring, avian dispersal activities (motorboats, airboats, propane cannons, physical chasing, remote control motorboats, and pyrotechnics) and avian deterrence (depredation of nests and eggs, bird exclusion wires, and netting at critical intake chambers). All avian dispersal techniques and deterrence activities have been recommended and approved by USDA and NYSDEC.
The City’s 2006 Long-Term Watershed Protection Program expanded the Waterfowl Management Program to include “as-needed” avian dispersal activities for the Hillview Reservoir as well as avian deterrent measures for Hillview and other City reservoirs. The term "as-needed" refers to implementation of avian management measures based on the following criteria:
• Fecal coliform bacteria concentrations approaching or exceeding 20 colony-forming units per 100 milliliters at reservoir effluent structures coincident with elevated bird populations;
• Current bird populations, including roosting or staging locations relative to water intakes; • Recent weather events; • Operational flow conditions within the reservoir (i.e. elevations and flow patterns and
amounts);
Waterfowl Management Program
16
• Reservoir ice coverage and watershed snow cover; and • An assessment that active bird management measures would be effective in reducing bird
populations and fecal coliform bacteria levels.
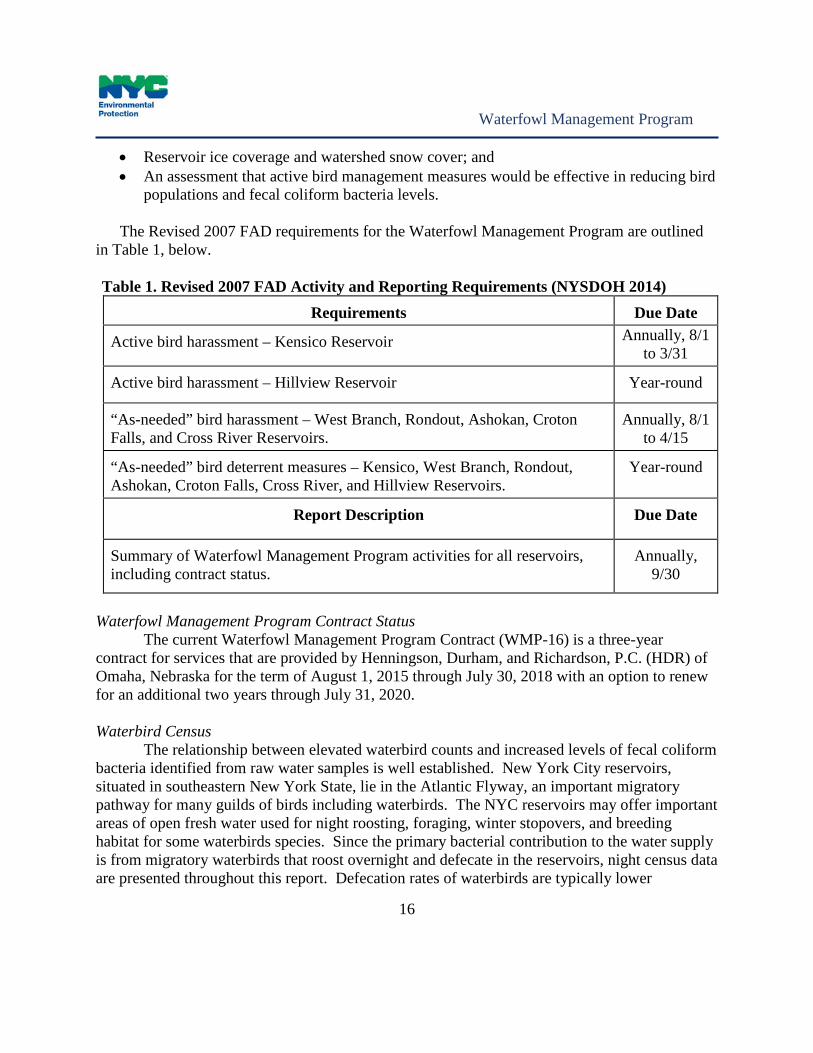
The Revised 2007 FAD requirements for the Waterfowl Management Program are outlined in Table 1, below.
Table 1. Revised 2007 FAD Activity and Reporting Requirements (NYSDOH 2014)
Requirements Due Date
Active bird harassment – Kensico Reservoir Annually, 8/1 to 3/31
Active bird harassment – Hillview Reservoir Year-round
“As-needed” bird harassment – West Branch, Rondout, Ashokan, Croton Falls, and Cross River Reservoirs.
Annually, 8/1 to 4/15
“As-needed” bird deterrent measures – Kensico, West Branch, Rondout, Ashokan, Croton Falls, Cross River, and Hillview Reservoirs.
Year-round
Report Description Due Date
Summary of Waterfowl Management Program activities for all reservoirs, including contract status.
Annually, 9/30
Waterfowl Management Program Contract Status
The current Waterfowl Management Program Contract (WMP-16) is a three-year contract for services that are provided by Henningson, Durham, and Richardson, P.C. (HDR) of Omaha, Nebraska for the term of August 1, 2015 through July 30, 2018 with an option to renew for an additional two years through July 31, 2020. Waterbird Census
The relationship between elevated waterbird counts and increased levels of fecal coliform bacteria identified from raw water samples is well established. New York City reservoirs, situated in southeastern New York State, lie in the Atlantic Flyway, an important migratory pathway for many guilds of birds including waterbirds. The NYC reservoirs may offer important areas of open fresh water used for night roosting, foraging, winter stopovers, and breeding habitat for some waterbirds species. Since the primary bacterial contribution to the water supply is from migratory waterbirds that roost overnight and defecate in the reservoirs, night census data are presented throughout this report. Defecation rates of waterbirds are typically lower
Filtration Avoidance Determination, Section 4.1, Waterfowl Management Program
17
nocturnally than diurnally due to reduced foraging and physical activity, and overnight roosting involves longer periods of time during which the birds habituate on the reservoirs (DEP 1993).
Daily waterbird observations were conducted at predawn hours (between 4:30am and
8:00am E.S.T.) and post dusk hours (between 5:00pm and 10:00pm E.S.T.) to determine overnight waterbird roosting populations and to evaluate the success of the dispersal activities from the previous day (where applicable) at all reservoirs. Survey times (pre-dawn and post-dusk) vary seasonally reflecting available daylight hours. For successful data collection, ideal weather and atmospheric conditions were necessary. Some precipitation events and fog prohibited data collection and resulted in short gaps of “no data”. Reservoir maps with geographic bird zones can be found in Appendix A.
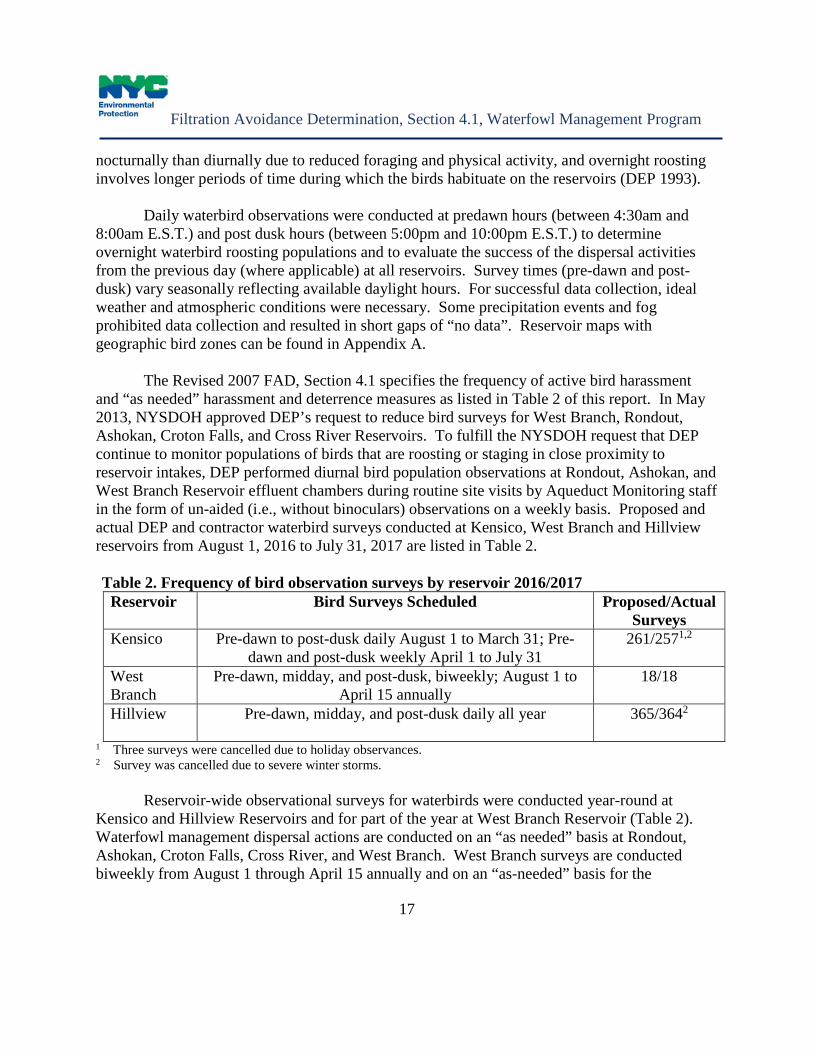
The Revised 2007 FAD, Section 4.1 specifies the frequency of active bird harassment and “as needed” harassment and deterrence measures as listed in Table 2 of this report. In May 2013, NYSDOH approved DEP’s request to reduce bird surveys for West Branch, Rondout, Ashokan, Croton Falls, and Cross River Reservoirs. To fulfill the NYSDOH request that DEP continue to monitor populations of birds that are roosting or staging in close proximity to reservoir intakes, DEP performed diurnal bird population observations at Rondout, Ashokan, and West Branch Reservoir effluent chambers during routine site visits by Aqueduct Monitoring staff in the form of un-aided (i.e., without binoculars) observations on a weekly basis. Proposed and actual DEP and contractor waterbird surveys conducted at Kensico, West Branch and Hillview reservoirs from August 1, 2016 to July 31, 2017 are listed in Table 2. Table 2. Frequency of bird observation surveys by reservoir 2016/2017
Reservoir Bird Surveys Scheduled Proposed/Actual Surveys
Kensico Pre-dawn to post-dusk daily August 1 to March 31; Pre-dawn and post-dusk weekly April 1 to July 31
261/2571,2
West Branch
Pre-dawn, midday, and post-dusk, biweekly; August 1 to April 15 annually
18/18
Hillview Pre-dawn, midday, and post-dusk daily all year 365/3642
1 Three surveys were cancelled due to holiday observances. 2 Survey was cancelled due to severe winter storms.
Reservoir-wide observational surveys for waterbirds were conducted year-round at Kensico and Hillview Reservoirs and for part of the year at West Branch Reservoir (Table 2). Waterfowl management dispersal actions are conducted on an “as needed” basis at Rondout, Ashokan, Croton Falls, Cross River, and West Branch. West Branch surveys are conducted biweekly from August 1 through April 15 annually and on an “as-needed” basis for the

Waterfowl Management Program
18
remainder of the year. Surveys of Rondout, Ashokan, Croton Falls, and Cross River Reservoirs are conducted on an as-needed basis.
For each survey the following parameters were recorded: species evenness (number per
species), species richness (species diversity), roosting and foraging locations, flight patterns into and out of the reservoir, bird band/collar identifications, general behavior during the overnight roosting period, environmental conditions, and ice-cover. Waterbird data were collected from shoreline locations and/or watercraft (motorboat, Jon boat, or airboat) by a trained wildlife biologist, ornithologist, or wildlife technician using binoculars and spotting scopes. DEP amended the collection of field data progressing from data sheets to field ToughPads to record observation locations with times for each reservoir. Data were entered in an Excel spreadsheet and were checked twice for Quality Assurance/Quality Control.
Each survey data point can consist of a minimum of one or two site visits per datum
reported (i.e. night before and morning after the nightly roost), and may be dependent on the field conditions (i.e. weather, fog), reservoir physical characteristics (i.e. drought, ice cover), and time of year (leaf-cover or not). Data collected during reservoir-wide surveys that were incomplete due to inclement weather were not reported. Only high counts for each category of waterbirds were used for data recording. For example, if there were a count of 20 Canada Geese during the post-dusk survey and a count of 20 ducks observed at the pre-dawn survey, the combination of 20 geese and 20 ducks would give a reservoir-wide total of 40 birds. The purpose of using two surveys for data collection is to determine the species highest concentrations over a specific time period. At certain times of the year, some species are easier to count in the evening when birds are flying into roost areas (or open water) whereas other species are easier to count when flying out of the reservoir in the early morning.
Waterbird population zones were delineated at all reservoirs to identify local impacts on water quality and the results have been described in previous DEP reports for Kensico and West Branch Reservoirs (DEP 1994, 1995, 1997a). Fecal Coliform Bacteria Data
Data reported on fecal coliform bacteria concentrations for both keypoint raw water samples (aqueduct and outflows) and reservoir samples have been reviewed by DEP laboratory and field personnel. The following conditions apply to the water quality data included in this report:
• Only high concentration duplicate samples are reported (for example if two keypoint samples were collected in a single day, or if more than one sample is collected at different depths at a single limnology sampling location, the highest bacteria count has been reported)
• All water samples reported below the detection limit of 1 fecal coliform 100mL-1 were non-detected
Filtration Avoidance Determination, Section 4.1, Waterfowl Management Program
19
• All special investigation samples are reported • Reanalysis samples are reported • There were no samples with confluent growth reported
Water quality data presented in this report were from samples collected, analyzed and
reported by DEP’s Watershed Water Quality Operations and Distribution Water Quality Operations personnel from four New York State Department of Health (NYSDOH) Environmental Laboratory Approval Program (ELAP) certified laboratories in Hawthorne, Kingston, Grahamsville, and Queens, New York. DEP watershed laboratory personnel utilized the Membrane Filtration Technique (APHA 1997, 2006) for fecal coliform analyses. DEP’s Distribution Laboratory personnel utilized the Colilert18 with Quantitray for E.coli analyses for samples collected at Hillview Reservoir. Reservoir-wide waterbird survey results are presented with fecal coliform bacteria levels at keypoint (outflow).
Precipitation Data
Precipitation data used in this report for the Kensico Reservoir were provided by DEP’s Bureau of Water Supply Source Water Operations Directorate staff and were recorded at the Westchester County Airport meteorological station, located in White Plains, New York, adjacent to Kensico Reservoir and at the DEP Meteorological Station at DEL18DT Effluent. Waterbird Dispersal and Deterrent Techniques
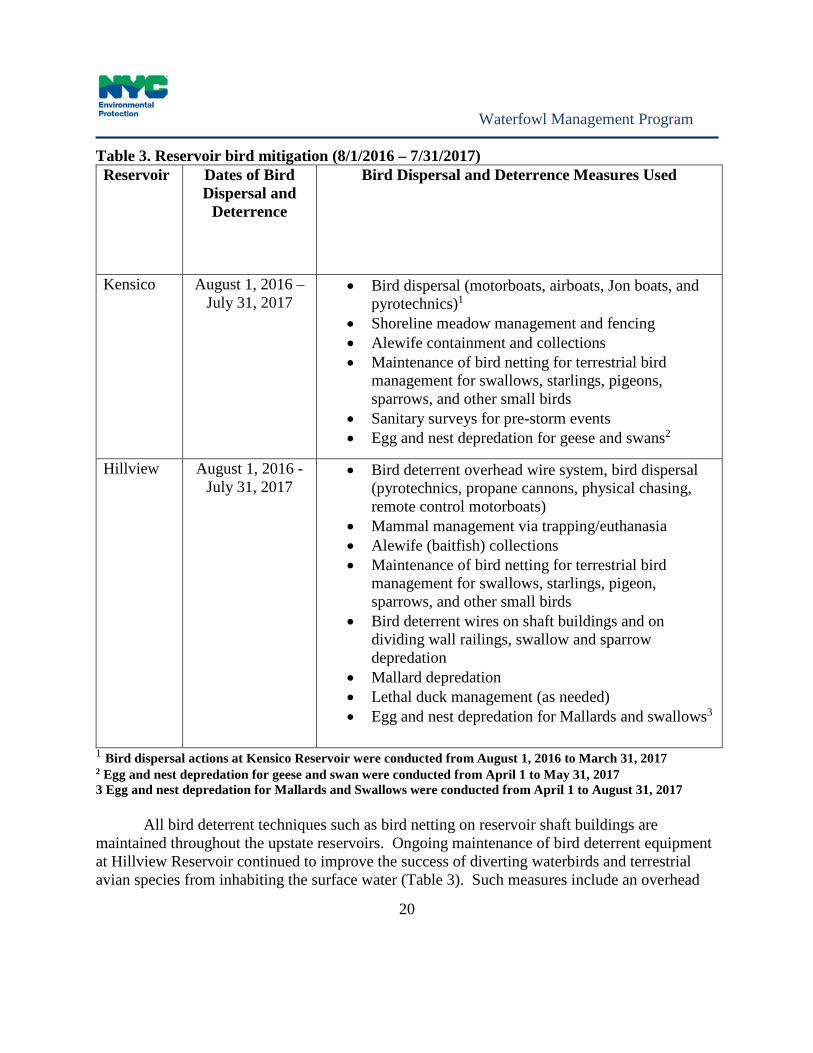
The list of bird mitigation activities conducted since 2002 is presented in Table 3. Waterbird dispersal techniques were employed at Kensico Reservoir from August 1, 2016 through March 31, 2017 using motorboats, airboats, Jon boats, and noisemakers (pyrotechnics include bird bangers, screamers, and CAPA’s). At Hillview Reservoir, pyrotechnics, physical chasing, propane cannons, and remote-control motorboats were used as deemed necessary on a daily basis year-around during this reporting period. Dispersal techniques were conducted under a DEP Waterfowl Management Program contract (WMP-16) and by DEP staff. Beginning at 8:00am and continuing until approximately 1.5 hours past sunset, bird dispersal activities were conducted reservoir-wide, targeting all species except those with a federal or NYS endangered or threatened status such as N.Y.S. threatened Pied-billed Grebe (Podilymbus podiceps), Bald Eagle (Haliaeetus leucocephalus), and N.Y.S endangered Peregrine Falcon (Falco peregrinus).
Airboats, capable of operating over ice and water interfaces with ease, were available for
bird dispersal in 2016/2017 at Kensico. The airboats have heated cabins that allow contractor personnel longer time periods of bird dispersal operations during reservoir freezing periods throughout the winter. In addition, an Intergovernmental Cooperative Service Agreement contract has been continued with USDA to conduct lethal management of the resident duck population at Hillview Reservoir. Details of the contract work will be discussed in the Hillview Reservoir section of this report.
Waterfowl Management Program
20
Table 3. Reservoir bird mitigation (8/1/2016 – 7/31/2017) Reservoir Dates of Bird
Dispersal and Deterrence
Bird Dispersal and Deterrence Measures Used
Kensico August 1, 2016 – July 31, 2017
• Bird dispersal (motorboats, airboats, Jon boats, and pyrotechnics)1
• Shoreline meadow management and fencing • Alewife containment and collections • Maintenance of bird netting for terrestrial bird
management for swallows, starlings, pigeons, sparrows, and other small birds
• Sanitary surveys for pre-storm events • Egg and nest depredation for geese and swans2
Hillview August 1, 2016 - July 31, 2017
• Bird deterrent overhead wire system, bird dispersal (pyrotechnics, propane cannons, physical chasing, remote control motorboats)
• Mammal management via trapping/euthanasia • Alewife (baitfish) collections • Maintenance of bird netting for terrestrial bird
management for swallows, starlings, pigeon, sparrows, and other small birds
• Bird deterrent wires on shaft buildings and on dividing wall railings, swallow and sparrow depredation
• Mallard depredation • Lethal duck management (as needed) • Egg and nest depredation for Mallards and swallows3
1 Bird dispersal actions at Kensico Reservoir were conducted from August 1, 2016 to March 31, 2017 2 Egg and nest depredation for geese and swan were conducted from April 1 to May 31, 2017 3 Egg and nest depredation for Mallards and Swallows were conducted from April 1 to August 31, 2017
All bird deterrent techniques such as bird netting on reservoir shaft buildings are maintained throughout the upstate reservoirs. Ongoing maintenance of bird deterrent equipment at Hillview Reservoir continued to improve the success of diverting waterbirds and terrestrial avian species from inhabiting the surface water (Table 3). Such measures include an overhead
Filtration Avoidance Determination, Section 4.1, Waterfowl Management Program
21
bird deterrent wire system and dividing wall bird exclusion wire system at Hillview, bird netting covering effluent building intake openings, and removal of baitfish entering the reservoir from aqueducts.
In response to entrainment of Alewives (Alosa pseudoharengus) and other bait-sized fish
species into the water intake structures at Ashokan Reservoir and their subsequent outflow at Kensico Reservoir, DEP’s Waterfowl Management contractor installs a temporary collection boom as deemed necessary around the Catskill Influent Chamber structure (CATIC) so that dead fish can be removed. Collection of Alewives and other bait-sized fish is also conducted as needed from the Hillview Reservoir dividing wall using landing nets to retrieve all dead floating fish since they are an attractive food source for avian piscivorous species such as gulls and some species of ducks like the Common Merganser (Mergus merganser). Waterbird Reproductive Management
Canada Geese and Mute Swan (Cygnus olor) egg and nest depredation techniques were conducted during the spring of 2017 to help reduce fecundity at critical NYC reservoirs (Table 4). Mallard (Anas platyrhynchos) nests, including one adult Mallard at Hillview Reservoir, were depredated under a federal USFWS depredation permit. Egg and nest depredation involved locating Canada Geese, Mallard, and Mute Swan nests on NYC reservoir property, numbering each nest and egg, and puncturing each egg with a probe to break the membrane thereby destroying the embryo. Eggs were then replaced in the nest to allow incubation to continue, but unsuccessfully without development. A small number of goose nests were often destroyed late in the breeding season to encourage the birds to relocate off reservoir property during the annual post-nuptial molt when the birds are rendered flightless for a few weeks.
Fifty-three Canada Geese nests containing 235 eggs were depredated (punctured) at six
New York City Reservoirs (Table 4) during the spring of 2017 compared to 49 Canada Geese nests containing 230 eggs in 2016. There was no goose or swan breeding activity recorded at Hillview; however, six Mallard nests containing 38 eggs were depredated by DEP in 2017 compared to four Mallard nests containing 15 eggs in 2016. One adult Mallard was depredated in 2017. All Canada Geese depredation activity was conducted under the terms of Federal Registration (#RG-01040A) from the United States Department of the Interior, United States Fish & Wildlife Service. A NYSDEC permit (#2395) was acquired for Mute Swans egg and nest depredation and a USFWS Permit (MB789947-0) covered Mallard and swallow depredation work at Hillview. DEP conducted 261 surveys for nesting Mallards at Hillview Reservoir in 2017. DEP did not conduct Canada Geese or Double-crested Cormorant bandings in 2017.

Waterfowl Management Program
22
Table 4. 2017 Canada Geese, Mute Swan, and Mallard2 nest census and egg-depredation Reservoir Number
of Surveys
Canada Geese/Mute
Swan/2Mallard Nests
Canada Geese/Mute
Swan/2Mallard Eggs Depredated
Canada Geese/Mute
Swan/Mallard Depredation Success Rate
Kensico 9 17/1/NA 75/13/NA 100 percent (0 goslings)/100
percent (0 cygnets)/NA
West Branch 9 6/0/NA 29/0/NA 100 percent (0 goslings)/NA/NA
Rondout1 4 4/0/NA 11/0/NA 100 percent (0 goslings)/NA/NA
Ashokan 4 11/0/NA 54/0/NA 78 percent (15 goslings)/NA/NA
Croton Falls 9 9/1/NA 46/8/NA 94 percent (3 goslings)/89 percent (1
cygnet)/NA
Cross River 9 6/0/NA 20/0/NA 91 percent (2 goslings)/NA/NA
Hillview 261 0/0/6 0/0/38 NA/NA/ 72 percent (15 ducklings)
1 Nest depredation for Canada Geese was restricted due to nesting Bald Eagles. 2 Mallard nest depredation only conducted at Hillview Reservoir.

Filtration Avoidance Determination, Section 4.1, Waterfowl Management Program
23
RESULTS and DISCUSSION 1. Kensico Reservoir
Kensico Reservoir, a terminal reservoir in the New York City Water Supply System, typically receives water from Rondout and West Branch Reservoirs via the Delaware Aqueduct and from the Ashokan Reservoir via the Catskill Aqueduct (Appendix A, Figures 40 and 41). Water from the Delaware Aqueduct can also be delivered through the Catskill Aqueduct through an interconnecting shaft (Shaft 4 Interconnection) and Croton Falls and Cross River Reservoirs can be delivered to Kensico via the Delaware Aqueduct during times of drought or other operational changes.
Water leaving Kensico is disinfected with chlorine and ultraviolet light prior to being
delivered to Hillview Reservoir via the Delaware and Catskill Aqueducts. Kensico Reservoir has been divided into eight geographic Bird Zones to compare bird counts and water quality in samples collected at limnological sampling locations (Appendix A, Figure 42). Waterbird numbers at Kensico Reservoir remained consistently low throughout the reporting period because of continued implementation of the Waterfowl Management Program (Figure 1). The geographic configuration of Kensico includes two main open water areas, one in Bird Zone 4 and one in Bird Zone 6 (Appendix A, Figure 42). These open water areas tend to attract concentrations of gulls and other waterbirds roosting overnight.
Prior to the late summer of 1993, elevated levels of fecal coliform bacteria in raw water
compliance samples at Kensico’s two water effluent facilities caused DEP to employ water by-pass operations whereby the two primary sources of water to Kensico (i.e., Rondout and Ashokan) were being sent directly to Hillview Reservoir. By-pass operations were implemented at Kensico to ensure compliance with the Surface Water Treatment Rule since it was determined that fecal coliform 100mL-1 levels entering Kensico from the upstate reservoirs were lower than the levels leaving Kensico. In early December 1993, at the time when DEP was utilizing the by-pass operational option at Kensico, a nor’easter with associated high precipitation caused elevated turbidity in the two upstate aqueducts entering Kensico that forced DEP to cease by-pass operations. While operating Kensico in reservoir mode rather than bypass mode helped minimize the risk of exceeding the SWTR criteria for turbidity, it also placed DEP at risk for non-compliance with the SWTR criteria for fecal coliform bacteria. To address these competing priorities, DEP developed and implemented a reservoir-wide bird dispersal program under the premise that birds were responsible for the bacterial elevations.
The initial bird dispersal program used a combination of motorboats, propane cannons,
and bird-distress tapes 24 hours/day and 7 days/week. This comprehensive effort resulted in an immediate reduction of fecal coliform bacteria levels at the Catskill Lower Effluent Chamber (CATLEFF) and Delaware Shaft 18 (DEL18) and allowed DEP to maintain full flow-through operations of both aqueduct systems throughout the remainder of the winter of 1993. The

Waterfowl Management Program
24
program was modified in subsequent years from a 24 hour/day program to a pre-dawn to post-dusk program that begins on August 1 and extends through March 31 annually.
Figure 1. Kensico Reservoir waterbird totals.
Prior to implementing an approved bird dispersal program, DEP began collecting bird census data in August 1992. Overnight waterbird counts reached several thousand during the migratory and wintering period (Figure 1) with high bird roosting counts recorded at the water intake coves at Kensico. Figure 1 continues to demonstrate a dramatic decline in waterbird counts from several thousand in 1992 and 1993 to hundreds or less during the same migratory period in subsequent years and up through the present day when bird dispersal techniques were employed. Figure 2 shows a dramatic decline in fecal coliform bacteria simultaneous with the commencement of the bird dispersal efforts in December 1993, and this observation (or effect) continues through the present day. Since 2012, DEP implemented wildlife sanitary surveys and excrement removals around the DEL18 Effluent that lead to a further decline in fecal coliform elevations during important precipitation events.
0
1000
2000
3000
4000
5000
Jan-
87Ja
n-88
Jan-
89Ja
n-90
Jan-
91Ja
n-92
Jan-
93Ja
n-94
Jan-
95Ja
n-96
Jan-
97Ja
n-98
Jan-
99Ja
n-00
Jan-
01Ja
n-02
Jan-
03Ja
n-04
Jan-
05Ja
n-06
Jan-
07Ja
n-08
Jan-
09Ja
n-10
Jan-
11Ja
n-12
Jan-
13Ja
n-14
Jan-
15Ja
n-16
Jan-
17
Num
ber o
f Wat
erbi
rds WATERBIRD MANAGEMENT
Initiated December 1993
BIRD SURVEYS Started August
1992
Filtration Avoidance Determination, Section 4.1, Waterfowl Management Program
25
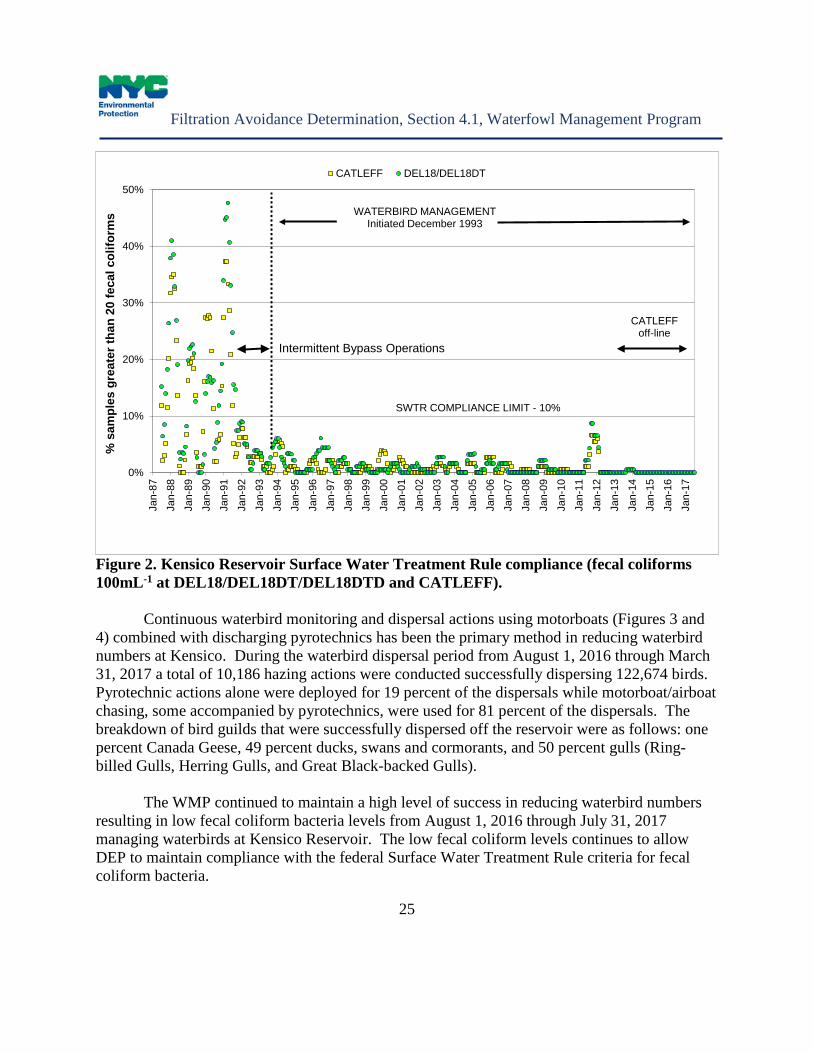
Figure 2. Kensico Reservoir Surface Water Treatment Rule compliance (fecal coliforms 100mL-1 at DEL18/DEL18DT/DEL18DTD and CATLEFF).
Continuous waterbird monitoring and dispersal actions using motorboats (Figures 3 and
4) combined with discharging pyrotechnics has been the primary method in reducing waterbird numbers at Kensico. During the waterbird dispersal period from August 1, 2016 through March 31, 2017 a total of 10,186 hazing actions were conducted successfully dispersing 122,674 birds. Pyrotechnic actions alone were deployed for 19 percent of the dispersals while motorboat/airboat chasing, some accompanied by pyrotechnics, were used for 81 percent of the dispersals. The breakdown of bird guilds that were successfully dispersed off the reservoir were as follows: one percent Canada Geese, 49 percent ducks, swans and cormorants, and 50 percent gulls (Ring-billed Gulls, Herring Gulls, and Great Black-backed Gulls).
The WMP continued to maintain a high level of success in reducing waterbird numbers
resulting in low fecal coliform bacteria levels from August 1, 2016 through July 31, 2017 managing waterbirds at Kensico Reservoir. The low fecal coliform levels continues to allow DEP to maintain compliance with the federal Surface Water Treatment Rule criteria for fecal coliform bacteria.
0%
10%
20%
30%
40%
50%
Jan-
87
Jan-
88
Jan-
89
Jan-
90
Jan-
91
Jan-
92
Jan-
93
Jan-
94
Jan-
95
Jan-
96
Jan-
97
Jan-
98
Jan-
99
Jan-
00
Jan-
01
Jan-
02
Jan-
03
Jan-
04
Jan-
05
Jan-
06
Jan-
07
Jan-
08
Jan-
09
Jan-
10
Jan-
11
Jan-
12
Jan-
13
Jan-
14
Jan-
15
Jan-
16
Jan-
17
% s
ampl
es g
reat
er th
an 2
0 fe
cal c
olifo
rms
CATLEFF DEL18/DEL18DT
SWTR COMPLIANCE LIMIT - 10%
Intermittent Bypass Operations
WATERBIRD MANAGEMENT Initiated December 1993
CATLEFFoff-line
Waterfowl Management Program
26
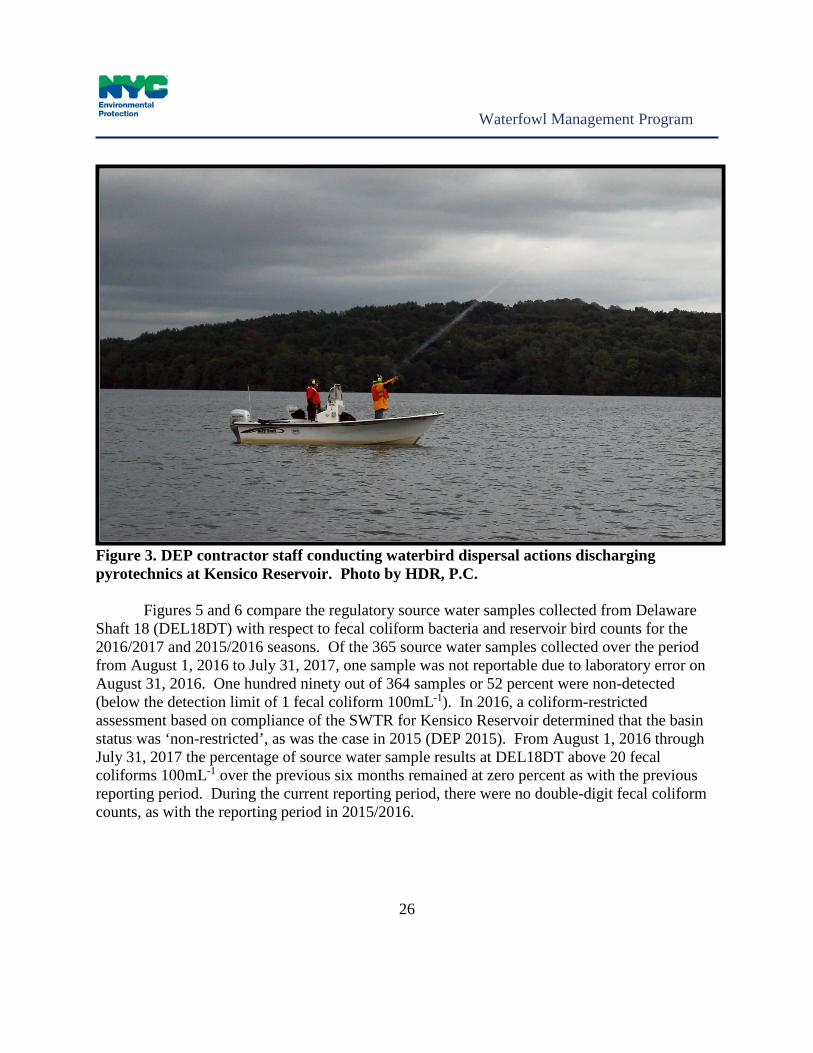
Figure 3. DEP contractor staff conducting waterbird dispersal actions discharging pyrotechnics at Kensico Reservoir. Photo by HDR, P.C.
Figures 5 and 6 compare the regulatory source water samples collected from Delaware Shaft 18 (DEL18DT) with respect to fecal coliform bacteria and reservoir bird counts for the 2016/2017 and 2015/2016 seasons. Of the 365 source water samples collected over the period from August 1, 2016 to July 31, 2017, one sample was not reportable due to laboratory error on August 31, 2016. One hundred ninety out of 364 samples or 52 percent were non-detected (below the detection limit of 1 fecal coliform 100mL-1). In 2016, a coliform-restricted assessment based on compliance of the SWTR for Kensico Reservoir determined that the basin status was ‘non-restricted’, as was the case in 2015 (DEP 2015). From August 1, 2016 through July 31, 2017 the percentage of source water sample results at DEL18DT above 20 fecal coliforms 100mL-1 over the previous six months remained at zero percent as with the previous reporting period. During the current reporting period, there were no double-digit fecal coliform counts, as with the reporting period in 2015/2016.

Filtration Avoidance Determination, Section 4.1, Waterfowl Management Program
27
Table 5. Highest fecal coliform 100mL-1 results, precipitation events, and bird counts at Kensico Reservoir keypoint water sampling location (DEL18DT/DEL18DTD)
Date DEL18DT fecal coliform 100mL-1
Precipitation within 3 days of
elevated fecal coliform >=4 fecal coliform 100 mL-1 (inches rounded to the nearest 100th)1
Bird Counts on or before sample date
Reservoir-wide totals
Bird Zones 2, 3, and 4 totals
(closest to the DEL18DT Effluent)
10/18/16 4 0 85 on 10/18/16
81 on 10/18/16
10/23/16 5 1.98 113 on 10/23/16
103 on 10/23/16
3/4/17 7 0.01 160 on 3/4/17 41 on 3/4/17
5/8/17 5 0.16 (On 5/5/17 2.21 inches of rain was
reported)
74 on 5/7/17 21 on 5/7/17
5/9/17 4 0.03 74 on 5/7/17 21 on 5/7/17 5/10/17 5 0 74 on 5/7/17 21 on 5/7/17 5/15/17 4 1.8 (Reported at
Kensico Reservoir)2 89 on 5/14/17 22 on 5/14/17
5/25/17 7 0.74 (1.78 inches reported at Kensico
Reservoir)2
101 on 5/21/17
42 on 5/21/17
5/27/17 7 1.46 134 on 5/27/17
24 on 5/27/17
5/29/17 4 0.15 134 on 5/27/17
24 on 5/27/17
6/16/17 6 0.28 (0.44 inches reported at Kensico
Reservoir)2
69 on 6/11/17 37 on 6/11/17
1 Precipitation data reported from Westchester County Airport, White Plains, New York 2 Precipitation data reported from DEP Kensico Reservoir, Valhalla, New York
Table 5 lists the eleven highest fecal coliform counts ranging from four to seven fecal
coliform 100mL-1 recorded at DEL18DT in 2016/2017. Eight of the eleven events were likely

Waterfowl Management Program
28
associated with precipitation events of more than one inch recorded in the previous three days or longer and when bird counts remained relatively low in the bird zones closest to the water intake (Table 5). There were no waterbirds observed in Bird Zone 2 cove, closest to the DEL18DT sampling site on seven of the 11 dates in Table 5. A substantial precipitation event (2.21 inches) occurred between the dates May 5-7, 2017. The corresponding bird count observed in Bird Zone 2 on May 9, 2017 was 12.
In 2016/2017, the DEP contractor attained 90 percent reportable data in completing
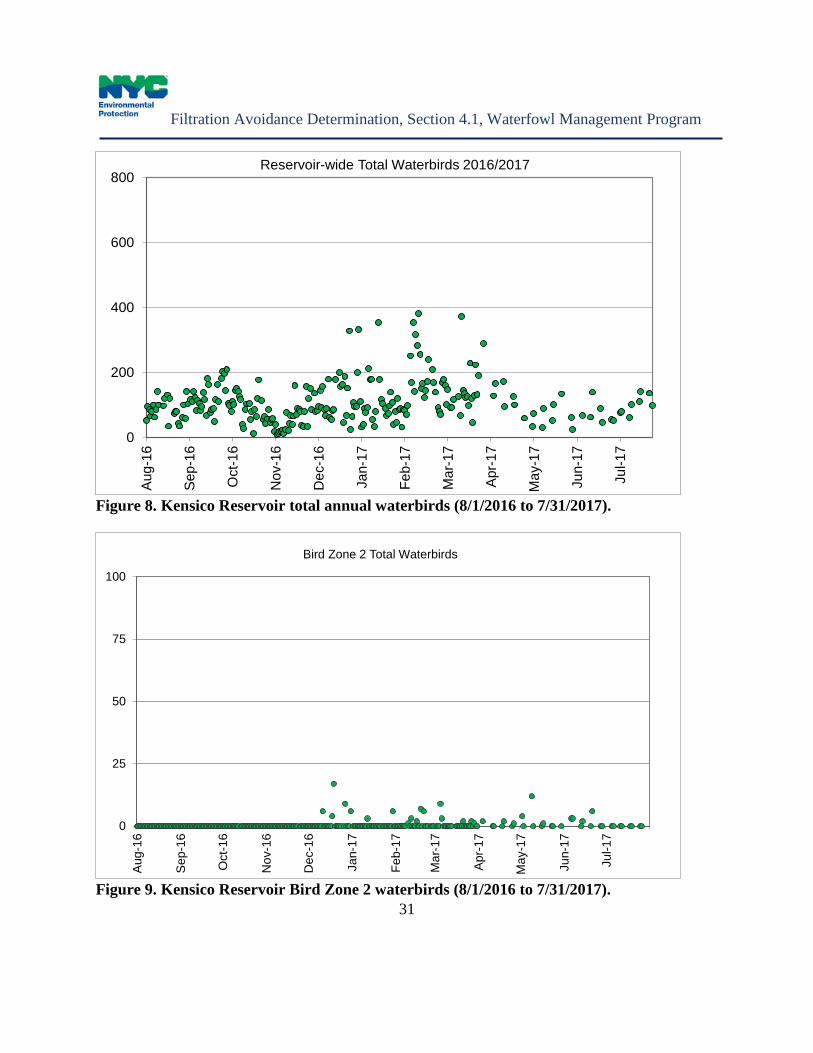
waterbird surveys during the bird dispersal period. Approximately 10% of the surveys were deemed “no reportable data” due to inadequate bird observations from unsuitable environmental conditions (e.g., fog, snow or rain). Reservoir-wide waterbird counts were higher from August 1, 2016 to July 31, 2017 when compared to counts conducted during the same period in 2015/2016. In 2016/2017 (August 1, 2016 to March 31, 2017) overnight waterbird counts averaged about 111 birds per survey night and spiked at 381 (210 gulls, and 171 ducks) on February 13, 2017 compared to an average of 88 birds/night in 2015/2016 (Figures 7 and 8). Despite the increase in bird counts per night, there was no corresponding increase in fecal coliforms 100mL-1 recorded at DEL18DT.
Figure 4. Mute Swan being dispersed by DEP contractors using motorboats at Kensico. Photo by Chris Nadareski

Filtration Avoidance Determination, Section 4.1, Waterfowl Management Program
29
In Bird Zone 2, closest to Delaware Shaft 18 Effluent (DEL18DT), waterbirds (mostly ducks) were observed 17 times in 2016/2017 during the bird dispersal period from August 1 to March 31. Flocks of ducks were suspected to have arrived overnight past the normal hours of operation for bird dispersal activities. Similar to the previous year, ducks were the only bird guild observed in Bird Zone 2 during the dispersal period except for 17 Canada Geese that were observed on the morning of December 19, 2016 (Figure 9). The high count of 17 geese observed in Bird Zone 2 was not associated with a fecal coliform bacteria elevation.
All birds in the water intake cove (Bird Zone 2) observed during the pre-dawn period
were immediately dispersed using motorboats. All waterbird mitigative activities are prioritized based on the spatial distance to the Delaware Shaft 18 Effluent; bird activity observed closer to the effluent is a higher importance for dispersal activities. Waterbird surveys in Bird Zone 3, adjacent to the Bird Zone 2 cove revealed 18 occasions when birds were present out of 254 survey days (Figure 10). A high count of 12 Canada Geese was recorded on February 13, 2017 (Figure 10). Bird counts spiked at 220 gulls recorded on November 30, 2016 in Bird Zone 4 (Figure 11).
Figure 5. Kensico Reservoir fecal coliforms 100mL-1 at DEL18DT vs. total waterbirds (8/1/2016 to 7/31/2017).
0
250
500
750
1000
0
10
20
30
40
Aug
-16
Sep
-16
Oct
-16
Nov
-16
Dec
-16
Jan-
17
Feb
-17
Mar
-17
Apr
-17
May
-17
Jun-
17
Jul-1
7
Total W
aterbird
sF
ecal
Co
lifo
rm B
acte
ria
(co
lifo
rm 1
00 m
L-1
)
DEL18DT - Fecal Coliform Bacteria Total Waterbirds

Waterfowl Management Program
30
Figure 6. Kensico Reservoir fecal coliforms 100mL-1 at DEL18/DEL18DT vs. total waterbirds (8/1/2015 to 7/31/2016).
Figure 7. Kensico Reservoir total annual waterbirds (8/1/2015 to 7/31/2016).
0
250
500
750
1000
0
10
20
30
40
Aug
-15
Sep
-15
Oct
-15
Nov
-15
Dec
-15
Jan-
16
Feb-
16
Mar
-16
Apr
-16
May
-16
Jun-
16
Jul-1
6
Total Waterbirds
Feca
l Col
iform
Bac
teri
a (c
olifo
rm 1
00 m
L-1 )
DEL18DT - Fecal Coliform Bacteria Total Waterbirds
0
200
400
600
800
Aug-
15
Sep-
15
Oct
-15
Nov
-15
Dec
-15
Jan-
16
Feb-
16
Mar
-16
Apr-1
6
May
-16
Jun-
16
Jul-1
6
Reservoir-wide Total Waterbirds 2015/2016
Filtration Avoidance Determination, Section 4.1, Waterfowl Management Program
31
Figure 8. Kensico Reservoir total annual waterbirds (8/1/2016 to 7/31/2017).
Figure 9. Kensico Reservoir Bird Zone 2 waterbirds (8/1/2016 to 7/31/2017).
0
200
400
600
800
Aug-
16
Sep-
16
Oct
-16
Nov
-16
Dec
-16
Jan-
17
Feb-
17
Mar
-17
Apr-1
7
May
-17
Jun-
17
Jul-1
7
Reservoir-wide Total Waterbirds 2016/2017
0
25
50
75
100
Aug
-16
Sep
-16
Oct
-16
Nov
-16
Dec
-16
Jan-
17
Feb-
17
Mar
-17
Apr
-17
May
-17
Jun-
17
Jul-1
7
Bird Zone 2 Total Waterbirds

Waterfowl Management Program
32
Figure 10. Kensico Reservoir Bird Zone 3 waterbirds (8/1/2016 to 7/31/2017).
Figure 11. Kensico Reservoir Bird Zone 4 waterbirds (8/1/2016 to 7/31/2017).
0
25
50
75
100
Aug-
16
Sep-
16
Oct
-16
Nov
-16
Dec
-16
Jan-
17
Feb-
17
Mar
-17
Apr-1
7
May
-17
Jun-
17
Jul-1
7
Bird Zone 3 Total Waterbirds
0
100
200
300
400
500
Aug-
16
Sep-
16
Oct
-16
Nov
-16
Dec
-16
Jan-
17
Feb-
17
Mar
-17
Apr-1
7
May
-17
Jun-
17
Jul-1
7
Bird Zone 4 Total Waterbirds
Filtration Avoidance Determination, Section 4.1, Waterfowl Management Program
33
The incidence of specific groups of waterbirds continues to follow trends for annual migration and over-wintering patterns. Waterbird roosting locations during the winter period are generally determined by extent of ice-cover. During the winter of 2016/2017, the first detection of ice was observed on December 15, 2016 with 1% ice cover, while the maximum ice cover reached 75 percent at Kensico on January 16, 2017. Ice cover diminished back to 1% by March 25, 2017. Overall, there was only a minimal period of partial ice-cover, which allowed continuous motorboat operations for bird dispersal activities.
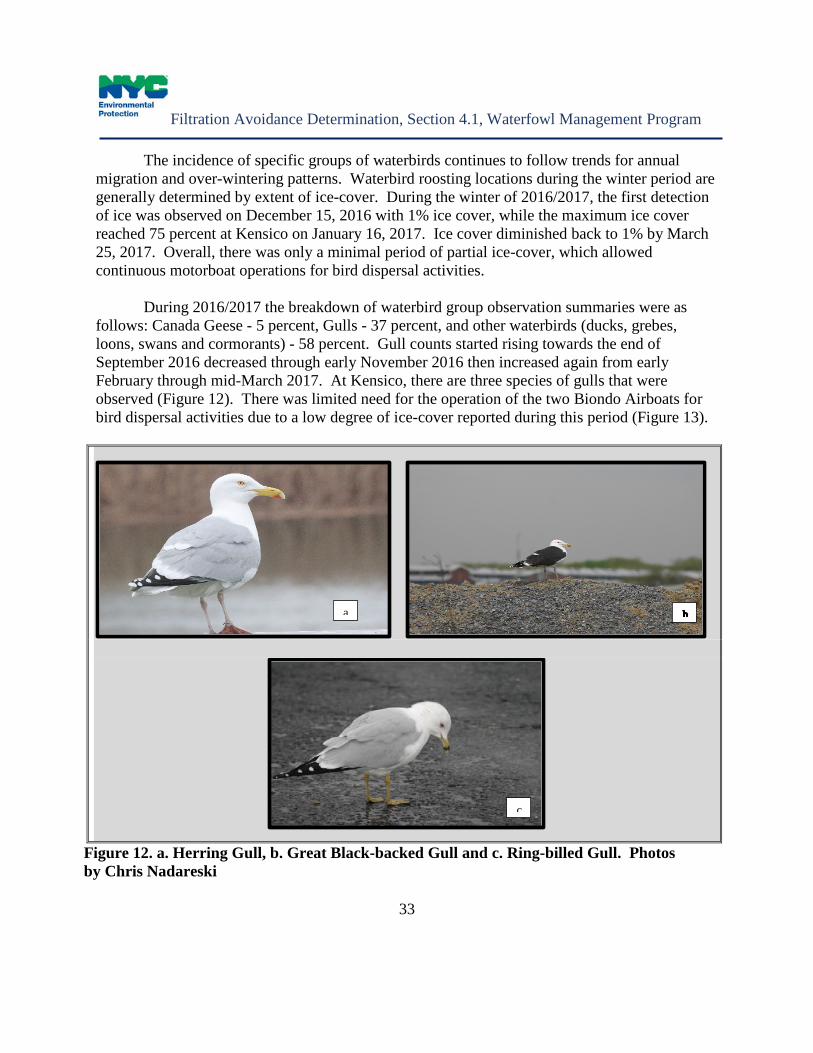
During 2016/2017 the breakdown of waterbird group observation summaries were as
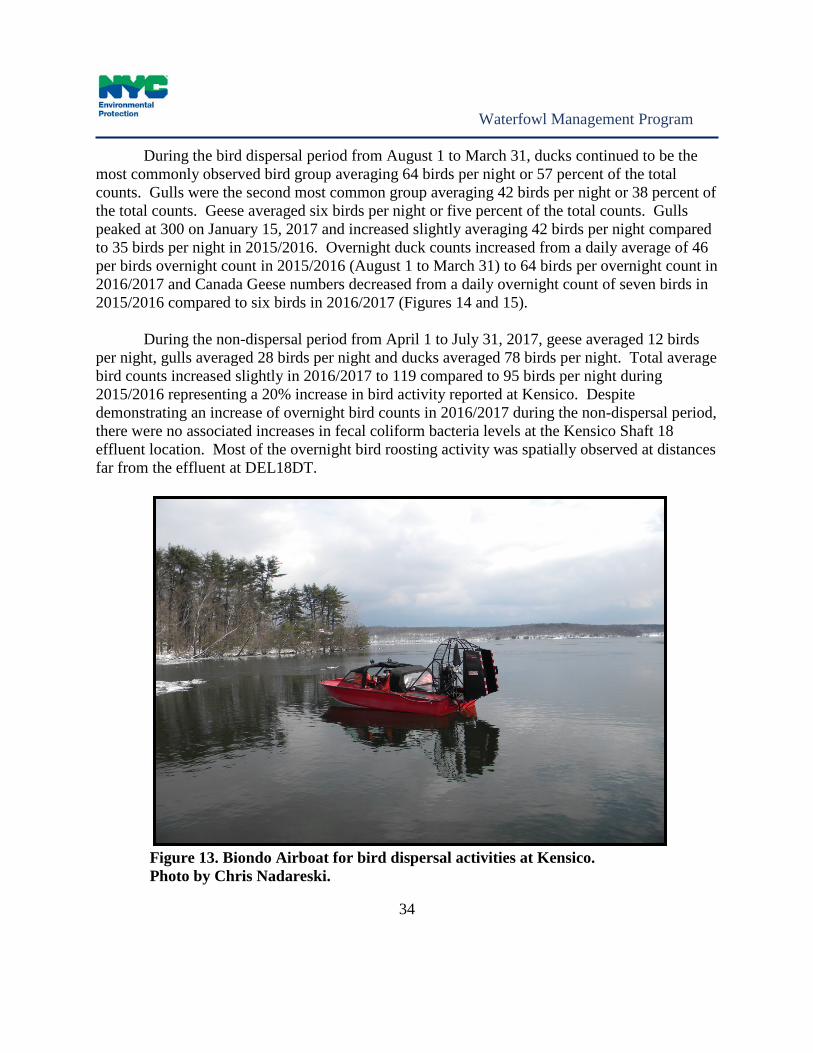
follows: Canada Geese - 5 percent, Gulls - 37 percent, and other waterbirds (ducks, grebes, loons, swans and cormorants) - 58 percent. Gull counts started rising towards the end of September 2016 decreased through early November 2016 then increased again from early February through mid-March 2017. At Kensico, there are three species of gulls that were observed (Figure 12). There was limited need for the operation of the two Biondo Airboats for bird dispersal activities due to a low degree of ice-cover reported during this period (Figure 13).
Figure 12. a. Herring Gull, b. Great Black-backed Gull and c. Ring-billed Gull. Photos by Chris Nadareski
a
c
Waterfowl Management Program
34
During the bird dispersal period from August 1 to March 31, ducks continued to be the most commonly observed bird group averaging 64 birds per night or 57 percent of the total counts. Gulls were the second most common group averaging 42 birds per night or 38 percent of the total counts. Geese averaged six birds per night or five percent of the total counts. Gulls peaked at 300 on January 15, 2017 and increased slightly averaging 42 birds per night compared to 35 birds per night in 2015/2016. Overnight duck counts increased from a daily average of 46 per birds overnight count in 2015/2016 (August 1 to March 31) to 64 birds per overnight count in 2016/2017 and Canada Geese numbers decreased from a daily overnight count of seven birds in 2015/2016 compared to six birds in 2016/2017 (Figures 14 and 15).
During the non-dispersal period from April 1 to July 31, 2017, geese averaged 12 birds
per night, gulls averaged 28 birds per night and ducks averaged 78 birds per night. Total average bird counts increased slightly in 2016/2017 to 119 compared to 95 birds per night during 2015/2016 representing a 20% increase in bird activity reported at Kensico. Despite demonstrating an increase of overnight bird counts in 2016/2017 during the non-dispersal period, there were no associated increases in fecal coliform bacteria levels at the Kensico Shaft 18 effluent location. Most of the overnight bird roosting activity was spatially observed at distances far from the effluent at DEL18DT.
Figure 13. Biondo Airboat for bird dispersal activities at Kensico. Photo by Chris Nadareski.

Filtration Avoidance Determination, Section 4.1, Waterfowl Management Program
35
Figure 14. Kensico Reservoir total waterbirds by groups (8/1/2015 to 7/31/2016).
Figure 15. Kensico Reservoir total waterbirds by groups (8/1/2016 to 7/31/2017).
0
200
400
600
Aug
-15
Sep
-15
Oct
-15
Nov
-15
Dec
-15
Jan-
16
Feb
-16
Mar
-16
Apr
-16
May
-16
Jun-
16
Jul-1
6
Geese Gulls Ducks, Swans & Cormorants
Wat
erbi
rdC
ount
s
0
200
400
600
Aug
-16
Sep
-16
Oct
-16
Nov
-16
Dec
-16
Jan-
17
Feb
-17
Mar
-17
Apr
-17
May
-17
Jun-
17
Jul-1
7
Geese Gulls Ducks, Swans & Cormorants
Wat
erb
ird
Co
un
ts
Waterfowl Management Program
36
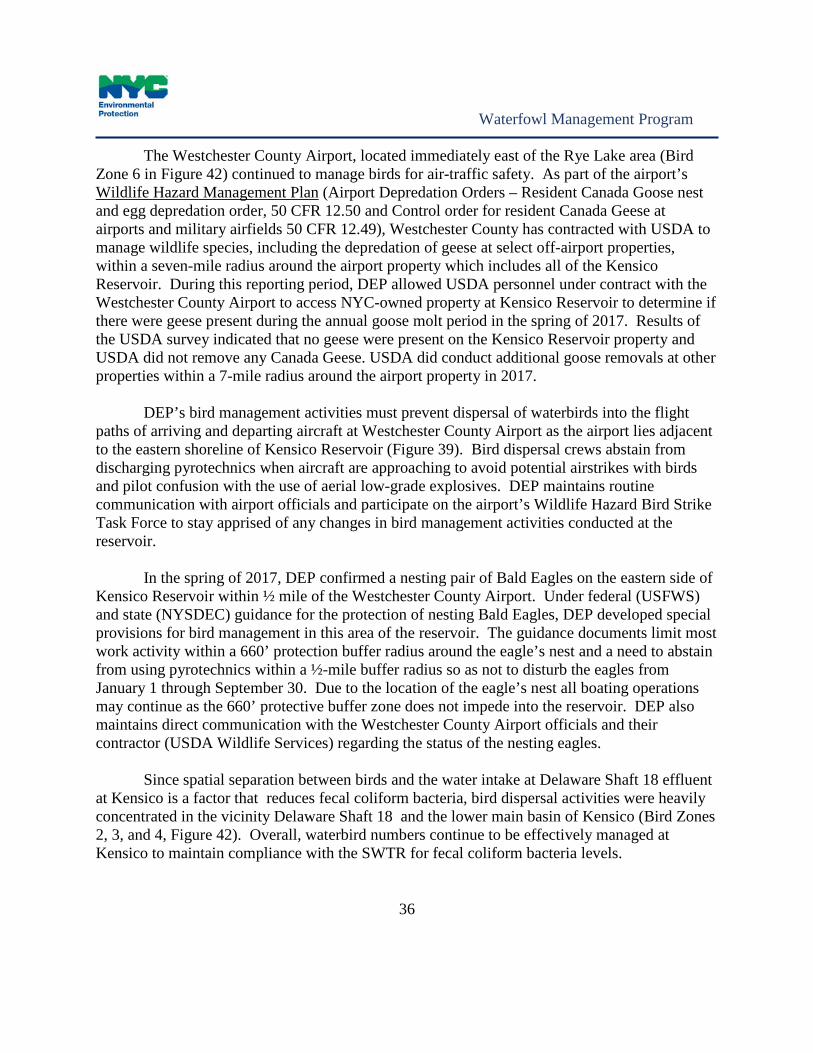
The Westchester County Airport, located immediately east of the Rye Lake area (Bird Zone 6 in Figure 42) continued to manage birds for air-traffic safety. As part of the airport’s Wildlife Hazard Management Plan (Airport Depredation Orders – Resident Canada Goose nest and egg depredation order, 50 CFR 12.50 and Control order for resident Canada Geese at airports and military airfields 50 CFR 12.49), Westchester County has contracted with USDA to manage wildlife species, including the depredation of geese at select off-airport properties, within a seven-mile radius around the airport property which includes all of the Kensico Reservoir. During this reporting period, DEP allowed USDA personnel under contract with the Westchester County Airport to access NYC-owned property at Kensico Reservoir to determine if there were geese present during the annual goose molt period in the spring of 2017. Results of the USDA survey indicated that no geese were present on the Kensico Reservoir property and USDA did not remove any Canada Geese. USDA did conduct additional goose removals at other properties within a 7-mile radius around the airport property in 2017.
DEP’s bird management activities must prevent dispersal of waterbirds into the flight
paths of arriving and departing aircraft at Westchester County Airport as the airport lies adjacent to the eastern shoreline of Kensico Reservoir (Figure 39). Bird dispersal crews abstain from discharging pyrotechnics when aircraft are approaching to avoid potential airstrikes with birds and pilot confusion with the use of aerial low-grade explosives. DEP maintains routine communication with airport officials and participate on the airport’s Wildlife Hazard Bird Strike Task Force to stay apprised of any changes in bird management activities conducted at the reservoir.
In the spring of 2017, DEP confirmed a nesting pair of Bald Eagles on the eastern side of
Kensico Reservoir within ½ mile of the Westchester County Airport. Under federal (USFWS) and state (NYSDEC) guidance for the protection of nesting Bald Eagles, DEP developed special provisions for bird management in this area of the reservoir. The guidance documents limit most work activity within a 660’ protection buffer radius around the eagle’s nest and a need to abstain from using pyrotechnics within a ½-mile buffer radius so as not to disturb the eagles from January 1 through September 30. Due to the location of the eagle’s nest all boating operations may continue as the 660’ protective buffer zone does not impede into the reservoir. DEP also maintains direct communication with the Westchester County Airport officials and their contractor (USDA Wildlife Services) regarding the status of the nesting eagles.
Since spatial separation between birds and the water intake at Delaware Shaft 18 effluent
at Kensico is a factor that reduces fecal coliform bacteria, bird dispersal activities were heavily concentrated in the vicinity Delaware Shaft 18 and the lower main basin of Kensico (Bird Zones 2, 3, and 4, Figure 42). Overall, waterbird numbers continue to be effectively managed at Kensico to maintain compliance with the SWTR for fecal coliform bacteria levels.
Filtration Avoidance Determination, Section 4.1, Waterfowl Management Program
37
Alewives and other baitfish transported through upstate aqueducts to Kensico were present during the autumn/winter period of 2016/2017. When present, the dead and dying Alewives typically attract foraging gulls and diving ducks. DEP and its contractor continued to monitor fish concentrations and collected dead/dying baitfish as they entered Kensico Reservoir. A surface retention boom was placed around the Catskill Influent Chamber (CATIC) to concentrate the baitfish and allow for easy collection and disposal. The poundage of fish observed, collected, and disposed of from CATIC in 2016/2017 was 22 pounds compared to 104 pounds collected in 2015/2016 and 36.8 pounds collected in 2014/2015. The relatively low poundage of fish observed in 2016/2017 reduced the amount of bird dispersal efforts necessary near CATIC.
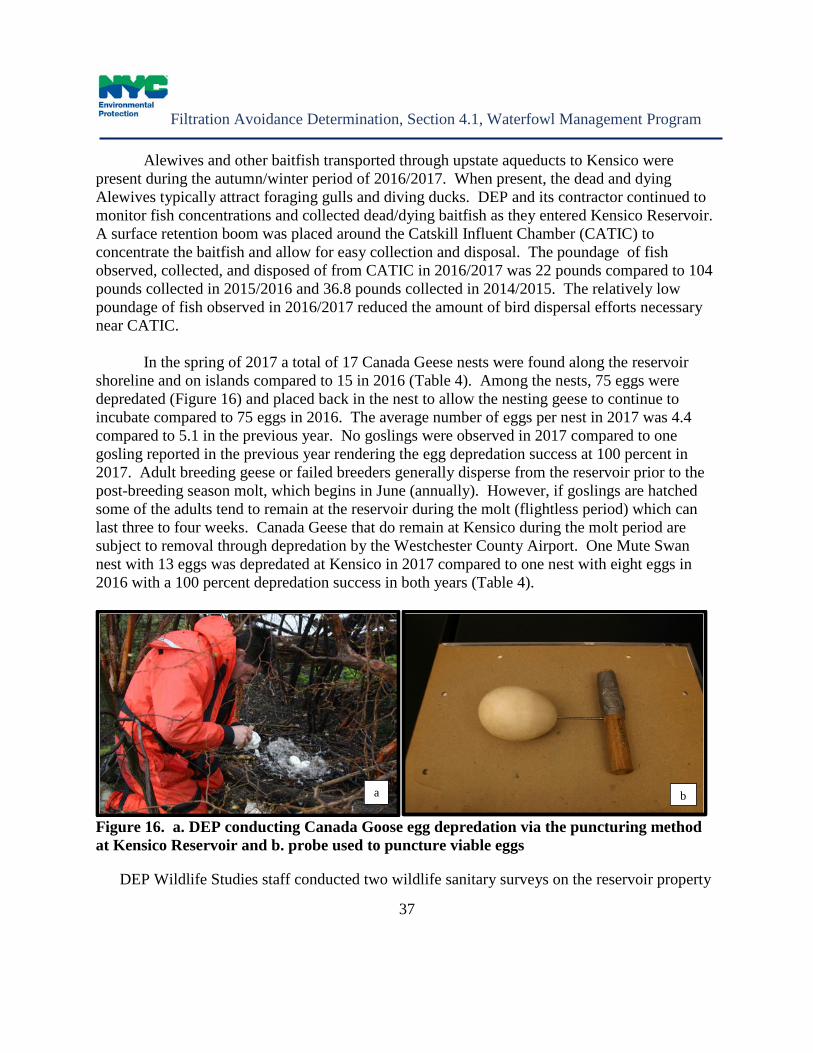
In the spring of 2017 a total of 17 Canada Geese nests were found along the reservoir
shoreline and on islands compared to 15 in 2016 (Table 4). Among the nests, 75 eggs were depredated (Figure 16) and placed back in the nest to allow the nesting geese to continue to incubate compared to 75 eggs in 2016. The average number of eggs per nest in 2017 was 4.4 compared to 5.1 in the previous year. No goslings were observed in 2017 compared to one gosling reported in the previous year rendering the egg depredation success at 100 percent in 2017. Adult breeding geese or failed breeders generally disperse from the reservoir prior to the post-breeding season molt, which begins in June (annually). However, if goslings are hatched some of the adults tend to remain at the reservoir during the molt (flightless period) which can last three to four weeks. Canada Geese that do remain at Kensico during the molt period are subject to removal through depredation by the Westchester County Airport. One Mute Swan nest with 13 eggs was depredated at Kensico in 2017 compared to one nest with eight eggs in 2016 with a 100 percent depredation success in both years (Table 4).
Figure 16. a. DEP conducting Canada Goose egg depredation via the puncturing method at Kensico Reservoir and b. probe used to puncture viable eggs
DEP Wildlife Studies staff conducted two wildlife sanitary surveys on the reservoir property
a b
Waterfowl Management Program
38
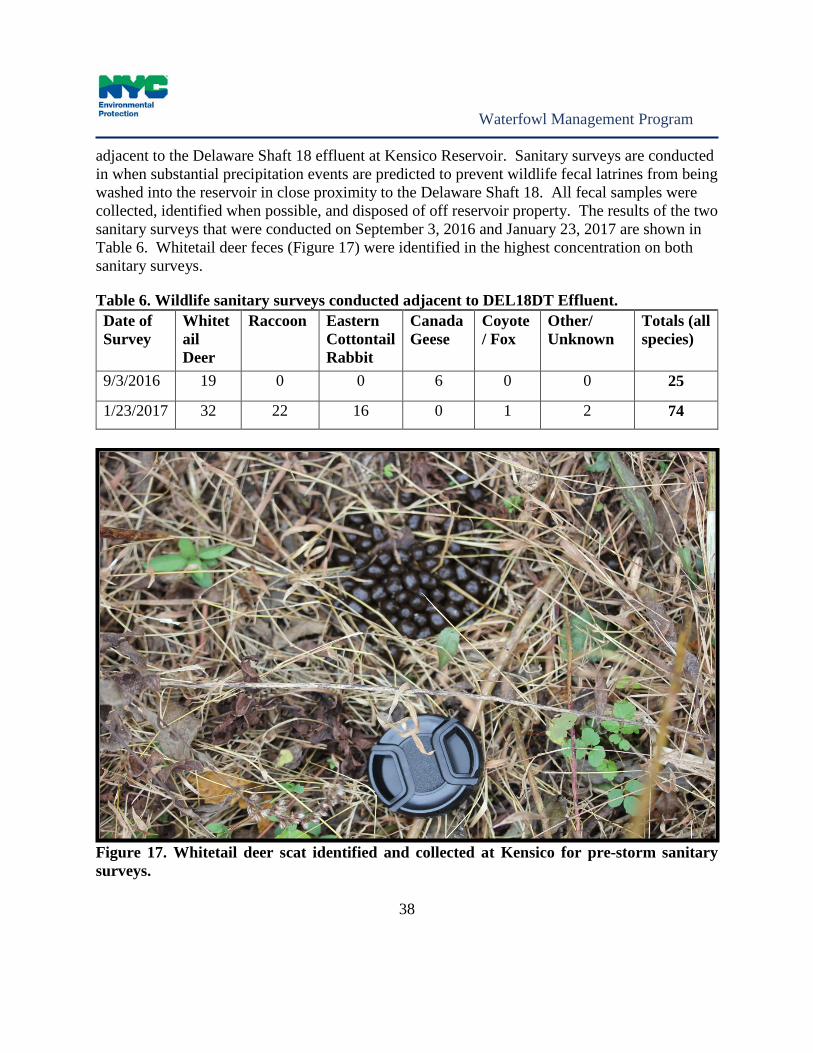
adjacent to the Delaware Shaft 18 effluent at Kensico Reservoir. Sanitary surveys are conducted in when substantial precipitation events are predicted to prevent wildlife fecal latrines from being washed into the reservoir in close proximity to the Delaware Shaft 18. All fecal samples were collected, identified when possible, and disposed of off reservoir property. The results of the two sanitary surveys that were conducted on September 3, 2016 and January 23, 2017 are shown in Table 6. Whitetail deer feces (Figure 17) were identified in the highest concentration on both sanitary surveys.
Table 6. Wildlife sanitary surveys conducted adjacent to DEL18DT Effluent. Date of Survey
Whitetail Deer
Raccoon Eastern Cottontail Rabbit
Canada Geese
Coyote/ Fox
Other/ Unknown
Totals (all species)
9/3/2016 19 0 0 6 0 0 25
1/23/2017 32 22 16 0 1 2 74
Figure 17. Whitetail deer scat identified and collected at Kensico for pre-storm sanitary surveys.
Filtration Avoidance Determination, Section 4.1, Waterfowl Management Program
39
The ongoing implementation of the WMP has been critical in allowing DEP to maintain compliance with the SWTR criteria for fecal coliform bacteria at Kensico throughout 2016/2017 and dating back to 1993.

Waterfowl Management Program
40
2. West Branch Reservoir The 2007 FAD lists West Branch Reservoir as one of five reservoirs covered under the
“as-needed” criteria for waterbird management. Since the implementation of the WMP program, only two “as-needed” actions have been implemented at West Branch. West Branch Reservoir is divided into four bird survey zones that are associated with reservoir water quality sampling locations (Figure 43).
Waterbird population surveys were conducted from August 1, 2016 through April 15,
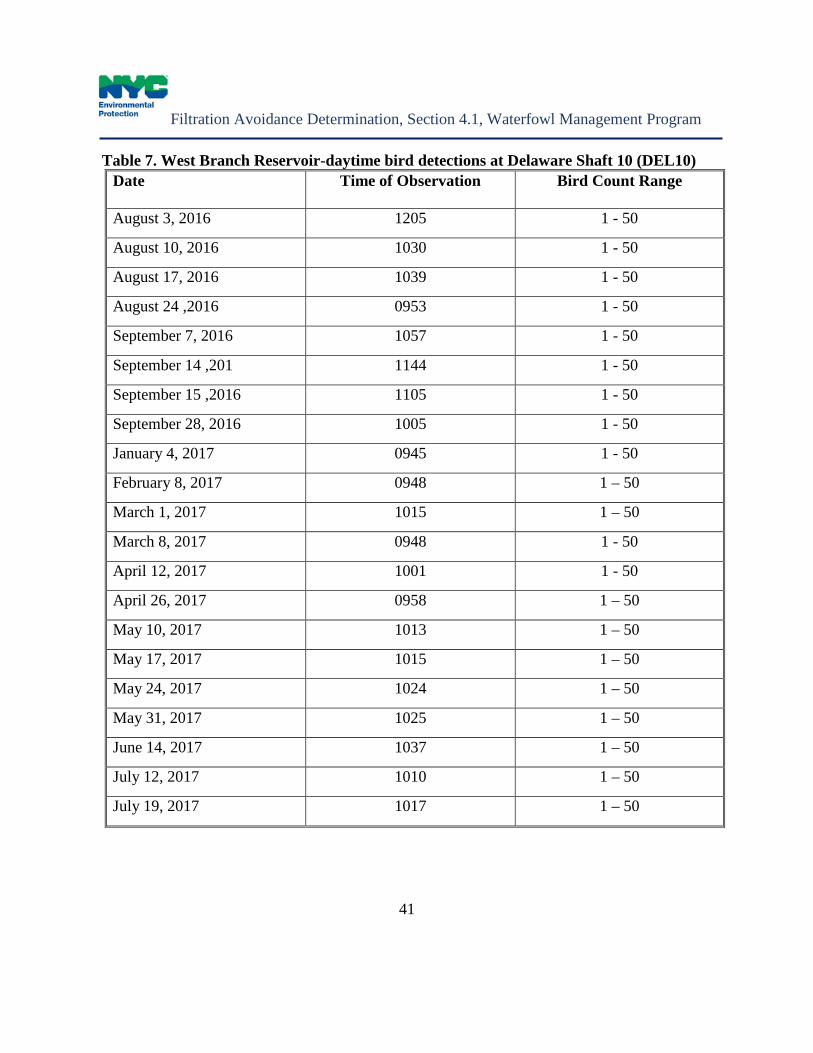
2017 on a biweekly frequency for this reporting period (Table 2). Additional daytime (un-aided eye) bird observations were conducted by DEP Aqueduct Monitoring staff during routine site visits for water quality sampling. Fifty-four additional bird observations were conducted during this reporting period. The dates, times and counts for birds observed at the West Branch Effluent (Delaware Shaft 10) are listed in Table 7 unless counts were zero or no data were collected due to environmental conditions or field errors. Thirty-three out of 54 observations or 61 percent of the observations were reported as “0” or no birds present.
During this reporting period, DEP was not required to initiate an “as-needed” bird
dispersal action due to elevated fecal coliform bacteria and waterbird counts. In the event a bird dispersal action was required, DEP would implement a program using contractor personnel to eliminate the presence of waterbirds deemed as a water quality threat.
Migratory and wintering waterbird populations at West Branch were surveyed biweekly
from August 1, 2016 through April 15, 2017 to record annual trends that aids in identifying sources of elevated fecal coliform bacteria levels. In 2016/2017 during the overnight surveys, gulls were recorded on 11/18 of surveys with a high count of 63 on December 16, 2016 compared to only six of 17 surveys in 2015/2016 with a high count of only 288.
Reservoir-wide total birds reached a high seasonal count of 3,503 on December 30, 2016
compared to 1,440 on December 18, 2015 in the previous report (Figures 18 and 19). Duck counts, mostly Common Mergansers, generally increase annually from mid-March to late April along with the northward springtime migration. Counts increase again from late-September through the end of December (through reservoir ice-cover) along with the southward migration movements. Reservoir ice-cover conditions ranged from approximately 25 percent by December 29, 2016 to a maximum coverage of 75 percent by January 12, 2017. The ice cover diminished to 25 percent by March 24, 2017. Duck counts peaked on December 30, 2016 at 3,458 then decreased to 399 by January 12, 2017 when ice cover reached 75 percent.
Filtration Avoidance Determination, Section 4.1, Waterfowl Management Program
41
Table 7. West Branch Reservoir-daytime bird detections at Delaware Shaft 10 (DEL10) Date Time of Observation Bird Count Range
August 3, 2016 1205 1 - 50
August 10, 2016 1030 1 - 50
August 17, 2016 1039 1 - 50
August 24 ,2016 0953 1 - 50
September 7, 2016 1057 1 - 50
September 14 ,201 1144 1 - 50
September 15 ,2016 1105 1 - 50
September 28, 2016 1005 1 - 50
January 4, 2017 0945 1 - 50
February 8, 2017 0948 1 – 50
March 1, 2017 1015 1 – 50
March 8, 2017 0948 1 - 50
April 12, 2017 1001 1 - 50
April 26, 2017 0958 1 – 50
May 10, 2017 1013 1 – 50
May 17, 2017 1015 1 – 50
May 24, 2017 1024 1 – 50
May 31, 2017 1025 1 – 50
June 14, 2017 1037 1 – 50
July 12, 2017 1010 1 – 50
July 19, 2017 1017 1 – 50

Waterfowl Management Program
42
Figure 18. West Branch Reservoir total waterbirds (8/1/2015 to 4/15/2016).
Figure 19. West Branch Reservoir total waterbirds (8/1/2016 to 4/15/2017).
0
1000
2000
3000
4000
Aug-
15
Sep-
15
Oct
-15
Nov
-15
Dec
-15
Jan-
16
Feb-
16
Mar
-16
Apr-1
6
Total Waterbirds
0
1000
2000
3000
4000
Aug
-16
Sep
-16
Oct
-16
Nov
-16
Dec
-16
Jan-
17
Feb-
17
Mar
-17
Apr
-17
Total Waterbirds
Filtration Avoidance Determination, Section 4.1, Waterfowl Management Program
43
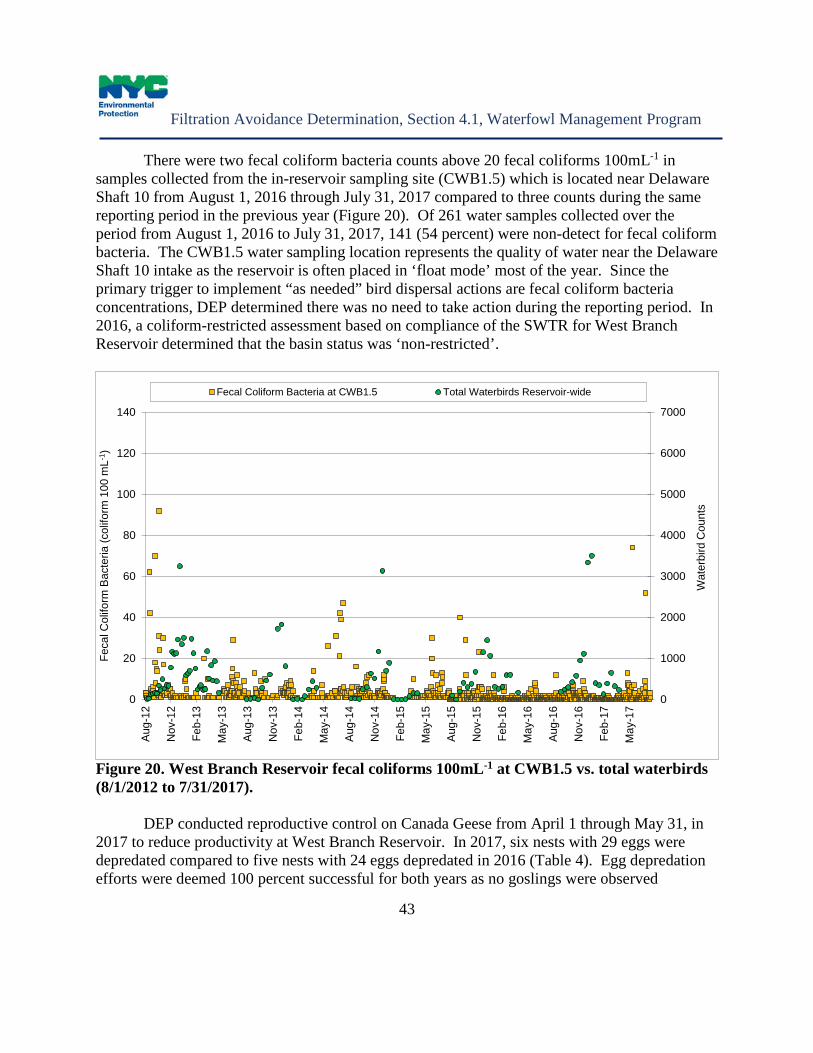
There were two fecal coliform bacteria counts above 20 fecal coliforms 100mL-1 in samples collected from the in-reservoir sampling site (CWB1.5) which is located near Delaware Shaft 10 from August 1, 2016 through July 31, 2017 compared to three counts during the same reporting period in the previous year (Figure 20). Of 261 water samples collected over the period from August 1, 2016 to July 31, 2017, 141 (54 percent) were non-detect for fecal coliform bacteria. The CWB1.5 water sampling location represents the quality of water near the Delaware Shaft 10 intake as the reservoir is often placed in ‘float mode’ most of the year. Since the primary trigger to implement “as needed” bird dispersal actions are fecal coliform bacteria concentrations, DEP determined there was no need to take action during the reporting period. In 2016, a coliform-restricted assessment based on compliance of the SWTR for West Branch Reservoir determined that the basin status was ‘non-restricted’.
Figure 20. West Branch Reservoir fecal coliforms 100mL-1 at CWB1.5 vs. total waterbirds (8/1/2012 to 7/31/2017).
DEP conducted reproductive control on Canada Geese from April 1 through May 31, in 2017 to reduce productivity at West Branch Reservoir. In 2017, six nests with 29 eggs were depredated compared to five nests with 24 eggs depredated in 2016 (Table 4). Egg depredation efforts were deemed 100 percent successful for both years as no goslings were observed
0
1000
2000
3000
4000
5000
6000
7000
0
20
40
60
80
100
120
140
Aug-
12
Nov
-12
Feb-
13
May
-13
Aug-
13
Nov
-13
Feb-
14
May
-14
Aug-
14
Nov
-14
Feb-
15
May
-15
Aug-
15
Nov
-15
Feb-
16
May
-16
Aug-
16
Nov
-16
Feb-
17
May
-17
Wat
erbi
rd C
ount
s
Feca
l Col
iform
Bac
teria
(col
iform
100
mL-1
)
Fecal Coliform Bacteria at CWB1.5 Total Waterbirds Reservoir-wide

Waterfowl Management Program
44
following the nesting period. There were no Mute Swans observed nesting at West Branch in 2017 and therefore no depredation actions were needed.
DEP continues to maintain bird deterrent netting that was installed on the West Branch shaft building to deter terrestrial bird nesting and roosting. Targeted species include Barn Swallows, Cliff Swallows, Rock Pigeons, House Sparrows, and European Starlings.

Filtration Avoidance Determination, Section 4.1, Waterfowl Management Program
45
3. Rondout Reservoir Rondout Reservoir is a terminal source water reservoir to both Kensico and West Branch. Located west of the Hudson River, Rondout is part of the Delaware System of reservoirs. The 2007 FAD lists Rondout as one of five reservoirs covered under the “as-needed” criteria for Waterfowl Management. Since the inception of the WMP, only three “as-needed” actions have been implemented at Rondout. The Rondout Reservoir is divided into nine bird zones (Figure 44).
In 2016/2017, there were no counts above 20 fecal coliforms 100mL-1 in samples collected from the Rondout Effluent Chamber. This is similar to previous reporting periods dating back to 2011 (Figure 21). In 2016, a coliform-restricted assessment determined that the basin status was ‘non-restricted’. Of 181 samples collected over the period from August 1, 2016 to July 31, 2017, no fecal coliform bacteria were detected in 122 (68 percent) of the samples.
Figure 21. Rondout Reservoir fecal coliforms 100mL-1 at Rondout Effluent vs. total waterbirds (8/1/2012 to 7/31/2017). Non-detect fecal coliform are not presented. Waterbird surveys discontinued on 4/30/2013.
0
100
200
300
400
500
600
700
800
900
1000
0
20
40
60
Aug
-12
Jan-
13
Jul-1
3
Jan-
14
Jul-1
4
Jan-
15
Jul-1
5
Jan-
16
Jul-1
6
Jan-
17
Jul-1
7
To
tal Waterb
irds
Fec
al C
olif
orm
Bac
teri
a (c
olif
orm
100
mL
-1)
Fecal Coliform Bacteria - Rondout Effluent Chamber Total Waterbirds

Waterfowl Management Program
46
DEP was not required to initiate an “as-needed” bird dispersal action as there were no elevated fecal coliform bacteria to report. In the event a bird dispersal action were required, DEP would implement a program using contractor personnel to eliminate any water quality threat.
Additional daytime (un-aided eye) bird observations were conducted by DEP Aqueduct
Monitoring staff during routine site visits. Fifty-four additional bird observations were conducted during this reporting period. The dates, times and count ranges for birds observed at the Rondout Effluent Chamber are listed in Table 8 unless counts were zero or no data were collected due to environmental conditions or field errors. Thirty-two out of 54 observations were reported as “0” or no birds present. Table 8. Rondout Reservoir – Daytime bird detections at Rondout Effluent.
Date Time of Observation Bird Count Range and Actual Bird Counts
August 8, 2016 0940 1 – 50 August 15, 2016 0936 1 - 50 August 22, 2016 0920 1 - 50 August 29, 2016 1000 1 – 50 September 6, 2016 0945 1 – 50 September 19, 2016 1000 1 – 50 October 3, 2016 0912 1 – 50 November 7, 2016 0902 1 – 50 December 19, 2016 0955 1 - 50 January 30, 2016 1100 1 - 50 February 13, 2017 1040 1 - 50 February 27, 2017 1041 1 - 50 April 3, 2017 0939 Observed 2 birds April 10, 2017 0909 Observed 5 birds April 24, 2017 1026 Observed 5 birds May 1, 2017 1039 1 - 50 May 22, 2017 1129 1 - 50 May 30, 2017 1055 1 - 50 June 19, 2017 0905 1 - 50 July 11, 2017 0925 1 - 50 July 17, 2017 1048 1 - 50 July 31, 2017 1040 1 - 50
Filtration Avoidance Determination, Section 4.1, Waterfowl Management Program
47
DEP conducted routine monitoring and maintained full compliance with a protection plan for Bald Eagles (Haliaeetus leucocephalus) as required by the NYSDEC and United States Fish and Wildlife Service in preparation for any “as-needed” bird dispersal activity as stated in the Findings Statement of the Environmental Impact Statement (N.Y.S. Environmental Conservation Law, Art. 8 (§8101 et seq.)) on file.
DEP also conducted reproductive control on Canada Geese at Rondout in the spring of
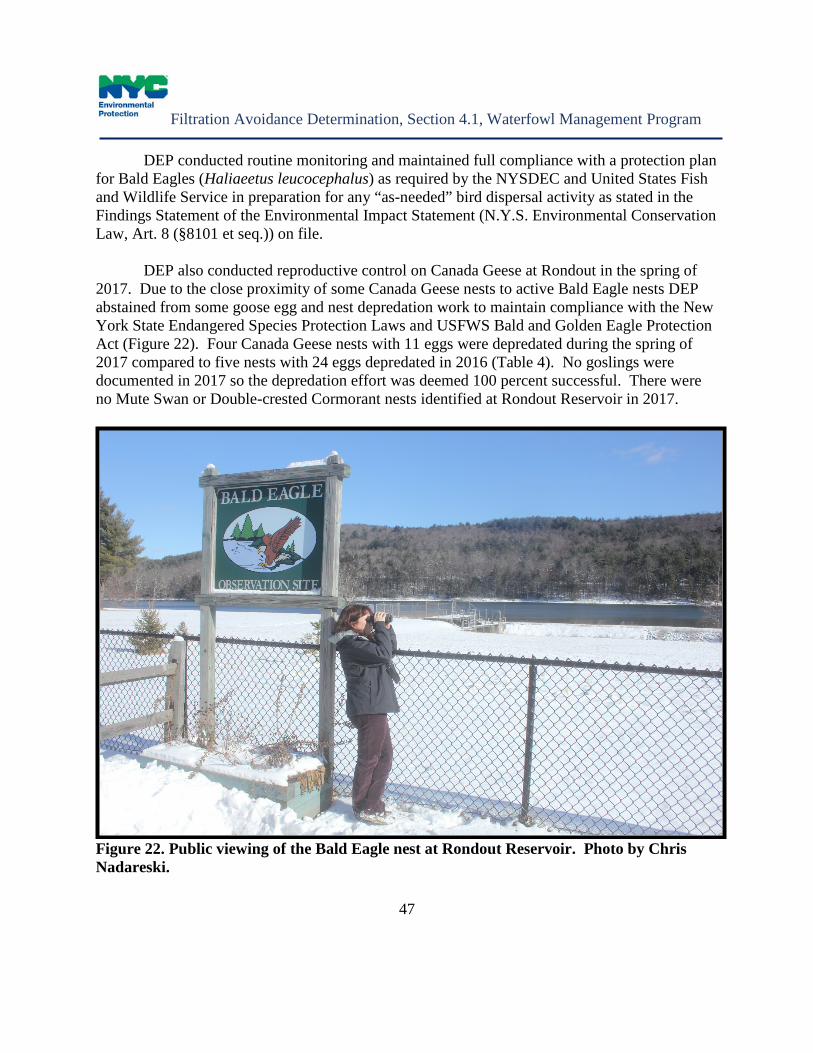
2017. Due to the close proximity of some Canada Geese nests to active Bald Eagle nests DEP abstained from some goose egg and nest depredation work to maintain compliance with the New York State Endangered Species Protection Laws and USFWS Bald and Golden Eagle Protection Act (Figure 22). Four Canada Geese nests with 11 eggs were depredated during the spring of 2017 compared to five nests with 24 eggs depredated in 2016 (Table 4). No goslings were documented in 2017 so the depredation effort was deemed 100 percent successful. There were no Mute Swan or Double-crested Cormorant nests identified at Rondout Reservoir in 2017.
Figure 22. Public viewing of the Bald Eagle nest at Rondout Reservoir. Photo by Chris Nadareski.

Waterfowl Management Program
48
4. Ashokan Reservoir The 2007 FAD lists Ashokan Reservoir as one of five reservoirs covered under the “as-needed” criteria for waterbird management. Since the implementation of the WMP, no “as-needed” actions have been necessary at Ashokan. Ashokan Reservoir is divided into two basins each with a water intake chamber located at the Dividing Weir (Figure 45). There are three bird zones on each basin, for a total of six bird zones (Figure 45). Daytime (un-aided eye) bird observations were conducted by DEP Aqueduct Monitoring staff during routine site visits. Fifty-four additional bird observations were conducted each at the Ashokan East Basin Effluent and at the Ashokan West Basin Effluent during this reporting period. The dates, times and count ranges for birds observed at the Ashokan East Basin Effluent are listed in Table 9 and those for the Ashokan West Basin Effluent are listed in Table 10 unless counts were zero or no data were collected due to environmental conditions or field errors. Forty out of 54 observations were reported as zero birds at the East Basin Effluent and 37 out of 54 observations were zero birds observed on the West Basin Effluent. Table 9. Ashokan Reservoir – Daytime bird detections at Ashokan East Effluent
Date of Observation at Ashokan East Basin
Time of Observation
Bird Count Range and Actual Bird Counts
August 15, 22016 1132 1 - 50
September 26, 2016 1125 1-50
January 9, 2017 1111 1 – 50
February 6, 2017 1131 1 - 50
April 10, 2017 1027 Observed 2 ducks
April 17, 2017 1222 Observed ducks and gulls
April 24, 2017 1031 1 - 50
May 1, 2017 1242 1 - 50
June 5, 2017 1204 1 - 50
June 19, 2017 1142 Observed 6 birds
June 26, 2017 1023 Observed 8 birds
July 3, 2017 1023 1 - 50
July 10, 2017 1315 1 - 50
July 17, 2017 1045 1 - 50
Filtration Avoidance Determination, Section 4.1, Waterfowl Management Program
49
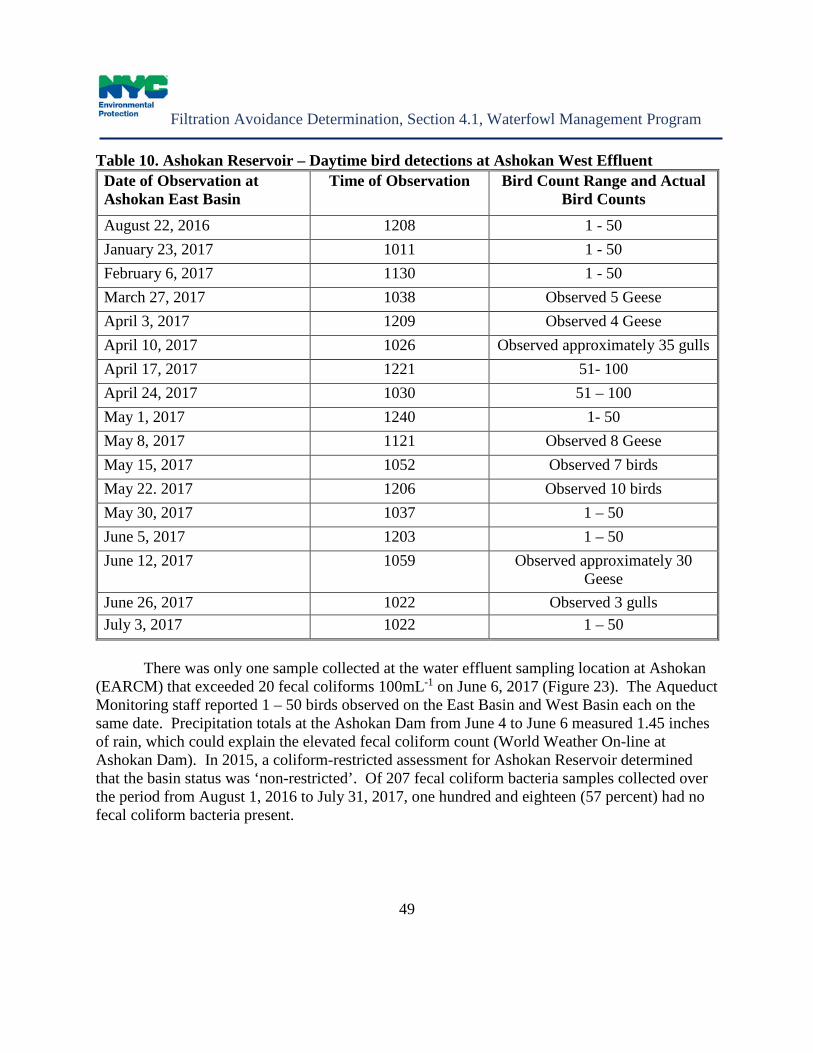
Table 10. Ashokan Reservoir – Daytime bird detections at Ashokan West Effluent Date of Observation at Ashokan East Basin
Time of Observation
Bird Count Range and Actual Bird Counts
August 22, 2016 1208 1 - 50 January 23, 2017 1011 1 - 50 February 6, 2017 1130 1 - 50 March 27, 2017 1038 Observed 5 Geese April 3, 2017 1209 Observed 4 Geese April 10, 2017 1026 Observed approximately 35 gulls April 17, 2017 1221 51- 100 April 24, 2017 1030 51 – 100 May 1, 2017 1240 1- 50 May 8, 2017 1121 Observed 8 Geese May 15, 2017 1052 Observed 7 birds May 22. 2017 1206 Observed 10 birds May 30, 2017 1037 1 – 50 June 5, 2017 1203 1 – 50 June 12, 2017 1059 Observed approximately 30
Geese June 26, 2017 1022 Observed 3 gulls July 3, 2017 1022 1 – 50
There was only one sample collected at the water effluent sampling location at Ashokan
(EARCM) that exceeded 20 fecal coliforms 100mL-1 on June 6, 2017 (Figure 23). The Aqueduct Monitoring staff reported 1 – 50 birds observed on the East Basin and West Basin each on the same date. Precipitation totals at the Ashokan Dam from June 4 to June 6 measured 1.45 inches of rain, which could explain the elevated fecal coliform count (World Weather On-line at Ashokan Dam). In 2015, a coliform-restricted assessment for Ashokan Reservoir determined that the basin status was ‘non-restricted’. Of 207 fecal coliform bacteria samples collected over the period from August 1, 2016 to July 31, 2017, one hundred and eighteen (57 percent) had no fecal coliform bacteria present.

Waterfowl Management Program
50
Figure 23. Ashokan Reservoir fecal coliforms 100mL-1 at Ashokan Effluent (EARCM) vs. total waterbirds (8/1/2012 to 7/31/2017). Waterbird surveys discontinued on 4/30/2013.
Since the inception of the WMP Expanded Program at Ashokan Reservoir in March 2002, DEP has not been required to initiate an “as-needed” bird dispersal action due to elevated fecal coliform bacteria and/or waterbird counts. In the event a bird dispersal action were required, DEP would implement a program using contractor personnel to eliminate a water quality threat.
DEP conducted reproductive control on Canada Geese from April 1 through May 31, 2017 to reduce productivity at Ashokan. In 2017, eleven Canada Geese nests were identified and 54 eggs were depredated (Table 4). In 2016, seven Canada Geese nests were identified with 21 eggs depredated. The egg-depredation success rate at the Ashokan Reservoir was 78 percent in both 2016 and 2017. Fifteen goslings were observed in late spring 2017 compared to six observed in spring 2016. There were no Mute Swan or Double-crested Cormorant found nesting in 2017. DEP maintains compliance with the NYSDEC endangered species regulations to protect nesting Bald Eagles on NYC reservoirs during routine water quality sampling and bird observation activities (Figure 24).
0
1000
2000
3000
4000
5000
0
20
40
60
80
100
120
140
160
Aug
-12
Jan-
13
Jul-1
3
Jan-
14
Jul-1
4
Jan-
15
Jul-1
5
Jan-
16
Jul-1
6
Jan-
17
Jul-1
7
Total Waterbirds
Feca
l Col
iform
Bac
teria
(col
iform
100
mL-1
)
Fecal Coliform Bacteria - EARCM Total Waterbirds

Filtration Avoidance Determination, Section 4.1, Waterfowl Management Program
51
Figure 24. Bald Eagle nesting on the Ashokan Reservoir West Basin. Photo by Chris Nadareski

Waterfowl Management Program
52
5. Croton Falls Reservoir The 2007 FAD lists Croton Falls Reservoir as one of five reservoirs covered under the “as-needed” criteria for waterbird management. Since the inception of the WMP, only one “as needed” waterbird dispersal action was conducted at Croton Falls. The reservoir is divided into five bird zones associated with reservoir water quality sampling locations (Figure 46). Waterbird population surveys were suspended in May 2013 as per NYSDOH’s March 13, 2013 approval to reduce routine waterbird population monitoring from biweekly surveys to an “as-needed” option. As-needed actions are based on fecal coliform bacteria levels at the effluent, operational changes in water delivery and waterbird population counts. In the event a bird dispersal action is required, DEP would initiate daily waterbird observations and dispersal activities using contractor personnel to eliminate a water quality threat.
Nocturnal waterbird counts were conducted four times from mid-March to mid-April 2017 for compliance with the NYSDOH for pump testing operations at Croton Falls. Waterbird counts ranged from 1,404 on March 24, 2017 to 121 on April 14, 2017.
Figure 25. Croton Falls Reservoir fecal coliforms 100mL-1 at Croton Falls Effluent vs. total waterbirds (8/1/2012 to 7/31/2017). Waterbird surveys discontinued on 4/30/2013.
0
1000
2000
3000
4000
5000
0
20
40
60
80
100
Aug
-12
Jan-
13
Jul-1
3
Jan-
14
Jul-1
4
Jan-
15
Jul-1
5
Jan-
16
Jul-1
6
Jan-
17
Jul-1
7
Total Waterbirds
Feca
l Col
iform
Bac
teria
(col
iform
100
mL-
1 )
Fecal Coliform Bacteria - Croton Falls Effluent Total Waterbirds
2 fecal coliform samples were Too Numerous to
Count on March 29-30, 2017
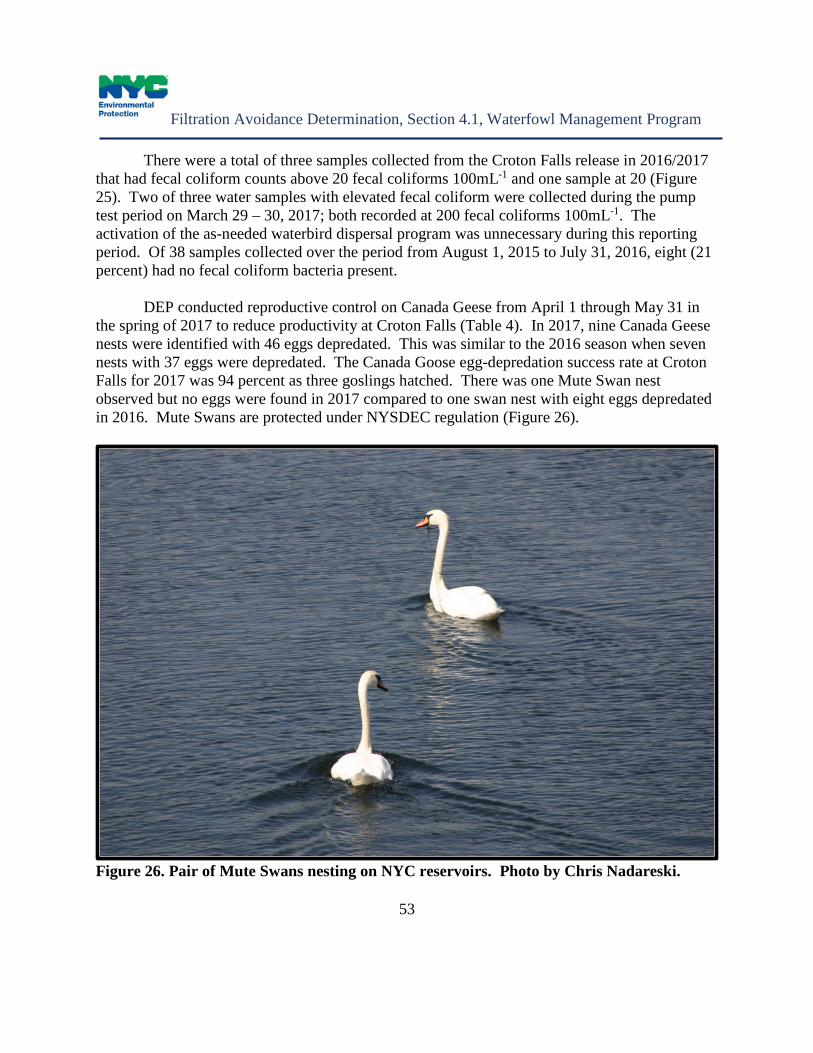
Filtration Avoidance Determination, Section 4.1, Waterfowl Management Program
53
There were a total of three samples collected from the Croton Falls release in 2016/2017 that had fecal coliform counts above 20 fecal coliforms 100mL-1 and one sample at 20 (Figure 25). Two of three water samples with elevated fecal coliform were collected during the pump test period on March 29 – 30, 2017; both recorded at 200 fecal coliforms 100mL-1. The activation of the as-needed waterbird dispersal program was unnecessary during this reporting period. Of 38 samples collected over the period from August 1, 2015 to July 31, 2016, eight (21 percent) had no fecal coliform bacteria present.
DEP conducted reproductive control on Canada Geese from April 1 through May 31 in
the spring of 2017 to reduce productivity at Croton Falls (Table 4). In 2017, nine Canada Geese nests were identified with 46 eggs depredated. This was similar to the 2016 season when seven nests with 37 eggs were depredated. The Canada Goose egg-depredation success rate at Croton Falls for 2017 was 94 percent as three goslings hatched. There was one Mute Swan nest observed but no eggs were found in 2017 compared to one swan nest with eight eggs depredated in 2016. Mute Swans are protected under NYSDEC regulation (Figure 26).
Figure 26. Pair of Mute Swans nesting on NYC reservoirs. Photo by Chris Nadareski.
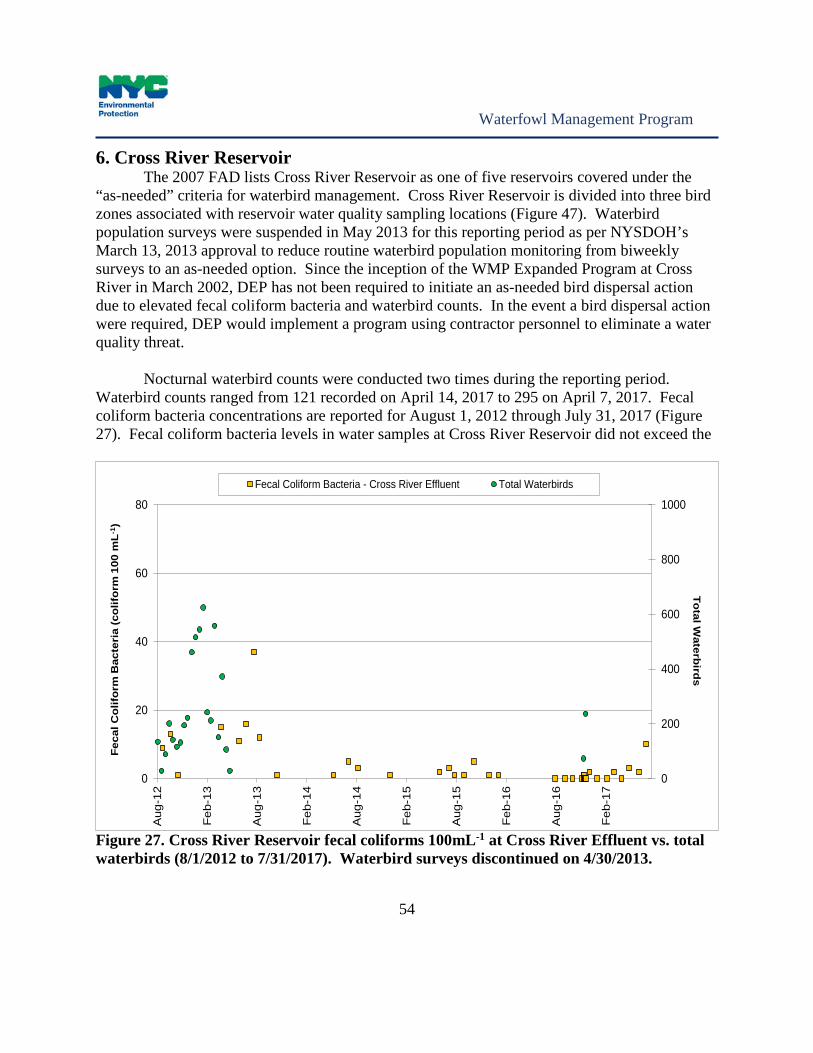
Waterfowl Management Program
54
6. Cross River Reservoir The 2007 FAD lists Cross River Reservoir as one of five reservoirs covered under the “as-needed” criteria for waterbird management. Cross River Reservoir is divided into three bird zones associated with reservoir water quality sampling locations (Figure 47). Waterbird population surveys were suspended in May 2013 for this reporting period as per NYSDOH’s March 13, 2013 approval to reduce routine waterbird population monitoring from biweekly surveys to an as-needed option. Since the inception of the WMP Expanded Program at Cross River in March 2002, DEP has not been required to initiate an as-needed bird dispersal action due to elevated fecal coliform bacteria and waterbird counts. In the event a bird dispersal action were required, DEP would implement a program using contractor personnel to eliminate a water quality threat.
Nocturnal waterbird counts were conducted two times during the reporting period. Waterbird counts ranged from 121 recorded on April 14, 2017 to 295 on April 7, 2017. Fecal coliform bacteria concentrations are reported for August 1, 2012 through July 31, 2017 (Figure 27). Fecal coliform bacteria levels in water samples at Cross River Reservoir did not exceed the
Figure 27. Cross River Reservoir fecal coliforms 100mL-1 at Cross River Effluent vs. total waterbirds (8/1/2012 to 7/31/2017). Waterbird surveys discontinued on 4/30/2013.
0
200
400
600
800
1000
0
20
40
60
80
Aug
-12
Feb
-13
Aug
-13
Feb
-14
Aug
-14
Feb
-15
Aug
-15
Feb
-16
Aug
-16
Feb
-17
Total Waterbirds
Feca
l Col
iform
Bac
teri
a (c
olifo
rm 1
00 m
L-1 )
Fecal Coliform Bacteria - Cross River Effluent Total Waterbirds
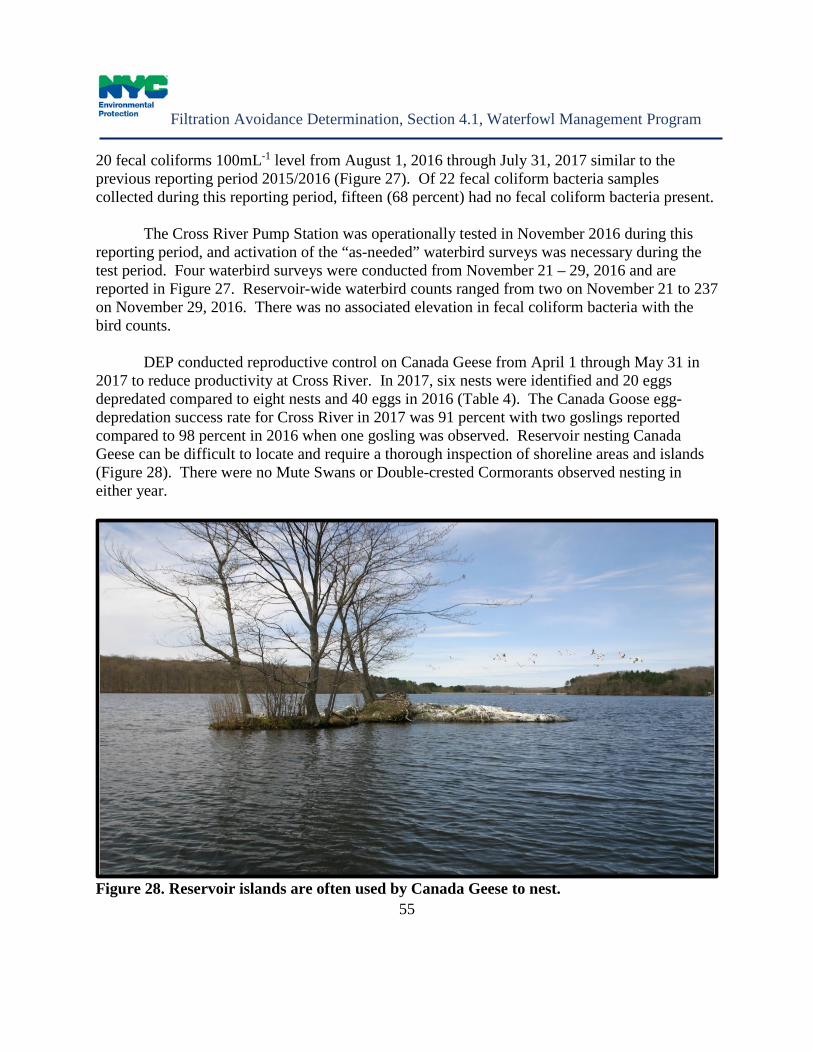
Filtration Avoidance Determination, Section 4.1, Waterfowl Management Program
55
20 fecal coliforms 100mL-1 level from August 1, 2016 through July 31, 2017 similar to the previous reporting period 2015/2016 (Figure 27). Of 22 fecal coliform bacteria samples collected during this reporting period, fifteen (68 percent) had no fecal coliform bacteria present.
The Cross River Pump Station was operationally tested in November 2016 during this reporting period, and activation of the “as-needed” waterbird surveys was necessary during the test period. Four waterbird surveys were conducted from November 21 – 29, 2016 and are reported in Figure 27. Reservoir-wide waterbird counts ranged from two on November 21 to 237 on November 29, 2016. There was no associated elevation in fecal coliform bacteria with the bird counts.
DEP conducted reproductive control on Canada Geese from April 1 through May 31 in
2017 to reduce productivity at Cross River. In 2017, six nests were identified and 20 eggs depredated compared to eight nests and 40 eggs in 2016 (Table 4). The Canada Goose egg-depredation success rate for Cross River in 2017 was 91 percent with two goslings reported compared to 98 percent in 2016 when one gosling was observed. Reservoir nesting Canada Geese can be difficult to locate and require a thorough inspection of shoreline areas and islands (Figure 28). There were no Mute Swans or Double-crested Cormorants observed nesting in either year.
Figure 28. Reservoir islands are often used by Canada Geese to nest.

Waterfowl Management Program
56
7. Hillview Reservoir The City’s Long-Term Watershed Protection Program (July 2007 FAD) expanded the Waterfowl Management Program to include Hillview Reservoir on an “as-needed” basis similar to the 2002 FAD expansion for five additional reservoirs discussed above. DEP initiated an in-depth program for waterbird management starting in 1993 followed by program enhancements with the 2007 FAD and again in 2011 under the Hillview Administrative Order on Consent. Hillview Reservoir is divided into two bird zones associated with the reservoirs two distinct basins and water quality sampling stations (Figures 48 and 49). Waterbird population survey frequencies have varied through the years but generally had been conducted weekly at minimum and daily in recent years. A variety of bird deterrent and dispersal methods have been implemented since 1993 with a high level of success reducing, and in most cases eliminating, the presence of roosting waterbirds; particularly geese, swans, cormorants, ducks, and gulls.
Prior to 1993, DEP Operations staff employed a variety of noisemakers (bottle rockets and shotgun blasts) to eliminate birds roosting diurnally at Hillview on an infrequent basis. During the summer of 1993, DEP’s Wildlife Studies Section initiated a formal bird management program to monitor birds throughout the year and develop a bird deterrence/dispersal program. Pyrotechnics and propane-operated cannons were initially used to chase the birds off the water and reservoir shaft buildings. Because of the bird populations, DEP consulted with the United States Department of Agriculture, Animal and Plant Inspection Services, Wildlife Services (USDA) on the design and installation of an overhead bird deterrent wire system. In July 1994, the bird deterrent wire system was partially installed which formed an aerial grid above the surface water to prevent birds such as swans, cormorants, geese, gulls and ducks from landing and defecating in the water. The wire grid, which was mostly completed by the spring of 1995, consisted of a combination of high-test monofilament, Kevlar wire, and twine. The grid was strung along the shoreline fences spanning a distance of nearly 1,200 feet. DEP staff maintained this wire grid system from 1994 to 2006, after which a contract was obtained to install state-of-the-art bird wire deterrent system using Kevlar-coated wire strung on 15’ stanchions with reel tensioning devices at the base. This work was completed in 2007. DEP staff continue to maintain the overhead bird deterrent wire system on an as needed basis.
DEP and its contractor continued to use pyrotechnics, propane cannons, remote-control
motorboats, and employed physical chasing techniques to supplement the wire system to actively keep birds off the reservoir, influent (Uptake) and effluent (Downtake) facilities, and the reservoir-dividing wall. In the winter of 2008, DEP installed remotely operated propane cannons along the reservoir’s dividing wall to keep gulls and other birds from roosting on the dividing wall railings. The cannons were supplemented by installation of Daddi-Long-Legs (bird deterrent wires) placed on the tops of the 15’ stanchions along the reservoir dividing wall to prevent birds from roosting (Figure 29). In 2013, DEP installed a new bird deterrent wire system along the reservoir’s ½ mile long dividing wall railing to keep gulls and other species from

Filtration Avoidance Determination, Section 4.1, Waterfowl Management Program
57
landing and defecating in the water. The railing wires are routinely maintained and continue to prevent gulls from attempting to land on the reservoir-dividing wall and can be attributed to the reduced gull activity recorded during this reporting period.
Figure 29. Overhead bird deterrent wires installed on 15’ high stanchions with Daddy-Long-Legs installed to prevent waterbirds from roosting and loafing.
A USEPA Administrative Order on Consent governing the covering of Hillview Reservoir (Docket No. SDWA-02-2010-8027 Catskill Delaware System) was signed on May 24, 2010. Under this order, which went into effect on August 1, 2011, DEP began implementing an enhanced wildlife management program at Hillview to further protect the water supply. New best management practices included: increased bird census conducted daily from pre-dawn to post-dusk hours and dispersal from 5:00am until post-dusk hours, mammal population monitoring and removal, Alewife (baitfish) monitoring and removal, animal sanitation inspections (facility and grounds inspections and clean-up of animal feces), use of remote-control motorboats (Figure 30), swallow and sparrow management, and continued monthly reporting on wildlife management activities at Hillview Reservoir.

Waterfowl Management Program
58
Figure 30. Dispersal of Ruddy Ducks using remote control motorboats and pyrotechnics. Photo by Chris Nadareski
Overnight waterbird counts have been conducted since 1993 and daytime counts were initiated in the summer of 2004 with less frequent data collected from 1993 through 2004 (Figures 31 and 32). Prior to bird wire installation in 1994, gulls comprised more than 70 percent of the night-roosting species on the reservoir. In 2015/2016, night-roosting guilds of birds comprised the following breakdown: Canada Geese 0.2 percent, Gull Spp. 0.8 percent, and ducks about 99 percent similar to the previous reporting period. Except for a low number of diving ducks (Ruddy Ducks, Oxyura jamaicensis) that arrive during fall migration, all waterbirds observed and reported on both nocturnal and diurnal surveys were dispersed from the reservoir using pyrotechnics, cannons, and physical chasing from 5:00am until post-dusk times. Physical chasing of birds occurs from the time of personnel arrival starting as early as 5:00am. DEP and its contractor crews were largely successful in dispersing all other birds including terrestrial species such as European Starlings upon observation.
During this reporting period, there were 2,553 bird harassment actions that dispersed 6,645 waterbirds (294 Canada Geese, 4,272 Gulls, and 2,078 ducks). Bird harassment actions included both birds that landed in the reservoir and those attempting to land. The breakdown of harassment actions included the use of 2,160 bird bangers, 311 physical chases, 66 propane cannon discharges, and 16 uses of a johnboat or remote control boat.
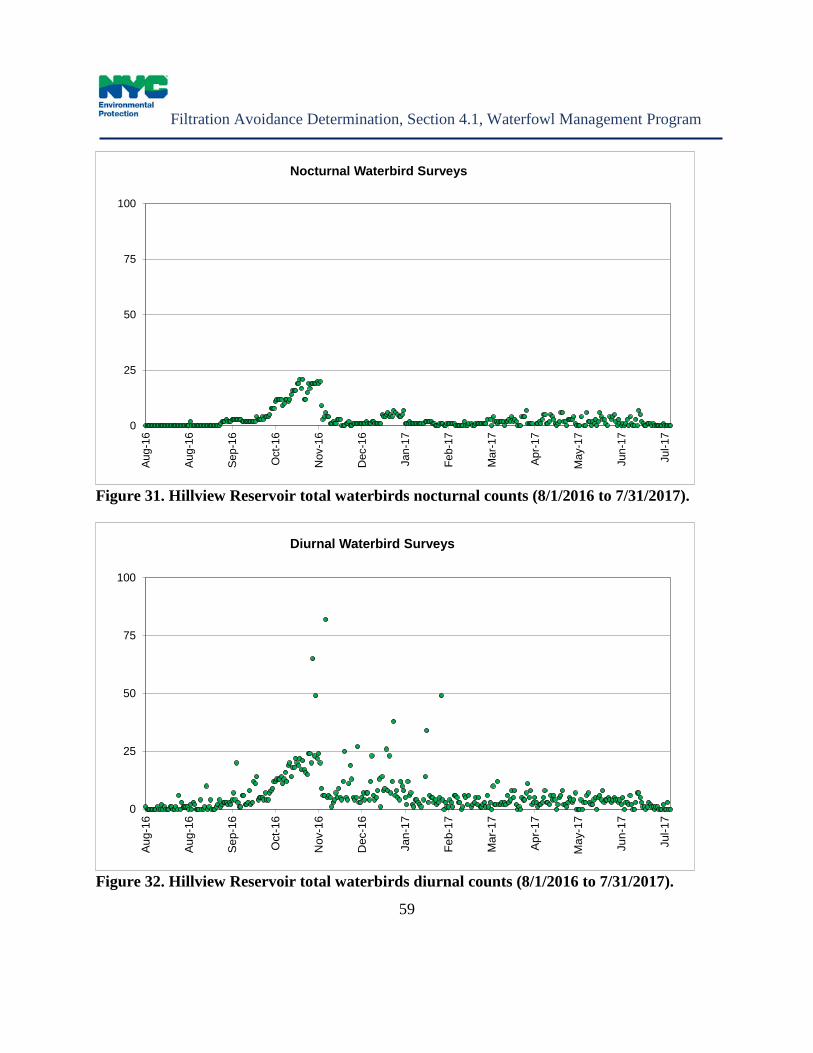
Filtration Avoidance Determination, Section 4.1, Waterfowl Management Program
59
Figure 31. Hillview Reservoir total waterbirds nocturnal counts (8/1/2016 to 7/31/2017).
Figure 32. Hillview Reservoir total waterbirds diurnal counts (8/1/2016 to 7/31/2017).
0
25
50
75
100
Aug-
16
Aug-
16
Sep-
16
Oct
-16
Nov
-16
Dec
-16
Jan-
17
Feb-
17
Mar
-17
Apr-1
7
May
-17
Jun-
17
Jul-1
7
Nocturnal Waterbird Surveys
0
25
50
75
100
Aug
-16
Aug
-16
Sep
-16
Oct
-16
Nov
-16
Dec
-16
Jan-
17
Feb-
17
Mar
-17
Apr
-17
May
-17
Jun-
17
Jul-1
7
Diurnal Waterbird Surveys
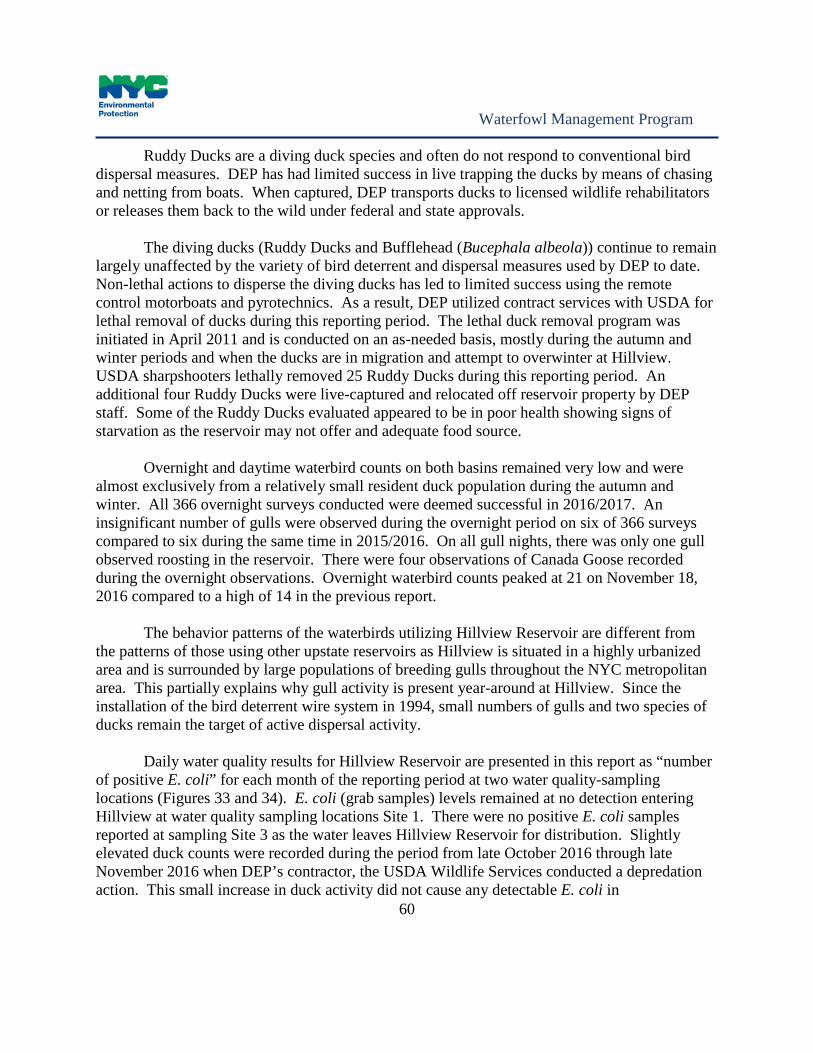
Waterfowl Management Program
60
Ruddy Ducks are a diving duck species and often do not respond to conventional bird dispersal measures. DEP has had limited success in live trapping the ducks by means of chasing and netting from boats. When captured, DEP transports ducks to licensed wildlife rehabilitators or releases them back to the wild under federal and state approvals.
The diving ducks (Ruddy Ducks and Bufflehead (Bucephala albeola)) continue to remain
largely unaffected by the variety of bird deterrent and dispersal measures used by DEP to date. Non-lethal actions to disperse the diving ducks has led to limited success using the remote control motorboats and pyrotechnics. As a result, DEP utilized contract services with USDA for lethal removal of ducks during this reporting period. The lethal duck removal program was initiated in April 2011 and is conducted on an as-needed basis, mostly during the autumn and winter periods and when the ducks are in migration and attempt to overwinter at Hillview. USDA sharpshooters lethally removed 25 Ruddy Ducks during this reporting period. An additional four Ruddy Ducks were live-captured and relocated off reservoir property by DEP staff. Some of the Ruddy Ducks evaluated appeared to be in poor health showing signs of starvation as the reservoir may not offer and adequate food source.
Overnight and daytime waterbird counts on both basins remained very low and were
almost exclusively from a relatively small resident duck population during the autumn and winter. All 366 overnight surveys conducted were deemed successful in 2016/2017. An insignificant number of gulls were observed during the overnight period on six of 366 surveys compared to six during the same time in 2015/2016. On all gull nights, there was only one gull observed roosting in the reservoir. There were four observations of Canada Goose recorded during the overnight observations. Overnight waterbird counts peaked at 21 on November 18, 2016 compared to a high of 14 in the previous report.
The behavior patterns of the waterbirds utilizing Hillview Reservoir are different from
the patterns of those using other upstate reservoirs as Hillview is situated in a highly urbanized area and is surrounded by large populations of breeding gulls throughout the NYC metropolitan area. This partially explains why gull activity is present year-around at Hillview. Since the installation of the bird deterrent wire system in 1994, small numbers of gulls and two species of ducks remain the target of active dispersal activity.
Daily water quality results for Hillview Reservoir are presented in this report as “number
of positive E. coli” for each month of the reporting period at two water quality-sampling locations (Figures 33 and 34). E. coli (grab samples) levels remained at no detection entering Hillview at water quality sampling locations Site 1. There were no positive E. coli samples reported at sampling Site 3 as the water leaves Hillview Reservoir for distribution. Slightly elevated duck counts were recorded during the period from late October 2016 through late November 2016 when DEP’s contractor, the USDA Wildlife Services conducted a depredation action. This small increase in duck activity did not cause any detectable E. coli in
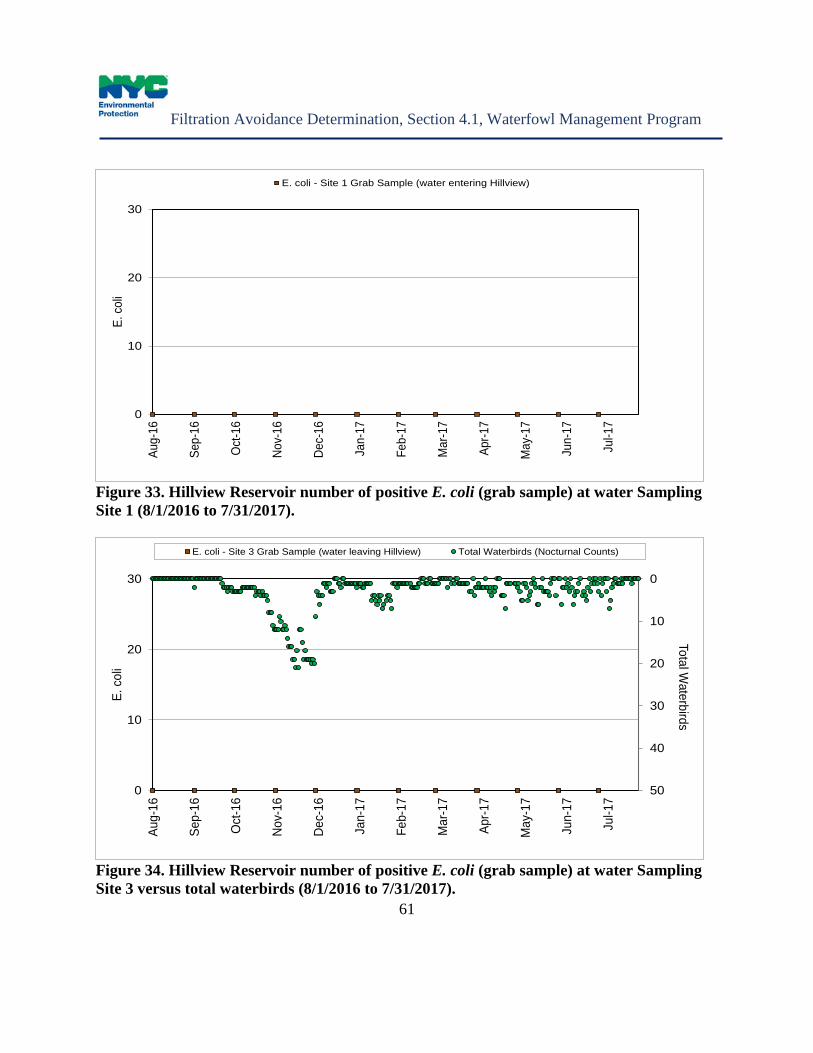
Filtration Avoidance Determination, Section 4.1, Waterfowl Management Program
61
Figure 33. Hillview Reservoir number of positive E. coli (grab sample) at water Sampling Site 1 (8/1/2016 to 7/31/2017).
Figure 34. Hillview Reservoir number of positive E. coli (grab sample) at water Sampling Site 3 versus total waterbirds (8/1/2016 to 7/31/2017).
0
10
20
30
Aug-
16
Sep-
16
Oct
-16
Nov-
16
Dec-
16
Jan-
17
Feb-
17
Mar
-17
Apr-1
7
May
-17
Jun-
17
Jul-1
7
E. c
oli
E. coli - Site 1 Grab Sample (water entering Hillview)
0
10
20
30
40
500
10
20
30
Aug-
16
Sep-
16
Oct
-16
Nov
-16
Dec
-16
Jan-
17
Feb-
17
Mar
-17
Apr-1
7
May
-17
Jun-
17
Jul-1
7
Total Waterbirds
E. c
oli
E. coli - Site 3 Grab Sample (water leaving Hillview) Total Waterbirds (Nocturnal Counts)
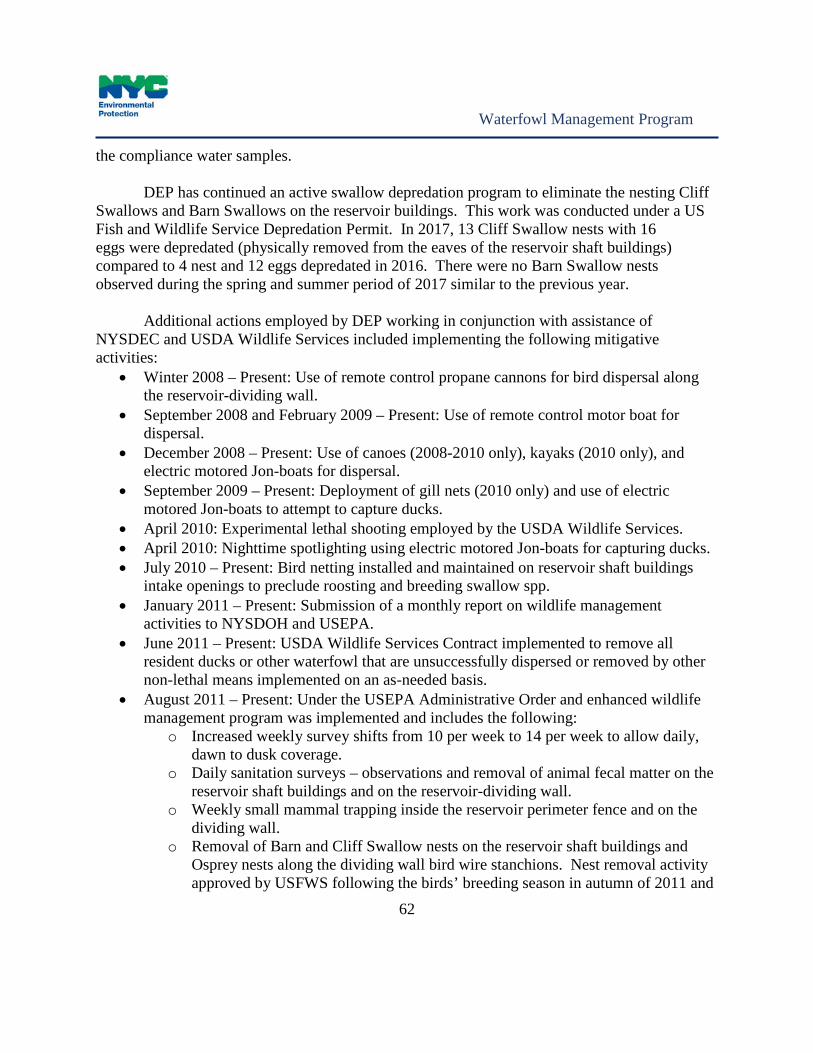
Waterfowl Management Program
62
the compliance water samples. DEP has continued an active swallow depredation program to eliminate the nesting Cliff
Swallows and Barn Swallows on the reservoir buildings. This work was conducted under a US Fish and Wildlife Service Depredation Permit. In 2017, 13 Cliff Swallow nests with 16 eggs were depredated (physically removed from the eaves of the reservoir shaft buildings) compared to 4 nest and 12 eggs depredated in 2016. There were no Barn Swallow nests observed during the spring and summer period of 2017 similar to the previous year.
Additional actions employed by DEP working in conjunction with assistance of NYSDEC and USDA Wildlife Services included implementing the following mitigative activities:
• Winter 2008 – Present: Use of remote control propane cannons for bird dispersal along the reservoir-dividing wall.
• September 2008 and February 2009 – Present: Use of remote control motor boat for dispersal.
• December 2008 – Present: Use of canoes (2008-2010 only), kayaks (2010 only), and electric motored Jon-boats for dispersal.
• September 2009 – Present: Deployment of gill nets (2010 only) and use of electric motored Jon-boats to attempt to capture ducks.
• April 2010: Experimental lethal shooting employed by the USDA Wildlife Services. • April 2010: Nighttime spotlighting using electric motored Jon-boats for capturing ducks. • July 2010 – Present: Bird netting installed and maintained on reservoir shaft buildings
intake openings to preclude roosting and breeding swallow spp. • January 2011 – Present: Submission of a monthly report on wildlife management
activities to NYSDOH and USEPA. • June 2011 – Present: USDA Wildlife Services Contract implemented to remove all
resident ducks or other waterfowl that are unsuccessfully dispersed or removed by other non-lethal means implemented on an as-needed basis.
• August 2011 – Present: Under the USEPA Administrative Order and enhanced wildlife management program was implemented and includes the following:
o Increased weekly survey shifts from 10 per week to 14 per week to allow daily, dawn to dusk coverage.
o Daily sanitation surveys – observations and removal of animal fecal matter on the reservoir shaft buildings and on the reservoir-dividing wall.
o Weekly small mammal trapping inside the reservoir perimeter fence and on the dividing wall.
o Removal of Barn and Cliff Swallow nests on the reservoir shaft buildings and Osprey nests along the dividing wall bird wire stanchions. Nest removal activity approved by USFWS following the birds’ breeding season in autumn of 2011 and
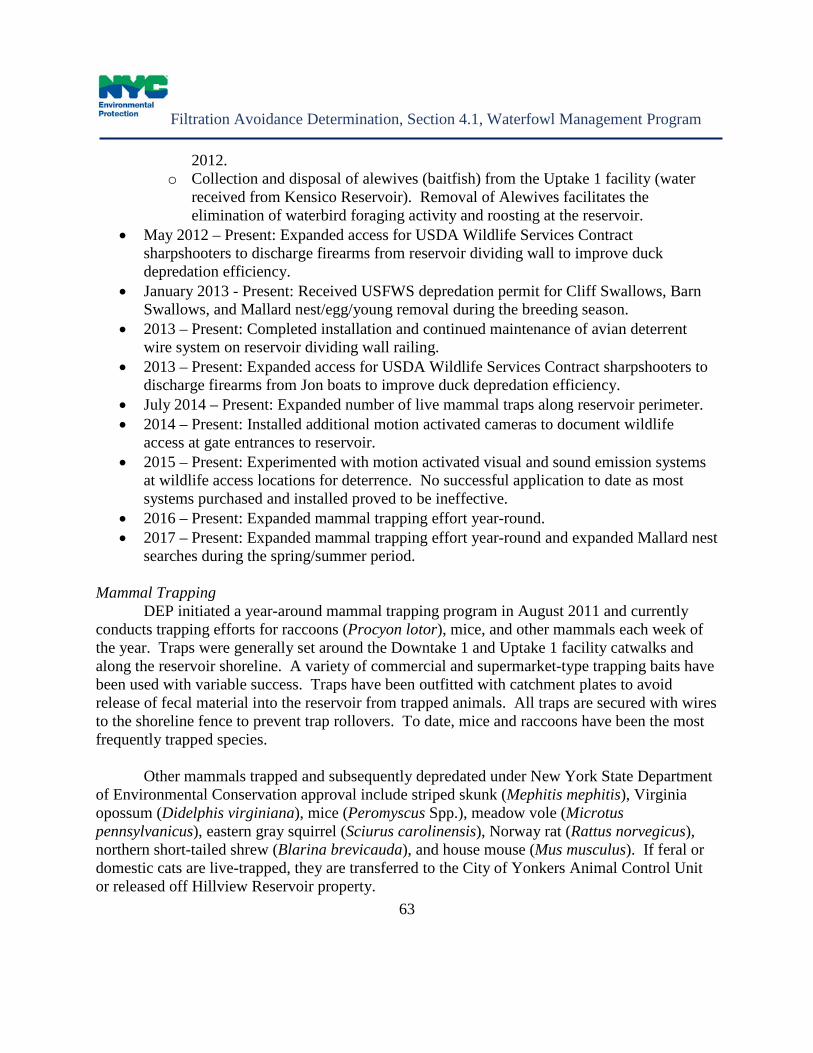
Filtration Avoidance Determination, Section 4.1, Waterfowl Management Program
63
2012. o Collection and disposal of alewives (baitfish) from the Uptake 1 facility (water
received from Kensico Reservoir). Removal of Alewives facilitates the elimination of waterbird foraging activity and roosting at the reservoir.
• May 2012 – Present: Expanded access for USDA Wildlife Services Contract sharpshooters to discharge firearms from reservoir dividing wall to improve duck depredation efficiency.
• January 2013 - Present: Received USFWS depredation permit for Cliff Swallows, Barn Swallows, and Mallard nest/egg/young removal during the breeding season.
• 2013 – Present: Completed installation and continued maintenance of avian deterrent wire system on reservoir dividing wall railing.
• 2013 – Present: Expanded access for USDA Wildlife Services Contract sharpshooters to discharge firearms from Jon boats to improve duck depredation efficiency.
• July 2014 – Present: Expanded number of live mammal traps along reservoir perimeter. • 2014 – Present: Installed additional motion activated cameras to document wildlife
access at gate entrances to reservoir. • 2015 – Present: Experimented with motion activated visual and sound emission systems
at wildlife access locations for deterrence. No successful application to date as most systems purchased and installed proved to be ineffective.
• 2016 – Present: Expanded mammal trapping effort year-round. • 2017 – Present: Expanded mammal trapping effort year-round and expanded Mallard nest
searches during the spring/summer period. Mammal Trapping
DEP initiated a year-around mammal trapping program in August 2011 and currently conducts trapping efforts for raccoons (Procyon lotor), mice, and other mammals each week of the year. Traps were generally set around the Downtake 1 and Uptake 1 facility catwalks and along the reservoir shoreline. A variety of commercial and supermarket-type trapping baits have been used with variable success. Traps have been outfitted with catchment plates to avoid release of fecal material into the reservoir from trapped animals. All traps are secured with wires to the shoreline fence to prevent trap rollovers. To date, mice and raccoons have been the most frequently trapped species.
Other mammals trapped and subsequently depredated under New York State Department
of Environmental Conservation approval include striped skunk (Mephitis mephitis), Virginia opossum (Didelphis virginiana), mice (Peromyscus Spp.), meadow vole (Microtus pennsylvanicus), eastern gray squirrel (Sciurus carolinensis), Norway rat (Rattus norvegicus), northern short-tailed shrew (Blarina brevicauda), and house mouse (Mus musculus). If feral or domestic cats are live-trapped, they are transferred to the City of Yonkers Animal Control Unit or released off Hillview Reservoir property.
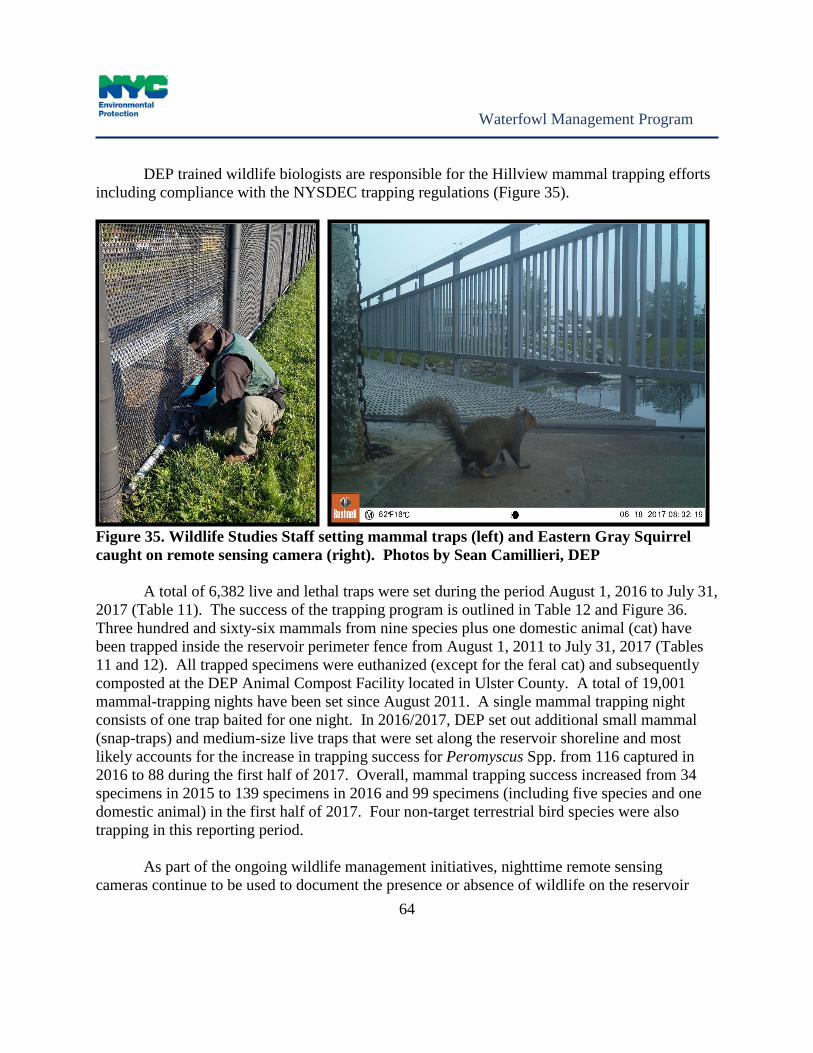
Waterfowl Management Program
64
DEP trained wildlife biologists are responsible for the Hillview mammal trapping efforts including compliance with the NYSDEC trapping regulations (Figure 35).
Figure 35. Wildlife Studies Staff setting mammal traps (left) and Eastern Gray Squirrel caught on remote sensing camera (right). Photos by Sean Camillieri, DEP
A total of 6,382 live and lethal traps were set during the period August 1, 2016 to July 31,
2017 (Table 11). The success of the trapping program is outlined in Table 12 and Figure 36. Three hundred and sixty-six mammals from nine species plus one domestic animal (cat) have been trapped inside the reservoir perimeter fence from August 1, 2011 to July 31, 2017 (Tables 11 and 12). All trapped specimens were euthanized (except for the feral cat) and subsequently composted at the DEP Animal Compost Facility located in Ulster County. A total of 19,001 mammal-trapping nights have been set since August 2011. A single mammal trapping night consists of one trap baited for one night. In 2016/2017, DEP set out additional small mammal (snap-traps) and medium-size live traps that were set along the reservoir shoreline and most likely accounts for the increase in trapping success for Peromyscus Spp. from 116 captured in 2016 to 88 during the first half of 2017. Overall, mammal trapping success increased from 34 specimens in 2015 to 139 specimens in 2016 and 99 specimens (including five species and one domestic animal) in the first half of 2017. Four non-target terrestrial bird species were also trapping in this reporting period.
As part of the ongoing wildlife management initiatives, nighttime remote sensing cameras continue to be used to document the presence or absence of wildlife on the reservoir
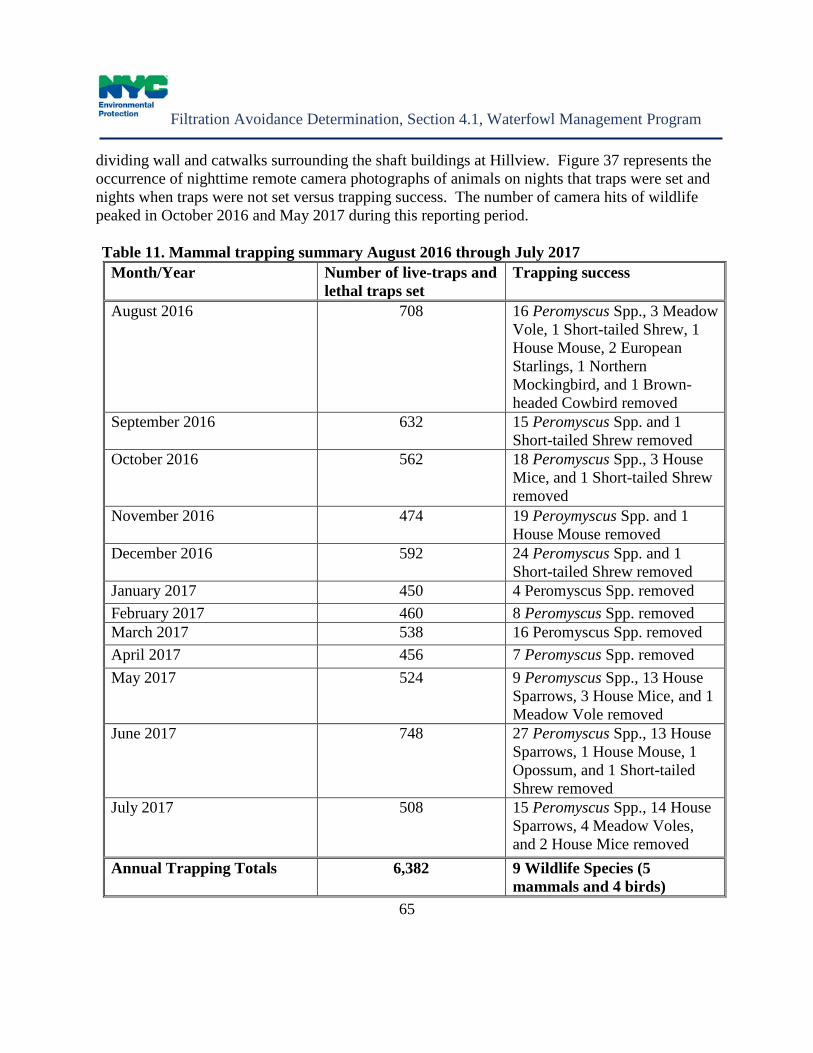
Filtration Avoidance Determination, Section 4.1, Waterfowl Management Program
65
dividing wall and catwalks surrounding the shaft buildings at Hillview. Figure 37 represents the occurrence of nighttime remote camera photographs of animals on nights that traps were set and nights when traps were not set versus trapping success. The number of camera hits of wildlife peaked in October 2016 and May 2017 during this reporting period. Table 11. Mammal trapping summary August 2016 through July 2017
Month/Year Number of live-traps and lethal traps set
Trapping success
August 2016 708 16 Peromyscus Spp., 3 Meadow Vole, 1 Short-tailed Shrew, 1 House Mouse, 2 European Starlings, 1 Northern Mockingbird, and 1 Brown-headed Cowbird removed
September 2016 632 15 Peromyscus Spp. and 1 Short-tailed Shrew removed
October 2016 562 18 Peromyscus Spp., 3 House Mice, and 1 Short-tailed Shrew removed
November 2016 474 19 Peroymyscus Spp. and 1 House Mouse removed
December 2016 592 24 Peromyscus Spp. and 1 Short-tailed Shrew removed
January 2017 450 4 Peromyscus Spp. removed February 2017 460 8 Peromyscus Spp. removed March 2017 538 16 Peromyscus Spp. removed April 2017 456 7 Peromyscus Spp. removed May 2017 524 9 Peromyscus Spp., 13 House
Sparrows, 3 House Mice, and 1 Meadow Vole removed
June 2017 748 27 Peromyscus Spp., 13 House Sparrows, 1 House Mouse, 1 Opossum, and 1 Short-tailed Shrew removed
July 2017 508 15 Peromyscus Spp., 14 House Sparrows, 4 Meadow Voles, and 2 House Mice removed
Annual Trapping Totals 6,382 9 Wildlife Species (5 mammals and 4 birds)

Waterfowl Management Program
66
Table 12. Trapping success summary for Hillview Reservoir (August 2011 to July 2017) Species Trapped
2011 (August 1
to December
31)
2012 2013 2014 2015 2016 2017 (January 1 to July
31)
Trapping totals by species
Raccoon 8 5 6 6 5 0 0 30
Striped Skunk
0 1 0 7 3 0 0 11
Opossum 0 0 0 4 6 1 1 12
Mice (Peromyscus
Spp.)
7 0 11 7 13 116 88 242
Meadow Vole
0 0 4 0 0 6 3 13
Short-tailed Shrew
0 0 1 0 0 6 1 8
House Mouse
0 0 0 21 2 7 6 36
Norway Rat 0 0 0 1 4 1 0 6
Gray Squirrel
0 0 0 1 0 1 0 2
Feral or Domestic
Cats (relocated)
0 0 0 4 1 1 0 6
Annual Trapping
totals
15 6 22 51 34 139 99 366
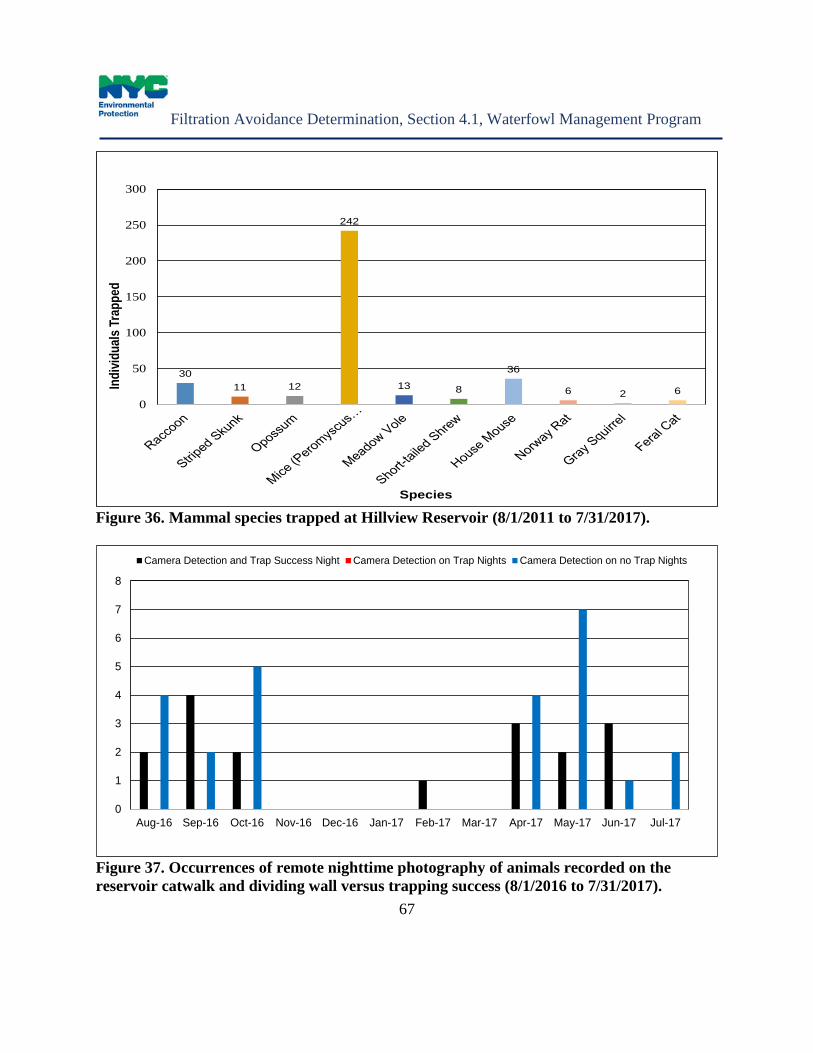
Filtration Avoidance Determination, Section 4.1, Waterfowl Management Program
67
Figure 36. Mammal species trapped at Hillview Reservoir (8/1/2011 to 7/31/2017).
Figure 37. Occurrences of remote nighttime photography of animals recorded on the reservoir catwalk and dividing wall versus trapping success (8/1/2016 to 7/31/2017).
3011 12
242
13 8
36
6 2 60
50
100
150
200
250
300
Indi
vidua
ls Tr
appe
d
Species
0
1
2
3
4
5
6
7
8
Aug-16 Sep-16 Oct-16 Nov-16 Dec-16 Jan-17 Feb-17 Mar-17 Apr-17 May-17 Jun-17 Jul-17
Camera Detection and Trap Success Night Camera Detection on Trap Nights Camera Detection on no Trap Nights

Waterfowl Management Program
68
The low camera detection and trapping success rate during the winter may be attributed to a lack in insect-type food that may attract raccoons and other mammals to the reservoir-dividing wall.
During the spring/summer 2017 waterbird nesting season there were no reported nesting
attempts by Canada Geese or Mute Swans. However, six Mallard nests were identified and 38 eggs depredated under a federal permit compared to four nests and 10 eggs depredated in 2016. Of the six nests found in 2017, fifteen ducklings were live-captured and relocated off reservoir property compared to 55 ducklings that hatched in 2016 (Table 4). All ducklings were promptly live-captured and delivered to wildlife rehabilitators for captive raising and subsequent release at locations distant from Hillview Reservoir (Figure 38). The Mallard egg depredation success rate was up to 72 percent in 2017 compared to 21 percent in 2016. DEP speculates that the urban nesting Mallards continue to adapt to the variety of bird deterrent and dispersal measures. DEP expanded the search of locations for nesting Mallards in 2017.
Figure 38. Mallard ducklings hatch at Hillview before being transported to a wildlife rehabilitation facility. Photo by Susanna Sousa, HDR.
Figure 39 shows two coyotes (Canis latrans) caught on camera during the overnight hours. A pair of coyotes has been present on the Hillview property for several years and have always been observed outside the reservoir perimeter fence. Since the arrival of the coyotes,
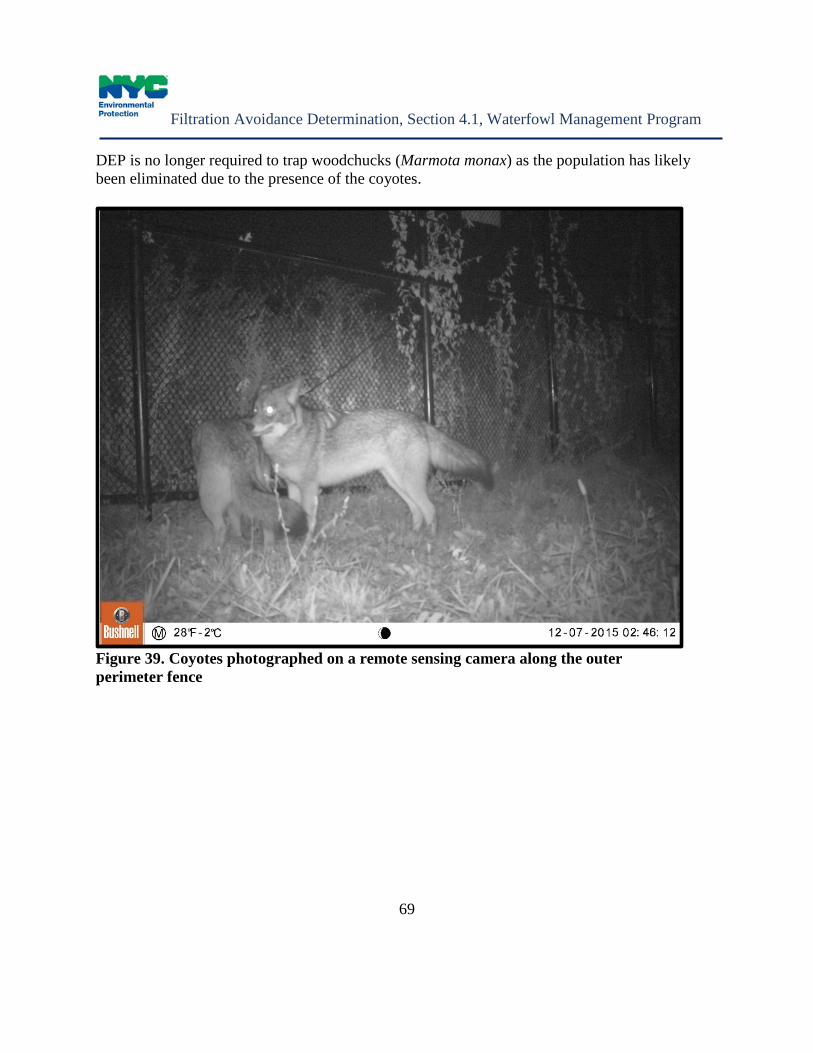
Filtration Avoidance Determination, Section 4.1, Waterfowl Management Program
69
DEP is no longer required to trap woodchucks (Marmota monax) as the population has likely been eliminated due to the presence of the coyotes.
Figure 39. Coyotes photographed on a remote sensing camera along the outer perimeter fence
Waterfowl Management Program
70
THIS PAGE LEFT INTENTIONALLY BLANK
Filtration Avoidance Determination, Section 4.1, Waterfowl Management Program
71
CONCLUSION DEP’s Waterfowl Management Program is a key component of the City’s watershed
protection efforts as outlined under the Revised 2007 Filtration Avoidance Determination that was issued in May 2014 (NYSDOH 2014). The program has helped DEP maximize options for delivering high quality water into distribution. The Waterfowl Management Program has been implemented since 1993 and continues to effectively reduce waterbird populations and reduce fecal coliform bacteria levels which assists DEP in maintaining compliance with the Environmental Protection Agency’s Surface Water Treatment Rule which falls under the Safe Drinking Water Act (42 U.S.C. §300f et seq.).
The reduced waterbird and fecal coliform bacteria counts at Kensico Reservoir and Hillview Reservoir can be attributed directly to the variety of bird dispersal and deterrence techniques. When dispersal tools (motorboats, airboats, propane cannons, and pyrotechnics) and bird deterrent systems (overhead bird wires and netting, reproductive control, and depredation) are used in a variety of combinations they result in the most effective means of reducing bird populations over large open areas of surface water. To date, it remains inconclusive as to what the tolerable number of waterbirds is at NYC reservoirs before water quality would be compromised. As a result, the objective of the Waterfowl Management Program will be to continue with an active bird dispersal program during the bird migratory seasons for Kensico and year-around at Hillview Reservoirs and on an “as-needed” basis for reservoirs that are sources to Kensico.
The establishment of bird-free zones (spatial distributions) around the water intake structure at Kensico Reservoir, whether program-initiated through bird dispersal activities or by the natural process of the birds selecting roosting locations, continues to be a key influence on lower fecal coliform bacteria levels. In 2016, Kensico Reservoir was once again classified as a ‘non-restricted’ basin. The spatial distributions of the birds in relation to the flow dynamics of the reservoir appear to have the greatest influence in the transport of bacteria to the water intakes. Ongoing evaluation of bird population and fecal coliform bacteria data provide evidence that when DEP properly manages its waterbird populations, bird-related fecal coliform bacteria concentrations have remained low.
Bird deterrence measures that include waterbird reproductive management, bird deterrent netting, overhead bird deterrent wires, and shoreline fencing continued to reduce local breeding opportunities around water intake structures and eliminate fecundity during this reporting period. DEP conducted 44 springtime Canada Goose and Mute Swan nest depredation actions on six reservoirs resulting in 53 goose nest and two swan nest depredations whereby 248 eggs were addled. DEP will continue to consider options as deemed necessary for Canada Geese and Mute Swan management to reduce local breeding populations by means of “take” under federal and state depredation permits. The “take” option was utilized by the USDA as part of the

Waterfowl Management Program
72
Westchester County Airport depredation order to remove local Canada Geese during this reporting period. The removal of locally breeding Canada Geese helps break the strong nest-site fidelity these birds exhibit particularly with a species that may survive more than 20 years as a breeder.
At Hillview Reservoir, DEP continued to employ the use of pyrotechnics, physical chasing, remote-operated propane cannons, remote-control motorboats, Daddi-Long-Legs, bird deterrent wires and netting to prevent terrestrial and waterbird species from landing on the reservoir and reservoir dividing wall, and including additional lethal control measures to manage ducks, geese, swallows and sparrows. Remotely operated propane cannons have improved bird deterrence during times of inclement weather when DEP and contractor staff are not permitted on the reservoir-dividing wall and pyrotechnics are rendered ineffective from the reservoir shoreline. As a part of the USEPA Administrative Order on Consent, DEP has initiated small mammal trapping inside the reservoir perimeter fence and on the reservoir-dividing wall. In 2016/2017, 6,382 traps were set (a 28% increase in trapping) in an attempt to eliminate small mammal activity inside the reservoir perimeter fence. DEP conducted egg and nest depredation for nesting swallows under a federal depredation permit again in 2017 with a 100 percent success rate by removing active nests and preventing nesting activity by way of maintenance of bird netting on reservoir shaft buildings. Six Mallard Duck nest were depredated along with a capture and removal of 15 ducklings and one adult Mallard.
Waterbird populations continue to demonstrate seasonal elevations primarily during the autumn and winter periods in all reservoirs listed in this report. Climate alterations can affect behaviors and migratory activity changes of “local” or resident birds such as Canada Geese. Gull populations are migratory and utilize the New York City Reservoir system as a migratory stopover or wintering area until local conditions (i.e. ice and snow cover) become too intolerable. Ice cover on the reservoirs and snow cover in the associated watershed or daily flight range for food often determine whether they will continue in migration or utilize the reservoirs.
DEP continues to remain in compliance with SWTR regulations, with low seasonal elevations of fecal coliform bacteria recorded annually from late autumn through early winter. Monitoring the effects that bird dispersal measures have on each reservoir has been achieved by evaluating over two decades of routine water quality, population surveys and bacterial identification data. Avian population survey results have provided inferences about the potential effects of avian fecal matter based on the spatial and temporal aspects of the birds and have assisted DEP in evaluating the effectiveness of the dispersal measures. DEP will continue with the implementation of the Waterfowl Management Program as part of its Filtration Avoidance Program to protect water quality by managing waterbird and other wildlife populations.

Filtration Avoidance Determination, Section 4.1, Waterfowl Management Program
73
THIS PAGE LEFT INTENTIONALLY BLANK

Waterfowl Management Program
74
THIS PAGE LEFT INTENTIONALLY BLANK
Filtration Avoidance Determination, Section 4.1, Waterfowl Management Program
75
REFERENCES Alderisio, K.A. and N. DeLuca. 1999. Seasonal enumeration of fecal coliform bacteria from
the feces of Ring-billed Gulls (Larus delawarensis) and Canada Geese (Branta canadensis), Applied and Environmental Microbiology 65:5628-5630.
American Public Health Association. 1997. Standard Methods of Water and Wastewater,
American Public Health Association, American Water Works Association, Water Environmental Federal publication, APHA, Washington, D.C.
American Public Health Association. 2006. Standard Methods of Water and Wastewater,
American Public Health Association, American Water Works Association, Water Environmental Federal publication, APHA, Washington, D.C.
Benton, C., F. Khan, P. Monaghan, W.N. Richards and C.B. Shedden. 1983. The contamination
of a major water supply by gulls (Larus sp.). Water Resources 17(7):789-798. Gould, D.J. and M.R. Fletcher. 1978. Gull droppings and their effects on water quality. Water
Research 12:665-672. Hatch, J.J. 1996. Threats to public health from gulls (Laridae). International Journal of
Environmental Health Research 6, 5-16. Hussong, D., J.M. Damare, R.J. Limpert, W.J.L. Sladen, R.M. Weiner, and R.R. Colwell. 1979.
Microbial impact of Canada geese (Branta canadensis) and Whistling swans (Cygnus columbianus columbianus) on aquatic ecosystems. Appl. Environ. Microbiol. 37, 14–20.
Levesque, B., P. Brousseau, P. Simard, E. Dewailly, M. Meisels, D. Ramsay, and J. Joly. 1993.
Impact of ring-billed gulls (Larus delawarensis) on the microbiological quality of recreational water. Applied and Environmental Microbiology 59:1228-1230.
New York City Department of Environmental Protection (DEP). 1992. Kensico Watershed
Study 1991-1992. Division of Drinking Water Quality Control, Valhalla, NY. New York City Department of Environmental Protection (DEP). 1993. Kensico Watershed
Study 1991-1993. Division of Drinking Water Quality Control, Valhalla, NY. New York City Department of Environmental Protection (DEP). 1994. Kensico Watershed
Study Augmented Annual Research Report, January 1993-March 1994. Division of Drinking Water Quality Control, Valhalla, NY.
Waterfowl Management Program
76
New York City Department of Environmental Protection (DEP). 1995. Kensico Watershed Study Annual Research Report, April 1994-March 1995. Division of Drinking Water Quality Control, Valhalla, NY.
New York City Department of Environmental Protection (DEP). 1996. Kensico Watershed
Study Annual Research Report, April 1995-March 1996. Division of Drinking Water Quality Control, Valhalla, NY.
New York City Department of Environmental Protection (DEP). 1997. Kensico Watershed
Study Annual Research Report. April 1996-March 1997. Division of Drinking Water Quality Control, Valhalla, NY.
New York City Department of Environmental Protection (DEP). 1997a. West Branch Drainage Basin Report, A Preliminary Data Review for Planning. Division of Drinking Water Quality Control, Valhalla, NY.
New York City Department of Environmental Protection (DEP). 1998. Kensico Watershed
Study Annual Research Report. April 1997-March 1998. Division of Drinking Water Quality Control, Valhalla, NY.
New York City Department of Environmental Protection (DEP). 1999. Kensico Watershed Study Annual Research Report. April 1998-March 1999. Division of Drinking Water Quality Control, Valhalla, NY.
New York City Department of Environmental Protection (DEP). 2000. Kensico Watershed Study Annual Research Report. April 1999-March 2000. Division of Drinking Water Quality Control, Valhalla, NY.
New York City Department of Environmental Protection (DEP). 2001. Kensico Watershed Study Annual Research Report. April 2000-March 2001. Division of Drinking Water Quality Control, Valhalla, NY.
New York City Department of Environmental Protection (DEP). 2002. Continue
Implementation of Final Waterfowl Management Plan. Division of Drinking Water Quality Control, Valhalla, NY.
New York City Department of Environmental Protection (DEP). 2003. Waterfowl Management
Program. July 31, 2003. Division of Drinking Water Quality Control, Valhalla, NY New York City Department of Environmental Protection (DEP). 2004. Waterfowl Management
Program. July 31, 2004. Division of Drinking Water Quality Control, Valhalla, NY.

Filtration Avoidance Determination, Section 4.1, Waterfowl Management Program
77
New York City Department of Environmental Protection (DEP). 2005. Waterfowl Management
Program. July 31, 2005. Division of Drinking Water Quality Control, Valhalla, NY. New York City Department of Environmental Protection (DEP). 2006. Waterfowl Management
Program. July 31, 2006. Division of Drinking Water Quality Control, Valhalla, NY. New York City Department of Environmental Protection (DEP). 2007. Waterfowl Management
Program. July 31, 2007. Division of Drinking Water Quality Control, Valhalla, NY. New York City Department of Environmental Protection (DEP). 2008. Waterfowl Management
Program. July 31, 2008. Division of Drinking Water Quality Control, Valhalla, NY. New York City Department of Environmental Protection (DEP). 2009. Waterfowl Management
Program. July 31, 2009. Division of Drinking Water Quality Control, Valhalla, NY. New York City Department of Environmental Protection (DEP). 2010. Waterfowl Management
Program. July 31, 2010. Division of Drinking Water Quality Control, Valhalla, NY.
New York City Department of Environmental Protection (DEP). 2011. Waterfowl Management Program. July 31, 2011. Division of Drinking Water Quality Control, Valhalla, NY.
New York City Department of Environmental Protection (DEP). 2012. Waterfowl Management
Program. July 31, 2012. Division of Drinking Water Quality Control, Valhalla, NY. New York City Department of Environmental Protection (DEP). 2013. Waterfowl Management
Program. September 30, 2013. Bureau of Water Supply, Watershed Water Quality Operations, Wildlife Studies Section, Kingston, NY.
New York City Department of Environmental Protection (DEP). 2014. Waterfowl Management
Program. September 30, 2014. Bureau of Water Supply, Watershed Water Quality Operations, Wildlife Studies Section, Kingston, NY.
New York City Department of Environmental Protection (DEP). 2015. Waterfowl Management
Program. September 30, 2015. Bureau of Water Supply, Watershed Water Quality Operations, Wildlife Studies Section, Kingston, NY.
New York City Department of Environmental Protection (DEP). 2016. Waterfowl Management
Program. September 30, 2016. Bureau of Water Supply, Watershed Water Quality Operations, Wildlife Studies Section, Kingston, NY.
Waterfowl Management Program
78
New York City Department of Environmental Protection (DEP). 2014. Watershed Water
Quality Annual Report. September 30, 2014. Bureau of Water Supply. Kingston, NY. New York State Department of Health (NYSDOH). 2013. Letter of Approval. NYSDOH [New York State Department of Health] (NYSDOH in Consultation with USEPA).
2014. New York City Filtration Avoidance Determination. Standridge, J.H., J.J. Delfino, L.B. Kelppe, and R. Butler. 1979. Effect of waterfowl (Anas
platyrhynchos) on indicator bacteria populations in a recreational lake Madison, Wisconsin. Applied Environmental Microbiology. 38(3), 547–550.
USEPA [U.S. Environmental Protection Agency]. 1989. Drinking Water: National Primary
Drinking Water Regulations; Filtration, Disinfection; Turbidity, Giardia lamblia, Viruses, Legionella, and Heterothrophic Bacteria; Final Rule. 54 Fed. Reg. 27486. June 29, 1989. WH-FRL-3607-7. Washington, D.C.
USEPA [U.S. Environmental Protection Agency]. 2007. New York City Filtration Avoidance
Determination. http://www.epa.gov/region2/water/nycshed/2007finalfad.pdf

Filtration Avoidance Determination, Section 4.1, Waterfowl Management Program
79
THIS PAGE LEFT INTENTIONALLY BLANK

Waterfowl Management Program
80
THIS PAGE LEFT INTENTIONALLY BLANK
Filtration Avoidance Determination, Section 4.1, Waterfowl Management Program
81
Appendix A. Reservoir maps with bird zone designations and water sampling locations

Waterfowl Management Program
82
Figure 40. Map of New York City Water Supply System – East of Hudson Region.
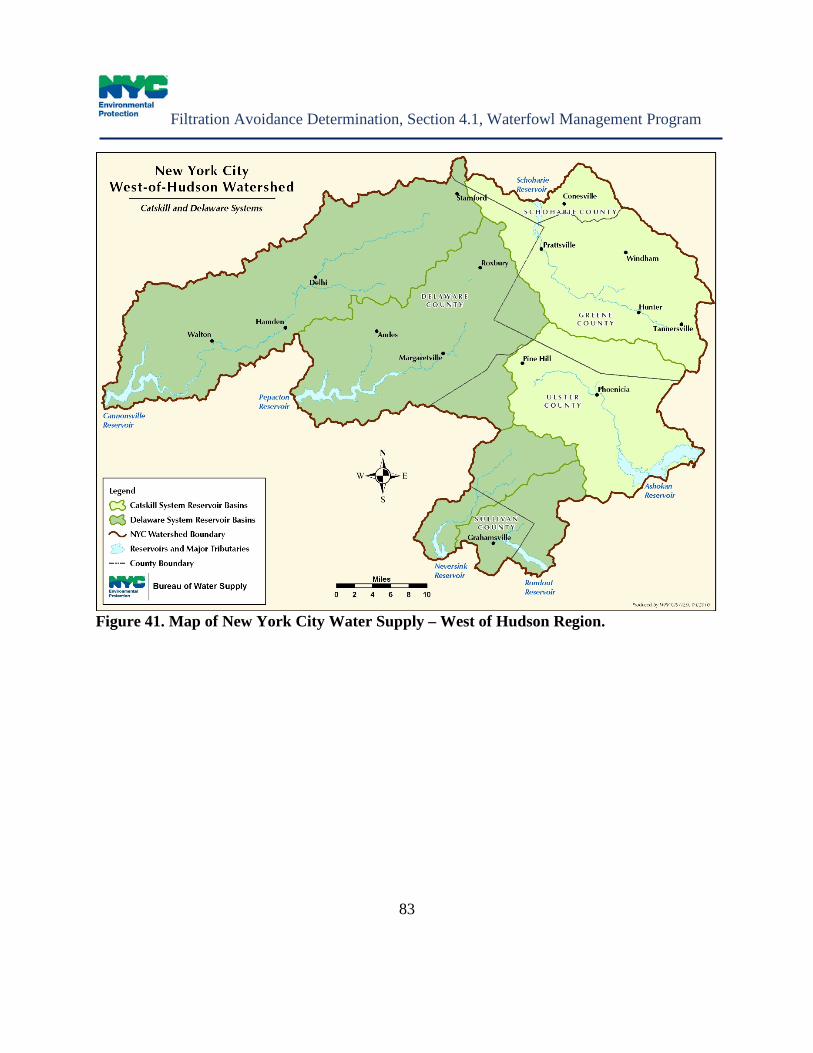
Filtration Avoidance Determination, Section 4.1, Waterfowl Management Program
83
Figure 41. Map of New York City Water Supply – West of Hudson Region.
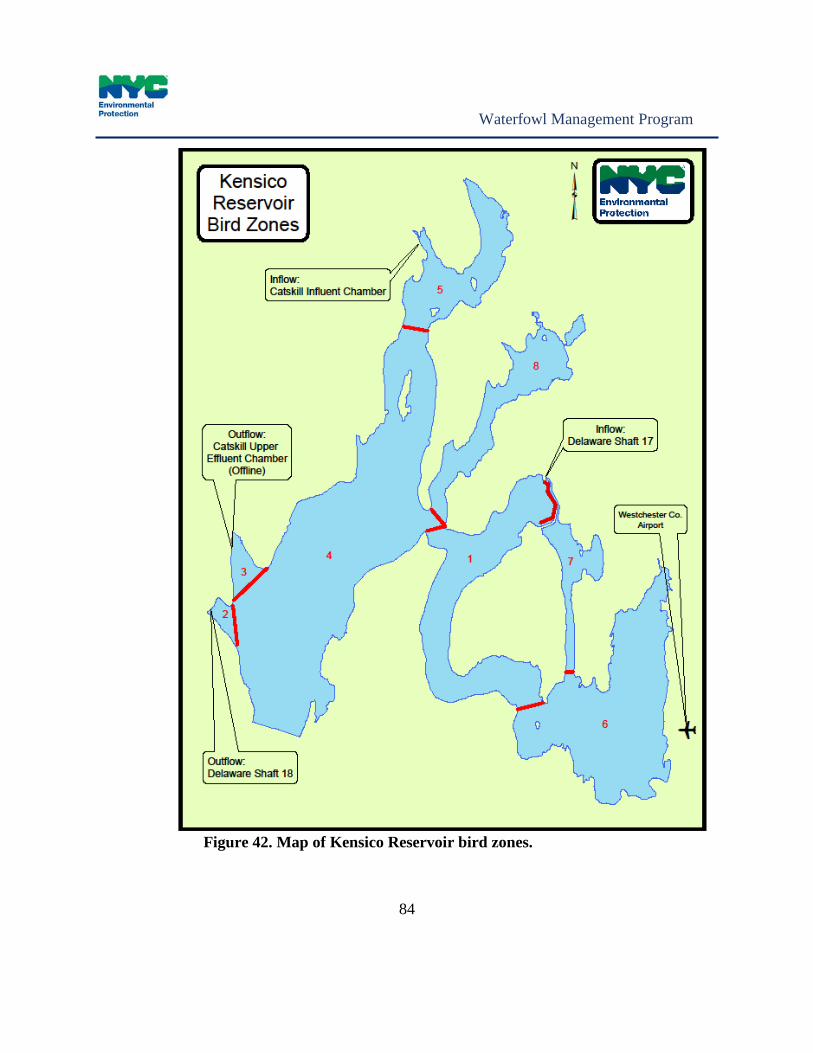
Waterfowl Management Program
84
Figure 42. Map of Kensico Reservoir bird zones.

Filtration Avoidance Determination, Section 4.1, Waterfowl Management Program
85
Figure 43. Map of West Branch Reservoir bird zones.

Waterfowl Management Program
86
Figure 44. Map of Rondout Reservoir bird zones.

Filtration Avoidance Determination, Section 4.1, Waterfowl Management Program
87
Figure 45. Map of Ashokan Reservoir bird zones.

Waterfowl Management Program
88
Figure 46. Map of Croton Falls Reservoir bird zones.

Filtration Avoidance Determination, Section 4.1, Waterfowl Management Program
89
Figure 47. Map of Cross River Reservoir bird zones.
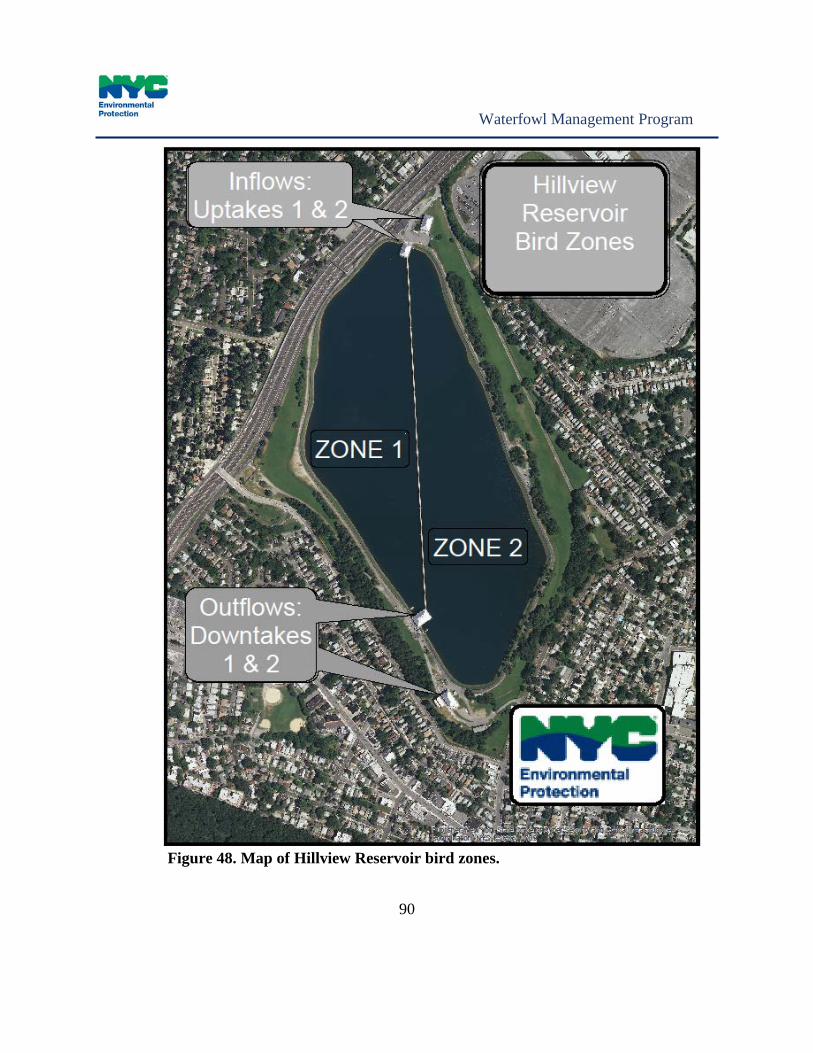
Waterfowl Management Program
90
Figure 48. Map of Hillview Reservoir bird zones.

Filtration Avoidance Determination, Section 4.1, Waterfowl Management Program
91
Figure 49. Map of Hillview Reservoir water sampling locations.