waters gct gcms training manual - iowa state university instructions - nominal... · (gc) parameter...
TRANSCRIPT

1
1234 Hach Hall 515-294-5805 www.cif.iastate.edu
Waters GCT GCMS Training Manual
(Nominal Mass GCMS version) 02/06/2012 S.V.
Location: 1238 Hach Hall Contact: Steve Veysey, 1234 Hach Hall; Kamel Harrata, 1236 Hach Hall Safety All researchers working in 1238 Hach Hall must complete the EH&S courses: “Fire Safety and Extinguisher Training”, and “Lab Safety: Compressed Gas Cylinders”. When preparing samples in 1238A, please wear all appropriate personal protective equipment. Aprons, safety glasses, and rubber gloves are available. Properly dispose of waste solvents and glass pipettes in the containers provided in 1238A. All of the data processing computers and many of the data acquisition computers in this lab have direct links from the desktop to MSDS sheets, the EH&S Laboratory Safety Manual and to the CIF Safety Manual.

2
Table of Contents I. Prerequisites for Training p.2 II. Overview of GCT Instrument and Software p.3 III. Software Organization p.3 Projects p.3 Sample Lists p.4 Method Files (GC and MS) p.5 IV. Instrument Parameters p.5 Step 1 Check System Vacuum p.5 Step 2 Verifying Operate/Standby status p.6 Step 3 Open Isolation Valve p.6 Step 4 Source Solvent trip (Filament On) p.7 Step 5 GC Oven Bakeout p.7 Step 6 Nominal Mass Settings (TDC page) p.7 V. MassLynx Data Acquisition p.8 Setting Up the Sample List p.8 Editing the GC Parameters p.8 Editing the Mass Spec Parameters p.12 Acquiring Data p.15 VI. Data Processing p.16 Chromatogram, Spectrum, and Library overview p.16 Averaging Scans and Subtracting Background p.18 Mass Chromatograms p.20 Integration Reports and Quantitation p.22 Theoretical Isotope Abundance Report p.23
Elemental Composition Report p.24
VII. Finishing p.24 Protecting Your Sample Lists and Methods p.24 GCT Page Settings p.24 Record Keeping p.24 Appendix A. Chromatogram Button Bar Actions p.25 Appendix B Spectrum Button Bar Actions p.26

3
I. Prerequisites for Training – Nominal Mass GCMS A. Completion of a graduate level course with significant mass spectrometry content. B. A good understanding of gas chromatography acquired through experience or course work. C. Proficiency using another GCMS system, for example the Magnum GCMS. II. Overview of the GCT Instrument and Software. The GCT is an accurate mass time-of-flight (TOF) mass spectrometer coupled to an Agilent 6890 gas chromatograph equipped with an autosampler. Both electron ionization (EI) and chemical ionization (CI) sources are available. EI is the normal operating mode. The mass spectrometer always acquires data with accurate mass precision, but only acquires with accurate mass accuracy under certain instrumental conditions. By convention, you should have the software label mass peaks to one decimal place of precision for nominal mass GCMS. The software is called MassLynx, and includes all of the programs required for acquiring data and for processing data, including two large mass spectral libraries used for search-match comparisons. In addition to the library search program, the software also allows theoretical vs actual isotope distribution comparisons. Complete quantitation software is also included. III. Software Organization Achieving the proper software operational state is complicated. Therefore the MassLynx software package must already be running when you decide to use the GCT. This means that we cannot monitor use through individualized login accounts. You must manually record your use on the yellow sample submission forms, even though you are running your samples yourself. Properly operating MassLynx software will show at least two programs running, although one or more may appear to be minimized on your desktop. The critical programs are MassLynx and GCT. The GCT program is used for direct control of the mass spectrometer including instrument tuning, calibration and GC (manual injection) data acquisition. Most of the functions of the GCT page should not be used by the student. Great care needs to be exercised or you could cause serious damage to the instrument. The MassLynx program is used to acquire data using the GC autosampler (the preferred method) and for all aspects of data processing. The software is structured to allow multiple users working on different projects to maintain completely separate instrument control, acquisition, and processing parameter sets. While some aspects of this versatile structure are useful, some aspects can lead to confusion and increase the potential for instrument malfunction or damage. Therefore you must carefully follow the

4
structured approach discussed below. Be aware that in a multi-user environment you will often find that the instrument is not configured as you require, and your first step must always be to load in the parameter sets and configuration files assigned to you. Unfortunately, there is no protection against modifying parameter sets belonging to someone else. While this is just a nuisance on the Magnum GCMS, it can have serious consequences when using the GCT. Zero tolerance will be allowed for mistakes of this nature. Projects – This is the highest level. All users must use the project labeled USERS unless you receive special permission and staff assistance to create a new project. To load the project file, first check whether the correct project is already loaded.
At the upper left corner of the MassLynx window the active project is identified. In this example it is “USERS”.
If the USERS project is not active, load the project:
MassLynx -> File -> Open Project -> [yes] -> USERS.PRO
Sample Lists – Load your sample list. You may have as many sample lists as you like, but they must all be named with your username and an incremental number if you have more than one, for example: “johndoe01.SPL”. Since I only use one sample list and edit it continually, my sample list in the example above is just “sveysey.SPL”. To open a sample list: MassLynx -> File -> Open…-> [select sample list] -> Open
A Typical sample list

5
Notice that a “sample list” contains all of the information necessary for the GCT to automatically acquire data files for samples loaded in the GC autosampler. This includes file names, text describing the sample, pointers to the MS and Inlet (GC) parameter sets that should be used, sample locations in the autosampler, and the amount of each sample that should be injected.
Use the Samples pulldown menu to add or delete lines in the Sample List.
Method Files (GC and MS) – Different mass spec parameter sets and GC parameter sets can be selected for each sample in your sample list. The parameter sets must already exist. To assign a GC or MS parameter set, double-click in the appropriate field in the table.
Double-clicking a field in the “MS File” column allows you to select the appropriate mass spec parameter set for each sample in the sample list.

6
Double-clicking a field in the “Inlet File” column allows you to select the appropriate GC parameter set for each sample in the sample list.
IV. Instrument Parameters Initial Setup – GCT Software Window Fundamental instrument parameters are set from the GCT software window. Normally, for “nominal mass GCMS” measurements, you will not adjust ANY of these parameters. If you believe that an instrumental parameter needs adjustment, please ask Steve or Kamel to diagnose and solve the problem. However, there are a few actions you may have to take at the GCT view. 1) In the GCT software window you should verify that the system vacuum readings are normal. Typical vacuum readings will be: Backing: approximately 2 e-2 (+/- 1) Analyzer: approximately 7 e-7 (+/- 2) Source: approximately 9 e-6 (+/-2) If any of the readings differ from these values by more than the tolerances indicated above, then contact staff immediately. DO NOT CONTINUE. 2) The status light located in the lower right corner of the window next to the “standby” button must be green. If it is red, contact staff immediately. DO NOT CONTINUE. 3) On the Engineer’s tab (GCT software window), the Isolation Valve toggle should say “Close Isolation Valve”. This means that the valve is currently open; the CORRECT state. If the toggle says “Open Isolation Valve”, then click on the button to open the valve. NOTE: Students should leave the isolation valve open. Staff may close the valve if there is cause. 4) The visual display of the Source Trip Setting may initially be red, indicating that the filament is not turned on. Normally there will be no real-time peaks in the mass spectral display window if the

7
Source Trip Setting is red. The filament and other ion source electronics are activated from the Engineer’s Tab by dragging the “Source Solvent Trip” slider bar to the right.
The Source Solvent Trip should be set to about -4 for filament ON operation (3:00 o’clock), and about -7 for filament OFF operation (9:00 o’clock). The filament should always be turned OFF after use. Warning: DO NOT ADJUST ANY OF THE OTHER CONTROLS ON THE ENGINEER’S TAB. Warning: DO NOT ADJUST ANY CONTROLS ON THE EI+ TUNE TAB.
Typical EI+ Tune Tab display Typical Engineer’s Tab display

8
Typical values are shown for all of the tuning parameters controlled from the EI+ Tune Tab and the Engineer’s Tune Tab. The actual values you see may be slightly different. Only CIF staff are authorized to change the tuning parameters. 5) When the filament is turned on the ion source temperature will increase slightly. Allow the source and electronics a few minutes to stabilize. If you have not already done so, this is usually a good time to manually increase the GC oven temperature to about 300 degrees and bake out the column for a few minutes. At the Agilent 6890 Keypad: Oven -> Temp -> 300 -> Enter 6) This is also a good time to verify that a couple of critical settings on the GCT Options page are correct for “nominal mass” GCMS. If the previous user was acquiring “accurate mass” data, they may have forgotten to reset these settings for “nominal mass” acquisition. At the GCT page, use the “Options” pull-down and select “TDC Settings…”. Verify that the Lock Mass and Mass Window parameters are set to zero. Do not change any other values on this page!! Click the OK button to exit from “TDC Settings”.
You are now done with the GCT software window. Do NOT close it, but you may minimize it if you wish. V. MassLynx Data Acquisition Setting Up the Sample List NOTE: For sample data files, use the format: ii-mm-dd-nn, where “ii” are typically the initials of your first and last name. For example, sv-03-06-02 would be the second sample-related data file I acquired on March 6. Note that the year is not coded in the file name. At the end of each calendar year the files are archived by year in a different directory on this computer.

9
As discussed earlier, most data files will be acquired using the Sample List feature of the MassLynx program. Each sample is assigned a filename, descriptive text, a Mass Spec parameter set, an Inlet (GC) parameter set, a location in the autosampler, and an injection volume. Procedures for establishing and modifying the Sample List have already been discussed You have also been shown how to select an MS File (mass spec parameters) and an Inlet File (GC parameters). We will now discuss these parameter sets in more detail. Editing the GC parameters Parameters can be modified easily, sometimes unintentionally, by you or other users. You should always verify the content of the MS and Inlet File parameter sets you have selected before instigating the sample list data acquisition. Only use parameter sets you have created and named with your username. If modifications are necessary, change the GC parameters (Inlet File) first. On the left-hand side of the MassLynx page, click on Inlet Method.
Clicking on “Inlet Method” will bring up the Inlet Method Editor page

10
All GC methods have the extension “.h68”. Note in the example above that “GC4” is the method open for editing. You are allowed up to 5 GC methods, and they will be named GC_xy#, where xy represents the initials of your first and last name, and # is a number between 1 and 5. When the method editor opens, the Status page is displayed first. If the software is communicating correctly with the GC, both the Ready and OK lights should be green. At this point, don’t worry if they are not. Normally click first on the Inlet icon on the left of the Inlet Method page. During your training session I will help you establish appropriate values for most of the parameters, so that you will only need to edit a few that are related to the actual temperature program as you develop or change your GC method. Note: Use the Help pulldown at any time to clarify the various parameter settings. In many respects, the on-line help is actually much better than the information in the GCT or MassLynx printed manuals.
Column 1 You must correctly specify details of the column being used. The “injection pressure mode” should be set to “constant flow”. Other options are available, but discuss with staff before using. Column 1 Pneumatics: The initial flow for a 30 meter column with an internal diameter of 0.25 mm should be set to 1.0 mL / minute. Flow ramps are available, but discuss with staff before using.
Column 2: N/A Inlet Method Editor GC tabs are largely self-explanatory Column 2 Pneumatics: N/A Oven: The maximum oven temperature for a DB-5 column should be set at 320 degrees. In general, set the maximum temperature at least 10 degrees below the vendor-specified upper temperature limit of the column. The GC is equipped with cryocooling hardware, for very low temperature GC analyses, but discuss with staff before using.

11
Oven Temp Program: Set as appropriate. Be sure to select Run Time to show you the total run time after you have set all of the temperature ramps. You will need to know this value when adjusting the MS File parameters. Post-Run: Normally this should not be enabled. Discuss with staff before using.
Typical multi-ramp temperature program.
Front Injector: The Split/Splitless radio button must be selected. Chose “split” or “splitless” as appropriate. Note: Normally the split liner is in the GC injector. Either type of liner can be used for either type of injection, with some small performance loss. We also have dedicated SPME liners. Discuss with staff before using. Back Injector: N/A.
Typical injector settings for a split injection After setting the Inlet [GC] parameters, you may click on the Autosampler icon to verify autosampler settings if you wish. However, these will be set for you during your training session, and should never require changes. The parameter discussion below is for informational purposes only. Discuss with staff before changing parameters on this tab.

12
Normally the autosampler ready status light will be green. If not, there is a problem which must be corrected. Sample Number (position in the tray) must always be set to 1 on this tab. The actual sample position used is specified on the MassLynx sample list.
Autosampler Status and Connectivity Tab The injection volume may be set as a percentage of the syringe volume. Normally a 10uL syringe is mounted, so 10% represents a 1uL injection. The syringe can be rinsed with the solvents located in the A or B position of the autoinjector tower.
Autosampler Injection Parameters Tab
For a normal split/splitless, injection, the Slow Plunger setting should be “No”. Normally “Allow Sampling Offset” should be disabled; however it can be used to sample from a specific point in a multi-layer solution, or to perform headspace analysis.
Autosampler Syringe Parameters Tab “Sample pumps” is used to remove trapped air from the syringe needle and should be left as shown.

13
After setting all of the Inlet and Autosampler parameters, be sure to save your parameter set before exiting from Inlet Method Editor: Inlet Method -> File -> Save As -> [GC_xy#] Editing the MS parameters On the left-hand side of the MassLynx page, click on MS Tune to review or change the mass spec scanning parameters, select the proper calibration file, and to set the data acquisition period..
Clicking on “MS Tune” will bring up the Experiment Setup page
If the appropriate file is not displayed, use File -> Open to select the correct file, just as you did when you were using the Inlet Method editor program. Note that your MS File should be [username#], where # can be a number from 1 to 5. To make changes, double-click on the blue highlighted ms scan function. Note that an experiment can use different scan functions for different parts of the GC run, but this is normally not necessary. If you feel you need to create multiple scan function experiments, discuss with staff before using.

14
In this example, the mass range from 45-650 Daltons will be scanned in 0.5 seconds, giving two complete scans per second. Ionization Mode should be “EI”. It is possible to do “CI” with special training. Data should normally be acquired in “centroid” mode. Leave “Scans to Sum” at five.
Double-clicking on the blue highlighted function in Experiment Setup opens the MS Function Page Contrary to the picture shown, “Start Time” should be set to 0. An appropriate solvent delay time will be set elsewhere on the page. DO NOT ACQUIRE THE SOLVENT PEAK. “End Time” should match the length of the GC run, expressed in minutes. Finally, two additional settings need to be checked on the Experimental Setup “Options” pulldown menu.
The correct calibration file must be selected using the Options pulldown menu
Always choose the most recent calibration file. The files are date-coded mm-dd-yy.

15
NOTE: As with the Magnum, we have no way of automatically updating your parameter files when we recalibrate the instrument. You MUST follow the procedure described above each day you use the instrument, since we often recalibrate several times per week if we are doing accurate mass measurements.
The “Solvent Delay” should be set to 2.5 minutes. (The picture above is incorrect.) In some cases you might need to use a shorter solvent delay. Use the same decision making process you use when setting this parameter on the Magnum. Be sure to save your parameter set before exiting from MS File Method Editor: MS File Method -> File -> Save (to save the changes to your existing method) OR MS File Method -> File ->Save As -> [username#] (to create a new method) Acquiring Data Everything should now be correct in the sample list displayed on the MassLynx page. You think that are ready to proceed with data acquisition. However… Before starting the autosampler run you must make sure that all of your sample vials are properly loaded in the proper spaces in the autosampler tray, and that the appropriate solvent is in the Solvent A bottle!!! Be sure to save the changes to your sample list. If you forget, the software will prompt you before it actually tries to run the samples.

16
To begin the run, select Start from the MassLynx -> Run pulldown menu.
Only the “Acquire Sample Data” box should be checked. “Auto Processing” and “Auto Quantify” are more advanced features not normally selected. Discuss with staff before using. Select the numerical range of samples in your sample list that you want to run.
Use MassLynx -> Run -> Start to open the “start Sample List Run” window. The GC program selected for the first selected sample will now be downloaded to the GC. It may take a minute or two for the oven and/or injector temperatures to reach the proper values. You should then observe the autosampler arm pick up the appropriate vial from the autosampler tray, perform the requested rinses, and inject the sample.
Autosampler arm in action
The status bar along the bottom of the MassLynx page will show you the system action that is occurring. You may now view and process the data file as it is being acquired.

17
VI. Data Processing You will normally use two major data processing programs, Chromatogram and Spectrum, both accessed from the MassLynx program. As trained Magnum users, you are already familiar with the processing portions of MassLynx. As with the Magnum GCMS, the normal entry point for data processing is the Chromatogram program.
Data processing normally begins by opening the Chromatogram window.
Chromatogram, Spectrum, and Library overview Both Chromatogram and Spectrum provide access to other programs. Each program and subprogram view can be modified through the use of the pulldown menus and the button bar located along the top of the view. Many of the actions and settings controlled by the pull-downs and buttons are straight-forward and intuitive; others are not. Most of the actions and settings are easily reversible if you happen to choose an inappropriate setting; others can cause problems that are harder to recover from. You will need to spend some time investigating which features are important to you and which features are either useless or dangerous. The button functions are all described in the Appendix.
Typical Chromatogram view.
18
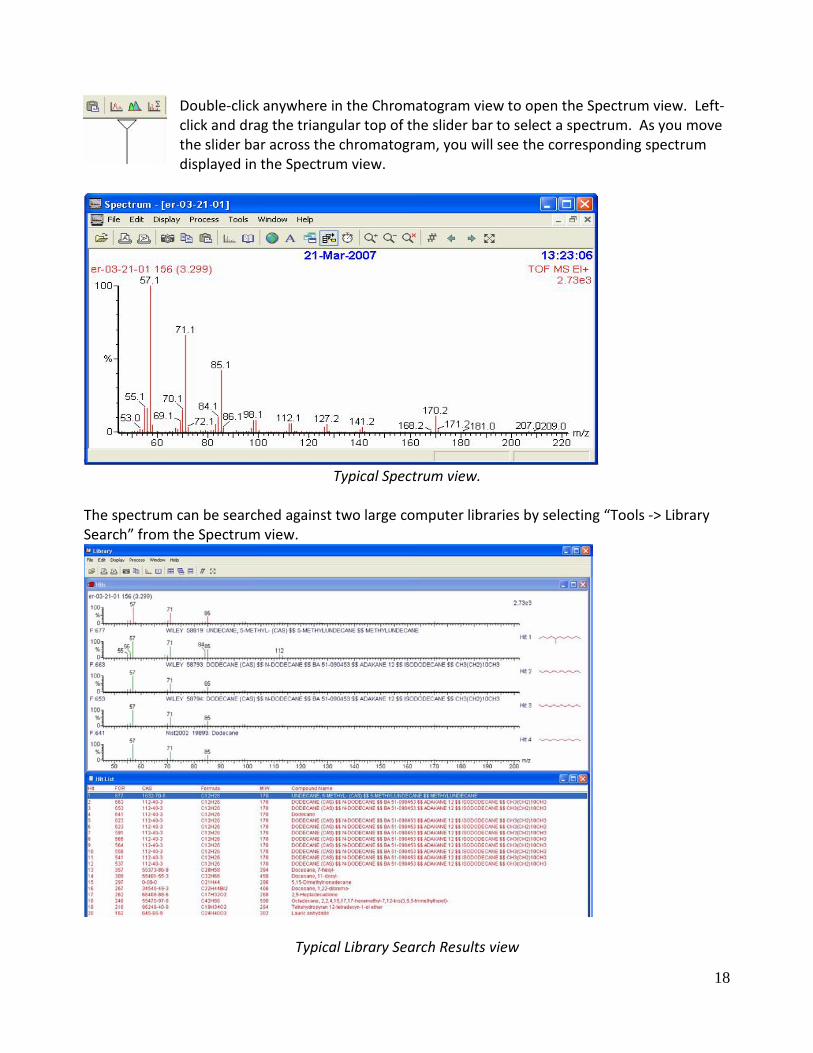
Double-click anywhere in the Chromatogram view to open the Spectrum view. Left-click and drag the triangular top of the slider bar to select a spectrum. As you move the slider bar across the chromatogram, you will see the corresponding spectrum displayed in the Spectrum view.
Typical Spectrum view.
The spectrum can be searched against two large computer libraries by selecting “Tools -> Library Search” from the Spectrum view.
Typical Library Search Results view

19
The MassLynx software contains many other features that may be helpful to you. Several of the most useful include:
-Averaging Scans and Subtracting Background -Mass Chromatograms -Integration Reports and Quantitation -Theoretical Isotopic Abundance Reports -Elemental Composition Reports (only useful for accurate mass data)
Averaging scans and subtracting background Averaging several scans and subtracting several background scans can improve the quality of your spectrum, and improve the performance of the Library search and Elemental Composition programs. However, you must be aware of the potential problems and the actual limitations of spectrum averaging. Before averaging scans you must answer two questions. First: Is the GC peak “pure”? Am I averaging scans from the same component, or are some of the scans coming from a co-eluting GC peak? Proper use of the Single Ion Chromatogram program will help you answer that question. Second: Is the signal level of the individual scans appropriate for averaging? If quantitation is important, then be sure that none of the scans are saturating the detector. There are two ways to average scans. The first method requires that you simply right click and drag the mouse over the scans you wish to average. The second method involves use of the Combine Spectra icon. This program also allows you subtract a representative background.
Click on the Combine Spectra button. The following dialog box will open:
Click in the “Average” field. Right-click and drag the mouse over the scans in the chromatogram you wish to co-add. Then click in the “Subtract” field. Right-click and drag over an equal number (or slightly larger number) of scans in the baseline that you would like to subtract. Notice that you can specify a degree of “over-subtraction” to be sure that all of the background ions are removed. A value of 1.05 is typical.
20
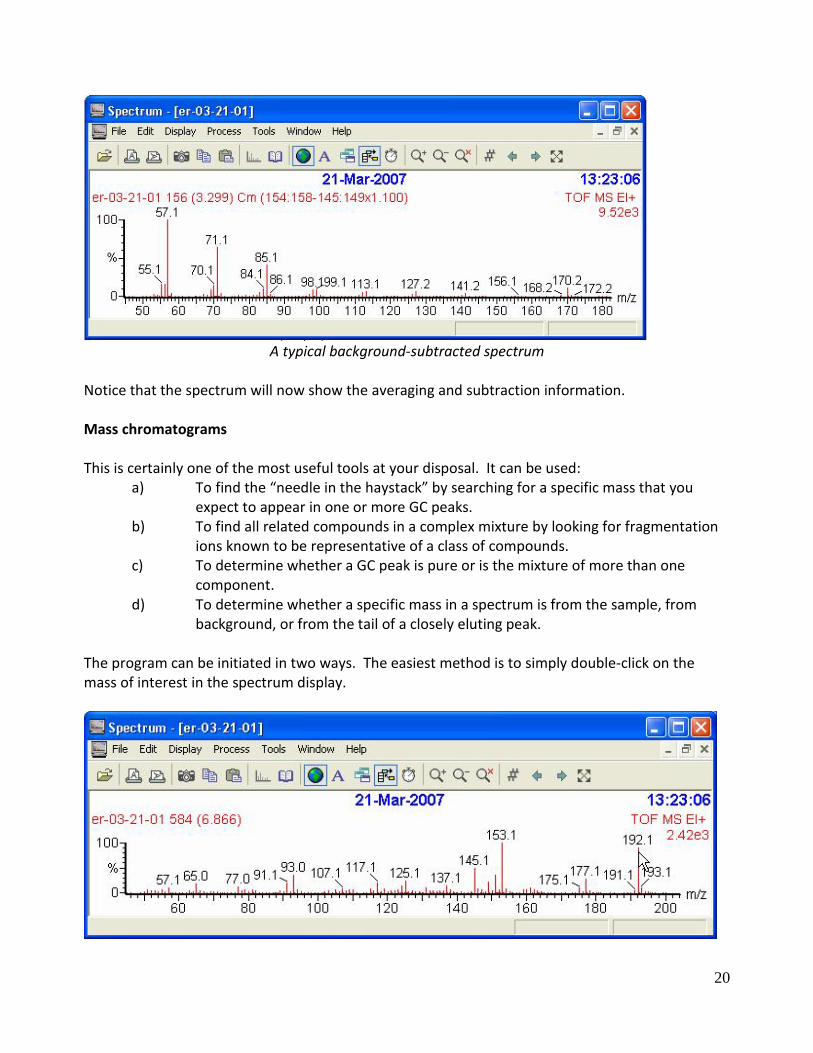
A typical background-subtracted spectrum
Notice that the spectrum will now show the averaging and subtraction information. Mass chromatograms This is certainly one of the most useful tools at your disposal. It can be used:
a) To find the “needle in the haystack” by searching for a specific mass that you expect to appear in one or more GC peaks.
b) To find all related compounds in a complex mixture by looking for fragmentation ions known to be representative of a class of compounds.
c) To determine whether a GC peak is pure or is the mixture of more than one component.
d) To determine whether a specific mass in a spectrum is from the sample, from background, or from the tail of a closely eluting peak.
The program can be initiated in two ways. The easiest method is to simply double-click on the mass of interest in the spectrum display.

21
Depending upon the toggle state of the Add/Replace button , This will open a new window or replace the contents of the existing window to show the mass chromatogram of the mass selected. The second way to specify a mass chromatogram is from the Display pull-down menu. Simply type in the mass of the ion you would like displayed.
Typical mass chromatogram display
Notice in this example that the tolerance for the single ion display is a window of 0.05 Daltons (+/- 0.025 Daltons). This is a very narrow mass window by most mass spec standards, but perfectly fine to use with the GCT because of the inherent precision of the instrument. The tolerance is set in a rather obscure place in the MassLynx program. To change the tolerance, you must first change the MassLynx view from “Status” to “Shortcut”. Then select the “Options” button. Then enter a different tolerance for the mass chromatogram.

22
-> -> Process for changing the mass chromatogram tolerance
If you are trying to find a particular GC peak in a complex mixture, you would normally calculate the molecular weight of the component (perhaps by using the MassLynx Isotope Ratio program) and then enter that value in the Mass Chromatogram dialog box. If the instrument has just been calibrated, or you are acquiring in accurate mass accuracy mode, you can easily set the tolerance window as tight as 0.01Da. However, if you are acquiring in nominal mass accuracy mode (the normal situation), then set the tolerance window to 0.5 Da until you find the peak. On the other hand, if you want to display a mass chromatogram by double-clicking on an ion currently displayed in the spectrum view, the tolerance window can easily be set as tight as 0.01Da. This will be discussed further in the Elemental Composition section. Integration reports and Quantitation MassLynx includes a complete quantitation package. Quantitation is an advanced topic and will not be discussed here. However, a simple integration report can be easily generated just by using
the Chromatogram Peak Integration button . The integration report is printed over the chromatogram. Depending upon display settings, the chromatogram peaks are also annotated with retention times and areas.
Typical chromatogram display after performing peak integration

23
The integration report can also be sent to the clipboard by using the Detected Peaks button . The report can then be pasted into Excel or Word. When using the Peak Integration button, be aware that the integration is performed using parameters probably set by a previous user. Users have full control over the peak detection and integration algorithm through the Chromatogram -> Process -> Integrate pull-down menu. Probably too much control!
A reasonable approach is to start with Apex Track Peak Integration enabled, and Smoothing disabled. This allows the software to make most of the hard decisions for you. However, you should still make sure that reasonable values are set in Peak Detect… and in Threshold…
Normally choose Apex Track Peak Integration
Typical settings for Apex Track peak detection and integration
Occasionally you might find it necessary to disable Apex Tracking and use the more advanced features of integration in order to get the results you need. Theoretical Isotopic Abundance Reports Occasionally it is helpful to compare the measured isotopic distribution to the theoretical distribution. This is especially helpful if you suspect your compound contains hetero-atoms like silicon, sulfur, bromine or chlorine. Access: MassLynx -> Spectrum -> Tools -> Isotope Model

24
Note: This program also calculates the accurate masses in addition to the theoretical isotope distributions. This can be used as input to the Mass Chromatogram program. Use Display -> List Spectrum to show a list of the masses and intensities. Elemental Composition Program The Elemental Composition program will be of no value to you unless you have acquired your GCMS data under “accurate mass accuracy” conditions and will not be discussed further in this document. There is a separate training manual for acquiring accurate mass data. VII. Finishing Protecting Your Sample List and Methods. The best way to ensure that other users do not accidentally edit your sample list or your MS File or Inlet File methods is to leave the active pages are the “default” pages. For the Sample List: Open Sample List > [Default.spl] For the Inlet File method: Inlet Method > Open Method > [GC1.h68] For the MS File method: MS Method > Open > [ms1.exp] Settings on the GCT page, Engineer’s Tab Isolation Valve state: Close isolation valve after use, EXCEPT before 5:00PM M-F. Solvent Trip slide bar state: Slide to nine o’clock position, EXCEPT before 5:00PM M-F. Record Keeping You must sign in the logbook each time you use the GCT. You must place a copy of the GC trace in the Binder for each sample you run.

25
Appendix A Button Bar Actions Available in the Chromatogram View
* Select a data file. Opens the data file browser program.
Print chromatogram display in portrait mode. [Opens the Windows printer dialog program.]
* Print chromatogram in landscape mode. [Opens the Windows printer dialog program.]
Copy a picture of the chromatogram to the Windows clipboard. [Import into Word.]
Copy the data points forming the chromatogram to the clipboard. [Import into Excel.]
* Copy list of detected peaks, and peak areas, to the clipboard. [Import into Excel.]
Paste clipboard contents onto the display.
Select mass chromatograms to display. [Normally done from Spectrum view.]
* Perform peak integration. Uses integration parameters selected from the “Process” pulldown.
* Combine spectra. Allows scan averaging and background subtraction.
Toggle processing of all traces in the current window “on/off”.
* Allow text to be entered on the chromatogram display. [Used to annotate the display.]
Toggle opening of new window for process results “on/off”.
* Toggle add OR replace new chromatogram.
* Toggle real-time chromatogram update. [Used to view the data as it is being acquired.]
* Increase magnification of current range. [Expand the display in the Y-axis.]
* Decrease magnification of current range. [Contract the display in the Y-axis.]
Delete current magnification range. [Autoscale the X and Y axes.]
* Reset the display to the TIC trace. [Reset to show just the chromatogram.]
Decrement the scan in the Spectrum display. [Show the previous scan in the data file.]
Increment the scan in the Spectrum display. [Show the next scan in the data file.]
* Reset the display range back one zoom level (first click); reset to full display (second click). * Indicates commonly used buttons.

26
Appendix B
Button Bar Actions Available in the Spectrum View
Select a data file. Opens the data file browser program.
Print spectrum display in portrait mode. [Opens the Windows printer dialog program.]
* Print spectrum in landscape mode. [Opens the Windows printer dialog program.]
Copy a picture of the spectrum to the Windows clipboard. [Import into Word.]
Copy the data points forming the spectrum to the clipboard. [Import into Excel.]
Paste clipboard contents onto the display.
Unknown.
* Perform library search for current spectrum.
Toggle processing of all traces in the current window “on/off”.
* Allow text to be entered on the spectrum display. [Used to annotate the display.]
Toggle opening of new window for process results “on/off”.
* Toggle add OR replace new spectrum.
Toggle real-time spectrum update. [Used to view the data as it is being acquired.]
Increase magnification of current range. [Expand the display in the Y-axis.]
Decrease magnification of current range. [Contract the display in the Y-axis.]
Delete current magnification range. [Autoscale the X and Y axes.]
Select scan number.
Decrement the scan in the Spectrum display. [Show the previous scan in the data file.]
Increment the scan in the Spectrum display. [Show the next scan in the data file.]
* Reset the display range back one zoom level (first click); reset to full display (second click). * Indicates commonly used buttons.