watershed and water supply vulnerability, risk …
TRANSCRIPT
Project 20191784,001A June 28, 2019 © 2019 Kleinfelder www.kleinfelder.com
WATERSHED AND WATER SUPPLY VULNERABILITY, RISK ASSESSMENT AND MANAGMENET STRATEGY GLOUCESTER, MASSACHUSETTS KLEINFELDER PROJECT #20191784.001A
JUNE 28, 2019
Copyright 2019 Kleinfelder
All Rights Reserved

Project 20191784,001A June 28, 2019 © 2019 Kleinfelder www.kleinfelder.com
ONLY THE CLIENT OR ITS DESIGNATED REPRESENTATIVES MAY USE THIS DOCUMENT
AND ONLY FOR THE SPECIFIC PROJECT FOR WHICH THIS REPORT WAS PREPARED.
iii
A Report Prepared for:
Mr. Gregg Cademartori
Planning Director
City of Gloucester
City Hall Annex
3 Pond Road
Gloucester, MA 01930
WATERSHED AND WATER SUPPLY VULNERABILITY, RISK ANALYSIS AND MANAGEMENT STRATEGY Prepared by: Betsy Frederick Principal Planner/Project Manager Reviewed by: Kirk Westphal, P.E. Senior Principal Professional KLEINFELDER One Beacon Street Boston, MA 02108 Phone: 617.497.7800 June 28, 2019 Kleinfelder Project No. 20191784.001A

iv
TABLE OF CONTENTS
____________________________________________________________________________
Section Page
1 EXECUTIVE SUMMARY ................................................................................................. 1
2 PROJECT DESCRIPTION .............................................................................................. 7
2.1 Existing Water Supply .......................................................................................... 8
3 CURRENT CONDITIONS AND RISKS ......................................................................... 15
4 CHARACTERIZING POTENTIAL FUTURE CLIMATE CONDITIONS .......................... 20
5 POTENTIAL IMPACTS OF FUTURE CLIMATE ON WATER SUPPLY ........................ 23
6 MANAGEMENT ALTERNATIVES ................................................................................ 30
7 RELEVANCE OF FIRE RISK TO WATER SUPPLY ..................................................... 35
7.1 Watershed Management Goals .......................................................................... 35
7.2 Management Alternatives .................................................................................. 36
7.2.1 Forest and Wildlife Management ............................................................ 36
7.3 Alternatives For Watershed management .......................................................... 37
7.3.1 Stand Tending and Thinning................................................................... 37
7.3.2 Controlled Burns ..................................................................................... 37
7.3.3 Riparian Zone Management ................................................................... 37
7.3.4 Sanitation Cut ......................................................................................... 38
7.3.5 Chemical and Biological Control ............................................................. 38
8 CONCLUSIONS ............................................................................................................ 39
TABLES
Table 1: Watershed Priority Rank Based on Historic Wildfire Incidents .....................................17
Table 2: Modeled Scenario Names and Descriptions ................................................................30
FIGURES
Figure 1 – Watershed Delineations ...........................................................................................11

v
Figure 2 – East Water Supply Systems .....................................................................................13
Figure 3 – West Water Supply Systems ....................................................................................13
Figure 4 – Land Use within Gloucester Sub-Watersheds ..........................................................14
Figure 5 – Historic Performance ................................................................................................15
Figure 6 – Fire and Landslide Model Analyses ..........................................................................16
Figure 7 – Relative Fire Risk Map .............................................................................................17
Figure 8 – Parker River Streamflow Comparison Between Historical and Regression Model Data
.................................................................................................................................................21
Figure 9 – East and West System reservoir Correlation ............................................................21
Figure 10 – Project Streamflow Scenarios (Generalized) ..........................................................22
Figure 11 – Historical Droughts and Future Climate Projections ...............................................24
Figure 12 – Projected Future Water Volumes ...........................................................................26
Figure 13 – Projected Volume under Low and High Precipitation Scenarios .............................28
Figure 14 – Projected Spill Volume under High Precipitation Scenario ......................................28
Figure 15 – Total Supply Available with Operational Changes Implemented .............................33
Figure 16 – Diagram of Land Management Alternatives to Reduce Risk of Fire and Landslide .36
ATTACHMENTS ATTACHMENT A STAKEHOLDER OBJECTIVES
ATTACHMENT B WATER SUPPLY TECHNICAL MEMORANDUM
ATTACHMENT C FIRE-WATERSHED INTERACTION TECHNICAL MEMORANDUM


1
WATERSHED AND WATER SUPPLY
VULNERABILITY, RISK ASSESSMENT
AND MANAGEMENT STRATEGY
GLOUCESTER, MA
1 EXECUTIVE SUMMARY
Overview
As a coastal community, the City of Gloucester has already experienced the impacts of changing
climate trends. Increased storm surge and sea level rise resulting in more frequent inundation
were the subject of prior recent evaluations. There are other climate trend considerations,
however. As part of a continuing effort to understand, mitigate and adapt to multi-hazard climate
risks, the City committed to identify potential climate change-related risks to its water supply and
watersheds and address them where practicable.
This study was funded through the Commonwealth of Massachusetts Municipal Vulnerability
Preparedness (MVP) Action Grant Program. The study purpose is to develop a climate change
risk assessment and management strategy for the City’s water supply and reservoir system,
including its watersheds. The project assessed the potential impacts of long-term climate change
on the system including from drought, increased temperature, extreme precipitation, wildfire and
combinations of these hazards. It evaluated the effectiveness of different management,
operational, and infrastructure strategies to mitigate the identified risks to water supply reliability.
Findings provided the basis for recommendations that will contribute to the ongoing resiliency of
the system.
Stakeholder Process
City Stakeholders were represented by a core Working Group that included City of Gloucester
professional staff representing the Department of Public Works, Planning and Community
Development, Conservation, and the Fire Department. Also involved were citizens representing
2
recreational and land use interests. At an initial meeting of the Working Group, 14 project
objectives were articulated within five (5) major subject areas (see Attachment A):
• Operations/Environmental
• Public Engagement
• Health and Safety
• Land Use
• Affordability/Cost
The project team kept these objectives in mind over the course of the evaluation. A public meeting
was held on December 12, 2018 to confirm these objectives generally and seek additional input
from the community as an element of the Public Engagement initiative.
Fundamental Questions
While other climate-related studies for the City of Gloucester have focused on coastal flooding
and other potential impacts of climate change, this study focused on addressing the following four
questions:
1. Based on historic climate conditions, what are the current risks in Gloucester related to
water supply and wildfire?
2. What range of future climate conditions can we expect in Gloucester?
3. How could potential future climate conditions affect the risks to water supply?
4. What management alternatives can be applied or considered to reduce the risks of future
climate conditions adversely affecting water supply or wildfire potential?
Significant Findings
The most significant finding of this study can be summarized in three sentences: Future climate
trends are not likely to reduce the currently high levels of water supply reliability, but operational
changes may be needed to ensure that the water is in the right place at the right time. These
operational changes should also consider that future wildfires compounded by intense
precipitation events and warmer temperatures may increase erosion into the reservoirs, along
with the associated organic material and turbidity. These findings both point to a primary
3
recommendation to focus on water treatment capacity and East/West system connectedness as
a primary means of providing long-term resilience of Gloucester’s water supply.
More specifically, the findings are:
1) The water supply in Gloucester is adequate and resilient under current climate conditions.
The six active and one emergency reservoir provide the City with redundancy and
operational flexibility; when one reservoir cannot be used, enough water exists in the other
reservoirs to meet the City’s current drinking water demand. The model estimates enough
water in both the West and the East Systems, without having to rely on the water in the
emergency Fernwood Reservoir, which is limited in quantity and exhibits poor water
quality.
2) The water supply in Gloucester is vulnerable to future droughts and may not be able to
refill each year as reliably as it does today if climate trends tend toward the more extreme
conditions of warmer temperatures and less rain in the summer. Most reservoir recharge
occurs from September to May.
3) Although it provides greater storage volume overall, the West System is less resilient than
the East System. Under current operating protocols, withdrawals from the West System
are in the summer months when droughts are prevalent and the reservoirs in the West
Systems have small watershed areas and therefore limited recharge potential. In
combination, these conditions contribute to longer recovery periods, and less likelihood of
achieving full reservoir capacity over the climate change-modeled planning horizon.
4) The operating regimen/sub-system balancing has developed over time to reflect
functionality and configuration of the existing infrastructure, and water quality and quantity
within the respective reservoirs and sub-systems. Currently there is no raw water
connection between the East and West systems. Finished water is exchanged via 2 x 20”
fused PVC pipes under the tidally influenced Annisquam River between the West
Gloucester Water Pollution Control Facility and Gloucester High School in East
Gloucester.
5) Although not possible with the current infrastructure configuration, the future risks can be
mitigated by reconsidering how and when each of the two systems are relied upon in the
future, and by keeping them more balanced throughout the year so that they draw down

4
and recover concurrently. Such an approach would require a means to convey and
transfer raw water between sub-systems, and not exclusively within each respective sub-
subsystem.
6) Analysis shows that the system should have sufficient water, but that it may not be in the
right place at the right time. Rebalancing the reservoirs could alleviate this vulnerability
but will require additional alternatives analysis to include existing infrastructure assets,
necessary new capital investments, and operating constraints.
7) Findings based on “highest precipitation” scenarios (and in contrast to the drought or less
frequent precipitation scenarios that were the primary focus of the analysis) suggest that
under this condition reservoirs throughout the system will refill each year, but not
necessarily remaining at or near their full thresholds continually. However, estimated total
spillage from current conditions is projected to roughly double. These results are
volumetric on a monthly average basis, and do not include estimates for peak
instantaneous spill rates. That said, the estimated maximum monthly volume of spillage
from the system from this scenario is approximately 700 MG/month, which does not
appear to be too far beyond the range of the maximum estimated volume from recent
years. It just should be expected more regularly.
8) Much of the area of the City at greatest risk of wildfire was determined to be outside of the
reservoir watershed areas. Wildfire is still a major risk to water supply, however, as loss
of vegetative cover can lead to elevated turbidity. Both the consequences and likelihood
of a wildfire event can be mitigated through a program of prioritized tasks related to
vegetation/forestry management.
9) Within the watersheds, erosion risk was determined to be greatest at steeper slopes
typically proximate to the reservoirs. As a result, water quality impacts from erosion and
debris mobilization contribute to findings with respect to the value of water treatment
capability as a means of maintaining supply resiliency.
10) The City has management/operational alternatives that can provide greater resiliency than
currently provided. This study evaluated options based on prevalent water supply
management alternatives used in the industry, with some additional options based on
stakeholder input.

5
11) This study has applicability to other small municipalities in the region, especially in
Massachusetts. The methodology used to estimate hydrology in this study (calculating
inflows into reservoirs using a regression relationship between precipitation and
temperature) can be replicated for other communities where streamflow data is not
available from USGS or other monitoring sources. The availability of statewide
precipitation and temperature climate projections facilitates studying the reliability and
risks of smaller water supply systems in the region and in Massachusetts.
Recommendations
This analysis addressed volume of drinking water within the Gloucester system without respect
to consideration of current treatment capacity and/or future treatment requirements posed by
modified operations. As presented in the report, several strategies can be employed to mitigate
impacts of climate change upon the City’s water supply and watersheds. Based on those findings,
we recommend the following:
Near Term Actions:
1. Update the existing Drought Management Plan to reflect understanding of current and
near-term future conditions; continue implementation of demand management strategies
to support overall system resilience.
2. Implement recommendations from previous Babson Source Water Management System
Report (2014) with respect to flow routing/reservoir partitioning, aeration and mixing to
improve raw water quality for Babson Reservoir.
3. Initiate monitoring program to baseline raw water quality and reservoir bathymetry.
4. Conduct further evaluation and conceptual design of system to capture the spill from
Fernwood or diverting flow from Fernwood directly to Wallace Reservoir to improve the
system’s overall resiliency.
5. Develop and implement written protocols for pre-storm event reservoir drawdown to
mitigate impacts from spill events.

6
Longer Term Actions:
6. Initiate pilot testing for treatment technologies under various source surface water
blending scenarios with intent to operate under a non-seasonally influenced withdrawal
regimen by balancing drawdown between the East and West Systems.
7. Evaluate potential raw water transfer options between the East and West Systems.
8. Evaluate (and or compile existing evaluations) of hydraulic capacity of all spillways and
controlled outlet pathways to determine if they are operating near their current capacity
and if there are opportunities to improve flow capacities through maintenance and repair.
9. Based on results of hydraulic analysis, re-visit written protocols and operating rules for
pre-storm event drawdown to mitigate impacts from spill events.
Watershed Management (all Near Term Actions):
1. Employ forest and wildlife management strategies to mitigate the potential for wildfire and
negative impacts to water quality. Strategies should be prioritized in the near-term based
on historic frequency of wildfire and criticality of the water supply reservoir in meeting
demand under current operations. In the future, strategies should target specific areas
and should be prioritized based on risk following the development of a robust framework.
(Note that the DPW is currently researching grant opportunities to fund forest and wildlife
management efforts.)
2. Although it was not specifically studied in the context of incidence frequency or extent of
impact, improved access for emergency response and firefighting activity within the
watershed areas can also support mitigation through reduced burn acreage.
3. Pursue regional opportunities with neighboring communities to leverage watershed
management across municipal boundaries.
4. Conduct a watershed-specific inventory of forest health to provide a baseline of current
conditions and identify site-specific recommendations

7
2 PROJECT DESCRIPTION
The City of Gloucester (the City) water supply system is critical for the community’s resilience and
quality of life. The water supply system is composed of reservoirs, transfer pumping stations,
dams, intake structures, water treatment facilities and distribution system. The City is located on
the Cape Ann peninsula and has water supply with little opportunity for localized surface or
groundwater expansion. Its sources depend upon surface drainage from small watersheds to the
existing reservoirs. The City does not own or operate any groundwater facilities.
The Municipal Vulnerability Preparedness Program (MVP) is a Commonwealth of Massachusetts
initiative to provide cities and towns with the tools to create a more resilient community. Through
the initial MVP planning process, the City identified their water supply as a vulnerable asset that
warranted further study. This report summarizes that subsequent study to assess the risks posed
by climate change to the City water supply, and the land that supports it, and identify management
alternatives.
This study was funded through a Commonwealth of Massachusetts MVP Action Grant. The
purpose is to develop a climate change risk assessment and management strategy for the City’s
water supply and reservoir system, including its watersheds. The project assessed the potential
impacts of long-term climate change on the system including from drought, increased
temperature, extreme precipitation, wildfire and combinations of these hazards. It also evaluated
the effectiveness of different management, operational, and infrastructure strategies to mitigate
the identified risks to water supply reliability.
The City sought to answer the following fundamental questions:
1) Based on historic climate conditions, what are the current risks in Gloucester related to
water supply and wildfire?
2) What range of future climate conditions can we expect in Gloucester?
3) How could potential future climate conditions affect the risks to water supply?
4) What management alternatives can be applied or considered to reduce the risks of future
climate conditions adversely affecting water supply or wildfire potential?
8
To answer these questions, this study used a combination of historic data, Geographic
Information Systems (GIS) databases, and simulation models.
2.1 EXISTING WATER SUPPLY
The City supplies its residents and businesses with drinking water from six (6) active reservoirs
and three (3) water treatment plants, shown in Figure 1. These are all located within the City’s
limits, although part of the Babson watershed is located within the Town of Rockport on land
owned by Gloucester. The water supply system in Gloucester is divided into two systems (East
and West) separated geographically by the tidally influenced Annisquam River, which outlets to
the north into Ipswich and to the south into Gloucester Harbor. These two systems are:
A. The East System, shown in Figure 2, located east of the River and includes:
o Three active reservoirs – Babson, Goose Cove, and Klondike.
o Two water treatment plants (WTP) – the Babson WTP and Klondike WTP.
o The Babson WTP can take water directly from Babson Reservoir by gravity at
lower flows, and with the Babson low lift pump station assistance at higher flows;
water is piped via gravity or with low lift pump station assistance from Goose Cove
Reservoir. It can also blend both waters and the Babson low lift pump station can
pump water to Goose Cove.
o The Babson low lift pump station can pump from the Babson Reservoir to the
Goose Cove Reservoir with one or two pumps, and also supply the Babson WTP
with one pump and pump to Goose Cover with the other.
o The DPW operates the Babson Reservoir as a detention basin to minimize flooding
potential in Alewife Brook below the Dam spillway; to keep the reservoir level
several feet below the spillway in wet months they release water to the Babson
intake house to the spilling basin.
o The East reservoirs have a larger collection area and more natural organic matter
than the West. The Babson WTP chemical usage to produce compliant water is
four times that of the West Gloucester WTP.
o The East system storage volume when full is 474 million gallons (MG).
B. The West System, shown in Figure 3, located west of the river and includes:
o Three active reservoirs – Dykes, Wallace, and Haskell.
o One inactive emergency reservoir – Fernwood.

9
o One water treatment plant – West Gloucester WTP.
o The West Gloucester WTP can receive water directly from Dykes and Wallace
Reservoirs intake houses. Water from Haskell Reservoir must be first pumped
from Haskell to Dykes Reservoir for treatment at the West Gloucester WTP.
Wallace Reservoir water can also be pumped to Dykes Reservoir with the Wallace
pump station, and subsequently treated at the West Gloucester WTP.
o The West storage volume when full is 1,091 million gallons (MG).
The typical reservoir and WTP operational scheme is as follows:
1. The City uses approximately 1,300 MG of raw water annually to meet the City’s finished
potable water demand, with a maximum day 5 MG.
2. The East system with Babson WTP operates annually from December through
May. Compliant water can be made year-round at the Babson WTP with sufficient supply
including warmer higher demand summer months, as needed.
3. The West system with West Gloucester WTP operates from June through November each
year. When the DPW starts operation in June with West system reservoirs full, they contain 84%
of the City’s annual demand. With much lower organics, iron, and manganese levels, the second
distribution system disinfectant generally produces less potentially harmful disinfection by-
products, which aids compliance in summer months.
4. East and West: In an emergency, and with sufficient staffing, both plants can be operated
at the same time if needed to supply a neighboring community, annually each summer or in an
emergency.
5. Klondike WTP: Permitted with MassDEP as a satellite WTP, Klondike can operate with
limited staffing each day and be monitored remotely at the operational WTP. By contract, Veolia
is to operate the Klondike WTP each July and August. Currently the DPW is not operating the
Klondike WTP until the pond surrounding Bayview Auto Salvage is hydraulically separated from
the Klondike Reservoir.
6. There is no raw water connection between the East and West Systems; finished water can
be transferred via the circa-2013 installed 2 x 20” fused PVC pipe horizontally directional drilled
under the Annisquam River between the Water Pollution Control Facility (West Gloucester and
the Gloucester High School (Island side East Gloucester).


13
Figure 2 – East Water Supply Systems
Figure 3 – West Water Supply Systems
14
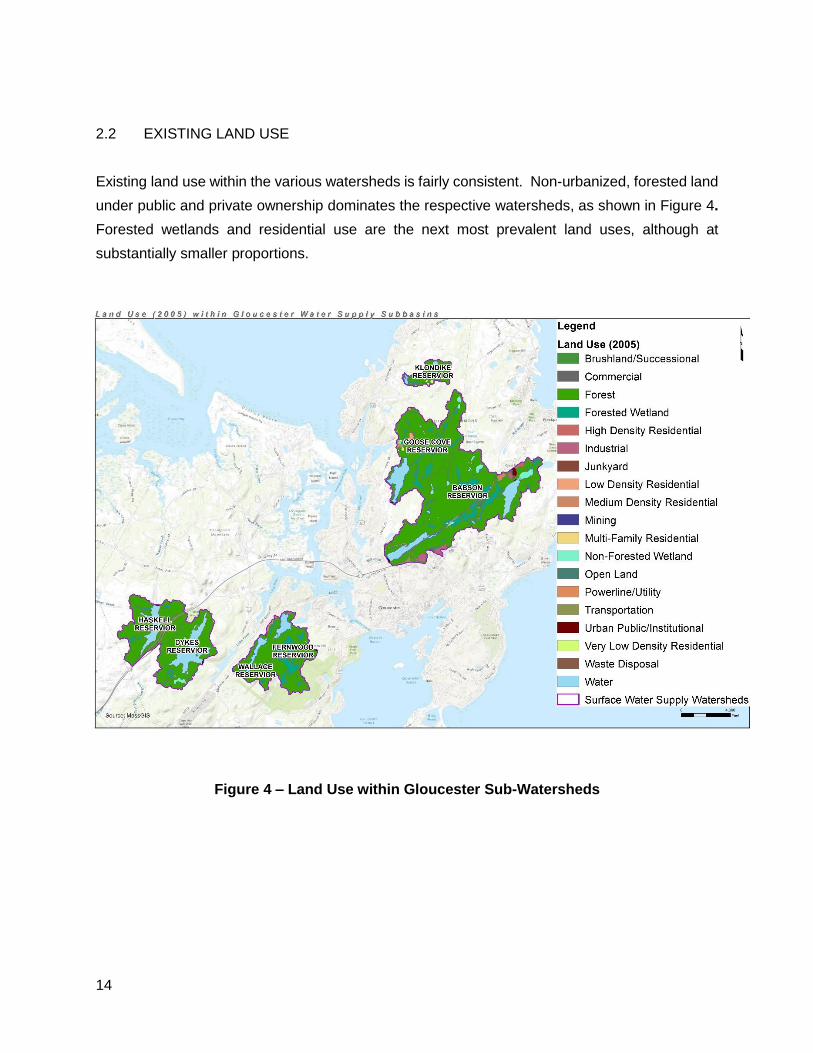
2.2 EXISTING LAND USE
Existing land use within the various watersheds is fairly consistent. Non-urbanized, forested land
under public and private ownership dominates the respective watersheds, as shown in Figure 4.
Forested wetlands and residential use are the next most prevalent land uses, although at
substantially smaller proportions.
Figure 4 – Land Use within Gloucester Sub-Watersheds

15
3 CURRENT CONDITIONS AND RISKS
3.1 Current Water Supply Risks
Based on the City’s data, both the East and West systems are demonstrated to provide adequate
supply under current conditions. As shown in Figure 5, both reservoir systems refill within
acceptable recovery periods even after drought (such as experienced in 2016). Population
forecasts for Gloucester also indicate a likely downward trend. There are no clearly identifiable
reasons to assume supply will not be adequate in the near term.
Figure 5 – Historic Performance
3.2 Current Wildfire Risks
To better understand how future risk of wildfire could impact the City’s water supply, we first
sought to understand current wildfire risk. Fire events can lead to increased runoff and erosion
into drinking water supplies from loss of vegetation and groundcover (Becker, Hohner, Rosario-
Ortiz, & DeWolfe, 2018). In this analysis, debris flows, severe soil erosion, and other similar events
are referred to as landslides. Through a GIS-based analysis, Kleinfelder estimated wildfire and
erosion potential vulnerabilities across each of the City’s water supply watersheds as well as City-
wide based on existing conditions and historical data.
16
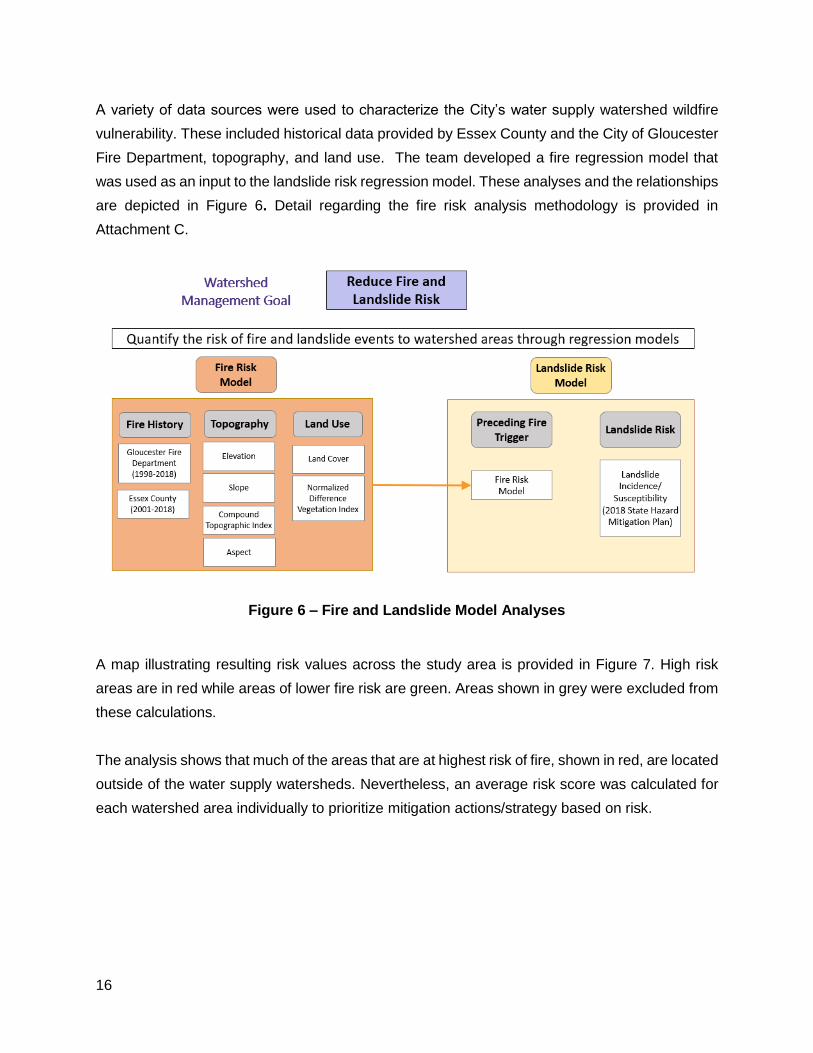
A variety of data sources were used to characterize the City’s water supply watershed wildfire
vulnerability. These included historical data provided by Essex County and the City of Gloucester
Fire Department, topography, and land use. The team developed a fire regression model that
was used as an input to the landslide risk regression model. These analyses and the relationships
are depicted in Figure 6. Detail regarding the fire risk analysis methodology is provided in
Attachment C.
Figure 6 – Fire and Landslide Model Analyses
A map illustrating resulting risk values across the study area is provided in Figure 7. High risk
areas are in red while areas of lower fire risk are green. Areas shown in grey were excluded from
these calculations.
The analysis shows that much of the areas that are at highest risk of fire, shown in red, are located
outside of the water supply watersheds. Nevertheless, an average risk score was calculated for
each watershed area individually to prioritize mitigation actions/strategy based on risk.

17
Figure 7 – Relative Fire Risk Map
Table 1 shows the final rank of each watershed based on average risk scores by watershed and
ranks each watershed from highest (1) to lowest (6) average risk. Rank here is equated with
likelihood of a wildfire event, not to the consequence of such an event to the City’s supply, or
overall risk.
Table 1: Watershed Priority Rank Based on Historic Wildfire Incidents
Name of Water Supply Watershed Rank
Klondike Quarry 1
Wallace Pond 2
Babson Reservoir 3
Goose Cove Reservoir 4
Fernwood Lake 5
Haskell Reservoir 6 (tied)
Dykes Meadow 6 (tied)

18
The prioritization of management should be based on likelihood of future wildfire event and the
consequence of failure, which is informed by the City’s preferences and goals. This risk-based
prioritization is not quantified through this analysis; however, a simplified example using one
failure mode and one category of consequence of failure is provided below for explanatory
purposes.
A quantitative framework could be used to prioritize watersheds based on risk, the product of
likelihood of failure and consequence of failure. For the likelihood of failure term, each watershed
could be assigned a score based on their history of wildfire. Higher historic fire frequency would
correspond with a high likelihood of failure. For example, Klondike Quarry Pond, which has a
higher likelihood of failure, might be assigned a 5 and Dykes Meadow a 1, using a 1-5 scale. A
typical consequence of failure framework may incorporate environmental, social, and economic
impacts. Each water supply watershed could be assigned a consequence of failure score based
on these potential impacts. Given the framework of this evaluation, one of the largest societal
impacts of a fire and/or landslide within a water supply watershed is reduction of available water
supply due to impacts on water quality. Given the storage capacity and overall resilience of the
West System, reservoirs within this system could be assigned a higher consequence of failure
score than those in the East System. As an example, Klondike Quarry, which is in the East
System, could be assigned a 1 and Dykes Meadow a 5. By multiplying the likelihood of failure
and consequence of failure terms for these two reservoirs (5x1 and 1x5), we find the risk is
equivalent.
Alternatively, the criticality of a watershed could be assigned based on the capacity of the
reservoir or the City’s reliance on the water supply reservoir for supply under current operations.
In the first case, Dykes Meadow, Haskell, and Babson/Goose Cove Reservoir (connected system)
could be assigned a higher criticality given their high storage capacity and therefore their
capability in providing drinking water supplies. In the second case, Dykes Meadow,
Babson/Goose Cove (connected system), and Haskell, would have the highest criticality, given
their water use (based on water use data from 2009-2017).
A more robust and fully developed framework would provide a guide to further prioritize
management alternatives based on fire risk. While this analysis has an established a framework
for prioritizing alternatives based on likelihood of failure, prioritizing based on overall risk would
require further development and validation of a risk framework.
19
3.3 Current Landslide Risks
Landslide incidence/ susceptibility ratings were available from the 2018 State Hazard Mitigation
and Climate Adaptation Plan (SHMCAP). To locate the most likely landslide initiation points in
each watershed, the normalized fire risk was overlain by the cells of a landslide susceptibility map
with risk values representing elevated risk for landslide according to the accompanying literature
(MassGIS, 2013). Likely initiation points were visually located in each watershed and the
coordinates recorded.
Most of the predicted landslide activity was located on steeply sloped areas within the watersheds.
Since the elevation in the study area does not vary greatly, the steepest slopes were located near
the water bodies in the reservoirs. The proximity of the initiation points to the water bodies makes
the waterbodies especially vulnerable to impacts from mass movements.
The analysis showed that although there has not been an historic high incidence of wildfire within
the watersheds, the risk can be characterized for purposes of prioritizing watershed management
resource allocation both for current and anticipated future conditions.
3.4 Current Forest and Wildlife Management Practices
The City currently manages vegetation in targeted areas throughout each watershed. The City’s
vegetation management plan provides operation and maintenance procedures to prevent
structural damage to dams. The City’s plan includes vegetation removal and grass development
recommendations in specified areas to protect critical infrastructure. Additionally, the City ensures
that access to drinking water supply facilities is maintained by managing vegetation surrounding
structures (such as water treatment facilities, water storage tanks, gate houses, fences, control
vaults, and intake valves).
Additionally, in 2018, the City received a Recreational Trails Program Grant to protect public water
supply reservoirs and public health and improve public safety with fire control and aid response
and manage public access to the City’s recreational areas and open spaces. This grant improved
public access to recreational areas at Fernwood Lake Reservoir, Haskell Reservoir, and Dykes
Meadow Reservoir through both private stewardship efforts and management by the DPW.

20
4 CHARACTERIZING POTENTIAL FUTURE CLIMATE CONDITIONS
To characterize future risks to water supply, we began by characterizing the ways in which
streamflow into the reservoirs could change due to changing air temperatures and shifts in
precipitation patterns. We focused our evaluation on a mid-term planning horizon (2050), and a
long-term planning horizon (2070), though conclusions for both tended to be consistent with each
other.
Because none of the contributing streams are gaged, streamflow estimates were developed using
standard hydrologic and climate variables (see Attachment B). Two different sources of
streamflow estimates were developed:
• Method 1: Streamflow as a function of precipitation and air temperature (newly developed
for this study); and,
• Method 2: Streamflow developed from hydrologic watershed models that represent
precipitation, infiltration, evapotranspiration, baseflow, and runoff (developed previously
by the University of Massachusetts at Amherst and adapted for this study). Further detail
regarding the UMass model is provided in Attachment B.
Streamflow estimates were calibrated against records for the nearby Parker River, which although
flowing from a larger watershed, is representative of the land uses and climate of the Gloucester
watersheds. The figures below illustrate the reasonableness of Method 1. First, we can see how
temperature and precipitation can be effective predictors of future streamflow by their ability to
reproduce historic streamflow in the Parker River. Second, the estimated flows for the Parker
River are then scaled and adjusted for the smaller watersheds in Gloucester, and the approach
is validated by the ability of the estimated streamflow records, paired with actual historic records
of water withdrawals, to reproduce the annual rise and fall within the reservoir system. The
correlation between documented Parker River streamflow and estimated streamflow based on
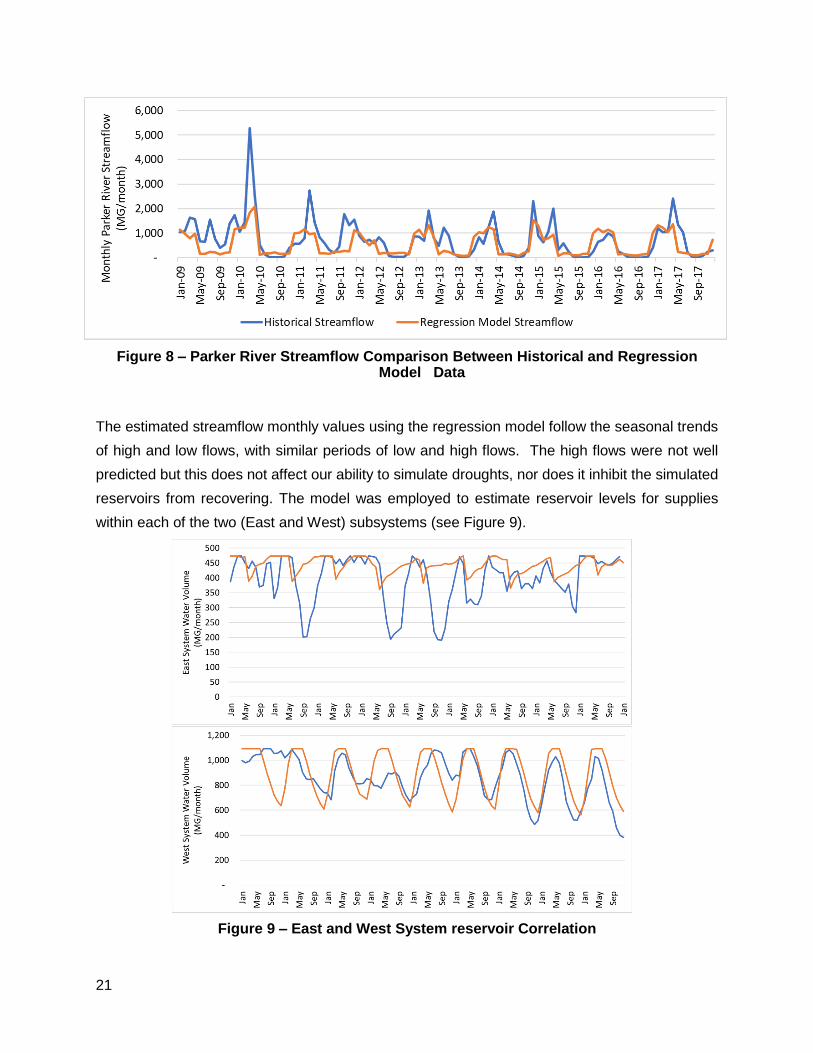
the Method 1 regression model is reflected in Figure 8.
21
Figure 8 – Parker River Streamflow Comparison Between Historical and Regression Model Data
The estimated streamflow monthly values using the regression model follow the seasonal trends
of high and low flows, with similar periods of low and high flows. The high flows were not well
predicted but this does not affect our ability to simulate droughts, nor does it inhibit the simulated
reservoirs from recovering. The model was employed to estimate reservoir levels for supplies
within each of the two (East and West) subsystems (see Figure 9).
Figure 9 – East and West System reservoir Correlation

22
The Team worked with the City to account for the historic drawdowns which were not captured in
the model. Based on City records, anomalies were caused by construction-related drawdowns or
discretionary changes in operating rules. Of importance was the ability of estimated streamflow
to reproduce the severity and duration of each annual drawdown.
Each of the two methods was employed to examine potential hydrologic conditions in 2050 and
2070. Global Circulation Models (GCMs) were used to estimate the range of potential changes
in air temperature and precipitation patterns, and these were converted into future streamflow
estimates for both Method 1 and Method 2 above. Because 14 different climate models were
used, it was instructive to consider both typical, or average, predictions as well as worst-case
conditions, defined for this study as the 10th percentile of rain each month, and the 90th percentile
of temperatures each month. This approach is discussed further in Section 5. Figure 10 illustrates
the range of potential future streamflow conditions that were used to bound the analysis:
Figure 10 – Project Streamflow Scenarios (Generalized)
These results represent flows in the Parker River before they were scaled down and adjusted to
the watershed areas in Gloucester.
0
500
1000
1500
2000
Jan-70 Feb-70 Mar-70 Apr-70 May-70 Jun-70 Jul-70 Aug-70 Sep-70 Oct-70 Nov-70 Dec-70
Refe
renc
e St
ream
flow
(MG
/MO
)
Projected 2070 Streamflow Scenarios
Regression - Typical Hydrologic - Typical
Regression - Worst Case Hydrologic 10th Percentile

23
5 POTENTIAL IMPACTS OF FUTURE CLIMATE ON WATER SUPPLY
The greatest risk to the water supply system in the future will come from periods of drought, when
the reservoirs will not recharge as fast or as much as they do currently. The regression model
was developed to use precipitation and temperature data, and climate projections of these two
data sets were used to estimate future streamflow. Using historical precipitation and temperature
data from known periods of drought as inputs to the regression model, we also estimated the
reservoir levels during those historical droughts. Comparing the reservoir levels during known
historical droughts and future climate scenarios allowed us to understand future risk.
For this study we looked at both “averaged” climate projections, which represented a typical stable
year, and “worst case” projections. The averaged scenario did not demonstrate significantly
increased risks. The worst-case scenario uses the same climate projection data as the averaged
projection scenario. However, instead of averaging the data, we compiled the lowest precipitation
data (10th percentile) and the highest temperature date (90th percentile). This extreme condition
does show potential risks in the form of a system that may not fully refill each year. The reservoirs
did not fully recharge in the most recent droughts. The analysis indicated that the historic droughts
are LESS stressful to the system than our worst-case predictions, so we can have some
confidence that we are being sufficiently conservative. The results have been superimposed in
Figure 11.

24
Figure 11 – Historical Droughts and Future Climate Projections
1964-1967 1980-1982 2001-2002 2016


26
Figure 12 – Projected Future Water Volumes
As shown in Figure 12, the supply under averaged climate projections is generally sufficient and
resilient. For visual clarity, this figure shows a shorter period of time than the planning horizon of
30 years. For our purposes in this report, resilient or resiliency refers to the ability of the reservoirs
to refill each year. Under worst case projections, the system overall is more stressed, and the
West sub-system specifically is at greater risk.
0
200
400
600
800
1000
1200Ja
n
Ap
r
Jul
Oct
Jan
Ap
r
Jul
Oct
Jan
Ap
r
Jul
Oct
Jan
Ap
r
Jul
Oct
Jan
Ap
r
Jul
Oct
Jan
Ap
r
Jul
Oct
Jan
Ap
r
Jul
Oct
Wat
er
Vo
lum
e (
MG
/mo
nth
)
West Water Supply
2070 Typical 2070 Worst Case
0
100
200
300
400
500
Jan
Ap
r
Jul
Oct
Jan
Ap
r
Jul
Oct
Jan
Ap
r
Jul
Oct
Jan
Ap
r
Jul
Oct
Jan
Ap
r
Jul
Oct
Jan
Ap
r
Jul
Oct
Jan
Ap
r
Jul
Oct
Wat
er V
olu
me
(M
G/m
on
th)
East Water Supply
2070 Typical 2070 Worst case

27
In addition to evaluating a “Worst Case” condition for water supply reliability, in which the 10th
percentile of estimated future monthly precipitation from the various models was applied, we also
evaluated the inverse of this, in which the 90th percentile of precipitation was applied. The intent
was to determine if the reservoirs might be so full (and so frequently full) that additional spillage
might create an infrastructure risk. The tools used for this evaluation were not hydraulic models,
so the results are very general. Still, we were able to determine from Figure 13 and Figure 14
that this “Highest Precipitation” scenario would likely result in reservoirs throughout the system
refilling each year, but not necessarily remaining at or near their full thresholds
continually. However, estimated total spillage from current conditions is projected to roughly
double. These results are volumetric on a monthly average basis, and do not include estimates
for peak instantaneous spill rates. That said, the estimated maximum monthly volume of spillage
from the system from this scenario is approximately 700 MG/month, which does not appear to be
too far beyond the range of the maximum estimated volume from recent years. It could just be
expected more regularly.

28
Figure 13 – Projected Volume under Low and High Precipitation Scenarios
Figure 14 – Projected Spill Volume under High Precipitation Scenario

30
6 MANAGEMENT ALTERNATIVES
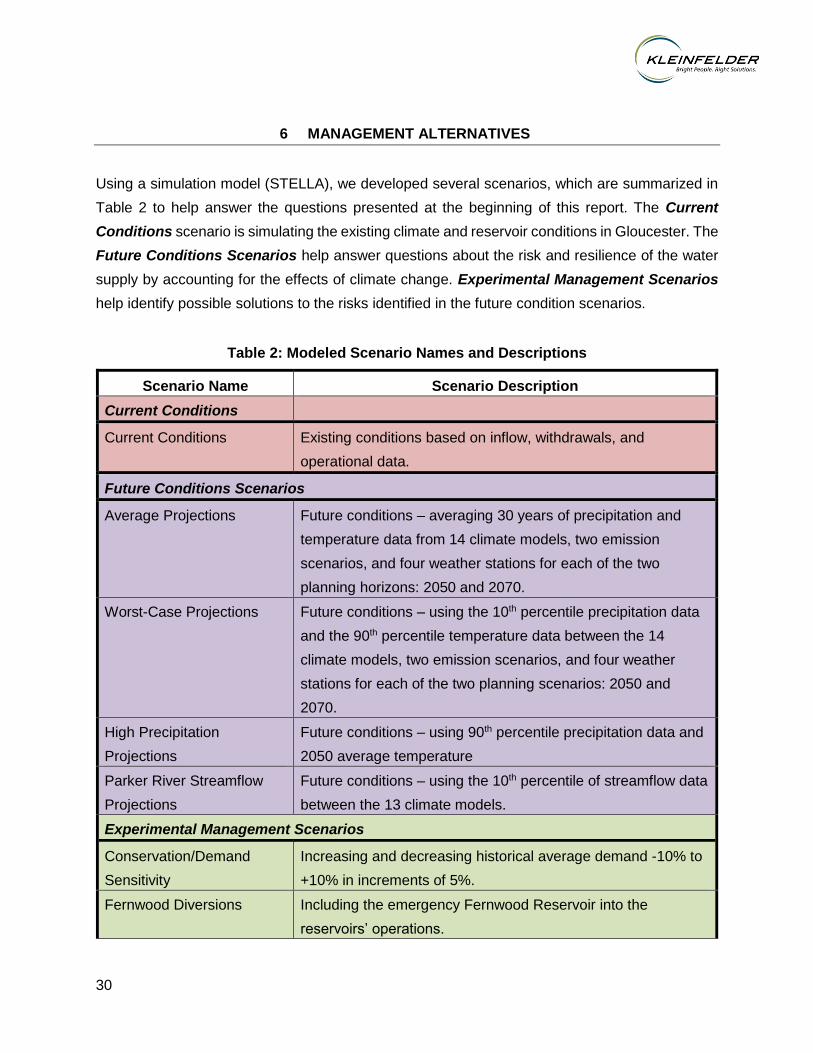
Using a simulation model (STELLA), we developed several scenarios, which are summarized in
Table 2 to help answer the questions presented at the beginning of this report. The Current
Conditions scenario is simulating the existing climate and reservoir conditions in Gloucester. The
Future Conditions Scenarios help answer questions about the risk and resilience of the water
supply by accounting for the effects of climate change. Experimental Management Scenarios
help identify possible solutions to the risks identified in the future condition scenarios.
Table 2: Modeled Scenario Names and Descriptions
Scenario Name Scenario Description
Current Conditions
Current Conditions Existing conditions based on inflow, withdrawals, and
operational data.
Future Conditions Scenarios
Average Projections Future conditions – averaging 30 years of precipitation and
temperature data from 14 climate models, two emission
scenarios, and four weather stations for each of the two
planning horizons: 2050 and 2070.
Worst-Case Projections Future conditions – using the 10th percentile precipitation data
and the 90th percentile temperature data between the 14
climate models, two emission scenarios, and four weather
stations for each of the two planning scenarios: 2050 and
2070.
High Precipitation
Projections
Future conditions – using 90th percentile precipitation data and
2050 average temperature
Parker River Streamflow
Projections
Future conditions – using the 10th percentile of streamflow data
between the 13 climate models.
Experimental Management Scenarios
Conservation/Demand
Sensitivity
Increasing and decreasing historical average demand -10% to
+10% in increments of 5%.
Fernwood Diversions Including the emergency Fernwood Reservoir into the
reservoirs’ operations.

31
Scenario Name Scenario Description
Operational Flexibility Scenario to allow withdrawals from the system that is fuller in
any given month, regardless of season.
The current conditions scenario represents the known estimated inflow, withdrawals, transfers,
and operational conditions from available historical data. The following operational rules were
included in this study:
• Water is withdrawn from the East System during the winter months (December through
May) and from the West System during summer months (June through November). Note,
withdrawals from the systems do not historically match this assumed seasonality because
of construction and repair work or water quality issues during the period from 2009 - 2017.
• If there is not enough water in the East System during the winter, withdraw the balance
from the West System first, and then Klondike.
• If there is not enough water in the West System during the summer, withdraw the balance
from Klondike first and then the East System.
• Klondike is used as an emergency source. Historically, water is taken out of Klondike
during late summer months.
• Water in the East System can be blended in the pipe that connects the Babson and Goose
Cove reservoir or in the Babson Reservoir because of water quality issues in the Babson
Reservoir. At times, water can be taken directly from Babson without blending (typically in
late winter to spring). Gloucester does not have historical transfer data between these
two reservoirs. For this study we started with a blending ratio of 50:50, which means that
half of the demand needed in a month will be withdrawn from the Babson Reservoir, while
the other half will be withdrawn from the Goose Cove Reservoir. The transfer of water is
from Goose Cove to the Babson Reservoir. The City agreed this initial blending ratio
assumption was reasonable.
• Wallace Reservoir is transferred to Dykes.
• Fernwood is assumed off-line for this exercise. It is an emergency supply that requires
Massachusetts DEP approval to operate, has a low storage volume, and has extremely
high organic levels making it very difficult to treat.
• Historical demand was averaged by month.
Under averaged future climate conditions, the water supply system in Gloucester is as resilient
as under current conditions and follows the same recharge and drawdown trends. The model did
not point to any risks in the water supply volume for either of the two planning horizons. The model
estimates statistically similar reservoir levels between the two planning horizons. We note that

32
this is partly due to the averaging affect, and many individual scenarios would indicate elevated
risk when compared against current conditions.
The model estimates significant risks to the water supply system in Gloucester under worst case
precipitation and temperature projections. Over a future multi-year simulation period for conditions
in 2050 or 2070, the total supply available ranges from a low of 20% to a high of 50% of total
potential supply.
By testing the sensitivity of the model to certain operational assumptions, we identified that the
required blending ratio between the Goose Cove and Babson reservoirs has a significant impact
on the water supply availability. This initial blending ratio of 50:50 stresses the East System by
depleting the Goose Cove reservoir while not utilizing the available water in the Babson reservoir.
A blending ratio of 20:80 (20% of water needs from Goose Cove and 80% from Babson) makes
the system more resilient, as it captures more water from the Babson reservoir, which is the larger
of the two has a large contributing drainage area, and recharges faster than all other reservoirs.
This blending ratio allows Goose Cove to recover. Even at a 30:70 ratio Goose Cove is almost
depleted at the end of the planning horizon. The implication of this finding is that Goose Cove has
limited opportunities to recharge and refill and careful monitoring of the reservoir levels will be
needed in the future. The study used the 20:80 blending ratio for all future climate projection
scenarios, to understand the potential for management alternatives that can improve the system’s
reliability.
Potential management scenarios included a look at the sensitivity of the system to conservation
and demand strategies. Ultimately, the evaluation concluded:
• Demand decrease (population decrease or water conservation measures) can alleviate
some of the risks of climate projections.
• The West System’s resiliency is improved by reducing demand at the rate modeled.
• The East System’s resiliency does not change by changing demand at the rates modeled.
Fernwood Reservoir diversions were also modeled. The results of the evaluation showed:
• Capturing the spill from Fernwood improves the system’s overall resiliency as the average
total supply increases from a minimum of 50 to 62% and a maximum of 75 to 90%.
• Diverting half the inflow from Fernwood directly into the Wallace Reservoir improves the
system’s overall resiliency as the average total supply increases from a minimum of 50 to
59% and a maximum of 75 to 85%.
33
• Fernwood is currently an emergency reservoir – just turning the valve on for normal
operations does not improve the system’s resiliency.
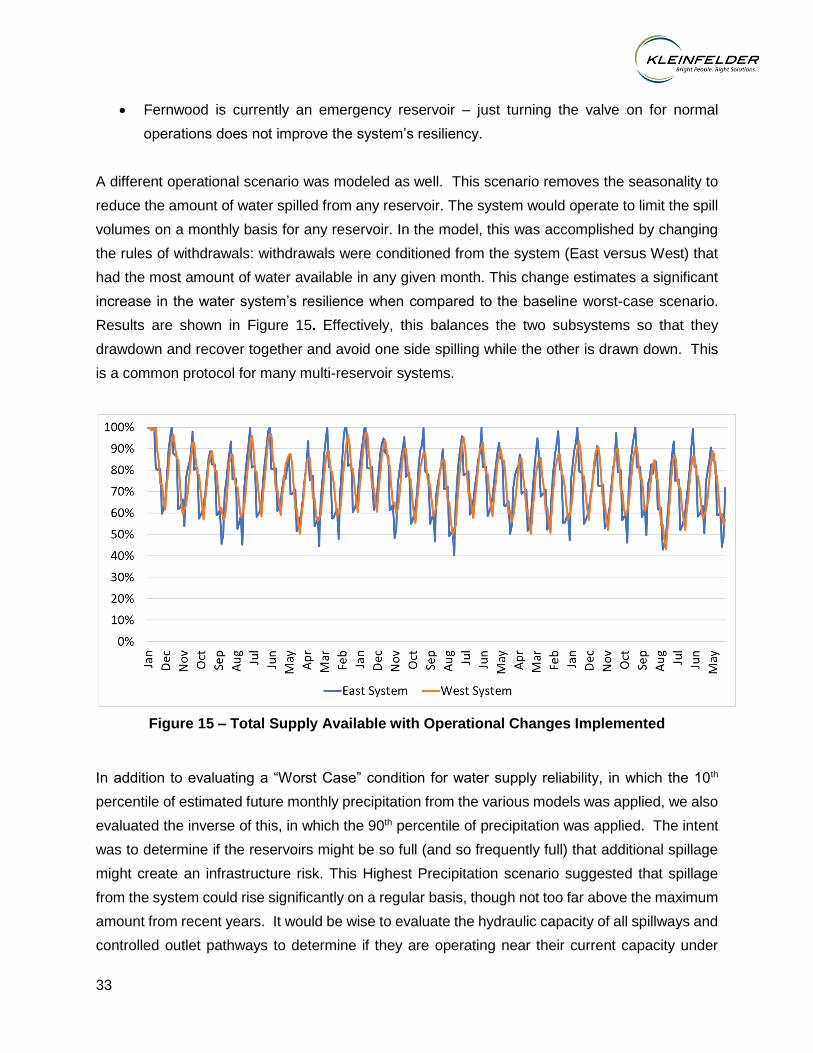
A different operational scenario was modeled as well. This scenario removes the seasonality to
reduce the amount of water spilled from any reservoir. The system would operate to limit the spill
volumes on a monthly basis for any reservoir. In the model, this was accomplished by changing
the rules of withdrawals: withdrawals were conditioned from the system (East versus West) that
had the most amount of water available in any given month. This change estimates a significant
increase in the water system’s resilience when compared to the baseline worst-case scenario.
Results are shown in Figure 15. Effectively, this balances the two subsystems so that they
drawdown and recover together and avoid one side spilling while the other is drawn down. This
is a common protocol for many multi-reservoir systems.
Figure 15 – Total Supply Available with Operational Changes Implemented
In addition to evaluating a “Worst Case” condition for water supply reliability, in which the 10th
percentile of estimated future monthly precipitation from the various models was applied, we also
evaluated the inverse of this, in which the 90th percentile of precipitation was applied. The intent
was to determine if the reservoirs might be so full (and so frequently full) that additional spillage
might create an infrastructure risk. This Highest Precipitation scenario suggested that spillage
from the system could rise significantly on a regular basis, though not too far above the maximum
amount from recent years. It would be wise to evaluate the hydraulic capacity of all spillways and
controlled outlet pathways to determine if they are operating near their current capacity under

34
current conditions, and if there are opportunities to improve flow capacities through maintenance
and repair. If so, this study suggests that maintenance or improvements to these controlled outlet
pathways may be advisable in the future to reduce risks of flooding and/or dam
overtopping. Furthermore, it may be advisable to examine the maximum potential spillage from
each reservoir during future design storm events so that (a) operating rules can be adjusted for
pre-storm drawdown, and (b) specific improvements to spillways and other controlled outlet
pathways may be identified if necessary. Based on the development of future climate trends and
any findings from hydraulic analysis of spillways and outlet pathways during future design storms,
an automated flood forecast, and management system may be considered in the future, but does
not appear to be a high priority at this time. At times, blending Babson and Goose Cove water is
necessary to produce water that meets regulatory requirements. Water from Goose Cove is of
higher quality and is easier to treat since it contains about half the iron, manganese, and organic
levels of Babson. Therefore, water from Babson is preferred over Goose Cove. The DPW added
the ability to pump from Babson to Goose Cove in 2014. With Babson Reservoir aeration,
currently under design, the need for blending should be reduced as intake iron and manganese
should be reduced and thermal stratification lessened at the intake structure. In September 2019,
the DPW will have a new transfer meter vault that will quantify flow from Goose Cover to Babson
and from Babson to Goose Cove with a bi-directional full port magnetic flow meter.

35
7 RELEVANCE OF FIRE RISK TO WATER SUPPLY
7.1 WATERSHED MANAGEMENT GOALS
Watershed protection is typically achieved through land use and access controls with
maintenance and management procedures to assure consistent and adequate water quality
security. In the context of this resiliency evaluation, risks to the watersheds surrounding the City’s
water supplies were evaluated in the context of fire and landslide risk contributing to degradation
of water quality.
Climate data generally was omitted from this analysis. Evapotranspiration, which is a sum of
evaporation and transpiration in a given area, showed little spatial variability across the study
area. Other climate data had high temporal resolution, but a low spatial resolution. Little variation
was observed in an exploratory analysis of the spatial variability of historic and future climate data,
as well. Therefore, climate data was treated as spatially constant. Generally, increased average
temperature and changes in precipitation patterns may increase the risk of fire in the City’s water
supply watersheds.
Additionally, many historic wildfires were not caused by natural forces alone. In a review of
relevant historic fire records, humans were believed to have started most incidents. While
anthropogenic factors are considered significant in understanding fire risk, these factors were not
incorporated into this model. There are administrative tools, such as zoning overlays to address
the Wildland-Urban Interface (WUI) that can be utilized. The WUI is generally defined as the area
where human activity and development meets or is interspersed with wildlands, such as the
forested land around the City’s watersheds. The specific characteristics of the WUI in Gloucester
have not been explored for this study, but additional evaluation to characterize or qualify potential
impacts of further land use or development regulation may be warranted.
As the basis of our evaluation was mitigating water quality impacts of fire risk, watershed
management goals were assumed to focus primarily on reducing risk or likelihood of fire, as well
as the consequence of a wildfire where there is an incident. The following discussion is focused
on the manner in which such risk could be reduced under existing and future conditions.

36
7.2 MANAGEMENT ALTERNATIVES
Forested watersheds, according to Fernando Rosario-Ortiz, “absorb rainfall and snow melt, slow
storm runoff, filter pollutants, provide habitat, and provide recreational opportunities that support
local economies.” However, watersheds that are impacted by fire and landslides can contribute
to negative water quality though the deposition of sediment into reservoirs and increased turbidity.
One proactive approach to reduce the risk of these events occurring is through implementing land
management strategies or alternatives. Recommended land management alternatives, as
described below, are categorized based on their main goal of either general forest management
(silviculture) or control of gypsy moth, as depicted in Figure 16. Further detail is provided in
Attachment C.
Figure 16 – Diagram of Land Management Alternatives to Reduce Risk of Fire and Landslide
7.2.1 Forest and Wildlife Management
Proper forest management will result in a reduction of wildfires and landslides risk, and
improvements in water quality. Forest management is typically done through the application of
silvicultural practices. Silviculture is the cultivation and management of forests and stands to meet
the landowner’s desired needs. A stand is the basic unit of a forest and is generally an area
containing trees of similar size, age, and species. Several silvicultural techniques outlined below
can direct forest growth towards meeting the overall watershed management goals of increasing

37
overall water quality of the reservoirs and while also attaining a reduction in the risk of wildfires
and landslides.
Like much of the forested area in the Northeast and New England, the forest health in water
supply watersheds is impacted by the spread of an invasive inspect species, called gypsy moth.
This infestation led to widespread defoliation, increases in dead/dying trees, and a decrease in
forest health (Liebhold, et al., 1997). At a Public Meeting in December 2018, residents shared
that there are multiple areas, particularly near Babson Reservoir and in the Dogtown Commons
that have stands of infected or fallen dead trees. Poor forest health increases the risk of fire and
landslide. Moth population control will prevent an increased number of dead standing trees that
ultimately provide fuel for wildfires.
7.3 ALTERNATIVES FOR WATERSHED MANAGEMENT
7.3.1 Stand Tending and Thinning
Tending: Selective management of individual trees by removing branches to manage light
exposure to the understory. In doing so, either dead branches that would provide fuel are removed
or whole trees are removed to promote growth of selected trees. A reduction in the overall canopy
can also promote growth in the understory that improves ground cover and root density that can
mitigate erosion within the forest.
Thinning: Removal of trees to reach a desired stand density. The density of a forest/stand is
important from an ecological standpoint to either encouraging or discouraging competition. With
a desired goal of resiliency, removing trees of the dominant species can encourage a more
diverse stand population.
7.3.2 Controlled Burns
Controlled or prescribed burns involve intentionally lighting specific areas to consume fuel (dead
trees and other woody materials that may burn). This ultimately leads to an overall reduction in
fuel for wildfires and an increase in species resilient to wildfires.
7.3.3 Riparian Zone Management
Riparian Zone management, often referred to as buffer strips, is considered a best management
practice in stormwater engineering. The succession of vegetation lining the banks of water bodies

38
creates dense understories with high root densities. This combination increases sheet flow
generated by the increase in friction or obstacles therefore slowing down runoff and increasing
infiltration. Added benefits also include lower suspended solids due to less and slower overland
flow. High root densities keeping soils in place also contribute to this. In New England it is typical
to see the forest and riparian zone overlapping. It is therefore especially important to concentrate
on developing the riparian zone.
7.3.4 Sanitation Cut
Sanitation cuts is the intersection of using forest management to control the gypsy moth
population. Put simply, trees infected by the gypsy moths are cut and removed from the stand in
order to limit their spread, while reducing standing dead trees. In some respects, this can also
achieve similar outcomes of a thinning method. Removal of the dead trees also reduces fuel for
wildfires.
7.3.5 Chemical and Biological Control
Gypsy moths have proven to be a resilient pest that routinely affects our forests and forest health.
Large swaths of forest have been defoliated, leaving dead trees throughout much of New
England, New York, Pennsylvania and Michigan. Success in controlling gypsy moth populations
has been attained using pesticides, fungi, and viruses. However, due to the proximity of these
forest and catchments to drinking water reservoirs, extreme care and consideration should be
given before employing one of these methods. These should be mostly a last resort method and
in extreme cases.

39
8 CONCLUSIONS
Results of the analyses conducted for this study show that the City of Gloucester water supply is
sufficient, but current operations and treatment capacity may not allow the water to be in the right
place at the right time. Erosion potential due to wildfires within the watershed may further increase
the need to bolster future treatment capabilities to cope with turbidity and organic matter. Future
efforts should focus on expanded treatment capacity and possibly pump capacities to help provide
flexibility in source blending and more frequent blending of, or switching between, subsystems
and their elements.
More specifically, the findings are:
1) The water supply in Gloucester is adequate and resilient under current climate conditions.
The six active and one emergency reservoir provide the City with redundancy and
operational flexibility; when one reservoir cannot be used, enough water exists in the other
reservoirs to meet the City’s current drinking water demand. The model estimates enough
water in both the West and the East Systems, without having to rely on the water in the
emergency Fernwood Reservoir, which is limited in quantity and exhibits poor water
quality.
2) The water supply in Gloucester is vulnerable to future droughts and may not be able to
refill each year as reliably as it does today if climate trends tend toward the more extreme
conditions of warmer temperatures and less rain in the summer. Most reservoir recharge
occurs from September to May.
3) Although it provides 2.3 times greater storage capacity, the West System is less resilient
than the East System. Under current operating protocols, withdrawals from the West
System are in the summer months when droughts are prevalent and the reservoirs in the
West Systems have small watershed areas and therefore limited recharge potential. In
combination, these conditions contribute to longer recovery periods, and less likelihood of
achieving full reservoir capacity over the climate change-modeled planning horizon.
4) The operating regimen/system balancing has developed over time to reflect functionality
of the infrastructure and water quality and quantity within the respective reservoirs and
sub-systems. Currently there is no raw water connection between the East and West
systems. Finished water is exchanged via 2 x 20” fused PVC pipes under the Annisquam

40
between the West Gloucester Water Pollution Control Facility and Gloucester High School
in East Gloucester.
5) Although not possible with the current infrastructure configuration, the risks can be
mitigated by reconsidering how and when each of the two systems are relied upon in the
future, and by keeping them more balanced throughout the year so that they draw down
and recover concurrently.
6) Analysis shows that the system should have sufficient water, but that it may not be in the
right place at the right time. Rebalancing the reservoirs could alleviate this vulnerability
but will require additional alternatives analysis to include evaluation of existing
infrastructure assets, necessary new capital investments, and operating constraints.
7) Findings based on “highest precipitation” scenarios (and in contrast to the drought or less
frequent precipitation scenarios that were the primary focus of the analysis) suggest that
under this condition reservoirs throughout the system will refill each year, but not
necessarily remaining at or near their full thresholds continually. However, estimated total
spillage from current conditions is projected to roughly double. These results are
volumetric on a monthly average basis, and do not include estimates for peak
instantaneous spill rates. That said, the estimated maximum monthly volume of spillage
from the system from this scenario is approximately 700 MG/month, which does not
appear to be too far beyond the range of the maximum estimated volume from recent
years. It just should be expected more regularly.
8) Much of the area of the City at greatest risk of wildfire was determined to be outside of the
reservoir watershed areas. Wildfire is still a major risk to water supply, however, as loss
of vegetative cover can lead to elevated turbidity. Both the consequences and likelihood
of a wildfire event can be mitigated through a program of prioritized tasks related to
vegetation/forestry management.
9) Within the watersheds, erosion risk was determined to be greatest at steeper slopes
typically proximate to the reservoirs. As a result, water quality impacts from erosion and
debris mobilization contribute to findings with respect to the value of water treatment
capability as a means of maintaining supply resiliency.
10) The City has management/operational alternatives that can provide greater resiliency than
currently provided. This study evaluated options based on prevalent water supply
management alternatives used in the industry, with some additional options based on
stakeholder input.

41
11) This study has applicability to other small municipalities in the region, especially in
Massachusetts. The methodology used to estimate hydrology in this study (calculating
inflows into reservoirs using a regression relationship between precipitation and
temperature) can be replicated for other communities where streamflow data is not
available from USGS or other monitoring sources. The availability of statewide
precipitation and temperature climate projections facilitates studying the reliability and
risks of smaller water supply systems in the region and in Massachusetts.
Recommendations
This analysis addressed volume of drinking water within the Gloucester system without respect
to consideration of current treatment capacity and/or future treatment requirements posed by
modified operations. As presented in the report, several strategies can be employed to mitigate
impacts of climate change upon the City’s water supply and watersheds. Based on those findings,
we recommend the following:
Near Term Actions:
1. Update the existing Drought Management Plan to reflect understanding of current and
near-term future conditions; continue implementation of demand management strategies
to support overall system resilience.
2. Implement recommendations from previous Babson Source Water Management System
Report (2014) with respect to flow routing/reservoir partitioning, aeration and mixing to
improve raw water quality for Babson Reservoir.
3. Initiate baseline monitoring program for raw water quality and reservoir bathymetry.
4. Conduct further evaluation and conceptual design of system to capture the spill from
Fernwood or diverting flow from Fernwood directly to Wallace Reservoir to improve the
system’s overall resiliency by measurable margins.
5. Develop and implement written protocols for pre-storm event reservoir drawdown to
mitigate impacts from spill events.
Longer Term Actions:
6. Initiate pilot testing for treatment technologies under various source surface water
blending scenarios with intent to operate under a non-seasonally influenced withdrawal
regimen by balancing drawdown between the East and West Systems.

42
7. Evaluate potential raw water transfer options between the East and West Systems.
8. Evaluate (and or compile existing evaluations) of hydraulic capacity of all spillways and
controlled outlet pathways to determine if they are operating near their current capacity
and if there are opportunities to improve flow capacities through maintenance and repair.
9. Based on results of hydraulic analysis, re-visit written protocols and operating rules for
pre-storm event drawdown to mitigate impacts from spill events.
Watershed Management (all Near Term Actions):
5. Employ forest and wildlife management strategies to mitigate the potential for wildfire and
negative impacts to water quality. Strategies should be prioritized in the near-term based
on historic frequency of wildfire and criticality of the water supply reservoir in meeting
demand under current operations. In the future, strategies should target specific areas
and should be prioritized based on risk following the development of a robust framework.
(Note that the DPW is currently researching grant opportunities to fund forest and wildlife
management efforts.)
6. Although it was not specifically studied in the context of incidence frequency or extent of
impact, improved access for emergency response and firefighting activity within the
watershed areas can also support mitigation through reduced burn acreage.
7. Pursue regional opportunities with neighboring communities to leverage watershed
management across municipal boundaries.
8. Conduct a watershed-specific inventory of forest health to provide a baseline of current
conditions and identify site-specific recommendations

___________________________________________________________________________________
Attachment A
Stakeholder Objectives

Objectives: City of Gloucester Watershed Resiliency Evaluation
The objectives summarized below are a compilation of those expressed at an initial kick-off
meeting with the City. In general, the objectives fell into categories we have characterized as
Operations/Environmental, Public Engagement, Health and Safety, Land Use and Affordability.
Operations/Environmental
• Identify and reduce hazards to surface water supply protection
• Determine if evolving or emerging needs dictate new operational plans (e.g. forestry
division redux)
• Obtain a better understanding of the water system and its needs over the long term
• Establish if wildfire is a significant current risk, and whether it may be an increasing risk
• Adapt to changing raw water quality and implications for treatment processes investments
or improvements
• Recognize and mitigate risks to water quality in reservoirs, including
topography/slopes/wildfire and degradation from organics – preserve vegetated cover
(Babson and Goose Cove Reservoirs are especially of concern)
Public Engagement
• Engage the public in solutions and educating them about needs
• Ensure that the right messaging is taking place to all stakeholders (political, public, private)
and that feedback is solicited and incorporated in solutions
Health and Safety
• Ensure ability to provide uninterrupted water service for drinking, fire suppression/fighting
without having to rely on smaller neighboring supply system in droughts or emergencies.
• Optimize emergency response effectiveness – ensure access to areas in and around
Dogtown for the inevitable future wildfire
• Identify watershed management/land use factors that increase risks to health and property
– wildfire risks grow as forestry management is reduced and development encroaches
Land Use
• Engage user groups in solution development (For example: Open Space, Recreation,
Conservation, Wildlife Management)
• Allow/encourage/steward multiple uses to leverage value of conservation land
Affordability/Cost

• With limited personnel and financial resources and recognizing that water infrastructure is
not in good shape – evaluate and identify the distinction between what are affordable
objectives that we can choose to do and priorities that we essentially must do to protect
the system, deliver to our customers and meet the objectives cited above.

Attachment B
Water Supply Analysis Technical Memorandum
Note: This memorandum was developed for the stakeholder engagement process and is
superseded by the main report.

20172835.003A
Page 1 of 35
© 2019 Kleinfelder www.kleinfelder.com
KLEINFELDER One Beacon Street, Suite 8100, Boston, MA 02108 p | 617.497.7800 f | 617.498.4630
T E C H N I C A L M E M O R A N D U M
TO: Gregg Cademartori, Michael Hale; City of Gloucester
FROM: Betsy Frederick, Kleinfelder
DATE: April 24, 2019
SUBJECT: DRAFT Technical Memorandum: Water Supply Risk Assessment and
Management Strategies
CC: Kirk Westphal, Lucica Hiller; Kleinfelder
File
1 INTRODUCTION
1.1 PURPOSE AND SCOPE
The City of Gloucester (the City) water supply system is critical for the community’s resilience and quality of life. The water supply system is composed of reservoirs, transfer pumping stations, dams, intake structures, and water treatment facilities. The City is located on the Cape Ann peninsula and has limited fresh water supply with little opportunity for localized expansion. Its sources depend upon small, freshwater rivers that drain small watersheds and contribute runoff to the existing reservoirs. The City does not own or operate any groundwater facilities. Through the Municipal Vulnerability Program (MVP) planning process, the City identified their water supply as an asset vulnerable to impacts of climate change that warranted further study. This memorandum details the findings of a study to assess the risks to the City’s water supply and identify management alternatives. This study was funded through a Commonwealth of Massachusetts MVP Action Grant. The purpose of this study is to answer the following fundamental questions:
• What are the current risks related to water supply?
• How will the water supply respond to future changes in temperature and precipitation?
• What can be done to mitigate impacts from shifts in climate?

20172835.003A
Page 2 of 35
© 2019 Kleinfelder www.kleinfelder.com
KLEINFELDER One Beacon Street, Suite 8100, Boston, MA 02108 p | 617.497.7800 f | 617.498.4630
To answer these questions, this study first synthesizes historic hydrology as a function of climate variables, then tests the durability of the supply against a range of potential future values for these variables.
1.2 EXISTING WATER SUPPLY
The City supplies its residents and businesses with drinking water from six (6) active reservoirs and three (3) water treatment plants, shown in Figure 1 These are all located within the City’s limits, although part of one contributing watershed is located within the Town of Rockport. The water supply system in Gloucester is divided into two systems separated geographically by the Annisquam River, which flows northward through the middle of the City into Ipswich Bay. These two systems are:
A. The East System, shown in Figure 2, located east of the River and includes: o Three active reservoirs – Babson, Goose Cove, and Klondike o Two water treatment plants (WTP) – the Babson WTP and Klondike WTP
B. The West System, shown in Figure 3, located west of the river and includes: o Three active reservoirs – Dykes, Wallace, and Haskell o One emergency reservoir, which is inactive – Fernwood o One water treatment plant – West Gloucester WTP
Although some reservoirs within each system are interconnected (water from one can be transferred to another), the two water systems are not interconnected and generally do not have adequate capacity to meet the annual water consumption needs independently. That is partly due to the small watersheds contributing runoff to each reservoir, as a small watershed can only collect precipitation on the available surface area. It is also due to water quality concerns within certain reservoirs. Notably, either system on its own can support the entire distribution system with sufficient water and pressure on a seasonal basis, although not for an entire year. Two reservoirs – Babson in the East and Dykes in the West - are the main suppliers from their respective systems. Their recharge characteristics and their water quality help the City determine on a seasonal basis when these reservoirs, and hence their systems, are operational. The City typically supplies drinking water in the winter months from the East System and in the summer from the West System. The watershed of Babson Reservoir is more than twice the size of the Dykes watershed; however, it can hold only about one quarter of the volume of Dykes. Additionally, the Babson Reservoir has reduced detention time and increased organics and better ability to recharge in the winter, but not the summer. Dykes has better water quality overall because of the increased detention time, but with a smaller watershed, less ability to recharge.
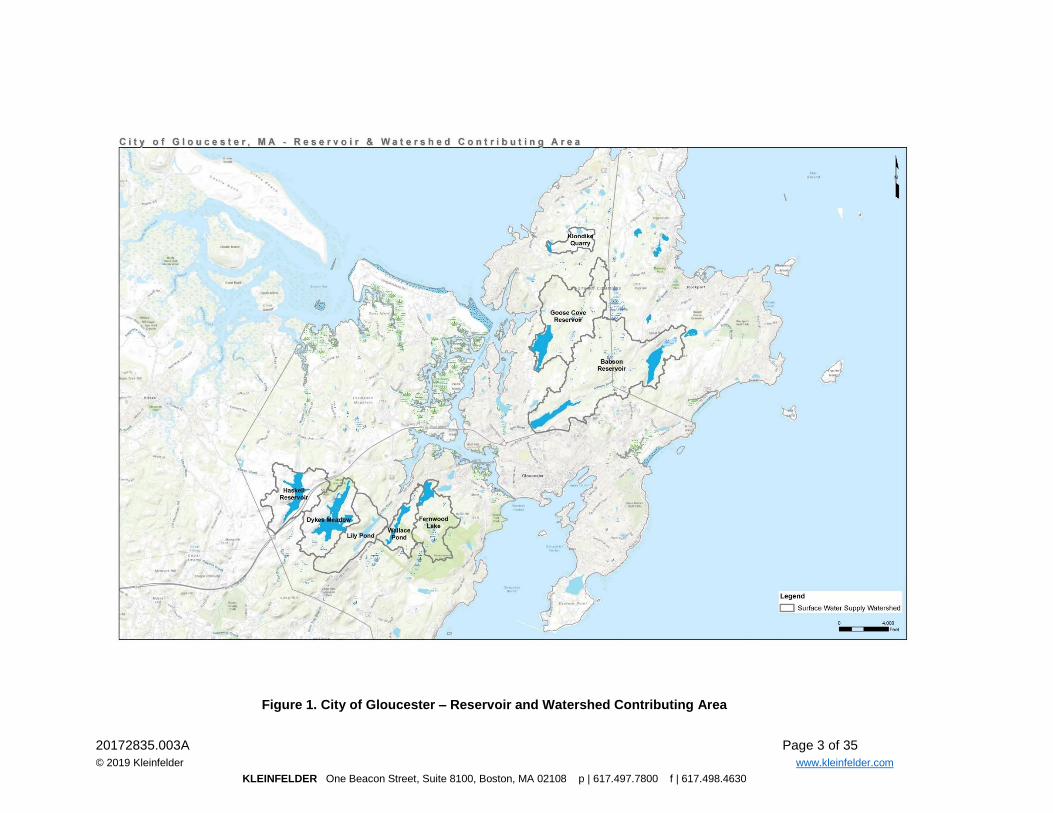
20172835.003A Page 3 of 35
© 2019 Kleinfelder www.kleinfelder.com
KLEINFELDER One Beacon Street, Suite 8100, Boston, MA 02108 p | 617.497.7800 f | 617.498.4630
Figure 1. City of Gloucester – Reservoir and Watershed Contributing Area

20172835.003A
Page 4 of 35
© 2019 Kleinfelder www.kleinfelder.com
KLEINFELDER One Beacon Street, Suite 8100, Boston, MA 02108 p | 617.497.7800 f | 617.498.4630
Figure 2: East Water Supply Systems
Figure 3: West Water Supply System

20172835.003A
Page 5 of 35
© 2019 Kleinfelder www.kleinfelder.com
KLEINFELDER One Beacon Street, Suite 8100, Boston, MA 02108 p | 617.497.7800 f | 617.498.4630
2 INTEGRATED OPERATIONS MODEL DEVELOPMENT
Integrated modeling is a recognized way of recommending refined operations of interconnected water supply systems in New England. Integrated modeling blends existing information and relationships from past studies and data sets on water availability, operational flexibility, infrastructure, and needs into a common experimental platform to better understand and improve operational protocols and capital improvement needs. For the purposes of this study, the integrated model:
• Quantified current water supply adequacy for residential supply (public health), commercial and industrial supply (economic growth and health), and fire suppression (public safety and land preservation),
• Estimated changes in supply reliability based on future climate projections,
• Helped formulate operational revisions (alternative management practices) as necessary and feasible to improve reliability for all needs under future conditions.
The integrated model approach consists of the following steps:
➢ Collect relevant hydrologic data, if available. If not available, collect data to assist with the hydrologic influx estimation: drainage areas, precipitation, temperature, evaporation, etc.
➢ Review the operational data from the City’s reservoirs, including all current permit conditions, operating rules, reservoir bathymetry (storage-area-elevation relationship).
➢ Collect publicly available statewide climate projections for precipitation and temperature through a long-term planning horizon.
➢ Develop an operational/integrated model for the water system using STELLA software, an industry standard for integrated modeling recently used in the Ipswich River Basin (2018 MassDEP Grant) and used in the past to evaluate management options in the Brockton Water Supply System.
➢ Use a mass balance approach to calculate the storage of water in each reservoir.

20172835.003A
Page 6 of 35
© 2019 Kleinfelder www.kleinfelder.com
KLEINFELDER One Beacon Street, Suite 8100, Boston, MA 02108 p | 617.497.7800 f | 617.498.4630
2.1 HYDROLOGIC, OPERATIONAL, AND CLIMATE PROJECTION DATA /INPUTS
Hydrologic Data
Hydrologic or streamflow data is the most important data for a water supply analysis because it quantifies the water available to each reservoir. It is also frequently the scarcest data type for reservoir systems. Streamflow values are typically dependent on the watershed/drainage area contributing to each reservoir and precipitation. Because none of the Gloucester reservoirs have streamflow data available that can be used for this study, alternative hydrology estimations were developed. The Parker River was used as a reference streamflow because of data availability, similarities in land use and topography, and proximity to Gloucester. Although it is a larger watershed, for monthly flows the daily flashiness associated with smaller reservoirs becomes irrelevant and the larger basin can be a good predictor. The methodology for estimating inflows into each reservoir by using Parker River streamflow data is presented in Section 2.2.
Operational Data
Understanding how each reservoir is operating currently helps understand the existing water supply conditions. Operational data for this model included reservoir levels, and withdrawals and transfers from and between the reservoirs. This data was available from the City, either as spreadsheets or reports.
Climate Data
This data includes historical and future climate precipitation and temperature data. Historical precipitation and temperature data were obtained from the National Oceanic and Atmospheric Administration database from the Marblehead and Middleton stations, as these had data two stations. Climate projections data was obtained from the Localized Constructed Analogs (LOCA) website. LOCA was developed at Scripps Institution of Oceanography in La Jolla, California. The LOCA method is a statistical scheme that produces downscaled estimates suitable for hydrological simulations using a multi-scale spatial matching scheme to pick appropriate analog days from observations. There are 32 climate models as well as 4 emissions scenarios to select from. Researchers from the Northeast Climate Science Center at the University of Massachusetts Amherst have supported a subset of these climate models for projections in the northeast United States. Their recommendation has been supported by the state Executive Office of Energy and environmental Affairs. The researchers suggest submitting data requests for the medium (RCP 4.5) and high (RCP 8.5) emission scenarios. In each scenario, they recommend including 14 climate models.

20172835.003A
Page 7 of 35
© 2019 Kleinfelder www.kleinfelder.com
KLEINFELDER One Beacon Street, Suite 8100, Boston, MA 02108 p | 617.497.7800 f | 617.498.4630
These models are: BCC-CSM1-1, CanESM2, CESM1-BGC, CESM1-CAM5, CMCC-CMS, EC-EARTH, GFDL-ESM2M, GISS-E2-R, HadGEM2-CC, HadGEM2-ES, INMCM4, IPSL-CM5A-LR, MPI-ESM-LR, and MPI-ESM-MR. Due to the spatial rounding of the Basin Specific domain, the city of Gloucester fell outside of the watershed’s bounds. shows the four 1/16th degree grids used for the requests in this projection. Note that LOCA scientists suggest selecting and submitting data requests for between four and nine different rectangles to increase confidence in the projections. For this study, the planning horizons chosen with input from stakeholders were 2050 and 2070. To analyze a reliable range of projection data, 30-year ranges extending 10 years in the past and 20 years in the future were used for each. Thus, for 2050, the date entries for this request were January 2040 through December 2069, and for 2070 were January 2060 through December 2089. The ranges may vary in future requests, but a wide sample size is important to ensure that the observed trends are as reliable as possible. Table 1 shows the data we used for this study, the source, and a brief description of the available data and how it was manipulated for the model.
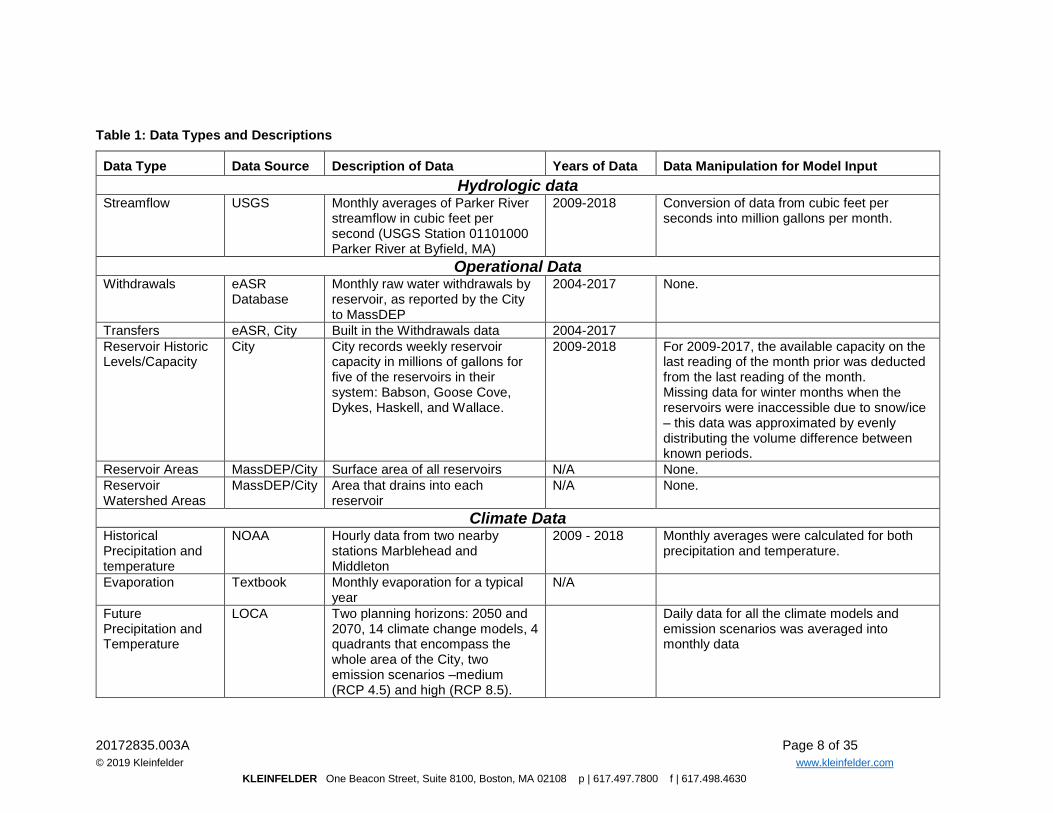
20172835.003A Page 8 of 35
© 2019 Kleinfelder www.kleinfelder.com
KLEINFELDER One Beacon Street, Suite 8100, Boston, MA 02108 p | 617.497.7800 f | 617.498.4630
Table 1: Data Types and Descriptions
Data Type Data Source Description of Data Years of Data Data Manipulation for Model Input
Hydrologic data Streamflow USGS
Monthly averages of Parker River streamflow in cubic feet per second (USGS Station 01101000 Parker River at Byfield, MA)
2009-2018 Conversion of data from cubic feet per seconds into million gallons per month.
Operational Data Withdrawals eASR
Database Monthly raw water withdrawals by reservoir, as reported by the City to MassDEP
2004-2017 None.
Transfers eASR, City Built in the Withdrawals data 2004-2017
Reservoir Historic Levels/Capacity
City City records weekly reservoir capacity in millions of gallons for five of the reservoirs in their system: Babson, Goose Cove, Dykes, Haskell, and Wallace.
2009-2018 For 2009-2017, the available capacity on the last reading of the month prior was deducted from the last reading of the month. Missing data for winter months when the reservoirs were inaccessible due to snow/ice – this data was approximated by evenly distributing the volume difference between known periods.
Reservoir Areas MassDEP/City Surface area of all reservoirs N/A None.
Reservoir Watershed Areas
MassDEP/City Area that drains into each reservoir
N/A None.
Climate Data Historical Precipitation and temperature
NOAA Hourly data from two nearby stations Marblehead and Middleton
2009 - 2018 Monthly averages were calculated for both precipitation and temperature.
Evaporation Textbook Monthly evaporation for a typical year
N/A
Future Precipitation and Temperature
LOCA Two planning horizons: 2050 and 2070, 14 climate change models, 4 quadrants that encompass the whole area of the City, two emission scenarios –medium (RCP 4.5) and high (RCP 8.5).
Daily data for all the climate models and emission scenarios was averaged into monthly data

20172835.003A
Page 9 of 35
© 2019 Kleinfelder www.kleinfelder.com
KLEINFELDER One Beacon Street, Suite 8100, Boston, MA 02108 p | 617.497.7800 f | 617.498.4630
2.2 HYDROLOGY DEVELOPMENT
As hydrologic data was not available for any of the streams that are the main contributors to the storage in each of the seven reservoirs, alternative hydrologic data and estimations were considered and used in this study:
• The Parker River streamflow historical data values were adjusted for differences between watershed area and used as input into each of the reservoirs; a regression model was developed to calculate the relationship between streamflow values and temperature and precipitation for Parker River under historical conditions.
• A hydrologic model, available from the University of Amherst, provided us with Parker River streamflow projections.
2.2.1 Parker River Streamflow
One of the more common ways in water resources and integrated modeling to account for lack of hydrologic data is to find a reference streamflow, validate and calibrate the data with any available information, and use the calibrated streamflow as a model input. For this study, the reference streamflow is Parker River. We selected this river as a reference streamflow for this study because:
• It is located near Gloucester, and close to the coast.
• Streamflow data is available for the historical period of interest (2009 to 2017).
• It has a smaller watershed area than other rivers nearby – this was important because the watershed areas of reservoirs in Gloucester are small and we needed a way to account for the size of the watersheds. As we are looking for monthly streamflow averages, differences in watershed size are not as critical as they would be if we were looking for daily flows.
Because one of the questions this study is looking to answer is related to future risk to the water supply and because future climate projections are available for precipitation and temperature, we needed a way to assess the relationship, if any, between streamflow and precipitation and temperature. This was achieved through a regression model.
2.2.2 Regression Model
The regression model approach for this study calculates the Parker River streamflow using historical precipitation and temperature data. We estimated the streamflow by including three major components:
• precipitation from this month – P(t), which drives the low flow,

20172835.003A
Page 10 of 35
© 2019 Kleinfelder www.kleinfelder.com
KLEINFELDER One Beacon Street, Suite 8100, Boston, MA 02108 p | 617.497.7800 f | 617.498.4630
• precipitation from previous month (recharge/groundwater baseflow) – P(t-1), which drives the high flow, and
• temperature – T(t), which has a very limited impact on seasonal fluctuations. The following equation was used in the regression model:
𝑬𝒔𝒕𝒊𝒎𝒂𝒕𝒆𝒅 𝑺𝒕𝒓𝒆𝒂𝒎𝒇𝒍𝒐𝒘 = 𝑨 ∗ 𝑾 ∗ 𝑷(𝒕)𝑩 + 𝑪 ∗ 𝑾 ∗ 𝑷(𝒕 − 𝟏)𝑫 + 𝑬 ∗ 𝑻(𝒕)𝑭 Where: 𝐴, 𝐵, 𝐶, 𝐷, 𝐸, 𝐹, 𝑊 = 𝑟𝑒𝑔𝑟𝑒𝑠𝑠𝑖𝑜𝑛 𝑐𝑜𝑒𝑓𝑓𝑖𝑐𝑖𝑒𝑛𝑡𝑠 𝑓𝑟𝑜𝑚 𝐸𝑥𝑐𝑒𝑙 𝑆𝑜𝑙𝑣𝑒𝑟 𝑠𝑜𝑙𝑢𝑡𝑖𝑜𝑛 𝑃(𝑡) = 𝑝𝑟𝑒𝑐𝑖𝑝𝑖𝑡𝑖𝑜𝑛 𝑎𝑡 𝑡𝑖𝑚𝑒 𝑡
𝑃(𝑡 − 1) = 𝑝𝑟𝑒𝑐𝑖𝑝𝑖𝑡𝑎𝑡𝑖𝑜𝑛 𝑎𝑡 𝑡𝑖𝑚𝑒 𝑡 𝑚𝑖𝑛𝑢𝑠 𝑜𝑛𝑒 𝑇(𝑡) = 𝑡𝑒𝑚𝑝𝑒𝑟𝑎𝑡𝑢𝑟𝑒 𝑎𝑡 𝑡𝑖𝑚𝑒 𝑡 The estimated streamflow monthly values using the regression model, as shown in Figure 4, are overestimated for high flows and underestimated for low flows. These values also follow the seasonal trends of high and low flows, with similar periods of low and high flows. This initial validation of the regression model was considered adequate and representative of the historical trend. Further validation of the data is presented in Section 2.3.
Figure 4: Parker River Streamflow Comparison Between Historical and Regression Model Data
The regression model approach will allow us to use precipitation and temperature
projections to understand the future risks to the City’s water supply.

20172835.003A
Page 11 of 35
© 2019 Kleinfelder www.kleinfelder.com
KLEINFELDER One Beacon Street, Suite 8100, Boston, MA 02108 p | 617.497.7800 f | 617.498.4630
2.2.3 Hydrologic Model
The University of Massachusetts Amherst (UMass) has also developed streamflow projections for rivers and streams within the state by using watershed models and the same statewide climate projections used in this study. Comparing the streamflow values from the regression model with the values from the UMass hydrologic model, as shown in Figure 5, provides us with a useful range of estimated flows in the Parker River in the past 9 years. Our estimations of the Parker River streamflow are more conservative than the actual streamflow, while the estimations from UMass are less conservative. Because we want to account for future droughts – both in magnitude and severity – a more conservative streamflow estimation is more adequate for our evaluation. However, we will consider both estimates in the evaluation.
Figure 5: Parker River Streamflow Comparison
2.3 HYDROLOGY VALIDATION
To validate the selection of Parker River, we used a mass balance approach to calculate reservoir levels, on a monthly basis, for each of the five reservoirs for which we had historical data. We did so using the following equations: 𝑹𝒆𝒔𝒆𝒓𝒗𝒐𝒊𝒓 𝑳𝒆𝒗𝒆𝒍 = 𝑰𝒏𝒊𝒕𝒊𝒂𝒍 𝑹𝒆𝒔𝒆𝒓𝒗𝒐𝒊𝒓 𝑳𝒆𝒗𝒆𝒍 + 𝑪𝒉𝒂𝒏𝒈𝒆 𝒊𝒏 𝑹𝒆𝒔𝒆𝒓𝒗𝒐𝒊𝒓 𝑳𝒆𝒗𝒆𝒍 𝑪𝒉𝒂𝒏𝒈𝒆 𝒊𝒏 𝑹𝒆𝒔𝒆𝒓𝒗𝒐𝒊𝒓 𝑳𝒆𝒗𝒆𝒍 = 𝑰𝒏𝒑𝒖𝒕𝒔 − 𝑶𝒖𝒕𝒑𝒖𝒕𝒔 𝑰𝒏𝒑𝒖𝒕𝒔 = 𝑪𝒂𝒍𝒊𝒃𝒓𝒂𝒕𝒆𝒅 𝑺𝒕𝒓𝒆𝒂𝒎𝒇𝒍𝒐𝒘 + 𝑫𝒊𝒓𝒆𝒄𝒕 𝑷𝒓𝒆𝒄𝒊𝒑𝒊𝒕𝒂𝒕𝒊𝒐𝒏 + 𝑻𝒓𝒂𝒏𝒔𝒇𝒆𝒓𝒔 𝑰𝑵 𝑶𝒖𝒕𝒑𝒖𝒕𝒔 = 𝑻𝒓𝒂𝒏𝒔𝒇𝒆𝒓𝒔 𝑶𝑼𝑻 + 𝑾𝒊𝒕𝒉𝒅𝒓𝒂𝒘𝒂𝒍𝒔 + 𝑺𝒑𝒊𝒍𝒍 + 𝑬𝒗𝒂𝒑𝒐𝒓𝒂𝒕𝒊𝒐𝒏

20172835.003A
Page 12 of 35
© 2019 Kleinfelder www.kleinfelder.com
KLEINFELDER One Beacon Street, Suite 8100, Boston, MA 02108 p | 617.497.7800 f | 617.498.4630
The calibrated streamflow was calculated for each reservoir by scaling it to the watershed area of the Parker River watershed and using a calibrated adjustment factor, which ranged from 1.2 to 1.8, to calibrate the results to the historical reservoir levels. The adjustment factor is a common procedure when scaling a large reservoir down to a small one, as a higher percentage of precipitation can be expected to make it to the river in a smaller watershed. The hydrology developed with the regression model was also further validated by using the regression model streamflow as the input for the mass balance approach. For this study, we present all the results graphically as:
• Water supply as volume of water available in the reservoirs in million gallons (MG) per month, or
• Percent of water available in the reservoirs in any given month out of the total possible supply, which is based on maximum available reservoir capacity. This metric can visually represent the percent full or empty of each reservoir and also, for the whole system combined. Values lower than 50% are considered a risk factor and times when the total available water supply goes below 50% of the total potential water supplies are considered times of system vulnerability.
We focused on the total supply of the City, and less on the individual resiliency of any reservoir because of the redundancies in the Gloucester’s water supply system. To show the trends in reservoir levels over time, this study also focused on displaying annual trends: how fast the reservoir levels go down or up, as this is an indication of the resiliency of any reservoir. This was achieved by using box and whiskers plots that show reservoir levels distribution for each month. The components of this type of graph are detailed as follows and shown in Figure 6:
• The whiskers, shown as a vertical line, represent the minimum and maximum values observed in that month.
• The box represents the 25th and 75th percentile of values.
• The middle line of the box represents the median, which is the middle value.
• The x in the box represents the mean, or the average value of the data set.
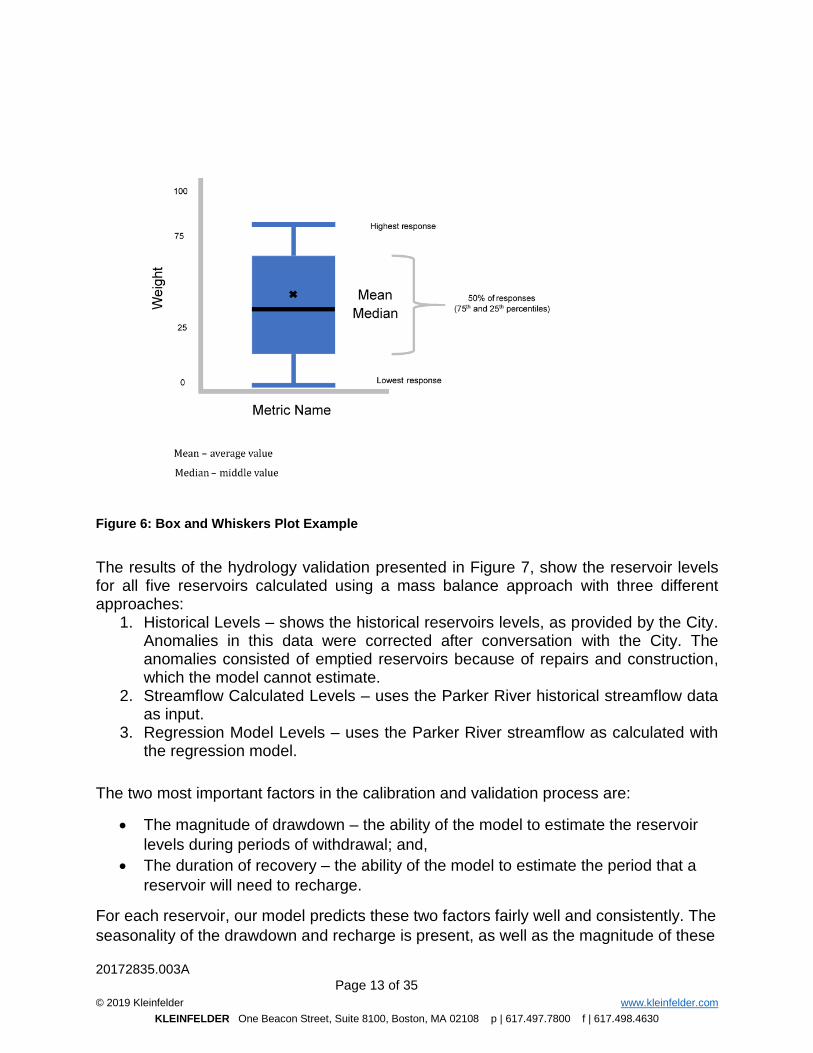
20172835.003A
Page 13 of 35
© 2019 Kleinfelder www.kleinfelder.com
KLEINFELDER One Beacon Street, Suite 8100, Boston, MA 02108 p | 617.497.7800 f | 617.498.4630
Figure 6: Box and Whiskers Plot Example
The results of the hydrology validation presented in Figure 7, show the reservoir levels for all five reservoirs calculated using a mass balance approach with three different approaches:
1. Historical Levels – shows the historical reservoirs levels, as provided by the City. Anomalies in this data were corrected after conversation with the City. The anomalies consisted of emptied reservoirs because of repairs and construction, which the model cannot estimate.
2. Streamflow Calculated Levels – uses the Parker River historical streamflow data as input.
3. Regression Model Levels – uses the Parker River streamflow as calculated with the regression model.
The two most important factors in the calibration and validation process are:
• The magnitude of drawdown – the ability of the model to estimate the reservoir
levels during periods of withdrawal; and,
• The duration of recovery – the ability of the model to estimate the period that a
reservoir will need to recharge.
For each reservoir, our model predicts these two factors fairly well and consistently. The
seasonality of the drawdown and recharge is present, as well as the magnitude of these

20172835.003A
Page 14 of 35
© 2019 Kleinfelder www.kleinfelder.com
KLEINFELDER One Beacon Street, Suite 8100, Boston, MA 02108 p | 617.497.7800 f | 617.498.4630
periods. Some reservoirs are modeled more accurately than others and this is mainly
due to the missing data points, uncertain transfer operations in some cases, and
periodic construction that shifted operating rules.
Figure 7: Reservoir Levels Validation for All Five Reservoirs
To correct for this lack of data for specific reservoirs, and the built-in-the model-
assumptions, we also looked at the East versus West System supply and the City’s total
supply, as shown in Figure 8 and Figure 9. Understanding which system is more
stressed, and when, is valuable information for the City. It factors into what operational
changes are needed for the resiliency of their water supply.

20172835.003A
Page 15 of 35
© 2019 Kleinfelder www.kleinfelder.com
KLEINFELDER One Beacon Street, Suite 8100, Boston, MA 02108 p | 617.497.7800 f | 617.498.4630
Figure 8: East and West Systems – Reservoir Level Validation
Figure 9: Total Supply System – Reservoir Levels Validation

20172835.003A
Page 16 of 35
© 2019 Kleinfelder www.kleinfelder.com
KLEINFELDER One Beacon Street, Suite 8100, Boston, MA 02108 p | 617.497.7800 f | 617.498.4630
2.3.1 Hydrology and Future Climate Projections
The most risk to the water supply system in the future will come from periods of drought, when the reservoirs will not recharge as fast or as much as they do currently. The regression model was developed to use only precipitation and temperature data, so we can use projections of these two data sets to estimate future streamflow. Using historical precipitation and temperature data from known periods of drought as inputs to the regression model, we can estimate the reservoir levels during those historical droughts. Comparing the reservoir levels during known historical droughts and future climate scenarios allows us to understand the future risks. For this comparison, the following scenarios were evaluated:
1. Averaged Climate Projections Climate models have some inherent uncertainty. Standard practice is to try to bound this uncertainty by obtaining temperature and precipitation projections from different (1) weather stations, (2) climate models, (3) emissions scenarios, and (4) years. The daily temperature and precipitation data from the 14 climate models, two emissions scenarios (moderate and high), and four weather stations was averaged into monthly data points for the two 30-year long planning horizons (2050 and 2070) chosen by stakeholders for this study. Although the uncertainty in climate modeling is an important factor to consider and account for, the extremes of climate projections are just as important. The averaged climate projections scenario represents a typical stable representative year. Increased temperatures combined with prolonged periods of reduced precipitation translates into periods of drought when reservoirs cannot recharge, while the demand for water remains constant (or increases). This puts communities and water suppliers at risk for not being able to provide their communities with sufficient volumes of water. Considering the recent 2016 drought, the stakeholders wanted to evaluate the future risks, if any, of future droughts.
2. Worst-Case Climate Projections The worst-case scenario uses the same climate projections data as the averaged projections scenario. Instead of averaging the data, we compiled the lowest precipitation data (10th percentile) and the highest temperature data (90th percentile).
3. Droughts of Record Several important historical droughts were included in this evaluation:
• 1960’s drought, which is considered the drought of record
• 1980’s drought

20172835.003A
Page 17 of 35
© 2019 Kleinfelder www.kleinfelder.com
KLEINFELDER One Beacon Street, Suite 8100, Boston, MA 02108 p | 617.497.7800 f | 617.498.4630
• 2001-2002 drought
• 2016 drought, which is the most recent one The results of the comparison are presented in Figure 10. The estimated streamflow values using the regression model and worst-case climate projections are more conservative that any of the historical droughts. By using the worst-case projections in the integrated model, we can bound the risk to the water supply, as a worst-case scenario, without the need to include droughts. The worst-case scenario, as modeled in this study, represents 30 years of continuous and severe droughts.
Figure 10: Comparison of Streamflow Projections - Historical Droughts and Future Climate
The same conclusion can be drawn from looking at the water supply and the effects of droughts on the reservoir levels, as shown in Figure 11. The total supply under averaged climate projections is more resilient than under worst-case climate projections.

20172835.003A Page 18 of 35
© 2019 Kleinfelder www.kleinfelder.com
KLEINFELDER One Beacon Street, Suite 8100, Boston, MA 02108 p | 617.497.7800 f | 617.498.4630
Figure 11: Comparison of Total Reservoir Levels – Historical Droughts and Future Climate Projections
1964-1967 1980-1982
2001-2002
2016

20172835.003A
Page 19 of 35
© 2019 Kleinfelder www.kleinfelder.com
KLEINFELDER One Beacon Street, Suite 8100, Boston, MA 02108 p | 617.497.7800 f | 617.498.4630
2.4 STELLA
The City needed a tool that would help them understand existing and future water supply risks, if any, and test management alternatives that could help mitigate those risks. The tool used in this study is the STELLA software package, distributed by ISEE Systems. STELLA stands for “Systems Thinking, Experimental Learning Laboratory with Animation,” and is a dynamic, visual platform for simulating complex and interconnected systems over time. It has been used across the United States (including New England) for water resource planning, river basin analysis, integrated planning, and urban planning. The goal of the software is to integrate data from other sources with enough resolution to characterize planning-level dynamics and risks, and to track the impacts of management decisions throughout the interconnected systems. In this way, it is frequently used to screen systems for specific (localized) vulnerabilities and to test dozens or hundreds of ways of tuning operations to mitigate risks or address specific weaknesses.
Mathematically, STELLA functions much like a spreadsheet in that the user is provided with a blank workspace in which to draw a system and define its data and functionality from scratch. The only pre-built equation in the model is the continuity equation for storage elements, whereby a change in storage is automatically computed as the difference between inflows and outflows in each time step.
STELLA includes four building blocks, which are commonly used in environmental, urban, and economic systems:
• Flows: Vector elements direct flow of any defined variable (water, people, money) from one point to another within the system.
• Stocks: Storage elements (reservoirs, bank accounts, etc.) accumulate inflows and are depleted by defined outflows.
• Converters: Originally named for their utility in converting units, these can best be described as either cells or entire columns in a spreadsheet. They may contain information in one of four forms:
o Raw data o Mathematical equation using numbers or other model variables o Logical expressions (min/max, if-then-else, etc.) o Time series of data (analogous to a column in a spreadsheet).
• Connectors: vector elements that link the previous three elements together.
These four basic elements are used to visually represent a system, connect elements together either to represent physical connections or to enable a logical dependency, and track variables as they move/flow through the system or systems. Examples of the visual

20172835.003A
Page 20 of 35
© 2019 Kleinfelder www.kleinfelder.com
KLEINFELDER One Beacon Street, Suite 8100, Boston, MA 02108 p | 617.497.7800 f | 617.498.4630
nature of STELLA and these elements are included in subsequent sections below. Note that the single line (usually red) arrows do not represent flow, but rather, mathematical or logical dependency. Flow in a STELLA model is represented by double-line arrows. Stocks are represented as rectangles with flows entering and leaving, and converters are small circles that can be used anywhere to inject or modify information in the model. STELLA also contains a user interface which allows the user to adjust variables within the model to test alternative rules, conditions, or assumptions clearly and rapidly. The City’s water supply was built in STELLA to include the seven reservoirs, their interconnections, known operational rules, and the data detailed in Section 2.1. An example STELLA structure for one of the reservoirs in the system is shown in Figure 12.
Figure 12: Example STELLA Construct of a Reservoir

20172835.003A
Page 21 of 35
© 2019 Kleinfelder www.kleinfelder.com
KLEINFELDER One Beacon Street, Suite 8100, Boston, MA 02108 p | 617.497.7800 f | 617.498.4630
3 MODEL RESULTS
Using the STELLA model, we developed several scenarios, which are summarized in
Table 2 and described in greater detail in Sections 0 through 3.3, to help answer the questions presented at the beginning of this report. The Current Conditions scenario is simulating the existing climate and reservoir conditions in Gloucester. The Future Conditions Scenarios help answer questions about the risk and resilience of the water supply by accounting for the effects of climate change. Experimental Management Scenarios help identify possible solutions to the risks identified in the future condition scenarios.
Table 2: Modeled Scenario Names and Descriptions
Scenario Name Scenario Description
Current Conditions
Current Conditions Existing conditions based on inflow, withdrawals, and
operational data.
Future Conditions Scenarios
Average Projections Future conditions – averaging 30 years of precipitation
and temperature data from 14 climate models, two
emission scenarios, and four weather stations for each of
the two planning horizons: 2050 and 2070.
Worst-Case Projections Future conditions – averaging the 10th percentile
precipitation data and the 90th percentile temperature
data between the 14 climate models, two emission
scenarios, and four weather stations for each of the two
planning scenarios: 2050 and 2070.
Parker River Streamflow
Projections
Future conditions – averaging the 10th percentile of
streamflow data between the 13 climate models.
Experimental Management Scenarios
Conservation/Demand
Sensitivity
Increasing and decreasing historical average demand -
10% to +10% in increments of 5%.
Fernwood Diversions Including the emergency Fernwood Reservoir into the
reservoirs’ operations.

20172835.003A
Page 22 of 35
© 2019 Kleinfelder www.kleinfelder.com
KLEINFELDER One Beacon Street, Suite 8100, Boston, MA 02108 p | 617.497.7800 f | 617.498.4630
Scenario Name Scenario Description
Operational Flexibility Withdrawals from the system that is fuller in any given
month, regardless of season.
3.1 CURRENT CONDITIONS SCENARIO
The current conditions scenario represents the known estimated inflow, withdrawals, transfers, and operational conditions from data and information available to us, as detailed in Section 2.1. This scenario uses historical data to identify any vulnerabilities in the City’s water supply system. Historical reservoir levels were available only for five out of the seven total reservoirs, therefore the current conditions scenario validation includes total water supply from these five reservoirs: Babson, Goose Cove, Dykes, Wallace, and Haskell. This scenario also served as a validation step for the model and for the following assumptions made in the development of the model, with input from the City and stakeholders:
• Water is withdrawn from the East System during the winter months (December
through May) and from the West System during summer months (June through
November). Note, withdrawals from the systems do not historically match this
assumed seasonality because of construction and repair work or water quality
issues.
• If there is not enough water in the East System during the winter, withdraw the
balance from the West System first, and then Klondike.
• If there is not enough water in the West System during the summer, withdraw the
balance from the East System first, and then Klondike.
• Klondike is used as a last resort. Historically, water is taken out of Klondike
during late summer months.
• Water in the East System is blended in the pipe that connects the Babson and
Goose Cove reservoir. This is because of water quality issues in the Babson
Reservoir. We assumed a blending ratio of 50:50 (50% of the water needed
comes from Babson and 50% comes from Goose Cove) and that the transfer of
water is from Goose Cove to the Babson Reservoir.
• All the water that spills from the Wallace Reservoir is transferred to Dykes.
• Fernwood is off-line.
• Historical demand was averaged by month.

20172835.003A
Page 23 of 35
© 2019 Kleinfelder www.kleinfelder.com
KLEINFELDER One Beacon Street, Suite 8100, Boston, MA 02108 p | 617.497.7800 f | 617.498.4630
When compared with the known historical reservoir levels, the modeled reservoir levels are similar and follow the same drawdown and refill patterns every year, as shown in Figure 14. The model estimates that under existing climate and operational conditions, the water supply in Gloucester is adequate in both the East and the West Systems, as shown in Figure 13 and that reliance on the Klondike Reservoir is not needed. Historically, this has not been the case, as Klondike Reservoir has been used as a supply during the late summer months.
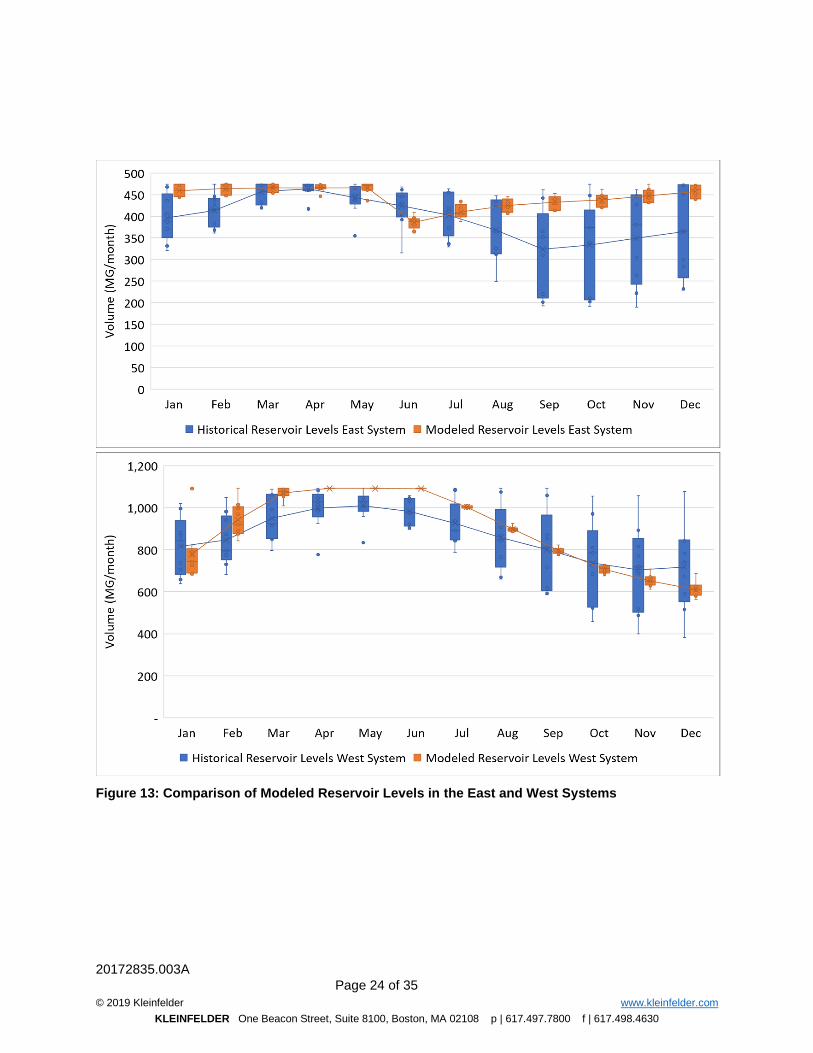
20172835.003A
Page 24 of 35
© 2019 Kleinfelder www.kleinfelder.com
KLEINFELDER One Beacon Street, Suite 8100, Boston, MA 02108 p | 617.497.7800 f | 617.498.4630
Figure 13: Comparison of Modeled Reservoir Levels in the East and West Systems

20172835.003A
Page 25 of 35
© 2019 Kleinfelder www.kleinfelder.com
KLEINFELDER One Beacon Street, Suite 8100, Boston, MA 02108 p | 617.497.7800 f | 617.498.4630
Figure 14: Comparison of Modeled Reservoir Levels for the Whole System
3.2 FUTURE CONDITIONS SCENARIOS
As the water supply system in the City is resilient and shows no vulnerabilities, from a volume of available water perspective, under current climate conditions, we wanted to evaluate the impact of future climate conditions on the total supply availability. The impact of future climate was evaluated through three scenarios:
• Averaged precipitation and temperature projections
• Worst-case precipitation and temperature projections
• Parker River streamflow projections
These scenarios help evaluate the impacts of climate change in three ways and bound the uncertainty inherent in climate models and projections.
3.2.1 Averaged Precipitation and Temperature Projections Scenario
The daily temperature and precipitation data from the 14 climate models, two emissions scenarios (moderate and high), and four weather stations was averaged into monthly data points for the two 30-year long planning horizons (2050 and 2070) chosen by stakeholders for this study.
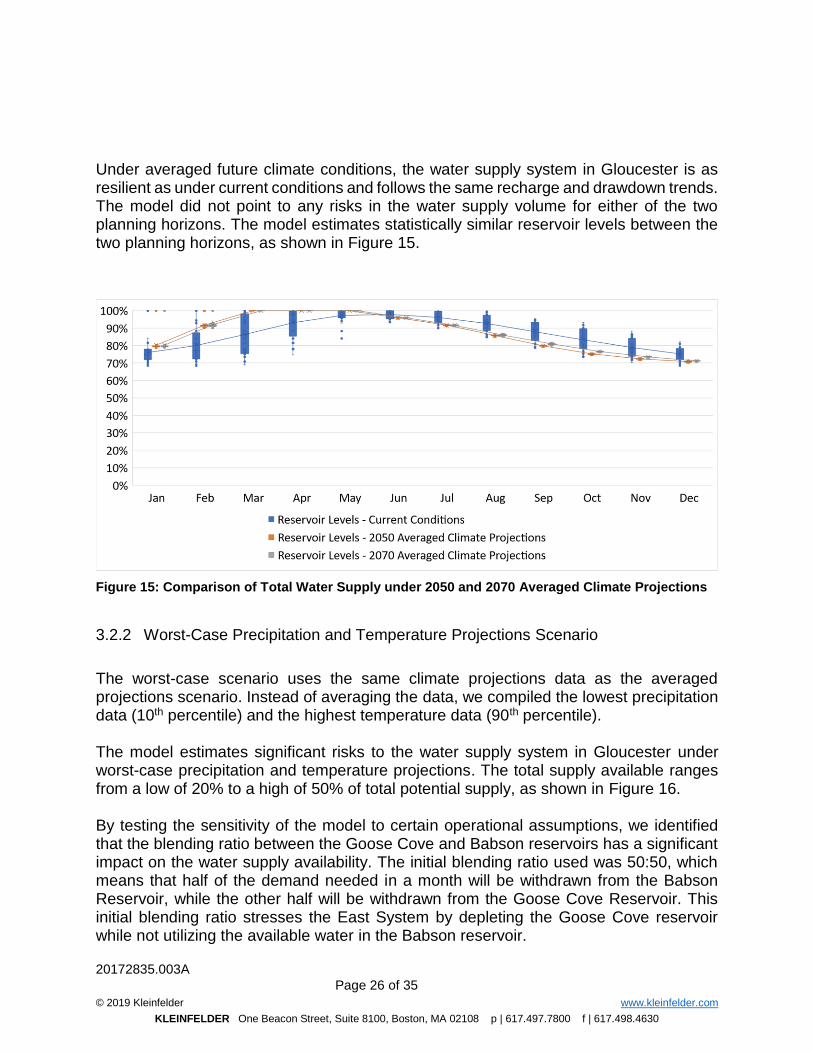
20172835.003A
Page 26 of 35
© 2019 Kleinfelder www.kleinfelder.com
KLEINFELDER One Beacon Street, Suite 8100, Boston, MA 02108 p | 617.497.7800 f | 617.498.4630
Under averaged future climate conditions, the water supply system in Gloucester is as resilient as under current conditions and follows the same recharge and drawdown trends. The model did not point to any risks in the water supply volume for either of the two planning horizons. The model estimates statistically similar reservoir levels between the two planning horizons, as shown in Figure 15.
Figure 15: Comparison of Total Water Supply under 2050 and 2070 Averaged Climate Projections
3.2.2 Worst-Case Precipitation and Temperature Projections Scenario
The worst-case scenario uses the same climate projections data as the averaged projections scenario. Instead of averaging the data, we compiled the lowest precipitation data (10th percentile) and the highest temperature data (90th percentile). The model estimates significant risks to the water supply system in Gloucester under worst-case precipitation and temperature projections. The total supply available ranges from a low of 20% to a high of 50% of total potential supply, as shown in Figure 16. By testing the sensitivity of the model to certain operational assumptions, we identified that the blending ratio between the Goose Cove and Babson reservoirs has a significant impact on the water supply availability. The initial blending ratio used was 50:50, which means that half of the demand needed in a month will be withdrawn from the Babson Reservoir, while the other half will be withdrawn from the Goose Cove Reservoir. This initial blending ratio stresses the East System by depleting the Goose Cove reservoir while not utilizing the available water in the Babson reservoir.
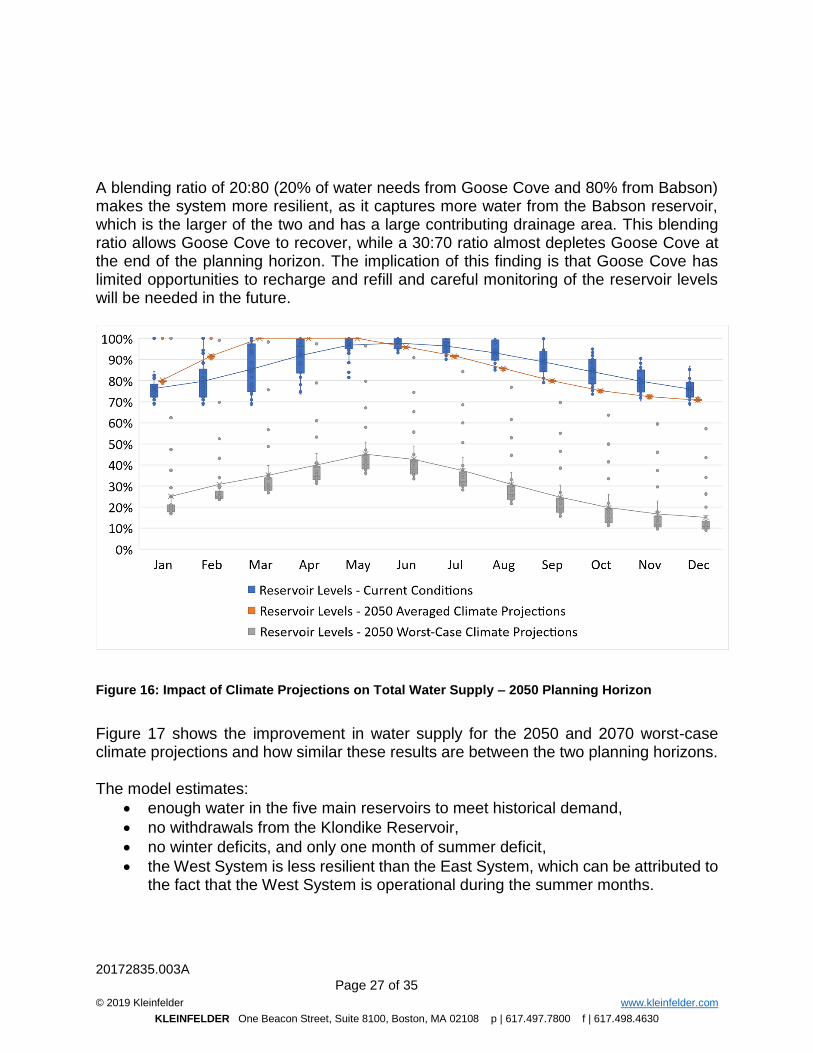
20172835.003A
Page 27 of 35
© 2019 Kleinfelder www.kleinfelder.com
KLEINFELDER One Beacon Street, Suite 8100, Boston, MA 02108 p | 617.497.7800 f | 617.498.4630
A blending ratio of 20:80 (20% of water needs from Goose Cove and 80% from Babson) makes the system more resilient, as it captures more water from the Babson reservoir, which is the larger of the two and has a large contributing drainage area. This blending ratio allows Goose Cove to recover, while a 30:70 ratio almost depletes Goose Cove at the end of the planning horizon. The implication of this finding is that Goose Cove has limited opportunities to recharge and refill and careful monitoring of the reservoir levels will be needed in the future.
Figure 16: Impact of Climate Projections on Total Water Supply – 2050 Planning Horizon
Figure 17 shows the improvement in water supply for the 2050 and 2070 worst-case climate projections and how similar these results are between the two planning horizons. The model estimates:
• enough water in the five main reservoirs to meet historical demand,
• no withdrawals from the Klondike Reservoir,
• no winter deficits, and only one month of summer deficit,
• the West System is less resilient than the East System, which can be attributed to the fact that the West System is operational during the summer months.
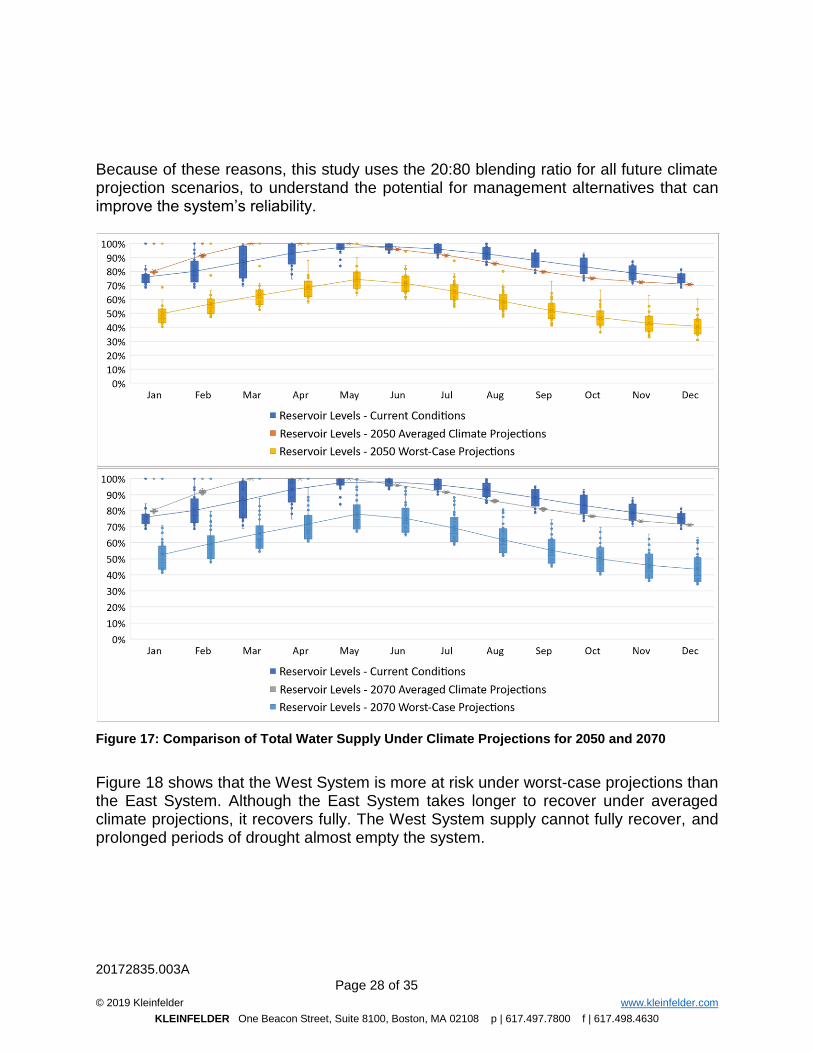
20172835.003A
Page 28 of 35
© 2019 Kleinfelder www.kleinfelder.com
KLEINFELDER One Beacon Street, Suite 8100, Boston, MA 02108 p | 617.497.7800 f | 617.498.4630
Because of these reasons, this study uses the 20:80 blending ratio for all future climate projection scenarios, to understand the potential for management alternatives that can improve the system’s reliability.
Figure 17: Comparison of Total Water Supply Under Climate Projections for 2050 and 2070
Figure 18 shows that the West System is more at risk under worst-case projections than the East System. Although the East System takes longer to recover under averaged climate projections, it recovers fully. The West System supply cannot fully recover, and prolonged periods of drought almost empty the system.

20172835.003A
Page 29 of 35
© 2019 Kleinfelder www.kleinfelder.com
KLEINFELDER One Beacon Street, Suite 8100, Boston, MA 02108 p | 617.497.7800 f | 617.498.4630
Figure 18: East vs West System
3.2.3 Parker River Streamflow Projections
The availability of streamflow projections for Parker River, as discussed in Section 2.2.3,
warranted an evaluation of water supply through the model. A worst-case scenario was
developed by extracting the lowest streamflow values (the 10th percentile). As expected,
and as shown in Figure 19, the water supply is more reliable than the water supply
estimated using our streamflow estimation.

20172835.003A
Page 30 of 35
© 2019 Kleinfelder www.kleinfelder.com
KLEINFELDER One Beacon Street, Suite 8100, Boston, MA 02108 p | 617.497.7800 f | 617.498.4630
Figure 19: Total Water Supply Comparison Using UMass Streamflow Projections and Worst-Case
Porjections
3.3 POTENTIAL MANAGEMENT SCENARIOS FOR FUTURE WORST-CASE
CONDITIONS
3.3.1 Conservation/Demand Sensitivity
Communities currently impose water restrictions on residents even under current climate conditions. These are typically aimed at lawn watering during the summer months and have proven successful. Predictions for the future in Gloucester range from potential population increases and decreases, and more droughts. From a water resources perspective, this translates into increased or decreased demand, both of which can be achieved through management alternatives.
Population projections for Gloucester by MAPC and UMass Donahue suggest a population decline in the next few decades. Another potential management alternative in years of drought is water conservation. Gloucester already has a lower gallon per capita rate (about 55 GDP) than the average Massachusetts rate of 65 GPD.
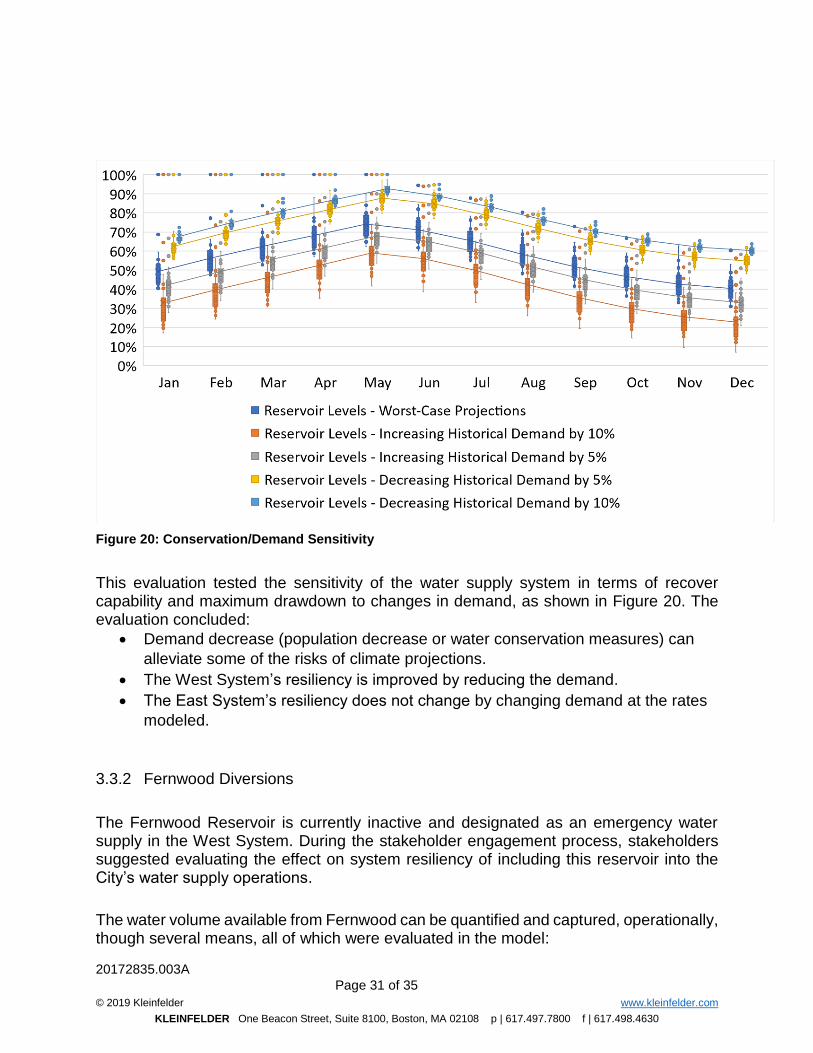
20172835.003A
Page 31 of 35
© 2019 Kleinfelder www.kleinfelder.com
KLEINFELDER One Beacon Street, Suite 8100, Boston, MA 02108 p | 617.497.7800 f | 617.498.4630
Figure 20: Conservation/Demand Sensitivity
This evaluation tested the sensitivity of the water supply system in terms of recover capability and maximum drawdown to changes in demand, as shown in Figure 20. The evaluation concluded:
• Demand decrease (population decrease or water conservation measures) can
alleviate some of the risks of climate projections.
• The West System’s resiliency is improved by reducing the demand.
• The East System’s resiliency does not change by changing demand at the rates
modeled.
3.3.2 Fernwood Diversions
The Fernwood Reservoir is currently inactive and designated as an emergency water supply in the West System. During the stakeholder engagement process, stakeholders suggested evaluating the effect on system resiliency of including this reservoir into the City’s water supply operations.
The water volume available from Fernwood can be quantified and captured, operationally, though several means, all of which were evaluated in the model:

20172835.003A
Page 32 of 35
© 2019 Kleinfelder www.kleinfelder.com
KLEINFELDER One Beacon Street, Suite 8100, Boston, MA 02108 p | 617.497.7800 f | 617.498.4630
• Activating the reservoir, which means it will no longer function as an emergency-only supply, but will contribute, as needed, to the overall supply in the West System.
• Capturing the Fernwood Reservoir spill and diverting it into the Wallace reservoir.
• Diverting half of the inflow into the Fernwood reservoir directly into the Wallace reservoir. Currently, two streams feed into Fernwood and because of the proximity of the two reservoirs, one of these streams can be diverted from Fernwood into Wallace.
The results of these evaluations, as presented in Figure 21, show that:
• Capturing the spill from Fernwood improves the system’s overall resiliency by
30% (average total supply increases from a minimum of 50 to 62% and a
maximum of 75 to 90%).
• Diverting half the inflow from Fernwood directly into the Wallace Reservoir
improves the system’s overall resiliency by 20% (average total supply increases
from a minimum of 50 to 59% and a maximum of 75 to 85%).
• Fernwood is currently an emergency reservoir – just turning the valve on for
normal operations does not improve the system’s resiliency.
Figure 21: Fernwood Diversions
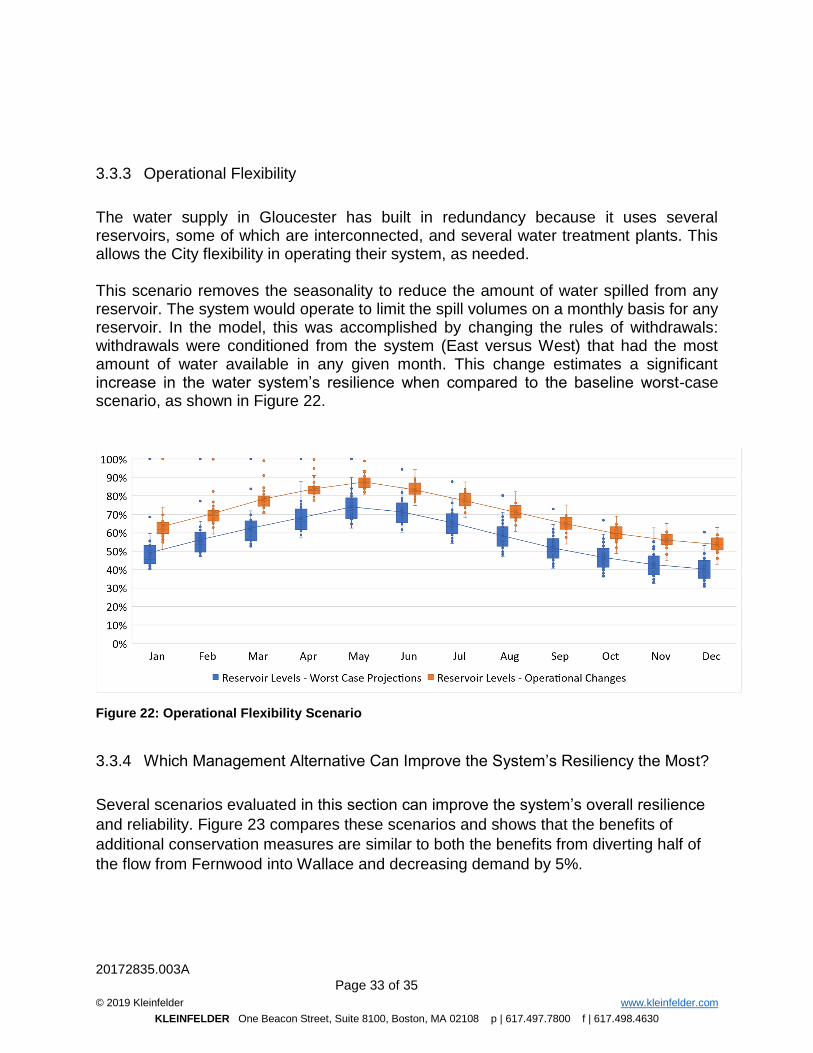
20172835.003A
Page 33 of 35
© 2019 Kleinfelder www.kleinfelder.com
KLEINFELDER One Beacon Street, Suite 8100, Boston, MA 02108 p | 617.497.7800 f | 617.498.4630
3.3.3 Operational Flexibility
The water supply in Gloucester has built in redundancy because it uses several reservoirs, some of which are interconnected, and several water treatment plants. This allows the City flexibility in operating their system, as needed. This scenario removes the seasonality to reduce the amount of water spilled from any reservoir. The system would operate to limit the spill volumes on a monthly basis for any reservoir. In the model, this was accomplished by changing the rules of withdrawals: withdrawals were conditioned from the system (East versus West) that had the most amount of water available in any given month. This change estimates a significant increase in the water system’s resilience when compared to the baseline worst-case scenario, as shown in Figure 22.
Figure 22: Operational Flexibility Scenario
3.3.4 Which Management Alternative Can Improve the System’s Resiliency the Most?
Several scenarios evaluated in this section can improve the system’s overall resilience
and reliability. Figure 23 compares these scenarios and shows that the benefits of
additional conservation measures are similar to both the benefits from diverting half of
the flow from Fernwood into Wallace and decreasing demand by 5%.

20172835.003A
Page 34 of 35
© 2019 Kleinfelder www.kleinfelder.com
KLEINFELDER One Beacon Street, Suite 8100, Boston, MA 02108 p | 617.497.7800 f | 617.498.4630
Figure 23: Comparison of Potential Management Scenarios
4 SUMMARY OF FINDINGS
• The water supply in Gloucester is adequate and resilient under current climate conditions. The six active and one emergency reservoir provide the City with redundancy and operational flexibility – when one reservoir cannot be used, enough water exists in the other reservoirs to meet the City’s current drinking water demand. The model estimates enough water in both the West and the East Systems, without having to rely on the water in Fernwood Reservoir.
• Statewide climate projections for temperature and precipitation for the planning horizons chosen in this study – 2050 and 2070 – are significantly similar. This resulted in similar model estimations of water supply availability and hence resiliency.
• The water supply in Gloucester is adequate and resilient under average future climate conditions, which were developed by calculating average monthly values for precipitation and temperature from 14 climate models. Because of the minimal impact on water supply by averaging the data and because of stakeholders’ worry about future droughts, a worst-case scenario was developed to test the supply’s resiliency.
• Worst-case future climate projections (10th percentile precipitation and 90th percentile temperature) –provided us with 30 consecutive years of drought. This is

20172835.003A
Page 35 of 35
© 2019 Kleinfelder www.kleinfelder.com
KLEINFELDER One Beacon Street, Suite 8100, Boston, MA 02108 p | 617.497.7800 f | 617.498.4630
an extreme case, a true worst-case scenario. The droughts modeled through this scenario are worse than any drought on record.
• The water supply in Gloucester is threatened under the worst-case future climate scenario and under the assumed existing operations.
• The West System is less resilient than the East System because withdrawals from the West System are in the summer months when droughts are prevalent and because the reservoirs in the West Systems have small watersheds areas – limited recharge potential.
• Because the East System is more resilient, the City might depend on it more in the future. Additional treatment needs will have to be considered, as the water quality in the East is not as good as in the West System.
• The City has options – management/operational alternatives – they can employ in times of need. This study evaluated some options based on input from stakeholders and more prevalent water supply management alternatives used in the industry.
• The benefits of additional conservation measures are similar to both the benefits from diverting half of the flow from Fernwood into Wallace and decreasing demand by 5%.
• This study has applicability to other small municipalities in the region, especially in Massachusetts. The methodology used to estimate hydrology in this study - calculating inflows into reservoirs using a regression relationship between precipitation and temperature can be replicated for other communities where streamflow data is not available from USGS or other monitoring sources. The availability of statewide precipitation and temperature climate projections facilitates studying the reliability and risks of smaller water supply systems in the region and in Massachusetts.
• Using an integrated model and STELLA as a tool, or a tool with similar capabilities, allows for rapid screenings of different scenarios and understanding the ‘big-picture” trends for any water system.
• Our findings are independent of the following factors that affect water supply reliability: infrastructure capacity (pipes and pumps), water quality issues within each reservoir, raw water treatment differences at each of the three water treatment plants, and cost considerations for the operational changes we evaluated throughout this study.
• For a better understanding of the implications of these factors on the water supply in Gloucester, we recommend the City monitor water quality in reservoirs, volume of spills, volume of transfers, and study the system again.

Attachment C
Fire-Watershed Interaction Technical Memorandum
Note: This memorandum was developed for the stakeholder engagement process and is
superseded by the main report.
Project 20191784.001A Page 1
© 2019 Kleinfelder www.kleinfelder.com
MEMORANDUM
TO: Gregg Cademartori, Michael Hale; City of Gloucester
FROM: Betsy Frederick, Kleinfelder
DATE : April 24, 2019
SUBJECT: DRAFT Technical Memorandum: Summary of GIS Analyses of Wildfire and
Landslide Interactions with the Water Supply Reservoirs’ Watersheds
CC: Kirk Westphal, Andrew Goldberg; Kleinfelder
File
1 BACKGROUND
The City of Gloucester’s water supply and reservoir system, including its watersheds, faces
potentially significant multi-hazard climate risks. Changes in temperature and precipitation
patterns are likely to exacerbate these risks. Specifically, prolonged periods of low precipitation
and high temperatures will increase fire risks. Fire events could lead to increased runoff and
erosion into drinking water supplies from loss of vegetation and groundcover (Becker, Hohner,
Rosario-Ortiz, & DeWolfe, 2018). In this analysis, debris flows, severe soil erosion, and other
similar events are referred to as landslides. While the City has redundancy in its water supplies,
the relatively small size of the reservoirs and associated watersheds make individual sources
susceptible to water quality disturbances. Additionally, each of the City’s water treatment plants
has limited capacity to treat organics and other solids in drinking water, and therefore it is prudent
to proactively manage drinking water supplies and the surrounding watersheds that protect water
quality to reduce the risk of fire and landslide events now and in the future. Through a GIS-based
analysis, Kleinfelder estimated wildfire and landslide vulnerabilities across each of the City’s water
supply watersheds. These watersheds are prioritized based on risk and conceptual alternatives
and land management strategies are recommended.
2 METHODS
Kleinfelder developed a regression model to characterize the vulnerability of the City’s water
supplies to the impacts of fires and debris flow. The fire regression model was used as an input
to the landslide risk regression model. These analyses and the relationships are depicted in
Figure 1.

Project 20191784.001A Page 2
© 2019 Kleinfelder www.kleinfelder.com
Figure 1 - Diagram of Fire and Landslide Analyses
MassGIS data for surface water supply watersheds was used to delineate the area of interest.
This data was updated for Gloucester and Rockport in April 2017. Watershed areas for Babson
Reservoir and Klondike Reservoir are larger than the sub-watershed boundaries used in the water
supply modeling evaluation, as they contain the drainage area of a surrounding waterbody, as
well. While it is unlikely that landslides would cross watershed borders, fires could spread across
topographic boundaries, and using the larger delineations is considered a conservative approach.
A description of each additional model input is described in the subsequent subsections.
2.1 FIRE REGRESSION MODEL INPUTS
For the fire analysis, model inputs were selected based on a review of relevant literature and
readily available data. These inputs fell into three categories: historical data, topography, and land
use. The City of Gloucester Fire Department provided two decades of reported wildfire records
(1998-2017). Topographic variables included elevation, slope, aspect, and compound
topographic index. Land use data included the land cover (burnability) and normalized difference
vegetation index. Topographic and land use data was available from MassGIS, USGS, and
NOAA. Table 1 summarizes model inputs and data sources.

Project 20191784.001A Page 3
© 2019 Kleinfelder www.kleinfelder.com
Table 1: Data Sources in Wildfire Model
Variable Category Model Input Data Source
Historical Records Fire History City of Gloucester Fire
Department Records (1998-
2018) and Essex County
Records (2001-2018)
Topography Elevation MassGIS
Topography Slope Calculated field based on
MassGIS elevation
Topography Compound Topographic Index Calculated field based on
MassGIS elevation
Topography Aspect MassGIS
Land use Land Cover USGS National Land Cover
Database, 2011
Land use Normalized Difference
Vegetation Index
NOAA, 2016
2.1.1 Fire History
The Gloucester Fire Department maintains a database of all responses to fires. The Fire
Department provided a filtered export of the National Fire Incident Reporting System (NFIRS)
database, reporting all reports of natural vegetation fires. This dataset contained 875 records of
fires between 1998 and 2018. Reports contained structured data including date, approximate
location or nearest street address, and type of fire (such as natural vegetation, other; brush or
brush-and-grass mixture fire; or forest, woods or wildland fire). Additionally, each report also
contained a free-text field describing the incident. These data were supplemented and compared
to records for fires within Gloucester or Rockport, as provided by Essex County. The County’s
dataset contained structured fields for date, approximate location or nearest street address,
approximate duration, and approximate size of fire. This dataset contained approximately 544
records within the study area.
All reports with an identifiable address were approximately located in the GIS using Google’s
geocoding service. The City and County’s datasets were manually merged such that any non-
urban fires occurring on the same date and in similar locations were de-duplicated. Based on a
review of the unstructured data, interpretation of the location of fires, and an interview with the
City’s Fire Chief, many of these reported incidents were in urban areas – primarily relating to
burning of mulch or other landscaping materials. After geocoding the approximate location of fires,
all incidents in urban areas were removed from analysis. Urban areas were determined based on
the nearest parcel’s land use type, as assigned in the Assessor’s database. All fires within
residential, commercial, and industrial parcels were excluded from this analysis. After this filter,

Project 20191784.001A Page 4
© 2019 Kleinfelder www.kleinfelder.com
394 fire records remained as inputs to the model. The locations of these fires are shown in Figure
2. Fires with addresses are marked as solid circles and approximate locations are shown as
bullseyes.
Figure 2 - Locations of Non-Urban Fires in Rockport and Gloucester (1998-2018)
Generally, fires are less likely to reoccur in areas that have burned in recent history, as there is
less organic matter that provides fuel. However, since this study has a planning horizon of 2070,
which provides adequate time for vegetation to regrow following a historic fire event in the
modeled inputs, we considered all locations as equally likely to have a repeat fire event within the
period of interest, independent of all other factors, and did not incorporate natural fire cycles into
the analysis.
2.1.2 Elevation
The MassGIS dataset for elevation provides data at 1-meter resolution horizontally in a digital
elevation model format. In the study area, elevation ranged from approximately 2.2 feet below to
82.4 feet above mean sea level (AMSL). Elevation, climate, and wind patterns are related. Winds
tend to dry out the vegetation, leading to increased fire vulnerability. Lower elevation areas

Project 20191784.001A Page 5
© 2019 Kleinfelder www.kleinfelder.com
typically are drier due to higher temperature and lower precipitation; however, this pattern may
not be as pronounced in low-lying coastal communities, like Gloucester and Rockport. In
circumstances where wildfire is already occurring, higher elevations are more vulnerable due to
their exposure to winds that promote the movement of fire.
2.1.3 Slope
In the study area, slope ranges from 0̊ to about 82̊. Slope was calculated based on estimated
elevation.
Slope affects both the rate and direction of fire spread. Fires typically move more quickly upslope
than downslope due to wind factors.
2.1.4 Aspect
A north-facing slope receives less sunlight than a south-facing slope. Southern aspects receive
more direct heat from the sun, drying both vegetation and soil on south aspects (Dickson, 2006).
A slope with an east aspect will get direct sunlight earlier in the day than a slope with a west
aspect. Moisture that accumulates on vegetation overnight dries more quickly on east aspects
than west aspects.
2.1.5 Compound Topographic Index
Compound Topographic Index (CTI) is also known as the wetness index. CTI is a function of
upstream contributing area and the slope of the landscape (Moore, 1991). CTI is generally a
measure of the tendency of water to accumulate at any point on a slope. High CTI values
represent high potential for soil moistures, whereas low values represent zones that dry up more
quickly. CTI is calculated as:
𝐶𝑇𝐼 =ln 𝑎
tan 𝛽
Where 𝑎 is the upslope area per unit width of contour and 𝛽 is the slope angle.
2.1.6 Land Cover
Land cover data was from the National Land Cover Database (NLCD, 2011). Generally, these
categories are a proxy for burnability (Kasischke, 2010). Land cover classes in the study area
included open water; developed open space; developed low intensity; developed medium
intensity; developed high intensity; barren land; deciduous forest; evergreen forest; mixed forest;
shrub or scrub; grassland; pasture/hay; cultivated crops; woody wetlands; and emergent
herbaceous wetland. This input was treated as a categorical variable in the regression model.

Project 20191784.001A Page 6
© 2019 Kleinfelder www.kleinfelder.com
2.1.7 Normalized Difference Vegetation Index (NDVI)
The Normalized Difference Vegetation Index (NDVI) is a simple graphical indicator that can be
used to determine the density of vegetation on the ground surface. The higher the quantity of fuel,
vegetation in this case, the higher the flammability. As the amount of flammability in a given area
increases, the amount of heat produced by the fire increases. Biomass density was represented
by NDVI calculations, given on a scale from -1 to 1.
2.2 LANDSLIDE REGRESSION MODEL INPUTS
According to the Massachusetts State Hazard Mitigation Plan (SHMP), “landslide includes a wide
range of ground movements, such as rock falls, deep failure of slopes, and shallow debris flows.”
Landslides in Massachusetts “typically include translational debris slides, rotational slides, and
debris flows.” The landslide analysis used in the SHMP was based upon the “Slope Stability Map
of Massachusetts” developed by scientists at the University of Massachusetts Amherst
Department of Geosciences. These studies indicate that soil saturation (prolonged periods of
antecedent wetness followed by high-intensity rainfall) and land cover are two predominant
drivers of landslides, both of which could be impacted by a changing climate. Dramatic changes
in vegetative cover could be triggered by a fire; and therefore, the fire regression model was
incorporated into this analysis.
Table 2: Data Sources in Landslide Model
Variable Category Model Input Data Source
Preceding Fire Trigger Fire Regression Model Derived from inputs to fire
regression model
Landslide Risk Landslide Incidence/
Susceptibility
2018 State Hazard Mitigation
Plan
2.2.1 Fire Model
The results of the fire regression model were incorporated as an input to the landslide risk
analysis. The same normalized scores on a 0-1 scale were added to the landslide incidence/
susceptibility model input, as described below.

Project 20191784.001A Page 7
© 2019 Kleinfelder www.kleinfelder.com
2.2.2 Landslide Incidence/ Susceptibility
Landslide incidence/ susceptibility ratings were available from the 2018 State Hazard Mitigation
and Climate Adaptation Plan (SHMCAP). The landslide incidence and susceptibility model used
in the SHMCAP incorporated a variety of inputs including historic landslide event frequency and
severity, soil type, geology, slope, soil strength, and climate. A full description of inputs and
methods used in this model are described in the 2013 paper Slope Stability Map of Massachusetts
(Mabee & Duncan, 2013). This model was intended for community-level planning and provides
factors of safety on a 9-meter grid. The stability index was based on the calculated factor of safety
and was converted to a 1-5 scale for this analysis, where higher values represented areas that
had higher likelihood of failure (higher risk).
2.3 DEVELOPMENT OF THE REGRESSION MODELS
A grid was developed over the study area, with each unit representing 100 square meters. Each
fire incidence within a grid section was tallied and used as the model prediction (y value). The
average value of each of the quantitative model inputs was stored, and for the categorical variable
(land cover), the predominant value was stored. Each grid section that was in an urbanized area,
that contained a body of water, or did not contain enough data for the model was excluded. The
regression model was then run for the remaining grid sections.
3 MODELING RESULTS
3.1 FIRE RISK MODEL
The regression model equation can be expressed as y = b + w1x1 + w2x2 + … w𝑖x𝑖 where y
represents the occurrence of historic fires, used as a proxy for fire risk; 𝑤𝑖 is the coefficient or
estimated weight; and x is model input or variable. Table shows the relationship between each
model input and the output.
Table 3: Regression Model Results
Model Input (xi) Coefficient (wi) p-value Significance
Intercept (B) 1.950 8.42E-03 Significant
Aspect 0.001 5.09E-02 Significant
CTI 0.014 5.32E-01 Not Significant
Elevation -0.066 5.24E-63 Significant
NDVI -0.826 8.76E-02 Significant
NLCD - Water 2.829 7.43E-04 Significant

Project 20191784.001A Page 8
© 2019 Kleinfelder www.kleinfelder.com
Model Input (xi) Coefficient (wi) p-value Significance
NLCD - Developed, Open Space 4.572 4.42E-09 Significant
NLCD - Developed, Low Intensity 4.605 2.75E-09 Significant
NLCD - Developed, Medium
Intensity
5.869 7.06E-14 Significant
NLCD - Developed, High Intensity 7.437 1.12E-13 Significant
NLCD - Barren Land 1.039 1.82E-01 Not Significant
NLCD - Forest 3.804 9.71E-07 Significant
NLCD - Evergreen Forest 4.103 1.51E-07 Significant
NLCD - Mixed Forest 4.723 2.29E-08 Significant
NLCD - Shrub/Scrub 1.547 7.95E-02 Significant
NLCD - Grasslands 3.408 2.79E-05 Significant
NLCD - Pasture/Hay 3.651 3.99E-05 Significant
NLCD - Cultivated Crops 5.570 4.90E-02 Significant
NLCD - Woody Wetlands 2.790 3.63E-04 Significant
NLCD - Emergent Herbaceous
Wetlands
1.330 7.78E-02 Significant
Slope 0.028 2.21E-04 Significant
All model inputs were significant at the alpha ≤ 0.1 level, except for compound topographic index
(CTI) and NLCD - Barren Land. NLCD, generally, was a good predictor of historic fires, particularly
in areas that have high intensity of development and cultivated crops. Overall, the model was
significant (with a p-value = 2.2E-16) but had a weak predictive ability (r2 = 0.10), in part due to
the rare nature of fire events and because most of the fires within this historic dataset were caused
by anthropogenic factors that were not included in this model.
Using this model, a composite risk score was assigned to each grid section. The risk score was
normalized based on the highest value to report a range between 0-1, where the highest risk
areas were closer to 1 and the lower risk scores were closer to 0. Normalized risk scores were
relatively normally distributed. The mean risk score across the entire study area was 0.38. The
middle 50% of risk scores were between 0.30 and 0.46, as shown in Figure 3.

Project 20191784.001A Page 9
© 2019 Kleinfelder www.kleinfelder.com
Figure 3 - Histogram of Normalized Risk Scores
A map illustrating risk values across the study area is provided in Figure . High risk areas are in
red while areas of lower fire risk are green. Areas shown in grey were excluded from these
calculations.

Project 20191784.001A Page 10
© 2019 Kleinfelder www.kleinfelder.com
Figure 4 - Normalized Risk Values Across the Study Area
Much of the areas that are at highest risk of fire, shown in red, are located outside of the water
supply watersheds. An average risk score was calculated for each watershed area individually to
prioritize actions based on risk. Since each grid section is of equivalent size, the average risk
score did not need to be normalized. Table 4 summarizes the average risk scores by watershed
and ranks each watershed from highest to lowest average risk. These values from within the
extent of each watershed can be compared to the entire study area.
Table 4: Average Risk Score and Rank within each Water Supply Watershed
Name of Water Supply Watershed Average Risk Score Standard
Deviation
Rank
Babson Reservoir 0.320 0.082 3
Dykes Meadow 0.250 0.062 6 (tied)
Fernwood Lake 0.295 0.059 5
Goose Cove Reservoir 0.300 0.096 4

Project 20191784.001A Page 11
© 2019 Kleinfelder www.kleinfelder.com
Name of Water Supply Watershed Average Risk Score Standard
Deviation
Rank
Haskell Reservoir 0.250 0.107 6 (tied)
Klondike Quarry 0.359 0.077 1
Wallace Pond 0.332 0.083 2
Entire Study Area 0.381 0.132 -
The Klondike Reservoir, Wallace Pond, and Babson Reservoir watersheds had the highest
average spatially-weighted average risk scores. Based on the MassGIS delineation, Babson
Reservoir contains Cape Pond and its surrounding area, and the Klondike Reservoir watershed
contains Steel Derrick Quarry and its surrounding area. If a different watershed delineation were
used, such as the MassGIS subbasin layer, these average risk scores could change. Dykes
Meadow and Haskell Reservoir both had the lowest average risk score, with Fernwood Lake and
Goose Cove in the middle.
3.1.1 Validation
To validate the model, average risk scores within watersheds were compared to the frequency of
historic fires. Error! Not a valid bookmark self-reference. provides a data summary of the fire
frequency and this frequency normalized by the size of the water supply watershed to compare
on a 0-1 scale. Watersheds were then ranked based on this normalized fire frequency from
highest to lowest.
Table 5: Summary of Fire Incidents within Gloucester’s Water Supply Watersheds
Name of
Water
Supply
Watershed
Count of
Fires (1998-
2018)
Area
(square
miles)
Number of
Fires per
Square Mile
of
Watershed
Area
Fire
Frequency
Normalized
by Maximum
Rank
Babson
Reservoir 15 1.95 7.68 0.27 3
Dykes
Meadow 0 0.65 0.00 0.00 8
Fernwood
Lake 2 0.53 3.78 0.13 6
Goose Cove
Reservoir 8 1.04 7.67 0.27 4
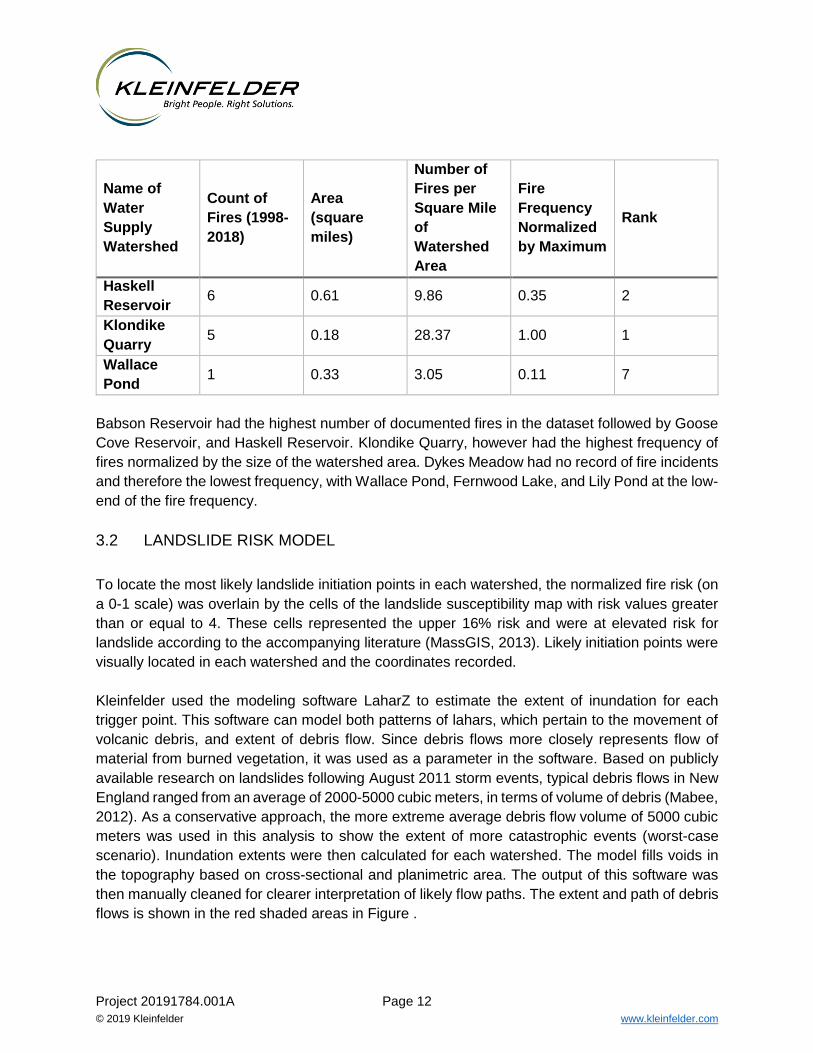
Project 20191784.001A Page 12
© 2019 Kleinfelder www.kleinfelder.com
Name of
Water
Supply
Watershed
Count of
Fires (1998-
2018)
Area
(square
miles)
Number of
Fires per
Square Mile
of
Watershed
Area
Fire
Frequency
Normalized
by Maximum
Rank
Haskell
Reservoir 6 0.61 9.86 0.35 2
Klondike
Quarry 5 0.18 28.37 1.00 1
Wallace
Pond 1 0.33 3.05 0.11 7
Babson Reservoir had the highest number of documented fires in the dataset followed by Goose
Cove Reservoir, and Haskell Reservoir. Klondike Quarry, however had the highest frequency of
fires normalized by the size of the watershed area. Dykes Meadow had no record of fire incidents
and therefore the lowest frequency, with Wallace Pond, Fernwood Lake, and Lily Pond at the low-
end of the fire frequency.
3.2 LANDSLIDE RISK MODEL
To locate the most likely landslide initiation points in each watershed, the normalized fire risk (on
a 0-1 scale) was overlain by the cells of the landslide susceptibility map with risk values greater
than or equal to 4. These cells represented the upper 16% risk and were at elevated risk for
landslide according to the accompanying literature (MassGIS, 2013). Likely initiation points were
visually located in each watershed and the coordinates recorded.
Kleinfelder used the modeling software LaharZ to estimate the extent of inundation for each
trigger point. This software can model both patterns of lahars, which pertain to the movement of
volcanic debris, and extent of debris flow. Since debris flows more closely represents flow of
material from burned vegetation, it was used as a parameter in the software. Based on publicly
available research on landslides following August 2011 storm events, typical debris flows in New
England ranged from an average of 2000-5000 cubic meters, in terms of volume of debris (Mabee,
2012). As a conservative approach, the more extreme average debris flow volume of 5000 cubic
meters was used in this analysis to show the extent of more catastrophic events (worst-case
scenario). Inundation extents were then calculated for each watershed. The model fills voids in
the topography based on cross-sectional and planimetric area. The output of this software was
then manually cleaned for clearer interpretation of likely flow paths. The extent and path of debris
flows is shown in the red shaded areas in Figure .

Project 20191784.001A Page 13
© 2019 Kleinfelder www.kleinfelder.com
Figure 5 - Modeled Extent of Landslides
The identified initiation points are shown in Table 5, below:
Watershed X-Coordinate Y-Coordinate
Babson Reservoir 268602.448 930863.597
Babson Reservoir 268978.354 931195.208
Babson Reservoir 269046.592 931251.475
Babson Reservoir 269325.528 931391.541
Babson Reservoir 269156.37 931335.275
Babson Reservoir 269549.036 931556.509
Babson Reservoir 271547.083 932742.887
Babson Reservoir 269366.635 931594.504
Babson Reservoir 269161.847 931600.061
Babson Reservoir 268971.347 931487.613
Babson Reservoir 268852.284 931378.075
Babson Reservoir 268327.614 931292.085
Dykes Meadow 263662.556 929375.324
Dykes Meadow 263197.365 928994.588

Project 20191784.001A Page 14
© 2019 Kleinfelder www.kleinfelder.com
Dykes Meadow 263169.849 928702.329
Dykes Meadow 262987.814 928499.34
Dykes Meadow 263333.202 928237.296
Dykes Meadow 263654.724 928432.347
Dykes Meadow 263673.245 928528.127
Dykes Meadow 263746.799 928532.36
Dykes Meadow 263814.004 928546.542
Dykes Meadow 263851.045 928568.767
Fernwood Lake 265472.937 928646.67
Fernwood Lake 265906.67 929544.165
Haskell Reservoir 262045.247 928481.57
Haskell Reservoir 262155.976 928680.246
Haskell Reservoir 262482.049 928861.856
Haskell Reservoir 262542.435 928915.712
Haskell Reservoir 262367.987 929172.531
Klondike Quarry 268679.001 935337.1
Klondike Quarry 268686.277 935497.834
Klondike Quarry 368670.071 935432.35
Klondike Quarry 268721.004 935410.191
Klondike Quarry 268791.449 935317.917
Klondike Quarry 269491.802 935826.381
Klondike Quarry 269513.631 935800.254
Klondike Quarry 269483.534 935665.977
Wallace Pond 264767.442 927984.584
Wallace Pond 264805.542 928006.809
Wallace Pond 264834.117 928036.178
Wallace Pond 264851.579 927125.872
Wallace Pond 264931.748 928289.385
Wallace Pond 265057.955 928543.147
Wallace Pond 265275.443 928809.61
Wallace Pond 265329.462 929214.238
Wallace Pond 264887.474 928674.434
Wallace Pond 264780.318 928427.855
Most of the predicted landslide activity was located on steeply sloped areas within the watersheds.
Since the elevation in the study area does not vary greatly, the steepest slopes were located near
the water bodies in the reservoirs. The proximity of the initiation points to the water bodies makes
the waterbodies especially vulnerable to impacts from mass movements.
While these red-shaded areas are intended to demonstrate areas with potential high landslide
risks and should therefore be prioritized for watershed management alternatives, these desktop

Project 20191784.001A Page 15
© 2019 Kleinfelder www.kleinfelder.com
analyses may not reflect current site-specific conditions and additional analysis may be needed
prior to implementing site-specific alternatives.
4 DISCUSSION AND RECOMMENDATIONS
4.1.1 Watershed Management Goals
Climate, fire risks, landslide risks, and water resources are all linked. The City of Gloucester is
taking a wholistic approach to watershed planning and protecting its water resources now and in
the future with the understanding that healthy watersheds provide a variety of ecosystem, public
health, and public benefits.
Forested watersheds, according to Fernando Rosario-Ortiz, “absorb rainfall and snow melt, slow
storm runoff, filter pollutants, provide habitat, and provide recreational opportunities that support
local economies.” However, watersheds that are impacted by fire and landslides can contribute
to negative water quality though the deposition of sediment into reservoirs. One proactive
approach to reduce the risk of these events occurring is through implementing land management
strategies or alternatives. Recommended land management alternatives, as described below, are
categorized based on their main goal of either general forest management (silviculture) or control
of gypsy moth, as depicted in Figure .
Figure 6 - Diagram of Land Management Alternatives to Reduce Risk of Fire and
Landslide

Project 20191784.001A Page 16
© 2019 Kleinfelder www.kleinfelder.com
4.1.2 Forest Management and Silviculture
Proper forest management will result in a reduction of wildfires and landslides risk, and
improvements in water quality. These strategies and resulting water quality improvements were
observed in multiple locations, including New York City’s reservoirs located in the Catskills of
upstate New York, and more locally, in the Quabbin Reservoir watershed.
Forest management is typically done through the application of silvicultural practices. Silviculture
is the cultivation and management of forests and stands to meet the landowners desired needs.
A stand is the basic unit of a forest and is generally an area containing trees of similar size, age,
and species. Several silvicultural techniques outlined below can direct forest growth towards
meeting the overall watershed management goals of increasing overall water quality of the
reservoirs and while also attaining a reduction in the risk of wildfires and landslides.
4.1.3 Gypsy Moth Control and Spread
Like much of the forested area in the Northeast and New England, the forest health in water
supply watersheds is impacted by the spread of an invasive inspect species, called gypsy moth.
This infestation led to widespread defoliation, increases in dead/dying trees, and a decrease in
forest health (Liebhold, et al., 1997). At a Public Meeting in December 2018, residents shared
that there are multiple areas, particularly near Babson Reservoir and in the Dogtown commons
that have stands of infected or fallen dead trees. Poor forest health increases the risk of fire and
landslide. Moth population control will prevent an increased number of dead standing trees that
ultimately provide fuel for wildfires.
4.2 MANAGEMENT STRATEGIES
4.2.1 Stand Tending and Thinning
Tending: Is one of the basic silvicultural methods for directing the development of the forest and
is typically accomplished by the selective management of individual trees by removing branches
to manage light exposure to the understory. In doing so, either dead branches that would provide
fuel are removed or whole trees are removed to promote growth of selected trees. The individual
attention to specific trees promotes its growth into a high-quality product, if logging is a desired
goal, but will also improve the tree and stand health by cultivating healthier and more resilient
trees. A reduction in the overall canopy can also promote growth in the understory that improves
ground cover and root density that can mitigate erosion within the forest.
Thinning: is another silvicultural method that involves the removal of trees to reach a desired
stand density. The density of a forest/stand is important from an ecological standpoint to either

Project 20191784.001A Page 17
© 2019 Kleinfelder www.kleinfelder.com
encouraging or discouraging competition. Selection by removing trees based on size, species,
age, etc. will continue to develop the forest to meet the overall management goals. With a desired
goal of resiliency, removing trees of the dominant species can encourage a more diverse stand
population. Thinning also accomplishes some of the goals of tending in promoting growth of
higher quality trees that can be harvested.
4.2.2 Controlled Burns
Controlled burns are demonstrated to be an effective way at reducing the frequency of
uncontrolled wildfires. Prescribed burns involve intentionally lighting specific areas to consume
fuel (dead trees and other woody materials that may burn). This ultimately leads to an overall
reduction in fuel for wildfires and an increase in species resilient to wildfires. There are several
methods to safely and effectively conduct controlled burns, however, waiting for ideal conditions
with respect to local weather such as precipitation, humidity, and wind can prove challenging. In
Northeastern states, particular care and consideration must be given due to the higher population
density and with respect to protecting private lands.
4.2.3 Riparian Zone Management
Riparian Zone management, often referred to as buffer strips, is considered a best management
practice in stormwater engineering. The succession of vegetation lining the banks of water bodies
creates dense understories with high root densities. This combination increases sheet flow
generated by the increase in friction or obstacles therefore slowing down runoff and increasing
infiltration. Added benefits also include lower suspended solids due to less and slower overland
flow. High root densities keeping soils in place also contribute to this. In New England it is typical
to see the forest and riparian zone overlapping. It is therefore especially important to concentrate
on developing the riparian zone.
4.2.4 Sanitation Cut
Sanitation cuts is the intersection of using forest management to control the gypsy moth
population. Put simply, trees infected by the gypsy moths are cut and removed from the stand in
order to limit their spread, while reducing standing dead trees. In some respects, this can also
achieve similar outcomes of a thinning method. Removal of the dead trees also reduces fuel for
wildfires.
4.2.5 Chemical and Biological Control
Gypsy moths have proven to be a resilient pest that routinely affects our forests and forest health.
Large swaths of forest have been defoliated, leaving dead trees throughout much of New

Project 20191784.001A Page 18
© 2019 Kleinfelder www.kleinfelder.com
England, New York, Pennsylvania and Michigan. Success in controlling gypsy moth populations
has been attained using pesticides, fungi, and viruses. However, due to the proximity of these
forest and catchments to drinking water reservoirs, extreme care and consideration should be
given before employing one of these methods. These should be mostly a last resort method and
in extreme cases.
4.3 IMPLEMENTATION
A combination of methods can be used to reduce fire risk. Kleinfelder recommends implementing
alternatives in areas that have high fire and landslide risk.
4.4 LIMITATIONS
Climate data generally was omitted from this analysis. Evapotranspiration, which is a sum of
evaporation and transpiration in a given area, showed little spatial variability across the study
area. Other climate data had high temporal resolution, but a low spatial resolution. Little variation
was observed in an exploratory analysis of the spatial variability of historic and future climate data,
as well. Therefore, climate data was treated as spatially constant. Generally, increased average
temperature and changes in precipitation patterns may increase the risk of fire in the City’s water
supply watersheds.
Additionally, many historic wildfires were not caused by natural forces alone. In a review of
relevant historic fire records, humans were believed to have started most incidents. While
anthropogenic factors are considered significant in understanding fire risk, these factors were not
incorporated into this model.
The underlying landslide incidence/ susceptibility model provides an approximation of potential
landslide hazards across the state at a 1:125,000 scale. This provides an appropriate level of
detail for comparing risk across watersheds but would not provide enough detail to identify site-
specific risks.
Project 20191784.001A Page 19
© 2019 Kleinfelder www.kleinfelder.com
5 REFERENCES
Becker, W. C., Hohner, A., Rosario-Ortiz, F., & DeWolfe, J. (2018). Preparing for Wildfires and Extreme Weather: Plant Design and Operation Recommendations. AWWA, 32-40.
Commonwealth of Massachusetts. (2018). Massachusetts State Hazard Mitigation and Climate Adaptation Plan. M.
Dickson, B. G. (2006). Mapping the Probability of Large Fire Occurrence in Northern Arizona, USA. Landscape Ecology, 747-761.
Forestry Canada Fire Danger Group. (1992). Development and structure of the Canadian Forest Fire Behavior Prediction Systems. Forestry Canada.
Kasischke, E. V. (2010). Alaska's Changing Fire Regime - Implications for the Vulnerability of its Boreal Forests. Canadian Journal of Forest Research, 1313-1324.
Liebhold, A. M., Gottschakl, K. W., Luzader, E. R., Mason, D. A., Renate, B., & Twardus, D. D. (1997). Gypsy Moth in the United States:. Radnor, PA: USDA FOREST SERVICE.
Mabee. (2012). Geomorphic Effects of Tropical Storm Irene on Western Massachusetts: Landslides and Fulvial Erosion Along the Deerfield and Cold Rivers, Charlemont and Savoy, MA.
Mabee, S. B., & Duncan, C. C. (2013). Slope Stability Map of Massachusetts. Amherst: University of Massachusetts.
Moore, I. G. (1991). Terrain Based Catchment Partitioning and Runoff Prediction Using Vector Elevation Data. Water Resources Research, 1177-1191.