watershed development programmes in ... - india water portal
TRANSCRIPT
1
Watershed Development Programmesin Madhya Pradesh:
Present Scenario and Issues for Convergence
Sucharita Sen1 , Amita Shah2 and Animesh Kumar3
Gujarat Institute of Development ResearchForum for Watershed Research and Policy Dialogue
1 Associate Professor, Center for the Study of Regional Development, Jawaharlal NehruUniversity, New Delhi
2 Professor, Gujarat Institute of Development Research, Ahmedabad3 Research Fellow, Center for the Study of Regional Development, Jawaharlal Nehru University,
New Delhi
2
TABLE OF CONTENTS
List of Tables
List of Figures
Executive Summary
Chapter 1: Introduction1.1 Context1.2 Departure from Sectoral Approach1.3 Stock Taking: Imperatives for a Conceptual frameworkI. 4 Emerging Issues and Normative Framework1.5 Methodology and Approach
Chapter 2: Locating Madhya Pradesh: Scope and Challenges for WDPs2. 1 Resource Base2.2 Regional Variations2.3 Utilisation of Resource Base and Agricultural Performance2.4 Some Aspects of Rural Livelihood2.5 Natural Resource Degradation:2.6 Augmentation and Supply of Drinking Water2.7 Contextualising Watershed Development in MP: Scope and Challenges
Chapter 3: Coverage and Spatial Distribution3.1 WDPs in M.P.: A Synoptic View3.2 Spatial Distribution of WDPs3.3 Complementarity and Prioritisation
Chapter 4: Performance of Watershed Programmes4.1 Adaptation of Watershed Programmes in Madhya Pradesh
a) Rajiv Gandhi Mission Watershed for Watershed Developmentb)Pani Roko Abhiyan
4.2 Aspects of Implementation of Watershed Projects in Madhya Pradesh
3
a) Limitations of Review of Assessment Studiesb) Administration and Fundingc) Environmental Sustainabilityd) Livelihood Enhancement:e) Equityf) Participation
4.4 Summing Up
Chapter 5: Watershed Programmes in Jhabua District�A Sub-Regional Analysis5.1 Jhabua District: A Profile5.2 Spatial Spread of WDPs in Jhabua5.3 Comparison of RGMWM and NWDPRA Projects5.4 NGO Participation in Watershed Programmes5.5 Alternative Models
a) DANIDA NWDPRA Project (partnership between block agricultural office andSampark
b) Approach adopted by ASA, Jobatc) Case of Gramin Vikas Trust, Jhabua
5.6 Overall Impact: What do Secondary Data Tell?5.7 Summing Up
Chapter 6: Summary and Major Findings6.1 The Context6.2 Scope and Coverage of WDPs in M. P.6.3 Jhabua District: A Disaggregated Analysis6.4 Implementation and Achievements6.5 Emerging Issues and Future Directions:
List of Abbreviations
References
Appendices:Appendix 1
A note on Methodology of Prioritisation of Watershed Activities in Block Level usedfor Jhabua District
Appendix Tables

4
LIST OF TABLES
2.1 Land-Use Pattern: M. P. and India (2002-03)2.2: Agro-Climatic Regions2.3: Forest Area in M.P. Districts2.4: Number of Districts Affected by Drought2.5: Some Key Indicators for Access to Land2.6: Distribution of Persons below Poverty Line among Social Groups in Rural
areas: M.P. and India2.7: Indicators of Land Degradation (Per cent)2.8 Share of Area under Districts covered by DPAP and IWDP (2001)3.1: Area Treated under Different Watershed Programmes3.2: Area Treated under RGMWM and NWDPRA across Districts3.3: Districts with Higher Concentration of WDPs3.4: Top and Bottom Ten Districts in terms of Area Coverage under NWDPRA and
RGWM3.5: Prioritisation of WDP coverage by RGMWM and NWDPRA4.1: Comparison of Objectives of WDPs Undertaken by the MoRD and MoA4.2: Evolution of Objectives of RGMWM4.3: Institutional Structure Adopted for Rajiv Gandhi Mission for Watershed
Management4.4: Phases of Financial Disbursement to PIA and Village Watershed Committee
(VWC) from RGMWM State Office4.5: Heads of Activities and Variability in Expenditures4.6: Percentage of Sample Villages Reporting Dry Ground Water Sources in Pre-
and Post-Watershed Periods4.7: Changes in Extent and Intensity of Agricultural Land-use in Sample Watersheds
in DPAP4.8: Yield per Hectare of Major crops of beneficiaries and non-beneficiaries in
Chanderi Nala, Khargaon district, 19984.9 : Disparity Ratios in Female Employment with Respect to Female Population4.10: Comparative Representations of Social Groups in Village Watershed
Committees vis-à-vis Their Shares in Population at the District Level5.1: Comparison of M.P. and Jhabua: Some Indicators

5
5.2: Geographical Area) of WDPs under Department of Rural Development and Agriculture Takenup after 1995-96
5.3: Relative Importance of NWDPRA and RGMWM Projects across Blocks in Jhabua5.4 Area taken up under WDP under RGMWM at Different Stages (1995-95 onwards)5.5: Area taken up under WDPs at Different Stages under NWDPRA5.6: Deviations of Rank between Deprivation Indices and Concentration of
Watershed Work5.7: Projects administered by RGMWM and Dept. of Agriculture� A Comparison5.8: Comparison between RGMWM and NWDPRA� Some Aspects of Efficiency5.9 Relative Importance of NGOs in DPAP (II/5-8) Watershed Work in Jhabua
District5.10: Relative Importance of GOs and NGOs in the Evolution of DPAP Project in
Jhabua5.11: Comparison of GOs and NGOs with respect to Financial and Physical Progress
of DPAP 5 and DPAP 7 in Jhabua District (as on October, 2005)5.12: ASA�a Multi-Faceted Activities in Jhabua5.13: Land-use Pattern in Jhabua and Nimar Plains5.14: Yield Levels in Jhabua and Nimar Plains5.15: Cropping Pattern in the Jhabua and Nimar Plains (in decreasing importance of
crops)

6
LIST OF FIGURES
2.1: Agro-Climatic Regions in MP2.2: Indices of Food Grain Production2.3: Water Level Fluctuation Map3.1: Share of Watershed Area under Treatment by 10th Plan3.2: Watershed Coverage in MP: Relative share of NWDPRA and RGMWM4.1: Supporting Institutional Structures at the Micro-Watershed Level4.2: Change in percentage of area under plough to total cultivable land in DPAP
sample watersheds4.3: Change in cropping intensity in DPAP sample watersheds4.4: Relationship of changes in agricultural area extension and land use intensity5.1: Percent deviation from normal rainfall: Jhabua 1991 � 20035.2: ASA�s Strategy5.3: Spatial Concentration of Watershed Programmes in Jhabua

7
EXECUTIVE SUMMARY
It may be noted at the outset that the present review of watershed programmers inMadhya Pradesh is not an attempt to evaluate nor assess the impact of the largenumber of watershed projects that have been implemented in the state. Rather, thisis more or less an exercise in stock taking and learning from the past. The idea is tolook at the present status of watershed development in the state so as to be ablemove towards a vision of better convergence across developmental objectives(including equity), synergy between natural resource regeneration, administrative co-ordination, institutional coherence, and resource mobilization. It is in this largercontext, the review focuses is on (a) spatial spread, prioritization, andcomplementarity across projects; (b) comparison across modes/ approaches andcross learning; and, (c) issues for future policies.Importantly, the stock taking exercise has been carried out with a difference wherethe status of watershed development is being examined through the lenses of anormative framework that lays special emphasis on productivity, equity,sustainability, and democratic decentralization.The review is based mainly on the existing studies, which in fact, are quite scanty.There is also a serious problem of availability of such studies as well as otherinformation in the public domain. Nevertheless, we have tried to overcome theseconstraints, at least partly, by holding detailed discussions with a large number ofkey informants and also by visiting a few sites of selected watershed projects. Thestrength of the analysis therefore, lies more in terms of evolving a larger picture ofwatershed projects in the state, rather than in terms of presenting precise estimatesor evidence, which is difficult given the paucity and asymmetric (in terms ofcoverage of WDPs across projects and regions) analyses as well as data-base in thepublic domain. In this context, the review may be considered as an importantlandmark for understanding watershed development in Madhya Pradesh.
2. Watershed Projects in Madhya Pradesh: Scope and CoverageMadhya Pradesh, one of the constituents of the oft talked about Bimaru states has anumber of characteristics that render it such a dubious distinction. Largely due to a lowproductivity in agriculture along with larger area under forest (almost 30 per cent)offering limited entitlements to the forest dwellers, the state had 37.2 per cent of its ruralpopulation living in poverty as against 26.1 percent at all-India level by the end of the1990s.In terms of agricultural development, to a large extent, a low vertical spread ofirrigation is responsible for low cropping intensity, which is merely 103 per centcompared to 137 per cent for the country as a whole. Even the horizontal coverage(gross area irrigated to gross cropped area) of irrigation is extremely poor comparedto the country as a whole (27 vis-à-vis 41 per cent). Consequently, 89 per cent of thedistricts in M.P. covering around 81 per cent of its area are dry lands. These districtsmake up 23 per cent of India�s 177 dry land districts and occupy 19 per cent ofIndia�s dry area. Even if the irrigation potential from surface and groundwatersources were fully realised, over 55 per cent of the net sown area in the state wouldstill remain dependent on uncertain rainfall. Thus development of dry land farmingtechniques is of utmost importance in the state.Since the eastern districts have more forest land and greater water resources, and atthe same time limited cultivable land, the region needs to be developed keeping inview of its core agro-ecological character, which is mainly based on plantations,

8
pastures, and forest conservation. On the other hand, the western districts with theirmain focus on crop cultivation have already exploited significant amount ofgroundwater.However, the state can, in no uncertain terms, be considered a resource poor one.M.P. represents one of the states having rich and diverse agro-climatic conditionswith rainfall decreasing from east to west, having a range of almost 1000mm. Withlarge proportion of the region receiving medium to high rainfall and the land masscharacterised by undulating topography, soil-water conservation under watershedprojects may bring greater benefits as compared to situations with very low rainfalland plain topography. With one-third of its area covered by forests, much of whichhaving suffered severe degradation, watershed development may assume a centralplace in management of forest resources in the state. A substantial proportion ofcultivated land having been converted from erstwhile forest area, the naturalproductivity is fairly good in most parts of the region where poor, especially tribalcommunities, are located.Further, a substantial part of the area constitutes upper catchments where checkingsoil-water erosion is important for sustaining and improving productivity of the soil.Besides these, there are two other factors that may help watershed development in thestate.(i) Relatively low level of commercialisation of agriculture, especially with
respect to use of chemical inputs. This may make it easy to promotesustainable farm practices through watershed programmes.
(ii) Noteworthy achievements in strengthening decentralised governancethrough reforms in the panchayati raj system.
It may, thus, be inferred that the problem in the state is not of resource availabilityper se, but that of management of the same. Recognising the potential the state ofMadhya Pradesh has undertaken a major initiative by setting Rajiv Gnadhi Missionfor Watershed Management (RGMWM), which has emerged as a single entityimplementing the largest number of micro watershed projectsin the entire country.As per the Guidelines prepared by the Ministry of Rural Development (MoRD)during 1994-95, 29 out of the 45 districts in the state were eligible for being coveredunder different projects viz; EAS, IWDP, and DPAP. Besides this, other majorwatershed projects being implemented in the state include National WatershedDevelopment Project for Rainfed Area (NWDPRA), River Valley Projects, and otherdonor agency supported schemes.Apart from watershed projects, the state has already made a major headwaythrough Jal-Aabhishek Abhiyan. The link between WDPs and Jal-AabhishekAbhiyan needs to be strengthened. M.P. is also one of the high priority states for anumber of centrally sponsored schemes that focus on enhancing agriculturalproductivity and reducing resource degradation. This opens up a huge opportunityfor convergence not only across different watershed projects, but other initiatives inthe field of natural resource development and livelihood enhancement at state,district and sub-district levels.By now about five million hectares of land have been covered under the three majorprojects viz; RGMWM, NWDPRA, and RVP. Though, there is no systematic database for coverage of different WDPs in the state, the available information indicatesthat RGMWM is the single largest contributor accounting for nearly 66 per cent ofthe area covered by the three projects. This is followed by NWDPRA (20 per cent)and then by RVP (14 per cent).
9
3. Spatial Distribution: Complementarity and PrioritisationThe three projects viz. RGMWM, NWDPRA, and RVP have been, by and large,implemented in a manner that avoids duplication of efforts, each one of themcatering to specific areas on priority basis. However, it is likely that there is notmuch of synergy between various programmes because first, the projects arebeing planned within the context of departmental priorities; and secondly, the unitfor planning is generally milli and/or micro watershed rather than a stream or riverbasin. In absence of synergy, the actual achievements of the programmes mayhave remained sub-optimal, notwithstanding the effective implementation of themicro/milli-watershed projects.WDPs under RGMWM have been concentrated mainly in twelve districts �Bhind, Chhindwara, Dhar, Jhabua, Khargaon, Ratlam, Raysen, Satna, Shahdol,Sheoni, Shivapuri and Sidhi. NWDPRA, on the other hand, is concentrated ineleven districts � Betul, Chhindwara, Guna, Indore, Jabalpur, Jhabua, Khargaon,Mandla, Mandasaur, Satna, and Shajapu. This suggests complementaritybetween the two major programmes for which areas have been broadlydemarcated.The two projects together cover 19 out of the 26 districts identified as those�deserving� priority when viewed in terms of bio-physical as well as socio-economic criteria (including irrigation). This suggests that the prioritization (laiddown in the guidelines, explicitly or implicitly) has been by and large adhered toat least at the level of districts. A more disaggregated analysis of blocks withinJhabua district also by and large confirms the pattern. It is however, imperativeto examine the reasons for the neglect of seven districts so as to be able to makenecessary corrections at the stage of planning as well as implementation. Theseven districts are: Betul, Shajapur, Guna, Vidisha, Chhatarpur, Damoh,Khandawa, and Shajapur.Overall, therefore, the spatial distribution of WDPs under RGMWM andNWDPRA suggests that (a) there is complementarity in coverage of districtsbetween the two major projects; and (b) there is a fair amount of correspondencebetween economic deprivation and concentration of watershed treatment.To make the various watershed projects work in consonance with each other andat the same time contribute to the norms of prioritization as well as sequencing,based on multiple-criteria, it is essential that information below district level bemade available in the public domain.
4. Approaches and Achievements: Comparison of RGMWM and NWDPRAApproaches:A cursory review of the Tenth Plan and its constituent annual plans of the statereveals that the watershed programme figures much more prominently in theplans of the Department of Rural Development under the RGMWM than in theplans of the Department of Agriculture. An attempt is made to look at the natureof evolution of the programmes run under the MoRD from 1995 by comparing thestated objectives as provided in the different guidelines and try to contextualisethis vis-à-vis the NWDPRA guidelines of 2000.Though in spirit the watershed programmes undertaken by different ministrieshave sustaining livelihoods of the poor as an objective, from the 2001 guidelines,equitable distribution of benefits from land and water management activities donot appear as explicitly stated core objective.
1 0
The objectives of RGMWM are in conformity with the central government guidelinesfor both the Ninth and the Tenth Plans. The Mission�s articulation of the need tomaximise people�s participation stems from the explicit purpose of making thescheme more effective and transparent. The key difference in the evolution of thecentral government and the Mission�s thrusts is that while the former dilutes theequity principles in some sense over time, the Mission strengthens the same.The Mission suggests demarcation of three zones within each milli-watershed: therecharge zone, the transition zone, and the discharge zone. The first zone with highgradients and greater susceptibility to soil has been identified as the zone requiringthe most intensive treatment. There is thus an inbuilt principle of prioritisationwithin the milli-watershed in the Mission document of 1995, at least with respect tothe intensity of work to be done.Some of the more recent changes (post-2002) undertaken either directly orindirectly under the institutional structure of RGMWM have attempted to incorporatenew aspects that minimise weaknesses and make missing elements good. Anelement of convergence has been brought about by bringing 18 districts � thedistricts that have received funds earmarked for the National Rural EmploymentGuarantee Scheme (NREGS) � of the state into the fold of the watershedprogramme. Although major differences have come to the fore as a result of theconvergence of funds, it has enabled the state government to sidestep the HariyaliGuidelines. The MP government has appointed NGOs as PIAs and allocatedRs.8000/- per hectare for the programme as against Rs. 6500/- allowed under theprovisions of the Hariyali guidelines.Pani Roko Abhiyan is a water-conservation and harvesting movement that wasinitiated after the widespread kharif drought in 2001. This movement wasundertaken by the RGMWM in all non-watershed villages so as to reduce the gapbetween immediate needs and the pace at which watershed projects can reach outall the areas even within the priority districts/blocks. This is important from the viewof convergence provided, there is a perspective planning and continuity betweenPani Roko Abhiyan and WDPs.Achievements:The major benefits (as reflected through various evaluation studies conductedexternally as well as in-house) of the implementation of watershed programmes inthe state can be summarised in terms of:
Increased availability of water through water harvesting structures andenhanced crop survival during mild drought.Significant awareness for harvesting and conserving water, inducing privateinitiatives.Positive demonstration effect of the relatively more successful and sustainingWDPs.Given the hilly and undulating terrain, the watershed structures have by andlarge yielded substantial benefits to about 8-10 farmers per structure. Thebenefits have resulted in increase in number of waterings, increased croppingintensity, and change in cropping pattern in favour of more water intensivecrops.
Limited Impact:Participation of the local community in the watershed projects in the state isgenerally weak and has undermined the objective of equitable distribution of

1 1
benefits of the project. Like other states, there are some success stories, but theseefforts have not been scaled-up adequatelyBroadly speaking, the findings are in conformity with the general perception thatwhile the GOs have done better in terms of watershed works, the NGOs have beenmore successful in terms of community organisation. This provides a scope to lookinto GO-NGO partnerships in future, both within and outside the Hariyali framework,since each has its own area of core competence and the two are to a large extentcomplementary.Another important gap is the lack of co-ordination between the forest and therevenue department on the issue of treating the forest area within the watershed.This hampers the efficacy of watershed projects especially if the upper catchmentsremain untreated or degraded.The rich and diverse experience from various watershed projects in Jhabua leadsone to expect certain tangible impact at district level. We have tried to ascertain thisin the light of the changes that have taken place in the indicators like area undercrops, yield, and cropping pattern. Based on the secondary data, the analysis tries toexamine the changes in a comparative framework where the scenario in Jhabua iscompared with two other districts viz; Khandwa and Khargaon belonging to the sameAgro-Ecological Region, i.e., Nimar Plains. However, while Jhabua has a WDPcoverage of almost 40 per cent, the Nimar Plains have about 10 per cent coverage,making them a suitable case for comparison across space and time. It is observedthat from 1994-6 to 2000-1, the proportion of net sown to geographical area haddeclined marginally in all three districts. Similarly, cropping intensity had undergonea decline in all three districts. What is however, noteworthy is that the decline incropping intensity was steepest, with the lowest level in Jhabua. With respect to cropyield, the picture is somewhat similarWhat is however, interesting is the change in cropping-pattern. It is observed thatwhereas Khargaon has registered an increase in the area under crops like cotton,oilseeds, and soyabeans, the crops that have gained in terms of area in Jhabua aresubsistence crops.
5. Emerging Issues and Future Directions:The experiences suggest that whereas there is increasing awareness and interestamong peoples in WDPs, the project by and large suffers from clear resultorientation. At this juncture when the Rural Employment Guarantee Act is already inplace, and WDPs is one of the most important thrust areas for the activities to beplanned under the employment programme, it is essential that the lessons learntfrom the past experience be incorporated in future planning. Following issues needspecial attention in this context:
Adopting a holistic approach by coordinating various watershed programmestaking a larger watershed unit, and multi-layer units within that for evolving aperspective planning.Putting information about treated and planned micro watersheds in publicdomain so as to help enhancing transparency in planning and implementation.Link with RVP and Forest watersheds should be established keeping theupstream-down stream perspective in place.Setting up priority of treating CPLRs including the degraded forestland within amicro watershed as an important pre-condition for undertaking the WDP-implementation.

1 2
PIAs may not immediately withdraw after completion of the project. There is aneed to dovetail other programmes where the NGOs/PIAs could continue theirinteraction with the village communities, especially in order to hand hold thecommunity based organisations created under the project.The scope for creating larger water harvesting structures or regeneratingdegraded forest/other land could be linked with minor irrigation and forestdepartment respectively; same may apply for schemes for providing drinkingwater in the WDP villages.
A multi-stakeholder platform may help identifying and addressing conceptual aswell as practical issues such as these. While there a couple of networks of WDP-parishioners, these networks need to be strengthened and represented in the statelevel coordinating committee as part of the process of broadening its base.
1 3
Introduction
1.1 ContextThe disparity in agriculture that existedbetween predominantly irrigated areasand rainfed/ dry land areas, especiallyin the post-Green Revolution era,stemmed from the fact that the latterhave been neglected both in terms ofpolicy interventions and allocation offunds, notwithstanding the repeatedpleas for attaining greater regionalbalance thorough planned economicdevelopment.A major policy response to address theissues of rain-fed/dry land agriculture,which covers nearly two-thirds ofcultivated land in the country, came inthe early nineties in the form ofWatershed Development Programmes(WDPs). Besides cropland, pasturesand forests are important constituentsof various agro-ecological systems inthe country. They play a critical role insupporting livelihoods of ruralcommunities, particularly in rain-fedand dry land regions. WDPsessentially seek to integrate thesebasic activities within a farmingsystem by reviving and strengtheningthe symbiotic relationship betweenland, water, and vegetation.Integration thus becomes a coreconcept, which distinguishes WDPsfrom several other natural resource-based development programmes(Shah, 1998b). Another special featureof the programme is that it is multi-functional and its important outcomesviz., productivity, sustainability, andequity, are interconnected.
Chapter 1 Over the past one-and-a-half decade,the programme has moved veryrapidly in terms of conceptualrefinement and scope and achieved anumber of multiple and fairly complexobjectives. A large volume ofpractical experiences in implementingWDPs is already available (Shiferawand Ade, 2003). From the margins ofrural development practice and alimited focus on soil and waterconservation, the concept ofintegrated watershed developmentand management has emerged todayas the cornerstone of ruraldevelopment in the dry and semi-aridregions of India. What began as a setof diverse and isolated experiments inSukhomajri, Ralegaon Siddhi and theOperations Research Project of theIndian Council for AgriculturalResearch (ICAR), wasinstitutionalised initially in the form ofthe National Watershed DevelopmentProgramme for Rainfed Areas(NWDPRA) in 1990. Following theHanumantha Rao Committee�s reviewin 1994 and the formulation ofCommon Guidelines, the period 1995-2001 saw the implementation of thefirst generation projects under theseguidelines on a very wide scale. Moreimportantly, it is now acknowledgedthat integrated watersheddevelopment must be the corestrategy for stabilising rural livelihoodsin dry and semi-arid regions.
1.2 Departure from SectoralApproachRural development programmes inIndia had adopted the sectoralapproach until the advent of thewatershed approach. Under thesectoral approach, plans and policiesare separately formulated for eachtarget area. Sector-basedprogrammes have, for example, soiland moisture conservationprogrammes for environment;intensive area developmentprogrammes for agriculture, andemployment guarantee schemes forlivelihood sustenance. The watershedapproach marks a major departurefrom such an approach in that it draws
1 4
2The size of amicro-watershedranges between500 to 1000hectares.Experienceshows that inmany cases, forthe sake ofadministrativesimplicity, this istaken to becoterminous withthe villageboundaries.3The size of amili-watershedranges from5,000 to 10,000hectares.
its strength from the assumption thatthere is a systemic relationshipbetween environment, production andlivelihood sustenance. The two differ inthree major aspects. First, since thepossible linkages between the threeissues are neither explicitly norimplicitly considered in the sectoralapproach, the programmes based on itare characterised by duplication ofefforts and lack of coordination. Thesecond difference emanates from thefirst; while the watershed approachtakes the geo-hydrological unit of awatershed as the functional unit, thesecond takes administrativeboundaries (often blocks or districts)as the unit of operation. A thirddifference, i.e., the difference in theirspatial focus manifests itself in themode of implementation of these twoapproaches. Most of the public fundingwas channelised to the irrigated areasin the second phase (sectoralapproach) due to the emphasis onproduction enhancement in theseareas. The semi-arid rainfed regionsreceived comparatively much lesspublic funding through sporadicimplementation of employmentguarantee schemes and soil andmoisture conservation schemes. Withthe watershed approach, theimbalance of public spending wassomewhat corrected as the funding forenvironmental activities, productionincrease and livelihood sustenancewas pooled and systematised underone head of watershed programmes.These programmes are currentlyconcentrated in the rainfed areas, inprinciple the same approach couldprobably equally be applicable inirrigated areas.Though theoretically the watershedapproach appears to be a soundoption, there are operationaldifficulties; it is still implemented bythree different ministries in theGovernment of India, i.e., the Ministryof Agriculture, the Ministry of RuralDevelopment and the Ministry ofEnvironment and Forests, which retaintheir respective sectoral domains interms of the focus of their operation 1 .Multiple departmental handling ofwatershed projects is a hindrance tointegration that is meant to be
achieved under the watershedapproach.By 2005, major watershedprogrammes under the Ministry ofAgriculture and the Ministry of RuralDevelopment, Government of Indiahad invested approximately Rs. 180billion and covered nearly 45 millionhectares of land in different parts ofthe country characterised by desertsand drought-prone areas,predominance of wastelands and a lowpotential for rain-fed agriculture.Implementation of numerous WDPshas left a rich experience in its wake.There has been a variety of learningsfrom its mixed bag of successes andfailures. A number of studies havetried to summarise and synthesiseexperiences and outcomes ofwatershed programmes from differentparts of the country (Kerr, 2002; Joyand Paranjape, 2004; Shah, 1998a;Deshpande and Narayanmoorty,1999). The recent report of theParthasarathy Committee, �FromHariyali to Neeranchal� (GoI, 2006) isbuilt on this vast and varied experienceand sets the stage for the next phaseof watershed development in India.The first phase saw the beginning ofnew conceptualisation, setting up ofimplementing mechanisms, andresolving teething troubles. Thesecond phase was the time forconsolidation of experiences andsmoothening of the path ahead. Thethird and the present phase marks abeginning of the realisation forconvergence of objectives and focalareas; programmes; and organisationsand agencies involved at differentstages of watershed development.The process of convergence requirescreating a larger picture so that thenature, magnitude, andinterconnectedness of the issues andsolutions � many of them may gobeyond the scope of micro- 2 or mili-watershed 3 projects � may be gauged.Some of the important concerns in thiscontext are:
Prioritisation within the broadlyearmarked areas for eachprogramme
1 While theMinistry ofAgriculturefocuses primarilyon cultivated andthus owned landin theirwatershedprojects, theMinistry of RuralDevelopmentgives importanceto wasteland andcommon land.The Ministry ofEnvironment andForests primarilytreats the areacoming under thejurisdiction of theForestDepartment.
1 5
Upstream-downstream dynamicsImpact on water balance andground water profilePromotion of sustainable farmingpracticesEquitable sharing of benefits,cross-subsidisation, and cost-sharing or future investmentsSustainability of watershedtreatments and institutionsUpward linkages with markets onbetter terms
Creating a larger picture of watersheddevelopment involves a number ofactivities: preparing a data-base,reviewing various experiences,understanding administrativeproblems, exploring alternativeinstitutional mechanisms, and creatingmulti-stakeholder platforms forexchange of information, experiences,and policy feedback. It is towards thislarger goal, that the Forum forWatershed Research and PolicyDialogue (ForWaRD4 ) has undertakeninitiatives in Maharashtra, MadhyaPradesh, and Karnataka. The presentpaper is a part of the larger set ofstudies undertaken by ForWaRD.The present study aims at preparingan overview of the various watershedprogrammes in Madhya Pradesh. Itwill have a comprehensive analysiscovering different typologies ofwatershed projects which may helpbridging critical gaps in developing aholistic understanding of watersheddevelopment in the state (Shah, 2005).Besides collating major findings fromthe already existing literature coveringspecific projects in different areas ofthe state, the study seeks to addressthe concerns about convergence asnoted above. The idea is to go beyondstocktaking and highlight some of thenew challenges that are likely toassume critical importance whilescaling up. The aim is also enhanceeffectiveness of the programmes byattaining better convergence.
1.3 Stock Taking: Imperatives for aConceptual FrameworkOver the past decade a number ofstudies have been conducted whichhave examined the impact of variouswatershed projects in the country.Most of these studies have beenundertaken as a part of themonitoring/evaluation exercises,mainly at the instance of fundingagencies, both governmental as wellas non-governmental. There are alsoa number of independent studies ofwatershed projects funded by differentagencies that attempt to capture theirimpact and link up with the largerissues of productivity and livelihood,equity, decentralisation, and resourceas well as institutional sustainability(Shah, 1998a; Kerr, Pangare, andPangare, 2002; Joy and Paranjape,2004). The independent studies,despite being rich in content andanalytical in approach, do not helpcreate a larger picture of what hasbeen actually achieved by numerouswatershed projects in different parts ofthe country. A mosaic fails to emergefrom these studies because first, thereare a number of methodologicaldifficulties in gauging the actualimpact of WDPs (Dar, 2003); andsecondly, proper base-line data �essential for a fairly robust, if notscientifically most accurate,assessment of the outcomes � are notavailable. There is, of course, anadditional difficulty arising from thefact that watershed development is acontinuous process, rather than atime-bound project with a well-definedset of activities and clearly earmarkedfunds.Notwithstanding these limitations, thestudies suggest that: (a) a largenumber of water harvesting structureshave been created which haveenhanced irrigated area and, at times,helped in crop survival duringextended dry spells; and (b) theproject has provided an impetus forsetting up local institutions as a resultof participatory processes built intothe programme though, its impact onmaintenance of structures andbenefit-sharing is yet to be realised.
4 ForWaRD is aconsortium ofthreeorganisations �Society forPromotingParticipativeEco-systemManagement(SOPPECOM),Gujarat Instituteof DevelopmentResearch(GIDR), andCentre forInterdisciplinaryStudies inEnvironment andDevelopment(CISED).

1 6
The studies also highlight the fact thatapart from irrigation-inducedimprovement in productivity and netreturns, there is a limited impact onsustainable livelihoods among the poorand on environmental regeneration. Asa result, watershed projects alreadyimplemented or in the process ofimplementation, are characterised bycertain critical missing links, forinstance, regeneration of CPRs anddegraded forest in a large number ofwatershed projects (Shah, 1998b).What is a matter of greater concern isthat in most cases the environmentalimpact is captured only throughindirect measures (Chopra, 1999).Even if environmental regenerationtakes place, the requisite mechanismfor ensuring that the additionalresource, e.g., water for irrigation isdistributed evenly and used efficiently,is seldom present. Since theconventional impact assessmentfocuses mainly on benefit-cost ratio ata village or micro-watershed level, itdoes not capture these issues despitethe fact that the Ministry of RuralDevelopment (MoRD) as well as theMinistry of Agriculture (MoA), havingrecently adopted the participatoryapproach for watershed development,consider efficiency in use and equity indistribution particularly relevant forimpact assessment.Overall, it appears that though theexisting studies do bring out somepositive effects of various watershedprojects, the findings are notconclusive. Based on a brief review ofevidence from the first batch ofwatershed projects under the MoRD,Rao (2000) noted that �from all theseevaluations, one does not get a directindication of soil conserved throughwatershed development � and that itwould be useful to develop indicatorsand methodologies to captureseparately the improvement in soilstatus� (p. 3945). Similar observationscould also be made about the impactin terms of sustainability of (a)productivity gains and their distributionacross regions and households; and(b) participatory institutions to addressthe missing links.Attempts have also been made to
assess the impact of participatoryapproaches. A recent study of projectimplementation under MoRDsuggested that a lack ofimplementation capacity was themajor reason for poor performance ofthe project. However, training alonemight not be adequate to overcomethe insufficiency as the incentives toparticipate in training may be weak(Farrington, Turton, and James,1999). What causes concern is thatsuch limitations arise even in thecases where the projectimplementation has been fairlyparticipatory. The need therefore is tounderstand the dynamics of threeinter-related aspects as has beenattempted more recently by Reddyand Soussan (2003) and Shah (2004).
1. 4 Emerging Issues andNormative FrameworkThe existing literature raises certainimportant issues that need carefulprobing. First, the composition ofwatershed treatments, covering bothpublic as well as private land, needs acloser look before the economic aswell as environmental impact of theprojects are assessed. To the extentthat the choice of treatments isgoverned by the structure ofeconomic incentives, a large part ofthe common property resources(CPRs) is likely to receive a lowerpriority. First, ensuring bettercoverage of treatments like pasturedevelopment, plantation on degradedlands, drainage line treatment,renovation of village tanks, andcommunity based drinking waterfacilities may need a carefully workedout incentive structure. In addition,administrative difficulties will have tobe addressed to improve effectiveaccess to the CPRs.The second aspect relates to sharingof benefits not only across villagesand communities but also amonglanded households within a micro-watershed. It is quite likely that in thesuccessful projects with an overallfavourable benefit-cost ratiosignificant economic returns accrue

1 7
only to a handful of landed householdswithin the watershed community. Thisaspect needs probing; so does theimpact in terms of reduced uncertaintyof yield in a large number ofunirrigated farms.Thirdly, benefit-sharing, especially interms of irrigation water, is closelyrelated to the technology of waterconservation as well as its utilisation.While harvesting rainwater isessential, to meet both economic andenvironmental objectives, the waterharvesting structures have to beplanned in the light of the geo-hydrological factors that operate at thelevel of river or sub-river basin. Atpresent, some of these vital watershedtreatments are planned and executedmainly at the micro-watershed levelwithout taking into consideration theirbeing an integral part of the largersystems. If carried out in a haphazardmanner, check dams and othertreatments on the drainage line mightcreate distortions in the geo-hydrological systems downstream.These issues are often overlooked inthe planned implementation as well asmonitoring of the watershed projects.Further, apart from water andirrigation, some of the agronomicpractices like mulching, inter-cropping,trenching, adding manure and othervegetative measures need to beemphasised in watershed projectssince these practices in combinationwith efficient use of water can lead to anew farming system which could beeconomically as well asenvironmentally sustainable andsocially equitable. The need is to lookat the technological potential and thecommensurate incentive structures forthese measures to promotesimultaneous adoption. This maywarrant fresh thinking in terms ofcross-subsidisation across bothwatershed treatments and households.This leads to the final issue of initiatinga process of negotiation within andacross micro watersheds. At presentthe issues of effective participation,sharing of costs and futuremanagement continue to remainelusive even in some of the better
performing projects. Partly theproblem arises because the operationis in the project mode, and partlybecause in the given time-frame forimplementation and evaluation, notmuch has been learnt about themechanism that can work beyond theproject mode in terms of funding,organisational support and monitoring.The present review examines theexperiences of the various watershedprogrammes in Madhya Pradesh andbrings to light the issues noted abovethrough the lens of a normativeframework adopting three importantinterconnected themes ofsustainability, livelihoods, and equitythrough participatory principles. Anelaboration of the four issues oflivelihoods, sustainability, equity andparticipation, as we understand them,is given below (adopted from Joy andParanjape, 2004).The understanding of sustainability, inour view, is limited to �environmentalsustainability as mediated by humanintervention�, and this is consistentwith our assumption about theprimacy of the role of natural capital insupporting livelihoods. Thus, from thisperspective, watershed developmentshould focus on �conserving naturalcapital independent of all other formsof capital�. This would includeinterventions that ensure sustenanceof increased levels of productivity onthe basis of a well-maintainedresource base. A possible conflictmay arise between the aims toincrease productivity by increasingphysical or financial capitals on onehand and conserving the naturalcapital on the other. If it does, it willhave to be resolved by the institutionalstructure adopted within theframework of WDPs. The primacyaccorded to the natural capital wouldrequire that the productive planning ofthe watershed be �done within theannual renewability limits�. In �badyears� some transfers from the stockof resources may be permitted tosustain livelihoods, with theunderstanding that the stock would bereplenished in the �good years�.

1 8
Livelihood encompasses buildingcapabilities and assets to generateactivities to support a basis for living.Some distinction has been madebetween basic needs and livelihoodneeds on the basis of whether they areunmediated or imposed with relation toproduction. In the normativeframework, natural capital is accordedprimacy over social, physical, humanand financial capital in supportinglivelihood needs. The relationshipbetween natural capital and livelihoodis not predictable � a decrease in thebase of natural capital may not alwayslead to an adverse livelihood status.For example, a reduced naturalresource base may induce a farmer toadopt better cultivation managementpractices (Chadha, Sen, and Sharma,2004). Or, as is generally expected, agreater amount of production forcedfrom smaller portion of land may leadto �soil-mining�.Equity issues are intrinsically linkedwith nature of participatory institutionsbuilt within watershed interventions.The principle of equity applies to wideranging issues relating to access tonatural resources and sharing of gains,and it requires one to take cognizanceof the disabilities created by class,gender, caste, and ethnicity. Naturalresources that are not privately ownedhave the potential to play a key role inreducing disparities across householdswithin a watershed. While it isdesirable that the entire stock ofnatural resources is shared equitably,the least that the participatoryinstitutions ought to ensure is that theincremental resources generatedthrough the interventions are sharedfairly. While a democraticallyconstituted watershed institutionshould be in a position to intervene inthe issues regarding encroachment ofCPRs for cultivation, or sharing offorest products, it may be difficult to doso in heterogonous societies riddenwith class and/or caste conflicts. Inrelatively homogenous societies, likemany tribal communities in MadhyaPradesh, the participatory institutionswould have far greater potential toapply the principle of equity in many ofthe above-mentioned settings.
It has been recognised that water isboth a local and non-local resource(Joy and Paranjape, 2004). Modifyingwater regimes in any watershedirrespective of its size has basin-wideimplications. Since the current policiesof watershed developmentconcentrates on micro-watersheds,their downstream impact appears asan externality which should beconsidered as a systemic effect. Fromthis perspective, it is desirable thatmilli-watersheds be taken up forwatershed development from thehighest lying upland to lowland,conforming to the ridge to valleyprinciple (Joy et al, 2006). Thedecision regarding the scale ofoperations is extremely difficult tomake since trade-offs are involved ingoing from micro to meso and macro(micro-watershed to basin) betweenmanagerial problems and capturingoff-site externalities.In our review, we see participation asa means to enable the localcommunity to make informed choicesand ensuring more equitable,sustainable and efficient outcomes.However, it is important to viewcritically the constituents of localcommunity that are engaged in thedecision making process. Ourexpectations are that homogenoussocieties would respond verydifferently to opportunities ofparticipation available within theframework of watershed programmesas compared to heterogeneoussocieties. Since, in their current form,the WDPs necessarily requirepartnership in some form with outsideagencies (governmental and non-governmental organisations,international donors, etc.), the natureof this collaboration is bound to affectthe efficiency of the participatorycommunities within the watersheds. Inthis context, the increased importanceof the institutions of local selfgovernment � panchayats� as broughtabout by the Hariyali Guidelines in2003 is expected to change somewhatthe participatory dynamics.
1 9
1.5 Methodology and ApproachThe main purpose of this study is toreview the experiences from variouswatershed programmes implementedduring the past one-and-a-half decadein Madhya Pradesh with a specificfocus on convergence that cuts acrossactivities within a watershed project,various watershed programmes, andother developmental programmesrelated to natural resource-basedlivelihood enhancement. The reviewemphasises three aspects viz., theapproach, the implementationmechanisms and processes, and theoutcomes5 . It may be noted onceagain, that the aim is not to evaluatethe performance; rather the idea is tolearn from the experiences and movetowards convergence at various levels.The analysis is based on datagathered mainly from existingliterature (published as well asunpublished), discussions with keyinformants (policy makers,implementers, and other experts), anda few field visits. Given the limitationsof information and other material in thepublic domain, the review does notmake any categorical statementsabout the actual outcomes or impact ofdifferent watershed programmes in thestate. Many of the observations andconclusions are indicative; they needto be discussed further in various fora.Moreover, the review suffers fromcertain data gaps pertaining to thecoverage as well as other details onwatershed programmes (e.g., noCAPART-supported projects havebeen studied). Since there was hardlyany information/material available(with reasonable amount of efforts),the review is somewhat tilted towardsthe watershed projects implementedby Rajiv Gandhi Mission forWatershed Management (RGMWM),which is the largest watershedprogramme not only in the state, butalso in the country.The analysis in the report isundertaken at two levels. First, weattempt to review the WDPs for thestate as a whole. Since the availablematerial is inadequate to develop acomprehensive review, we have added
a case study of Jhabua district to ourreview to fill in some of the gaps.Jhabua was selected for the casestudy for two reasons. First, thewatershed work in Jhabua district hasbeen most extensive, the coveragebeing nearly 38 per cent of the totalgeographical area of the district (asagainst 12 per cent in the state as awhole). This implies that theinvestment in the district under thehead of land developmentprogrammes have been the highestper unit area. Secondly, probably dueto the above reason and also due tothe fact that the district has thehighest concentration of tribalpopulation (as high as 86 per cent asagainst 20 per cent in the state), muchmore reference material is availableon the district than what is availablefor rest of the state. While drawingconclusions for the state as a wholeon the basis of data available onJhabua is not warranted, we felt thatthe availability of more material andthe assessment based on it couldhave implications and lessons forother parts of the state.The database of this report has been(a) the collection of state-related andJhabua-related documented material(reviews undertaken by Taru LeadingEdge and Centre for AdvancedResearch and Development (CARD)for the RGMWM, (b) interviews withkey persons which include officials inthe Central Government (the PlanningCommission, the Ministry of RuralDevelopment, and the Ministry ofAgriculture), the State Government(Departments of Panchayat and RuralDevelopment, and Agriculture),officials in different projectimplementing agencies (covering across-section of models), staff of non-governmental organisations likeNational Centre for HumanSettlements and Environment(NCHSE), Action for SocialAdvancement (ASA), Sampark, etc.,selected members of watersheddevelopment committees andbeneficiaries (again ensuringcoverage of programmes by differentagencies), and (c) preliminary fieldvisits in Raisen, Sehore and Jhabuafor a qualitative assessment of the
5 Since WDPsare beingimplemented bynumerousagencies, eachhaving its ownindividual modelto follow, theyare seen as justone more ruraldevelopmentprogrammeimplemented bythe samedepartments/agencies. As aresult, theimportance ofwatershedapproach asdistinguishedfrom thesectoralapproach isundermined,partly orcompletely. Thisactually makesa good case forusing theguidelines of ournormativeapproach toreview andvalidate therationale forconvergence oftheseprogrammes incomparing thedifferent modelsbeing followedin the state
2 0
nature of implementation of theprojects. It may be noted here thatcarrying out a systematic survey wasnot within the scope of our review. Thereview, as may be understood from theunderlying approach, is expected to bebroadly qualitative, and probablywould have no conclusive findings.Nevertheless, since published materialavailable is extremely scant, even askeletal status report would prepare abase for a policy dialogue betweenpractitioners and policy makers.Finally, it is hoped that it would providesome directions for future research inthis field.The analysis is divided into sixchapters including the introductoryone. This is followed by a briefdescription of the natural resourceendowment and livelihood scenarios inMadhya Pradesh so as to highlight thescope for watershed development in
different agro-climatic situations in thestate. Chapter 3 presents a bird�s eye-view of various watershedprogrammes in the state, anddiscusses the geographical spread inthe context of spatial prioritisation.The next chapter presents the statusof watershed projects in the statefocusing on the three broad aspectsviz.; policy approaches; processes/mechanisms for projectimplementation; and experiences fromthe point of view of productivity/livelihood, sustainability, equity andparticipation. Chapter 5 presents theexperience of Jhabua district as acase study and Chapter 6 summarisesthe findings which could provideinputs in the policy formulation,project planning and monitoringprocesses, and setting up of a new setof institutional mechanisms forimplementing and sustainingwatershed based development as anevolving phenomenon.

2 1
Locating Madhya Pradesh: Scopeand Challenges for WatershedDevelopment Programmes
Almost two-thirds of India�s cultivatedland is farmed as dry-land. Theseareas suffer from low productivity,their natural resources are subject todegradation, and their agriculture isvulnerable to risk and uncertainty(Joshi, et al., 2004). MadhyaPradesh constitutes a significant partof the vast tracts of dry-lands. Thetopography and other agro-climaticconditions in the state, however, offera fair opportunity for watersheddevelopment. Setting up of the RajivGandhi Mission for WatershedManagement (RGMWM) as a specialorganisational arrangement is apointer to the official recognition ofthe need as well as scope forwatershed development in the statewhich otherwise has remained fairlysubdued in terms its agriculturalgrowth and the associated povertyreduction (Shah and Sah, 2004).The section contextualises the stateof M.P. with respect to the status ofits natural resource base and theneed as well as scope for policyinterventions, especially within theframework of WDPs. Importantfeatures of the state�s naturalresources � the endowment, theirstatus, the pattern of resource-use,and its interface with rural livelihoods� are examined which leads to theidentification of some of the majorissues in watershed development inthe specific context of M.P.
Chapter 2 2. 1 Resource BaseM.P. represents one of the naturalresource-rich states in the country.Of the 14 major Indian river systems,M.P. encompasses the uppercatchments of seven and the state isthe source of all major river systemsof Central India. The proportion ofarea under plough (47.7 per cent ofthe geographical area) is almost thesame as that of all-India average(46.0 per cent) while the proportionof culturable waste and long termfallow land in the state (5.8 per cent)is marginally lower than that of thecountry as a whole (7.8 per cent).Remarkably, forests constitute afairly large proportion (28.1 per cent)of the total reported area ascompared to 22.4 per cent at the allIndia level (See Table 2.1, nextpage).M.P., with its vast geographical areahas a highly diverse natural resourcebase. The state receives an averageannual rainfall of 1150 mm. Since itis concentrated in the brief monsoonseason, most watercourses remaindry from January to June. As aresult, water availability dependscritically on the extent of waterstorage from surface water captureor groundwater.
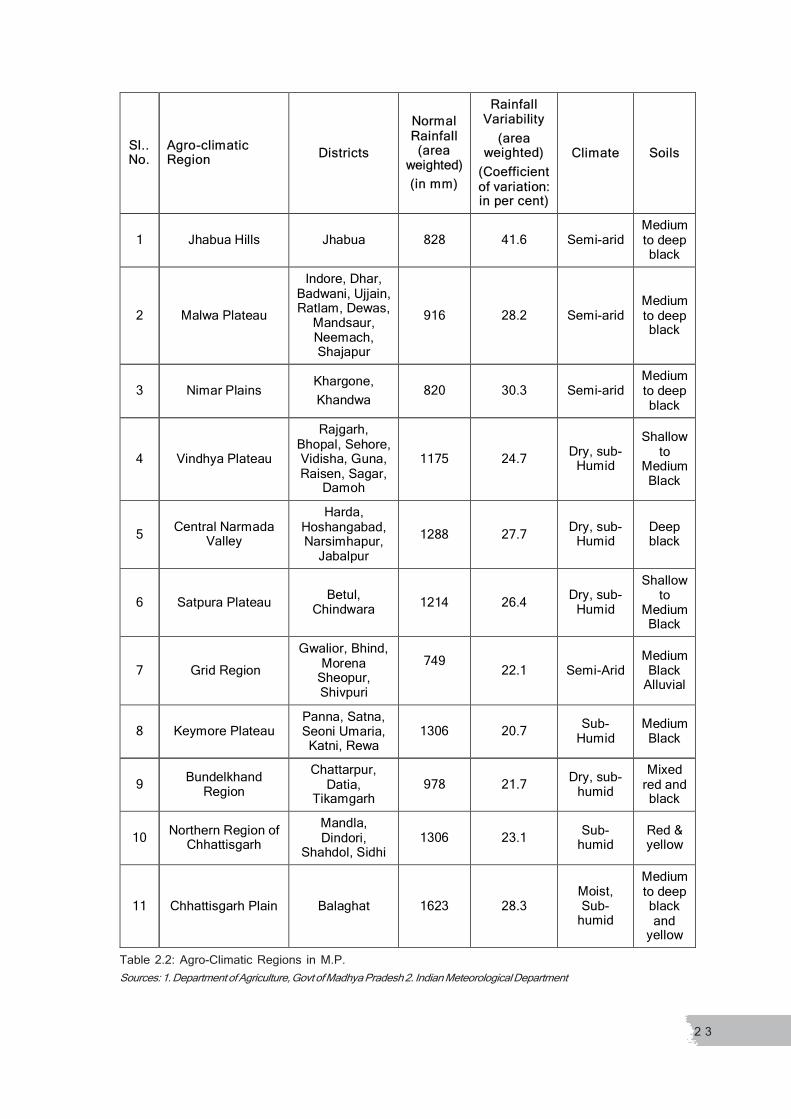
2.2 Regional VariationsThere are widespread regionalvariations within the state. Theaverage rainfall decreases from eastto west. The normal annual rainfallranges from 1570 mm in Mandla ofthe Chhattisgarh region in the east to668 mm in Datia in the west-centralgrid. However, there are variationswithin the pattern. For instance, therainfall is highest in the westernmostdistrict of Jhabua and lowest in theBundalkhand region and Keymoreplateau. Table 2.2 and Figure 2.1provide the agro-climaticcharacteristics of the state in detail.

2 2
Table 2.1:Land-UsePatternM. P. andIndia(2002-03)
Figures in �000ha except in therows titled�average landholding� and�Concentrationratio�Figures inparenthesesindicate therespectivepercentage oftotal reportingareaSource:Directorate ofEconomics andStatistics,Ministry ofAgriculture(2004) andCentre forMonitoring IndianEconomy (2005)
MM..PP.. IIndndiiaa
Forests 8655 (28.14)
69407 (22.66)
Not available for cultivation 3237 (10.53)
42828 (13.98)
Permanent pastures and other grazing lands
1585 (5.15)
10897 (3.56)
Land under miscellaneous. tree groves (not included in
NSA) 20
(0.07) 3366 (1.10)
Culturable wasteland 1201 (3.91)
13660 (4.46)
Fallow land other than current fallows
575 (1.87)
10191 (3.33)
Current fallows 818 (2.66)
14799 (4.83)
Net area sown 14664 (47.68)
141101 (46.07)
Gross area sown 17870 (58.10)
187009 (61.06)
TToottaal l RRepoeporrttiing ng AArreaea 3075530755 ((100100))
306249306249 ((100100))
Average land holding 2.6 1.4 Concentration ratio 0.65 0.71
Region 1 Region 7 Region 2 Region 8 Region 3 Region 9 Region 4 Region 10 Region 5 Region 11 Region 6
Source:Madhya Pradesh, Department of Agriculture
2 3
SSll.. .. NNoo..
AAggrroo--cclliimmaattiic c RRegegiionon DDiissttrriiccttss
NNoorrmmaal l RRaaiinnffaalll l
((aarrea ea wweeiigghhtteedd)) ((iin n mmmm))
RRaaiinnffaalll l VVaarriiababiilliittyy
((aarrea ea wweeiighghtteedd))
((CCoeoeffffiicciienent t oof f vvaarriiaattiioonn:: iin n ppeer r ccenentt))
CClilimmaattee SSooililss
1 Jhabua Hills Jhabua 828 41.6 Semi-arid Medium to deep black
2 Malwa Plateau
Indore, Dhar, Badwani, Ujjain, Ratlam, Dewas,
Mandsaur, Neemach, Shajapur
916 28.2 Semi-arid Medium to deep black
3 Nimar Plains Khargone, Khandwa 820 30.3 Semi-arid
Medium to deep black
4 Vindhya Plateau Rajgarh,
Bhopal, Sehore, Vidisha, Guna, Raisen, Sagar,
Damoh 1175 24.7 Dry, sub-
Humid Shallow
to Medium Black
5 Central Narmada Valley
Harda, Hoshangabad, Narsimhapur,
Jabalpur 1288 27.7 Dry, sub-
Humid Deep black
6 Satpura Plateau Betul, Chindwara 1214 26.4 Dry, sub-
Humid Shallow
to Medium Black
7 Grid Region Gwalior, Bhind,
Morena Sheopur, Shivpuri
749 22.1 Semi-Arid
Medium Black
Alluvial
8 Keymore Plateau Panna, Satna, Seoni Umaria, Katni, Rewa
1306 20.7 Sub-Humid
Medium Black
9 Bundelkhand Region
Chattarpur, Datia,
Tikamgarh 978 21.7 Dry, sub-
humid Mixed
red and black
10 Northern Region of Chhattisgarh
Mandla, Dindori,
Shahdol, Sidhi 1306 23.1 Sub-
humid Red & yellow
11 Chhattisgarh Plain Balaghat 1623 28.3 Moist, Sub-
humid
Medium to deep black and
yellow Table 2.2: Agro-Climatic Regions in M.P.
Sources: 1. Department of Agriculture, Govt of Madhya Pradesh 2. Indian Meteorological Department

2 4
AAggrroo--cclilimmaattiic c RReeggiioonn Districts FFoorreesst t AArreeaa % % AArreea a uunnddeer r FFoorreesstt
Jhabua Hills Jhabua 130.4 19.3 Indore 52.2 13.6 Dhar 119.7 14.6 Ujjain 3.2 0.5
Ratlam 34.5 7.1 Dewas 205.7 29.4
Mandsaur 104.9 11.1
Malwa Plateau
Shajapur 6.8 1.1 Khargone 429.3 31.8 Nimar Plains Khandwa 511.6 45.7 Rajgarh 18.9 3.1 Bhopal 44.1 15.9 Sehore 172.8 26.3 Vidisha 105.7 14.5 Guna 152.0 13.8
Raisen 333.4 39.3 Sagar 288.7 28.2 Damoh 267.0 36.6
Hoshangabad 357.2 35.7 Narsimhapur 136.3 26.5
Vindhya Plateau
Jabalpur 173.8 17.2 Betul 395.8 39.3 Satpura Plateau Chindwara 479.0 40.4
Gwalior 109.5 21.0 Bhind 8.9 2.0
Morena 333.5 28.5 Grid Region
Shivpuri 330.5 32.5 Panna 299.4 42.6 Satna 203.5 27.4 Keymore Plateau Seoni 327.5 37.4
Rewa 67.0 10.7 Bundelkhand Region Chattarpur 214.3 24.8
Datia 20.9 10.5 Tikamgarh 66.7 13.2
Northern Region of Chhattisgarh Mandla 617.9 46.7 Shahdol 541.6 39.1 Sidhi 440.1 42.3
Chhattisgarh Plain Balaghat 505.6 54.7 MMadadhhyya a PPrraaddeesshh 88660099..99 2288..00
Table 2.3: Forest Area in M.P. Districts, 1997-98Note: Refer to undivided districts in the state.Source: Directorate of Economics and Statistics, Govt of MP

2 5
The relatively better rainfall profile(compared to several other arid andsemi-arid regions in the country)along with large forest areas andundulating topography in large partsof the state, prima facie, creates afavourable environment forwatershed development. As per theclassification developed by Fan andHazell (2000), three out of elevenagro-climatic zones in M.P. belong tohigh potential rain-fed region (whichcorresponds to the Agro-climaticZone No. 10 as classified by theICAR while the remaining zonesbelong to low potential rain-fedregions.
The state has a rich forest cover of8.6 million hectares (mha). Thegiven geographical distribution ofthe forest resources enhances theregional diversity of the statefurther. The eastern and south-eastern districts of Balaghat andMandla have relatively extensiveforest areas, while the districts inthe western and northern regionsare poor in forest cover (Table2.3). The distribution of forestresource in the state has acorrespondence with availability ofmoisture from natural sources.During the late nineteenth century,large-scale forest surveys wereundertaken to demarcate reserveforest areas. The first suchdemarcation in the country wasmade in the Central Provinces (M.P.was formed by integrating CentralProvinces and the princely states ofthe region after independence) in1865. These forests weredemarcated in remote areas tominimise disturbances to the localpopulation. In recognition of localrights, affected villages were settledoutside the reserve forest areas.Negotiations were held withlandlords for a majority ofuncultivated tracts of land and theywere recorded as dhar (forest) in therevenue records. These lands werelater either transferred to the state
government or to the rural poor.However, even today, the farmerswho were given these tracts of landare prohibited from changing itsmode of land-use, and this norm actsas a dampener to taking up privateforestry (GoMP, 1998).The National Forest Policy (1952)reflected appreciation of the multiplebenefits of forests. However,utilisation of forests for optimisingrevenue continued to remain thedominating aim for managingcountry�s forests while �conservation�of forests was a relatively minor partof forest development plan. This biasis visible in the manner in whichforest resources are classified by thestate till date. Only 5.4 per cent ofthe forest is presently classified as�protection forests� for soil and waterconservation work. more than 84 percent of the forest resources were�production forests�, further dividedinto major and minor forests(GoM.P., 1998) 6 .
2.3 Utilisation of Resource Baseand Agricultural PerformanceThough the state of M.P. enjoys afairly rich natural resource base, ithas faired poorly in its utilisation. Thecropping intensity of the state is only122 per cent as compared to the all-India average of 133 per cent. To alarge extent, a low vertical spread ofirrigation is responsible for lowcropping intensity, which is merely103 per cent compared to 137 percent for the country as a whole. Eventhe horizontal coverage (gross areairrigated to gross cropped area) ofirrigation is extremely poorcompared to the country as a whole(27 vis-à-vis 41 per cent).Consequently, 89 per cent of thedistricts in M.P. covering around 81per cent of its area are dry lands asper the methodology used by Shah,et al; (1998). These districts make up23 per cent of India�s 177 dry landdistricts and occupy 19 per cent ofIndia�s dry area.
6 Tree forestsare meant forindustrial andcommercialwood, whereassmall timber andfuel wood isallowed fromminor forests.(The forestcommunity isallowed to usetimber and fuelwood?

2 6
Due to the poor irrigation coverageand lack of adequate development indry land farming techniques, largeparts of the state are affected bydroughts almost every year. Over thelast sixteen years, the state hasremained unaffected by drought inonly three years (Table 2.4). It maybe further noted that during the lastthree decades in the districts ofeastern M.P., the average rainfallwas 10% lower than the averagerainfall recorded prior to 1970(GoM.P., 2000).
Looking at the two indicators viz.average rainfall (which is medium tohigh in most parts of the state), andthe variability over time and spacetogether, it becomes clear that themain issue is not so much adequacyof rainfall per se. Rather the issue ismore as of effective conservationand utilisation of water, especially totake care of uncertainty aboutrainfall. Watershed programmeshave a significant role to play in thiscontext.
In absence of interventions such asWDPs, the agricultural prospects in
Year No. of Districts Affected Per cent of Districts Affected 1991-92 23 47.9 1992-93 4 8.3 1994-95 4 8.3 1995-96 8 16.7 1996-97 5 10.4
1997-98 35 (affected by heavy rains) 72.9
1998-99 23 47.9 1999-00 10 20.8 2000-01 32 66.7 2001-02 06 12.5 2002-03 33 68.8 2004-05 20 41.7 2005-06 17 35.4
the state remain dismal (Shankar,2005). Under the circumstances, drycrops with fairly low level ofproductivity assume the centrestage in agricultural production, andthereby in the income of a largeproportion of rural communities. Forexample, M.P. is the single largestcontributor of soybean, gram,linseed, and maize to the country�spool. Whereas a number of states,particularly those within the Indo-Gangetic plains have been movingtowards specialisation in waterintensive crops like wheat andpaddy, M.P. has remained muchmore diversified in terms of itscropping pattern. Oilseeds andpulses figure prominently among thestate�s crops, whereas rice (a highlywater demanding crop), which is themost important crop at all-Indialevel, is only the fourth mostimportant crop in the state.
The poor irrigation facility has led tomuch lower yield levels in M.P.compared to rest of the country. Forinstance, in food grains as a whole,M.P. is a poor performer (1114 kg/hectare compared with 1667 kg/hectare for all-India for 2001-03
Table 2.4:Number ofDistrictsAffected byDrought inM.P.
Source:Department ofAgriculture,Government ofM.P.

2 7
triennium) and ranks fourth lowestamong states. In dry crops, however,the state performs far better. Theyield of coarse cereals for the state �1257 kg/hectare for 2001-03triennium � is higher than all-Indiaaverage of 1180 kg/hectare for thesame period.
The trend of food grain production inthe state is characterised by higherinstability, though it otherwise followsthe all-India trend closely (Figure2.2). The production in rain-fedagriculture is expected to follow therainfall fluctuations and M.P. is noexception in this regard.The poor spread of irrigation in thestate notwithstanding, the area underirrigation has increased by more thansix times over the last five decades.Most of this expansion has comeafter mid-eighties, unlike in the stateswith successful record of the greenrevolution where it took place in thesixties and seventies. While increasein the irrigated area from canal waterhas only been moderate during thisperiod, the rapid spread of irrigationafter mid-eighties has beencontributed primarily by minorirrigation sources, namelygroundwater and lift irrigationschemes. This trend however, ismore prominent in the western partsof the state. The eastern districtshave witnessed only a modest
Indices of Foodgrain Production
y = 8.3032Ln(x) + 89.625
R2 = 0.3836
y = 7.3855Ln(x) + 95.295
R2 = 0.4666
80
85
90
95
100
105
110
115
120
125
130
1990-91
1991-92
1992-93
1993-94
1994-95
1995-96
1996-97
1997-98
1998-99
1999-00
2000-01
2001-02*
2002-03
2003-04
index
year
s
India MP Log. (MP) Log. (India)
Figure 2.2:Indices ofFoodgrainProduction
Source:Directorate ofEconomics andStatistics, Govt.of India
increase in irrigated area after themid-eighties. In particular, there hasnot been much expansion of irrigatedarea in the tribal districts of theeastern region (GoM.P, 2000).Whereas the expansion of irrigationfacilities has aided areal expansionof wheat, mustard and gram in thestate, there has been a substantialreduction in area growing coarsecereals. There has been oneexception, though, the area forsoyabean, a dry crop, which wasintroduced in the state in early1980s, has expanded rapidly and ithas become the most important cropin the state.The productivity of irrigated cropshas either declined or stagnated.Productivity of rice has beendeclining in one of the major riceproducing districts of Balaghat whilethat of wheat has generallystagnated during the nineties andhas even declined in some districts.Gram is the only exception amongthe irrigated crops whoseproductivity has risen. (GoM.P.,2000).Notwithstanding the growingimportance of some of the irrigatedcrops in the state, according to theM.P. Human Development Report,1998, even if the irrigation potentialfrom surface and groundwatersources was fully realised, over 55per cent of the net sown area in the
2 8
state would still remain dependenton uncertain rainfall. Thusdevelopment of dryland farmingtechniques is of utmost importancein the state.
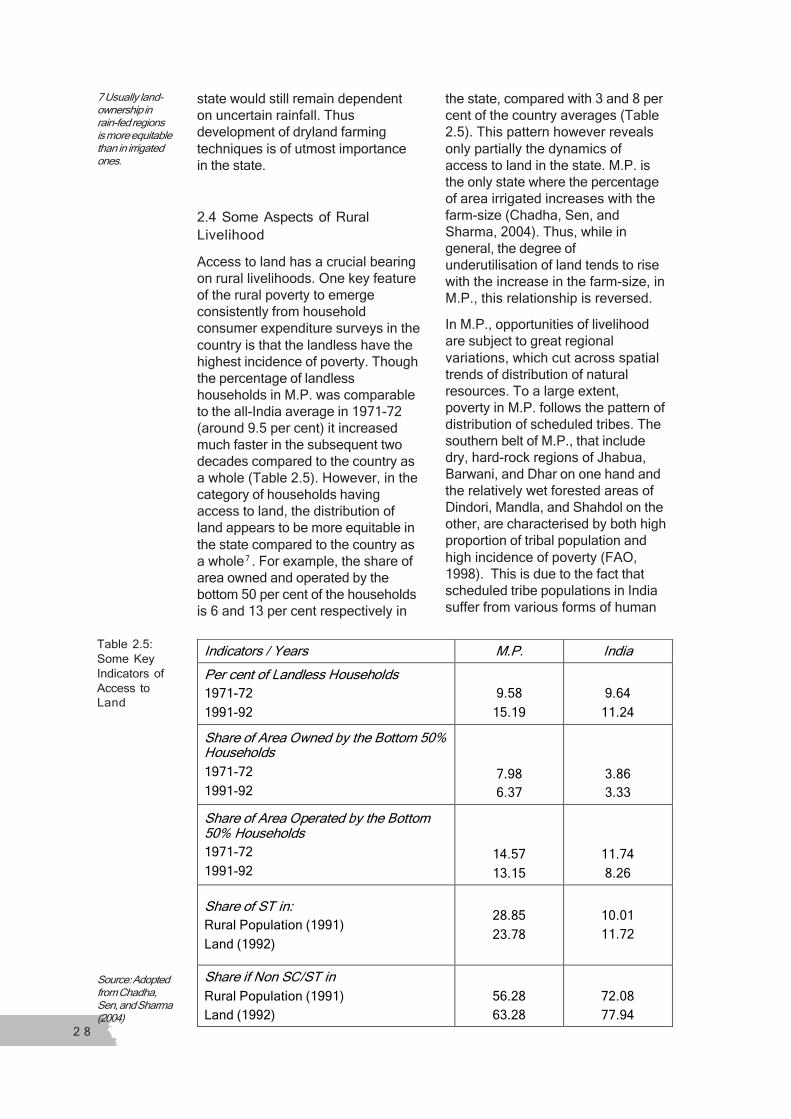
2.4 Some Aspects of RuralLivelihoodAccess to land has a crucial bearingon rural livelihoods. One key featureof the rural poverty to emergeconsistently from householdconsumer expenditure surveys in thecountry is that the landless have thehighest incidence of poverty. Thoughthe percentage of landlesshouseholds in M.P. was comparableto the all-India average in 1971-72(around 9.5 per cent) it increasedmuch faster in the subsequent twodecades compared to the country asa whole (Table 2.5). However, in thecategory of households havingaccess to land, the distribution ofland appears to be more equitable inthe state compared to the country asa whole7 . For example, the share ofarea owned and operated by thebottom 50 per cent of the householdsis 6 and 13 per cent respectively in
7 Usually land-ownership inrain-fed regionsis more equitablethan in irrigatedones.
Indicators / Years M.P. India Per cent of Landless Households 1971-72 1991-92
9.58
15.19
9.64
11.24 Share of Area Owned by the Bottom 50% Households 1971-72 1991-92
7.98 6.37
3.86 3.33
Share of Area Operated by the Bottom 50% Households 1971-72 1991-92
14.57 13.15
11.74 8.26
Share of ST in: Rural Population (1991) Land (1992)
28.85 23.78
10.01 11.72
Share if Non SC/ST in Rural Population (1991) Land (1992)
56.28 63.28
72.08 77.94
the state, compared with 3 and 8 percent of the country averages (Table2.5). This pattern however revealsonly partially the dynamics ofaccess to land in the state. M.P. isthe only state where the percentageof area irrigated increases with thefarm-size (Chadha, Sen, andSharma, 2004). Thus, while ingeneral, the degree ofunderutilisation of land tends to risewith the increase in the farm-size, inM.P., this relationship is reversed.In M.P., opportunities of livelihoodare subject to great regionalvariations, which cut across spatialtrends of distribution of naturalresources. To a large extent,poverty in M.P. follows the pattern ofdistribution of scheduled tribes. Thesouthern belt of M.P., that includedry, hard-rock regions of Jhabua,Barwani, and Dhar on one hand andthe relatively wet forested areas ofDindori, Mandla, and Shahdol on theother, are characterised by both highproportion of tribal population andhigh incidence of poverty (FAO,1998). This is due to the fact thatscheduled tribe populations in Indiasuffer from various forms of human
Table 2.5:Some KeyIndicators ofAccess toLand
Source: Adoptedfrom Chadha,Sen, and Sharma(2004)
2 9
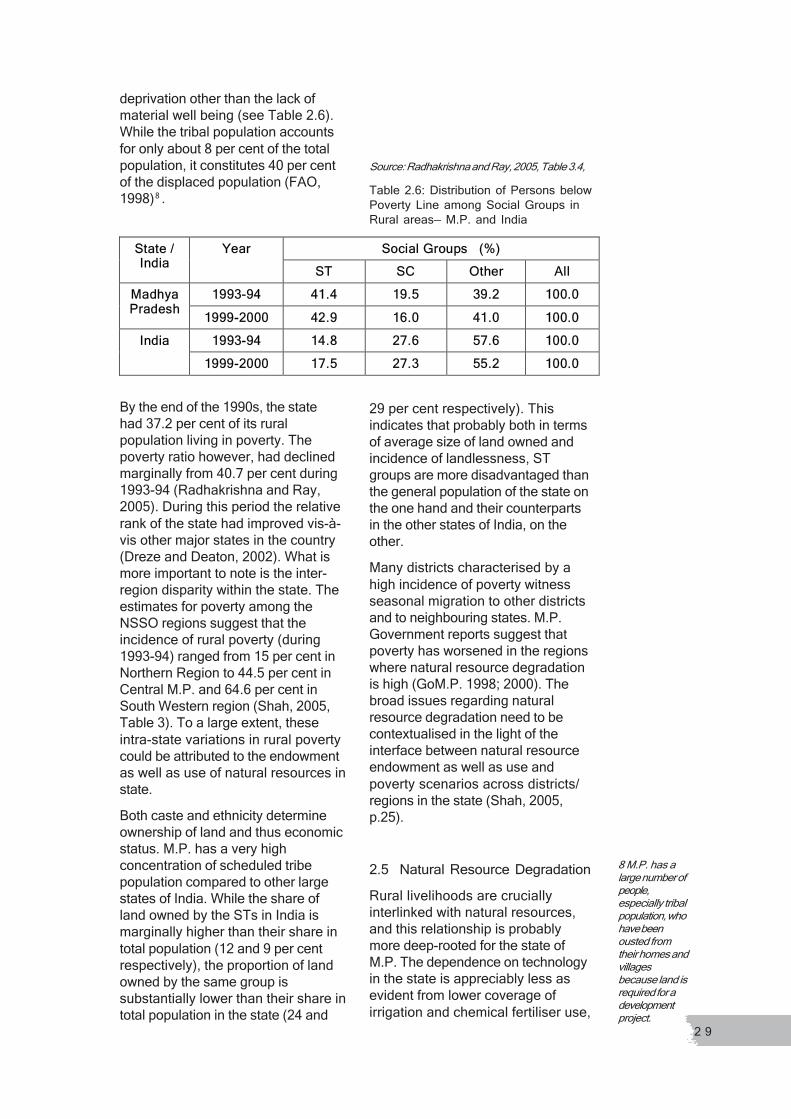
deprivation other than the lack ofmaterial well being (see Table 2.6).While the tribal population accountsfor only about 8 per cent of the totalpopulation, it constitutes 40 per centof the displaced population (FAO,1998)8 .
8 M.P. has alarge number ofpeople,especially tribalpopulation, whohave beenousted fromtheir homes andvillagesbecause land isrequired for adevelopmentproject.
SSoocciiaal l GGrroouupps s ((%%) ) SSttaatte e / / IInnddiiaa
YYeeaarr SSTT SSCC OOtthheerr AAllll
11999933--9944 4411..44 1199..55 3399..22 110000..00 MMaaddhhyya a PPrraaddeesshh 11999999--22000000 4422..99 1166..00 4411..0 0 110000..00
11999933--9944 1144..88 2277..66 5577..66 110000..00 IInnddiiaa 11999999--22000000 1177..55 2277..33 5555..2 2 110000..00
Table 2.6: Distribution of Persons belowPoverty Line among Social Groups inRural areas� M.P. and India
Source: Radhakrishna and Ray, 2005, Table 3.4,
By the end of the 1990s, the statehad 37.2 per cent of its ruralpopulation living in poverty. Thepoverty ratio however, had declinedmarginally from 40.7 per cent during1993-94 (Radhakrishna and Ray,2005). During this period the relativerank of the state had improved vis-à-vis other major states in the country(Dreze and Deaton, 2002). What ismore important to note is the inter-region disparity within the state. Theestimates for poverty among theNSSO regions suggest that theincidence of rural poverty (during1993-94) ranged from 15 per cent inNorthern Region to 44.5 per cent inCentral M.P. and 64.6 per cent inSouth Western region (Shah, 2005,Table 3). To a large extent, theseintra-state variations in rural povertycould be attributed to the endowmentas well as use of natural resources instate.Both caste and ethnicity determineownership of land and thus economicstatus. M.P. has a very highconcentration of scheduled tribepopulation compared to other largestates of India. While the share ofland owned by the STs in India ismarginally higher than their share intotal population (12 and 9 per centrespectively), the proportion of landowned by the same group issubstantially lower than their share intotal population in the state (24 and
29 per cent respectively). Thisindicates that probably both in termsof average size of land owned andincidence of landlessness, STgroups are more disadvantaged thanthe general population of the state onthe one hand and their counterpartsin the other states of India, on theother.Many districts characterised by ahigh incidence of poverty witnessseasonal migration to other districtsand to neighbouring states. M.P.Government reports suggest thatpoverty has worsened in the regionswhere natural resource degradationis high (GoM.P. 1998; 2000). Thebroad issues regarding naturalresource degradation need to becontextualised in the light of theinterface between natural resourceendowment as well as use andpoverty scenarios across districts/regions in the state (Shah, 2005,p.25).
2.5 Natural Resource DegradationRural livelihoods are cruciallyinterlinked with natural resources,and this relationship is probablymore deep-rooted for the state ofM.P. The dependence on technologyin the state is appreciably less asevident from lower coverage ofirrigation and chemical fertiliser use,
3 0
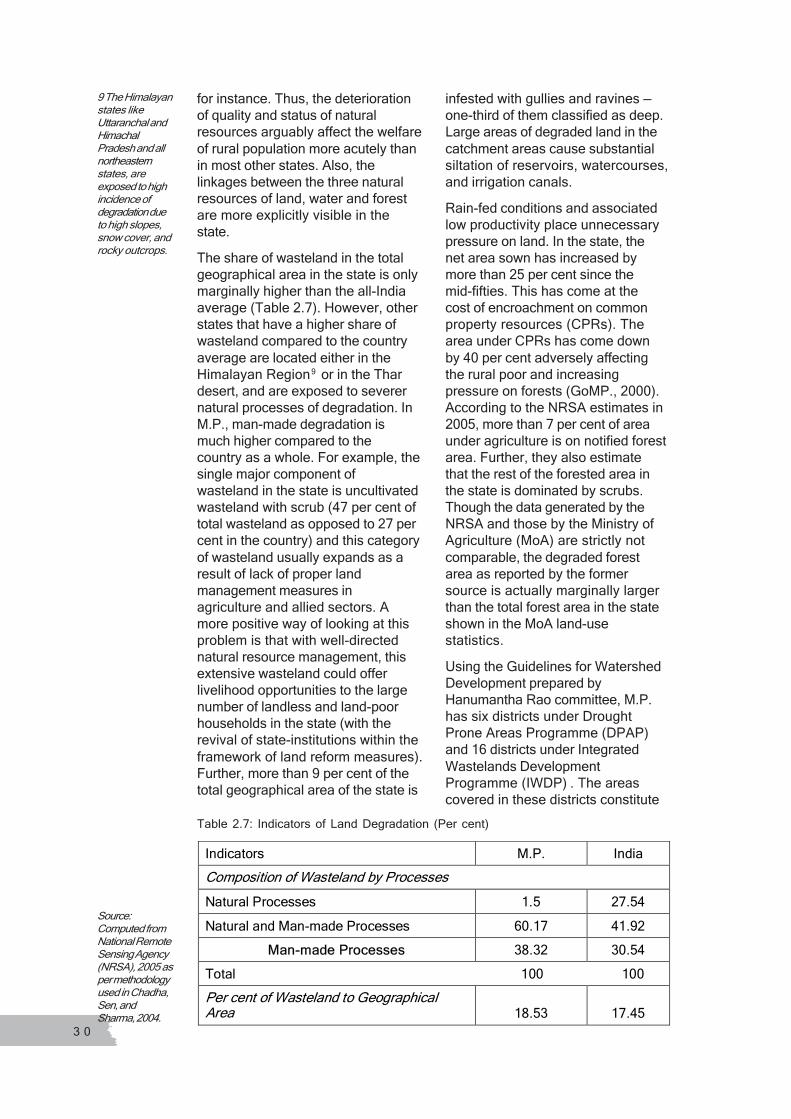
for instance. Thus, the deteriorationof quality and status of naturalresources arguably affect the welfareof rural population more acutely thanin most other states. Also, thelinkages between the three naturalresources of land, water and forestare more explicitly visible in thestate.The share of wasteland in the totalgeographical area in the state is onlymarginally higher than the all-Indiaaverage (Table 2.7). However, otherstates that have a higher share ofwasteland compared to the countryaverage are located either in theHimalayan Region9 or in the Thardesert, and are exposed to severernatural processes of degradation. InM.P., man-made degradation ismuch higher compared to thecountry as a whole. For example, thesingle major component ofwasteland in the state is uncultivatedwasteland with scrub (47 per cent oftotal wasteland as opposed to 27 percent in the country) and this categoryof wasteland usually expands as aresult of lack of proper landmanagement measures inagriculture and allied sectors. Amore positive way of looking at thisproblem is that with well-directednatural resource management, thisextensive wasteland could offerlivelihood opportunities to the largenumber of landless and land-poorhouseholds in the state (with therevival of state-institutions within theframework of land reform measures).Further, more than 9 per cent of thetotal geographical area of the state is
Indicators M.P. India Composition of Wasteland by Processes Natural Processes 1.5 27.54 Natural and Man-made Processes 60.17 41.92
MManan--mmadade e PPrroocceesssseess 38.32 30.54 Total 100 100 Per cent of Wasteland to Geographical Area 18.53 17.45
Table 2.7: Indicators of Land Degradation (Per cent)
Source:Computed fromNational RemoteSensing Agency(NRSA), 2005 asper methodologyused in Chadha,Sen, andSharma, 2004.
infested with gullies and ravines �one-third of them classified as deep.Large areas of degraded land in thecatchment areas cause substantialsiltation of reservoirs, watercourses,and irrigation canals.Rain-fed conditions and associatedlow productivity place unnecessarypressure on land. In the state, thenet area sown has increased bymore than 25 per cent since themid-fifties. This has come at thecost of encroachment on commonproperty resources (CPRs). Thearea under CPRs has come downby 40 per cent adversely affectingthe rural poor and increasingpressure on forests (GoMP., 2000).According to the NRSA estimates in2005, more than 7 per cent of areaunder agriculture is on notified forestarea. Further, they also estimatethat the rest of the forested area inthe state is dominated by scrubs.Though the data generated by theNRSA and those by the Ministry ofAgriculture (MoA) are strictly notcomparable, the degraded forestarea as reported by the formersource is actually marginally largerthan the total forest area in the stateshown in the MoA land-usestatistics.Using the Guidelines for WatershedDevelopment prepared byHanumantha Rao committee, M.P.has six districts under DroughtProne Areas Programme (DPAP)and 16 districts under IntegratedWastelands DevelopmentProgramme (IWDP) . The areascovered in these districts constitute
9 The Himalayanstates likeUttaranchal andHimachalPradesh and allnortheasternstates, areexposed to highincidence ofdegradation dueto high slopes,snow cover, androcky outcrops.

3 1
about 20 and 34 per cent of the totalreported area in the state (Table 2.8).This of course, is an overestimationas the area identified for the twoprojects cover only a part of the totalarea in the district.The area under degraded forestsconstitutes 29.32 per cent of the totalwasteland in the state. Concedingthat of the total wasteland in thestate, degraded forest is the thirdlargest category (next only to landwith/without scrub and barren rockyarea), this may have specialsignificance vis-à-vis other twocategories of wasteland noted above.Competition for water resourceswithin the agricultural sector hasbecome severe over time as a resultof the rapid increase in the use ofgroundwater for irrigation over the
Table 2.8:Share ofArea underDistrictscovered byDPAP andIWDP in M.P.(2001)
*Figures in �000haSource:Complied fromvarious districtoffices ofRGMWM
last two decades 10. The share ofgroundwater sources in the totalirrigated area in 2000-01 in the statewas more than 65 per cent.Groundwater exploitation forirrigation has caused widespreaddecline in the groundwater table andhas led to severe conflicts betweenclaims for domestic water supply onone hand, which draws heavily ongroundwater (GoM.P., 1995a), andirrigation on the other. As per theCentral Ground Water Board(CGWB), over a decade (between1995 and 2005), high groundwaterdepletion (over 4 meters decline) isconcentrated in the three major agro-climatic regions: the Grid Region inthe North11, Malwa Plateau in theWest (along with western parts of theVindhya Plateau) 12 , and the WestNimar Plains, to some extent (Figure2.3).
11The depletionhas taken placein Bhind,Morena, Gwaliorfrom this regionand also in theadjoining Datiadistrict from theBundelkhandregion.12Ujjain, Indore,Dewas,Rajgarh,, andShajapurdistricts areseverelyaffected in thisregion.
DDPPAAPP DDiissttrriicctt AArreaea* * DDiissttrriicctt AArreaea Betul 1004.3 Khargaon 1345.2 Dhar 815.3 Shahdol 1402.8
Jhabua 677.8 Sidhi 1052.6 TToottaal l AArreeaa 66229898
IIWWDDPP
DDiissttrriicct t AArreaea DDiissttrriicctt AArreaea Bhind 445.9 Ratlam 486.1
Raisen 846.6 Guna 1106.4 Narasingpur 513.3 Datia 269.1
Indore 389.8 Vidisha 737.1 Shajapur 619.5 Dewas 702
Ujjain 609.1 Rewa 631.4 Mandsaur 979.1 Tikamgarh 504.8 Rajgarh 615.3 Chhindwara 1181.5
TToottaal l AArreeaa 1100636377
Total Area of M.P. 30824.5 Area under DPAP-districts as % Total Area 20.43 %
Area under IWDP-districts as % of Total Area 34.51 %
10 The irrigatedarea in M.P. hasincreased morethan three-foldsince 1986reaching 5.4million ha. in2000.
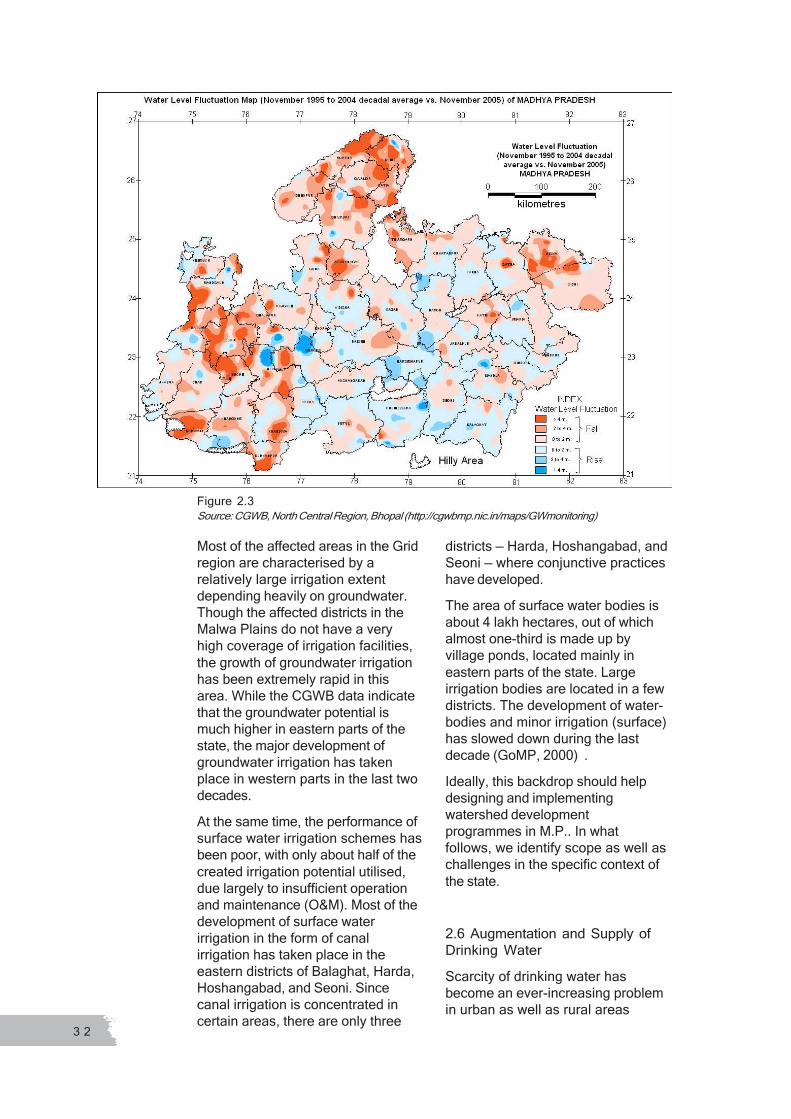
3 2
Figure 2.3Source: CGWB, North Central Region, Bhopal (http://cgwbmp.nic.in/maps/GWmonitoring)
Most of the affected areas in the Gridregion are characterised by arelatively large irrigation extentdepending heavily on groundwater.Though the affected districts in theMalwa Plains do not have a veryhigh coverage of irrigation facilities,the growth of groundwater irrigationhas been extremely rapid in thisarea. While the CGWB data indicatethat the groundwater potential ismuch higher in eastern parts of thestate, the major development ofgroundwater irrigation has takenplace in western parts in the last twodecades.At the same time, the performance ofsurface water irrigation schemes hasbeen poor, with only about half of thecreated irrigation potential utilised,due largely to insufficient operationand maintenance (O&M). Most of thedevelopment of surface waterirrigation in the form of canalirrigation has taken place in theeastern districts of Balaghat, Harda,Hoshangabad, and Seoni. Sincecanal irrigation is concentrated incertain areas, there are only three
districts � Harda, Hoshangabad, andSeoni � where conjunctive practiceshave developed.The area of surface water bodies isabout 4 lakh hectares, out of whichalmost one-third is made up byvillage ponds, located mainly ineastern parts of the state. Largeirrigation bodies are located in a fewdistricts. The development of water-bodies and minor irrigation (surface)has slowed down during the lastdecade (GoMP, 2000) .Ideally, this backdrop should helpdesigning and implementingwatershed developmentprogrammes in M.P.. In whatfollows, we identify scope as well aschallenges in the specific context ofthe state.
2.6 Augmentation and Supply ofDrinking WaterScarcity of drinking water hasbecome an ever-increasing problemin urban as well as rural areas
3 3
(Khanna and Khanna, 2006). Manyof the traditional water sources havebecome seasonal. Although, 60 percent of the villages in the state arerated as �Fully Covered� by source ofdrinking water, they are not so inreality (Das, 2006). At the same time,communities are not able to copewith the situation despite large-scaleefforts made by the StateGovernment under massiveprogrammes such as Pani RokoAbhiyan and more recently, Jal-Abhishek Abhiyan. Theseprogrammes, by and large, arecomplementary to watershedprojects; they are expected to coverareas which are not priority areas ofwatershed projects undertaken byRGMWM. While this is a usefulstrategy in the initial phase, what isessential is to integrate the two setsof interventions. This would call foraugmentation and supply of drinkingwater as an essential precondition forimplementing WDPs�something thata number of agencies, and even thePartasarathy committee, have beenrepeatedly pleading for.
2.7 Contextualising WatershedDevelopment in M.P.: Scope andChallenges
1. Given that average land holdingsize is relatively large in M.P., andthat rainfall profile is better than thatof several arid and semi-arid regionsin the country, watersheddevelopment may bring relativelylarger benefits in terms ofproductivity-enhancement perhousehold. With a relatively lowconcentration ratio of land thebenefits may also be distributedmore equitably. But this needs to beensured while designing thewatershed intervention and also themechanism for sharing of benefitshouseholds.
2. The non-viability of the small andmarginal farms due to lack of
irrigation facilities, along with highincidence of out-migration, may leadto a situation of reverse tenancy and/or neglect (if not abandonment) ofcrop land. This, in turn may lead tofurther degradation.3. Given that a large proportion ofwasteland in the state is constitutedby degraded forests, and there is anincreasing competition betweenagricultural lands on the one handand pastures and forests on theother, development of CPLRsincluding forests, deserves specialattention. The diversion of forests aswell as community pastures towardscropland is likely to be aggravated inthe wake of a relatively faster rate ofpopulation growth (particularly inrural areas) in the state, ascompared to all-India figures.4. There is a correspondencebetween the concentration of tribalpopulation and incidence of poverty.Also, the spatial convergencebetween distribution of tribalpopulation and forest resources, asexpected, is high in the state. It isthus imperative that benefits fromwatershed development is tilted infavour of the districts having highconcentration of tribal populationprovided forest resources arebrought within the fold of NRMconservation efforts.5. Given the more or lesssubsistence nature of agriculture inlarge parts of the state, promotingsustainable farming practices ismore feasible than in the areaswhere agriculture has alreadyreached higher level ofchemicalisation andcommercialisation.6. Though irrigation is expandingrapidly, given its limited irrigationpotential in the state, the prominenceof rain-fed farming is going to remainimportant even in future. In thisregard, it is encouraging to note thatthe dry crops, for example coarsecereals and oilseeds, are performingbetter in terms of relative productivitylevels in the state.
3 4
7. Since the eastern districts havemore forest land and greater waterresources, and at the same timelimited cultivable land, the regionneeds to be developed keeping inview its core agro-ecologicalcharacter, which is mainly based onplantations, pastures, and forestconservation. On the other hand, thewestern districts with their mainfocus on crop cultivation havealready exploited significant amountof groundwater. Watersheddevelopment should help in shiftingirrigation-intensive agriculture to amore diversified dryland farmingsystem, with special role for thelivestock component.8. Given the reasonably morefavourable rainfall as well astopography, rainwater harvestingmay play important role in
augmenting and supplying water fordrinking and domestic use. Thestate has already made a majorheadway through Jal-AbhishekAbhiyan. The link between WDPsand Jal-Abhishek Abhiyan needs tobe strengthened.9. M.P. is one of the high prioritystates for a number of centrallysponsored schemes that focus onenhancing agricultural productivityand reducing rural poverty. Theseschemes (including watersheddevelopment) need to be planned,designed, and implemented in co-ordination with each other.These are some of the specialfeatures that need to be consideredwhile embarking upon the next stageof watershed development in thestate.
3 5
Coverage and Spatial Distributionof Watershed Programmes
This chapter presents a snapshot ofvarious watershed programmes thathave been implemented acrossMadhya Pradesh. The main idea is toidentify pockets of concentration aswell as important gaps inimplementation in the context ofagro-ecological and socio-economiccharacteristics of districts andregions in the state. The focus ismainly on two major programmesviz. RGMWM and NWDPRA (noongoing watershed projects areincluded). In that sense the data-base is somewhat incomplete.Nevertheless, insofar as the analysiswould help evolving a larger pictureof watershed programmes, it wouldprovide an indication of how far thespatial distribution of theprogrammes has been inconsonance with some of theimportant characteristics notedpreviously.
3.1 WDPs in Madhya Pradesh: ASynoptic ViewAs noted in Chapter 1, M.P. is betterendowed with natural resourcescompared to other predominantlydry-land states, viz. Rajasthan,Gujarat, and Maharashtra located inwestern India. A summary of M.P.�snatural resources follows:
Three out of 11 regions(consisting of 12 entire districtsand parts of other four) arecharacterised by sub-humid
Chapter 3 conditions with average annualrainfall exceeding 1000 mm.A substantial part of the areaconstitutes upper catchmentswhere checking soil-watererosion is important forsustaining and improvingproductivity of soil.With forests covering nearly 30per cent of the land area, and asubstantial proportion ofcultivated land having beenconverted from erstwhile forestarea, the natural productivity isfairly good in most parts of theregion where poor, especiallytribal communities, are located.
Besides these, there are two otherfactors that may help watersheddevelopment in the state.(i) Relatively low level ofcommercialisation of agriculture,especially with respect to use ofchemical inputs. This may make iteasy to promote sustainable farmpractices through watershedprogrammes.(ii) Noteworthy achievements instrengthening decentralisedgovernance through reforms in thepanchayati raj system.Given the scope, the Government ofM.P. recognised the need to harnessits natural resources for achievingthe dual goals of environmentalregeneration and poverty reduction.M.P. is perhaps the only state in thecountry to have set up a specialmission (RGMWM) for implementingwatershed development projects(funded through the MoRD).Besides RGMWM, which has thedistinction of implementing thelargest number of watershed projectsin the state, there are other agenciesand programmes that have made asignificant contribution towardswatershed development. The othermajor programme is NWDPRA,which till recently, had covered lessthan one third of the area covered byRGMWM. The relatively higher
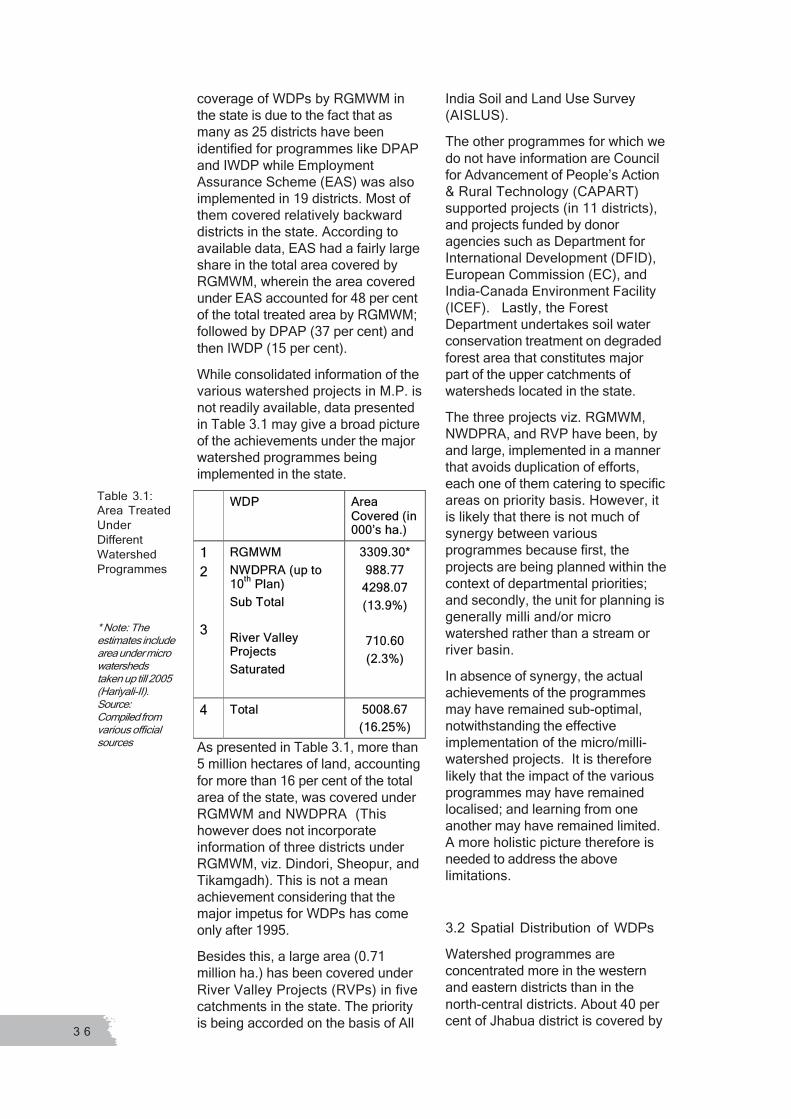
3 6
coverage of WDPs by RGMWM inthe state is due to the fact that asmany as 25 districts have beenidentified for programmes like DPAPand IWDP while EmploymentAssurance Scheme (EAS) was alsoimplemented in 19 districts. Most ofthem covered relatively backwarddistricts in the state. According toavailable data, EAS had a fairly largeshare in the total area covered byRGMWM, wherein the area coveredunder EAS accounted for 48 per centof the total treated area by RGMWM;followed by DPAP (37 per cent) andthen IWDP (15 per cent).While consolidated information of thevarious watershed projects in M.P. isnot readily available, data presentedin Table 3.1 may give a broad pictureof the achievements under the majorwatershed programmes beingimplemented in the state. WWDDPP AArrea ea
CCoovveerred ed ((iin n 000000��s s haha..))
11 22 33
RRGGMMWWM M NNWWDDPPRRA A ((uup p tto o 1010tthh PPllanan)) SSub ub TToottaal l RRiivveer r VVaalllleey y PPrroojjeeccttss SSaattuurraatted ed
33093309..3030** 988988..7777
42984298..0707 ((1133..99%%))
710710..6060 ((22..33%%))
44 TToottaall 50085008..6767 ((1166..2525%%))
As presented in Table 3.1, more than5 million hectares of land, accountingfor more than 16 per cent of the totalarea of the state, was covered underRGMWM and NWDPRA (Thishowever does not incorporateinformation of three districts underRGMWM, viz. Dindori, Sheopur, andTikamgadh). This is not a meanachievement considering that themajor impetus for WDPs has comeonly after 1995.Besides this, a large area (0.71million ha.) has been covered underRiver Valley Projects (RVPs) in fivecatchments in the state. The priorityis being accorded on the basis of All
Table 3.1:Area TreatedUnderDifferentWatershedProgrammes
* Note: Theestimates includearea under microwatershedstaken up till 2005(Hariyali-II).Source:Compiled fromvarious officialsources
India Soil and Land Use Survey(AISLUS).The other programmes for which wedo not have information are Councilfor Advancement of People�s Action& Rural Technology (CAPART)supported projects (in 11 districts),and projects funded by donoragencies such as Department forInternational Development (DFID),European Commission (EC), andIndia-Canada Environment Facility(ICEF). Lastly, the ForestDepartment undertakes soil waterconservation treatment on degradedforest area that constitutes majorpart of the upper catchments ofwatersheds located in the state.The three projects viz. RGMWM,NWDPRA, and RVP have been, byand large, implemented in a mannerthat avoids duplication of efforts,each one of them catering to specificareas on priority basis. However, itis likely that there is not much ofsynergy between variousprogrammes because first, theprojects are being planned within thecontext of departmental priorities;and secondly, the unit for planning isgenerally milli and/or microwatershed rather than a stream orriver basin.In absence of synergy, the actualachievements of the programmesmay have remained sub-optimal,notwithstanding the effectiveimplementation of the micro/milli-watershed projects. It is thereforelikely that the impact of the variousprogrammes may have remainedlocalised; and learning from oneanother may have remained limited.A more holistic picture therefore isneeded to address the abovelimitations.
3.2 Spatial Distribution of WDPsWatershed programmes areconcentrated more in the westernand eastern districts than in thenorth-central districts. About 40 percent of Jhabua district is covered by
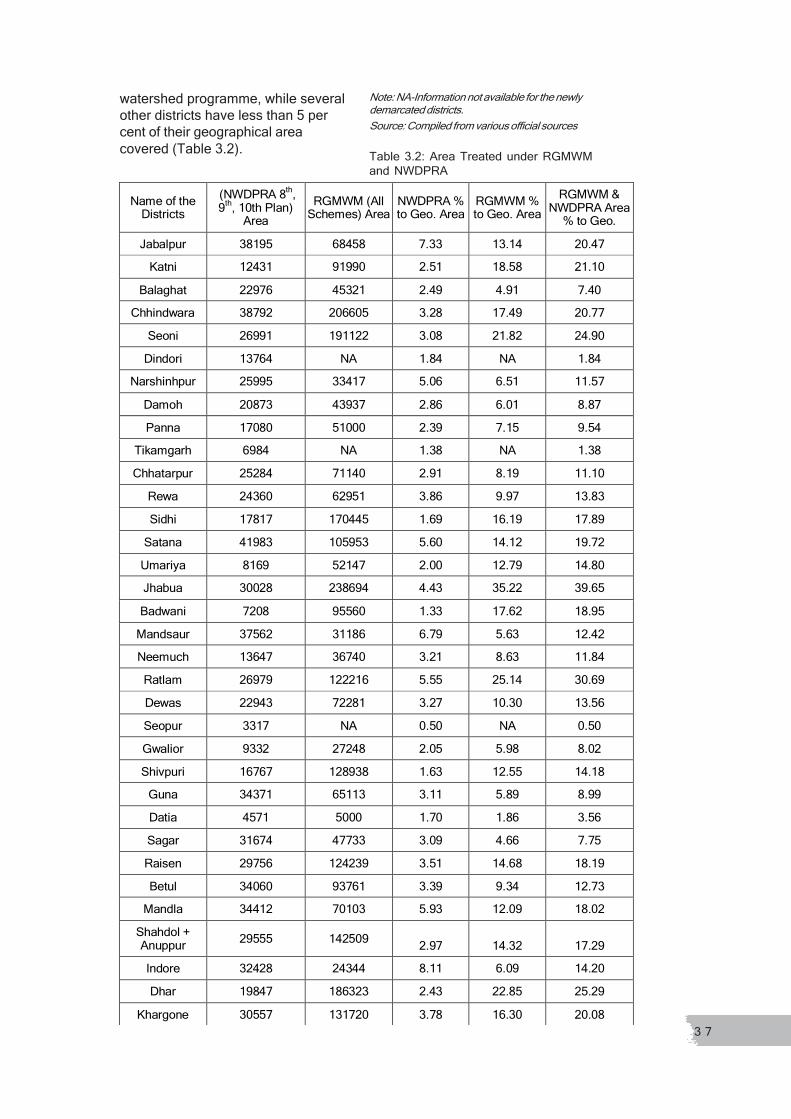
3 7
watershed programme, while severalother districts have less than 5 percent of their geographical areacovered (Table 3.2). Table 3.2: Area Treated under RGMWM
and NWDPRA
Note: NA-Information not available for the newlydemarcated districts.Source: Compiled from various official sources
Name of the Districts
(NWDPRA 8th, 9th, 10th Plan)
Area RGMWM (All
Schemes) Area NWDPRA % to Geo. Area
RGMWM % to Geo. Area
RGMWM & NWDPRA Area
% to Geo. Jabalpur 38195 68458 7.33 13.14 20.47
Katni 12431 91990 2.51 18.58 21.10 Balaghat 22976 45321 2.49 4.91 7.40
Chhindwara 38792 206605 3.28 17.49 20.77 Seoni 26991 191122 3.08 21.82 24.90
Dindori 13764 NA 1.84 NA 1.84 Narshinhpur 25995 33417 5.06 6.51 11.57
Damoh 20873 43937 2.86 6.01 8.87 Panna 17080 51000 2.39 7.15 9.54
Tikamgarh 6984 NA 1.38 NA 1.38 Chhatarpur 25284 71140 2.91 8.19 11.10
Rewa 24360 62951 3.86 9.97 13.83 Sidhi 17817 170445 1.69 16.19 17.89
Satana 41983 105953 5.60 14.12 19.72 Umariya 8169 52147 2.00 12.79 14.80 Jhabua 30028 238694 4.43 35.22 39.65 Badwani 7208 95560 1.33 17.62 18.95
Mandsaur 37562 31186 6.79 5.63 12.42 Neemuch 13647 36740 3.21 8.63 11.84 Ratlam 26979 122216 5.55 25.14 30.69 Dewas 22943 72281 3.27 10.30 13.56 Seopur 3317 NA 0.50 NA 0.50 Gwalior 9332 27248 2.05 5.98 8.02 Shivpuri 16767 128938 1.63 12.55 14.18
Guna 34371 65113 3.11 5.89 8.99 Datia 4571 5000 1.70 1.86 3.56 Sagar 31674 47733 3.09 4.66 7.75 Raisen 29756 124239 3.51 14.68 18.19 Betul 34060 93761 3.39 9.34 12.73
Mandla 34412 70103 5.93 12.09 18.02 Shahdol + Anuppur 29555 142509 2.97 14.32 17.29 Indore 32428 24344 8.11 6.09 14.20 Dhar 19847 186323 2.43 22.85 25.29
Khargone 30557 131720 3.78 16.30 20.08
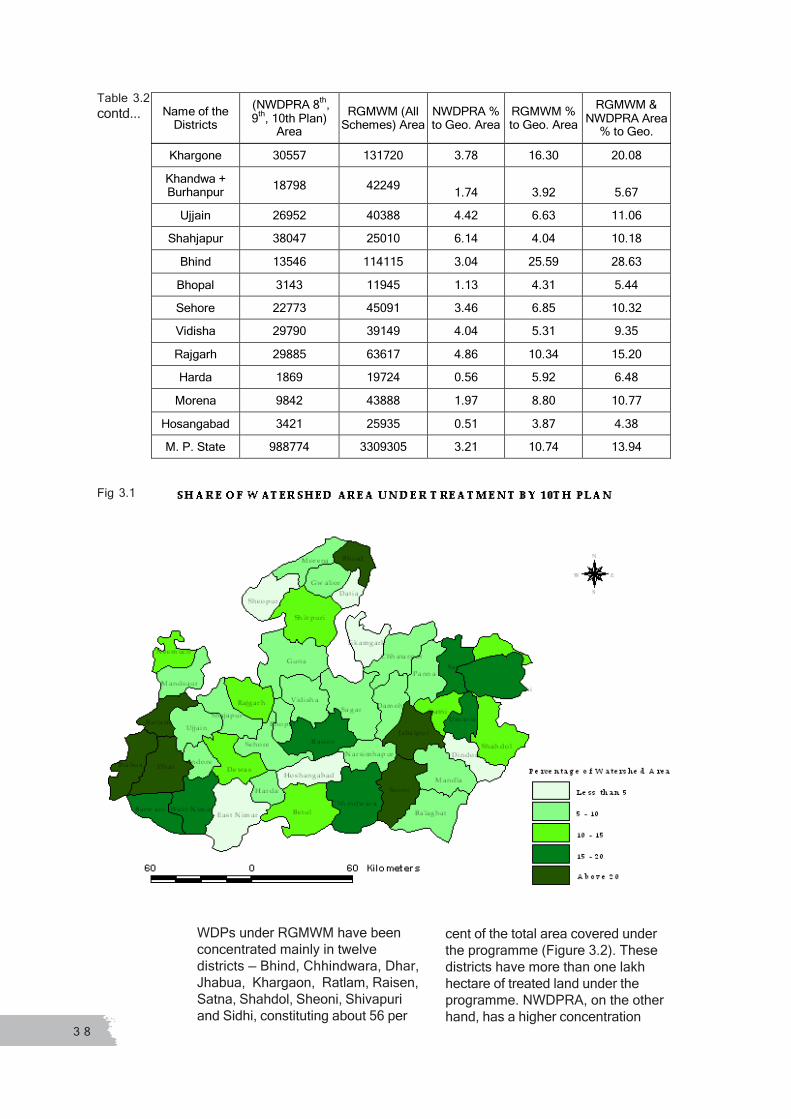
3 8
Khargone 30557 131720 3.78 16.30 20.08 Khandwa + Burhanpur 18798 42249 1.74 3.92 5.67
Ujjain 26952 40388 4.42 6.63 11.06 Shahjapur 38047 25010 6.14 4.04 10.18
Bhind 13546 114115 3.04 25.59 28.63 Bhopal 3143 11945 1.13 4.31 5.44 Sehore 22773 45091 3.46 6.85 10.32 Vidisha 29790 39149 4.04 5.31 9.35 Rajgarh 29885 63617 4.86 10.34 15.20 Harda 1869 19724 0.56 5.92 6.48
Morena 9842 43888 1.97 8.80 10.77 Hosangabad 3421 25935 0.51 3.87 4.38 M. P. State 988774 3309305 3.21 10.74 13.94
Name of the Districts
(NWDPRA 8th, 9th, 10th Plan)
Area RGMWM (All
Schemes) Area NWDPRA % to Geo. Area
RGMWM % to Geo. Area
RGMWM & NWDPRA Area
% to Geo.
WDPs under RGMWM have beenconcentrated mainly in twelvedistricts � Bhind, Chhindwara, Dhar,Jhabua, Khargaon, Ratlam, Raisen,Satna, Shahdol, Sheoni, Shivapuriand Sidhi, constituting about 56 per
cent of the total area covered underthe programme (Figure 3.2). Thesedistricts have more than one lakhhectare of treated land under theprogramme. NWDPRA, on the otherhand, has a higher concentration
Fig 3.1
Table 3.2contd...

3 9
concentrated in eleven districts �Betul, Chhindwara, Guna, Indore,Jabalpur, Jhabua, Khargaon,Mandla, Mandasaur, Satna, andShajapur � accounting for 39 percent of the total treated area underthe programme (Figure 3.2). Each ofthese districts has more than 30,000
WAT ERSHED COVERAGE IN MAD HYA PRADESH
Sidhi
Guna
Betul
Sagar
Dhar
Seoni
Satna
Raisen
Shivpuri
Shahdol
Mandla
Ujjain
Panna
Dewas
Rewa
Balaghat
Jhabua
East Nimar
Sehore
Vidisha
Chhindwara
Jabalpur
DamohRajgarhKatni
Sheopur
Shajapur
Chhatarpur
Bhind
Ratlam
West Nimar
Dindori
Barwani
Morena
Umaria
Gwalio r
Harda
Mandsaur
Datia
Indore
Tikamgarh
Hoshangabad
Bhopal
Neemuch
Narsimhapur
50 0 50 100 Kilometers
N
EW
S
RELATIVE SHARE OF NWDPRA & RGMWM
RGMWM
NWDPRA
Fig 3.2
ha. of treated area under NWDPRA.Together there are 19 districts havinglarge areas under the two majorwatershed programmes with fourdistricts appearing in both the lists,viz. Chhindwara, Jhabua, Khargaon,and Satana.
3.3 Complementarity andPrioritisationThe three major watershedprogrammes viz., RGMWM,NWDPRA, and RVP and the onesimplemented by the ForestDepartment have more or lessclearly demarcated areas ofoperation. There is, of course, someelement of overlap in areas among
them, especially at district level.Therefore the issue of prioritisationfollowed within the areas earmarkedfor each of these programmesbecomes relevant.Ideally one should map spatialconcentration of WDPs at taluka/
block level since, under RGMWM,areas for EAS and DPAP areidentified at taluka level. Similarly,areas earmarked for RVP and ForestDepartment are also more clearlydefined at taluka level than at districtlevel. Nevertheless, in the absenceof more disaggregated data, we havetried to gauge the extent ofconcentration and its interface withvarious categories of priority areas atdistrict level.
Spatial Concentration of WDPsAs far as concentration in terms ofproportion of geographical areacovered is concerned, 10 out of the45 districts have more than 15 per

4 0
cent of the total area treated underthe two major watershedprogrammes; other districts have 10-15 per cent of area treated (Table3.3).
Title of the Programme
Districts (by Watershed Coverage)
Share of Area under WDP to
total Geo. Area EAS DPAP IWDP
Most Backward Districts identified for implementation of
National Food for Work AAbboovve 15 e 15 %% ((iin n %%)) 1 Jhabua 39.77 P P P 2 Ratlam 30.67 P P 3 Bhind 28.67 P 4 Dhar 25.16 P P P 5 Seoni 24.92 P 6 Chhindwara 20.71 P P 7 Satna 19.93 8 Raisen 18.14 P 9 Sidhi 18.12 P P P
10 Rajgarh 15.17 P
10 � 15 % 1 Indore 14.82 P 2 Shivpuri 14.32 P 3 Rewa 13.89 P 4 Dewas 13.59 P P 5 Betul 12.68 P P P 6 Shahdol 12.2 P P P 7 Khargone 12.03 P P P 8 Narsimhapur 11.57 P 9 Chhatarpur 11.17 P
10 Ujjain 11.04 P 11 Jabalpur 10.53 P 12 Sehore 10.34 13 Shajapur 10.21 P
Source: Same asTable 3.2
Out of 10 districts with higher degreeof concentration (above 15 per cent),six are covered by the EAS, and fiveunder IWDP. (There is an overlap inthe case of Ratlam and Chhindwara.)
Strangely, Satna is not coveredunder any of the four categories ofprioritisation. In fact, only threedistricts, viz. Jhabua, Dhar andRaisen, are included in the list of 14
Table 3.3
districts from the state, forming apart of the 150 most backwarddistricts in the country. If weconsider the next degree ofconcentration, we find that 11 out of
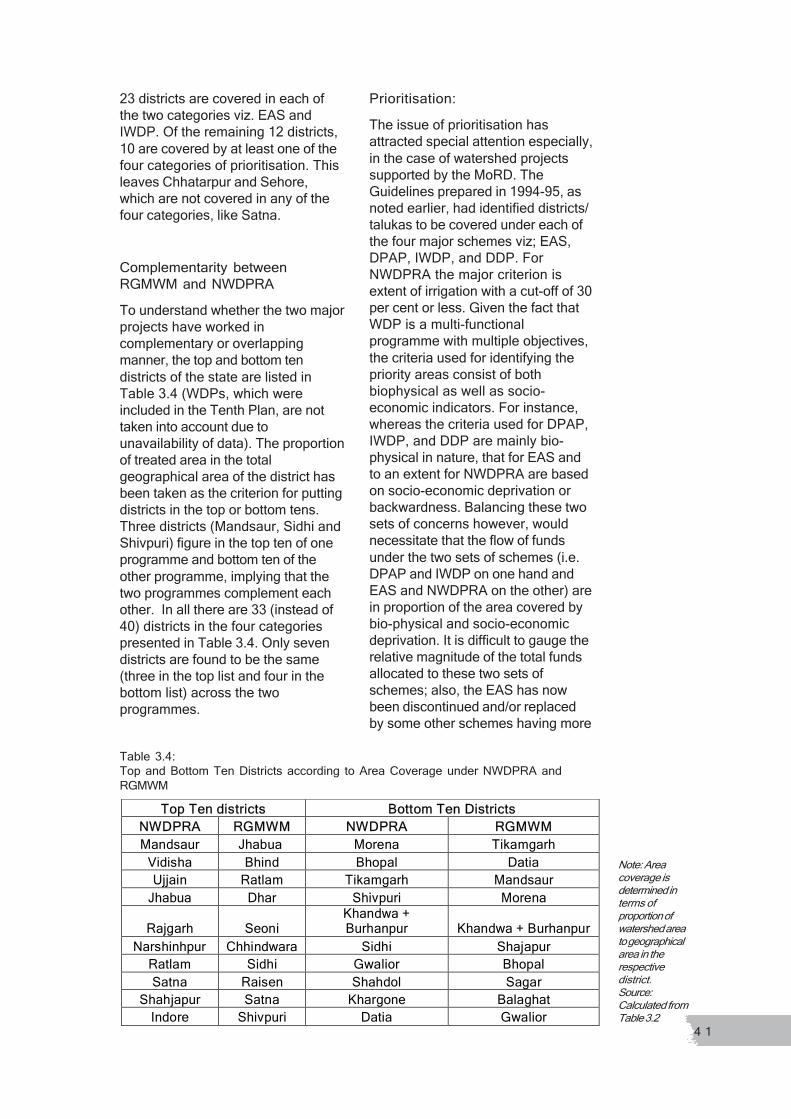
4 1
23 districts are covered in each ofthe two categories viz. EAS andIWDP. Of the remaining 12 districts,10 are covered by at least one of thefour categories of prioritisation. Thisleaves Chhatarpur and Sehore,which are not covered in any of thefour categories, like Satna.
Complementarity betweenRGMWM and NWDPRATo understand whether the two majorprojects have worked incomplementary or overlappingmanner, the top and bottom tendistricts of the state are listed inTable 3.4 (WDPs, which wereincluded in the Tenth Plan, are nottaken into account due tounavailability of data). The proportionof treated area in the totalgeographical area of the district hasbeen taken as the criterion for puttingdistricts in the top or bottom tens.Three districts (Mandsaur, Sidhi andShivpuri) figure in the top ten of oneprogramme and bottom ten of theother programme, implying that thetwo programmes complement eachother. In all there are 33 (instead of40) districts in the four categoriespresented in Table 3.4. Only sevendistricts are found to be the same(three in the top list and four in thebottom list) across the twoprogrammes.
TTop op TTen den diissttrriiccttss BBoottttoom m TTen en DDiissttrriiccttss NNWWDDPPRRAA RRGGMMWWMM NNWWDDPPRRAA RRGGMMWWMM Mandsaur Jhabua Morena Tikamgarh
Vidisha Bhind Bhopal Datia Ujjain Ratlam Tikamgarh Mandsaur
Jhabua Dhar Shivpuri Morena Rajgarh Seoni
Khandwa + Burhanpur Khandwa + Burhanpur
Narshinhpur Chhindwara Sidhi Shajapur Ratlam Sidhi Gwalior Bhopal Satna Raisen Shahdol Sagar
Shahjapur Satna Khargone Balaghat Indore Shivpuri Datia Gwalior
Table 3.4:Top and Bottom Ten Districts according to Area Coverage under NWDPRA andRGMWM
Note: Areacoverage isdetermined interms ofproportion ofwatershed areato geographicalarea in therespectivedistrict.Source:Calculated fromTable 3.2
Prioritisation:The issue of prioritisation hasattracted special attention especially,in the case of watershed projectssupported by the MoRD. TheGuidelines prepared in 1994-95, asnoted earlier, had identified districts/talukas to be covered under each ofthe four major schemes viz; EAS,DPAP, IWDP, and DDP. ForNWDPRA the major criterion isextent of irrigation with a cut-off of 30per cent or less. Given the fact thatWDP is a multi-functionalprogramme with multiple objectives,the criteria used for identifying thepriority areas consist of bothbiophysical as well as socio-economic indicators. For instance,whereas the criteria used for DPAP,IWDP, and DDP are mainly bio-physical in nature, that for EAS andto an extent for NWDPRA are basedon socio-economic deprivation orbackwardness. Balancing these twosets of concerns however, wouldnecessitate that the flow of fundsunder the two sets of schemes (i.e.DPAP and IWDP on one hand andEAS and NWDPRA on the other) arein proportion of the area covered bybio-physical and socio-economicdeprivation. It is difficult to gauge therelative magnitude of the total fundsallocated to these two sets ofschemes; also, the EAS has nowbeen discontinued and/or replacedby some other schemes having more

4 2
specific agenda for employment/livelihood support in the deprived/backward districts.Nevertheless it may still be useful tomap out the spread of WDPs acrossthe two sets of indicators used forprioritisation. On a socio-economicside, we have used economicdeprivation as yet another indicatorin addition to EAS and extent ofirrigation [Table 3.5].
S. No. @
EAS (17) DPAP (6)
IWDP # (16)
LLeeaasst t IIrrrriiggaatteded ((<<15 15 %%))
Index of Deprivation ((BBoottttoom m 1616))
TTrreaeatted ed bby y
RRGGMMWWMM CCoommbbiinneedd ((RRGGMMWWMM++ NNWWDDPPRRAA))
EEAAS S DDiissttrriiccttss 1 Jhabua * 13.2 * 35.22 39.65 2 Dhar * 17.4 22.85 25.29 3 Mandla 3.9 * 12.09 18.02 4 Sidhi * 9.0 16.19 17.89 5 Shahdol * 5.6 * 14.32 17.29 6 Rajgarh *
(43.6) 17.3 * 10.43 15.20 7 Balaghat 37.6 4.91 7.40 8 Seoni 13.7 21.82 24.90 9 Chhindawad
a * 13.5 17.49 20.77 10 Jabalpur-
Katani 25.0 12.0 13.14
18.58 20.47 21.10
11 Ratlam * (22.0) 17.5 25.14 30.69
12 Morena 53.0 8.80 10.77 13 Khandawa 17.0 * 3.92 5.67 14 Dewas * 15.6 10.30 13.56 15 Betul * 14.9 * 9.34 12.73 16 Hoshangaba
d 42.9 3.87 4.38 17 Khargon * 17.6 * 16.30 20.08
NNoonn--EEAAS S DDiissttrriicctts s Bhind * 33.5 25.59 28.63 Raisen * 20.8 14.69 18.19 Narasinghpur * 28.3 6.51 11.57 Indore * 21.1 6.09 14.20
18 Shajapur * (64.2) 19.0 4.04 10.18
Ujjain * 19.8 6.63 11.06 Madanasaur * 24.5 5.63 12.42
19 Guna * 13.8 * 5.89 8.99 Datia * 38.0 1.86 3.56
20 Vidisha * 14.9 * 5.31 9.35 21 Rewa * 14.5 * 9.97 13.83
Tikamgadh * 45.2 * NA NA DDiissttrriicctts s nonot t ccoovveerreed d uundndeer r EEASAS, , DDPPAAP P aannd d IIWWDDPP
22 Panna 12.2 * 7.15 9.54 23 Chhtarpur 29.4 * 8.19 11.10 24 Stana 16.1 * 14.12 19.72 25 Shivpuri 28. * 12.55 14.18 26 Damoh 15.9 * 6.01 8.87
Table 3.5 Prioritisation of WDPcoverage by RGMWM and NWDPRA
Source: Various project documents, Departmentof Agriculture and M.P. Human DevelopmentReport# Figures in parentheses in IWDP column showthe percentage of wastelands in the district@ Districts having higher proportion of irrigatedarea and not in the list of 15 most depriveddistricts have not been numbered.
4 3
The table presents list of districtscovered under the three majorprojects viz; EAS, DPAP, and IWDPin M.P. It also lists the bottom 15districts in terms of proportion ofirrigated area, and also the 15 mostdeprived districts in the state (basedon index of deprivation - one of theindices used for computing humandevelopment index). Whereas the 17districts under EAS cover all the sixdistricts under DPAP and also sevenout of the 15 most deprived districts,the overlap between EAS and IWDPis limited. Only 12 out of 16 IWDP-districts are also covered under EAS.In all there were 34 out of 45 districtscovered under the various categorieslisted in Table 3.5.With a view of getting a morefocused understanding on the issueof prioritisation, we have droppedWDP-districts that had relativelyhigher proportion of irrigated areasas compared to the state average.Also these districts did not constitutethe 15 most deprived districts. In theprocess nine districts were dropped,leaving 26 districts for the analysis.We tried to examine whether the 26districts that �deserve� specialattention owing to one or more of theseveral criteria, have receivedpriority as reflected in terms ofproportion of treated area or not.Viewing from this angle, it isobserved that 11 out of 26 districtshad less than 14 per cent of landcovered under WDP-treatment takingthe two projects together (data isn�tavailable for Tikamgarh). The cut-offof 14 percent refers to the proportionat the state level. However, at acloser look, one finds that four ofthese 11 districts have significantlyhigher proportion of irrigated area.This may be the reason for lowcoverage of watershed treatments inthese districts.This leaves seven out the 26 districtsthat have received low attention formWDPs despite being in the list of�deserving� districts in term ofmultiple criteria used for identifyingpriorities. These districts are: Betul
(12.7 %), Shajapur (10.2 %), Guna(8.9 %), Vidisha (9.3 %), Panna (9.5%), Damoh (8.8 %) and Khandwa(5.7 %). In fact the information forKhandwa is somewhat hazy, as thedistrict is carved out from EastNimar, which was identified underEAS. In fact Shajapur emerges asthe most noticeable outlier, wheretreated area is only about 10 percent despite having nearly 64percent of the area as wasteland.On the other hand, Bhind (28.6%)and Raisen (18.2%) districts haverelatively larger coverage of treatedarea. While both these are IWDP-districts, we have not consideredthem for the analysis since both thedistricts are not covered under themost deprived districts. Incidentally,Bhind has 33 per cent of irrigatedarea whereas Raisen has 21 percent area under irrigation.It is thus, important to examine thereasons for the apparent neglect ofthe seven districts listed above. Anobvious implication is that the nextround of selection may focus on theremaining districts i.e., those withless than 10 % of its area treated)within the four categories. Theoverall findings from the analysesbring out two important findings:First, there is a fair amount ofcomplementarity in coverage ofdistricts between the two majorprojects. And second, there is a fairlygood correspondence betweeneconomic deprivation andconcentration of watershedtreatment. The findings are furthersubstantiated through a moredisaggregated analysis among atblocks within Jhabua district inChpater V.Thus the analyses suggest thatwhereas the initial selection of thedistricts does correspond with thefour indicators of prioritisation atdistrict level, the ground realities aredifficult to gauge in the absence oftaluka/block level data. It is thusimperative that such information bemade available in the public domainwith a view to having a better

4 4
assessment of prioritisation followedin selection of WDPs.Conceding that WDPs have alreadycovered fairly substantial area incertain districts (e.g., Jhabua withabout 40% coverage), efforts mayhave to be consolidated to seekconvergence across variouswatersheds and also across othernatural resource developmentprogrammes being implemented inthe district. This may indicate theneed for going beyond the micro- ormilli-watersheds as a unit of planningand various interventions aimed at
integrated approach for naturalresource development andlivelihood enhancement within alarger area. As noted in Chapter 1,this may open up a larger number ofoptions for resource management,resource transfer, market linkages,population movements, andinterface between surface andground water regimes. These issueshave been highlighted in the reporton �From Hariyali to Neeranchal� ofthe Parthasarathy committee. It is inthis context that the issues ofprioritisation and convergencebecome integrated.
4 5
Performance of WatershedProgrammesin Madhya Pradesh
The Tenth Plan Approach Paper ofGovernment of Madhya Pradeshidentifies �recognition of agency ofpeople as central to development� asthe single most significant departurein the state�s vision of developmentcompared to that of the country as awhole. It perceives the relationshipbetween the state government andthe people as one of a partnershipbased on sharing of rights andresponsibilities. Thusdecentralisation has been seen asthe �premise for development in thestate�, and particularly as a processthat aids the creation of a partnershipbetween people and government.The �changed� vision of governanceexplicitly promises a greateraccountability on the part of thegovernment and increasing space forcommunity action. The paper furthernotes that �development ismeasurable not just through creationof assets and resources, but throughthe effectiveness of the process ofempowering communities to makechoices and participate in creatingthose assets and resources�.Even as the broad directionsprovided in the Tenth Plan ApproachPaper are conducive to effectiveimplementation of the secondgeneration watershed developmentprogrammes, particularly in terms ofthe participatory principles adopted inthe new guidelines of 2001 andsubsequently in the HariyaliGuidelines in 2003, the broadobjectives of the Plan appear to be
Chapter 4 conforming to the �sectoralapproach�. For example, it aims toreduce poverty through income andemployment generation schemes,and these objective figuresprominently as the function of theDepartment of Rural Development.Similarly, it endeavours to increasethe agricultural production throughboth extensive and intensivecultivation practices. One of theimportant ways in which thedepartment of agriculture seeks toextend area under agriculture is byreclamation of wasteland. Theconservation of water resourcesfigures prominently in the function ofthe Department of Irrigation alongwith its main objective of expandingirrigation facilities. The Departmentof Forest undertakes a large numberof activities consistent with that ofthe objectives of watershedprogrammes, but these areessentially restricted to the notifiedforest areas13 .It cannot be argued that the abovecompartmentalisation of functions isonly a feature of the Government ofMadhya Pradesh since it has itsroots in the formulation of the plansof the Central Government and issimilar to those in most other states.The strong emphasis on turningactivities into a participatory mode,however, is a feature that sets apartthe M.P. State Plan from manyothers. It could be used as a base tobring about a more integratedapproach in the development planswhich is more consistent with thewatershed approach.Watershed DevelopmentProgrammes in M.P. are carried outby a number of agencies, as they arein other states. The two primarydepartments that carry outwatershed programmes in the stateare the Department of RuralDevelopment and the Department ofAgriculture. The former undertakeswatershed programmes under DPAPand IWDP. Until the Ninth Plan, ittook them up under the EAS14 . TheDepartment of Agriculture, as in
13The activitiesinclude rural fuelwood plantation,area orientedfuel and fodderproject,rehabilitation ofdegradedforests, soil andwaterconservation,compensatoryafforestationand high-techafforestation.14 As per theguidelines ofMinistry of RuralDevelopment,Government ofIndia, 50 percent of thefunds under thisscheme were tobe utilised forwatershedprogrammes.

4 6
other states, carries out NWDPRA. Acursory review of the Tenth Plan andits constituent annual plans of thestate reveals that the watershedprogramme figures much moreprominently in the plans of theDepartment of Rural Developmentunder the RGMWM than in the plansof the Department of Agriculture.
4.1 Adaptation of WatershedProgrammes in Madhya PradeshThough the stated objectives of anyprogramme cannot be used as ayardstick for assessing the policy onwhich it is based, it does providesome indication of its thrust areas.Under the Common Guidelines forNWDPRA and other watershedprogrammes undertaken by theMoRD, some path for convergence
of watershed programmes has beenprovided. The two ministriescontinue to harbour their biaseswhich are manifested even moreclearly in the state level. Here weattempt to look at the nature of theevolution of the programmes rununder the MoRD from 1995 bycomparing the stated objectives asprovided in the different guidelinesand try to contextualise this vis-à-visthe NWDPRA guidelines of 2000.The purpose of this exercise is tocreate a basis for looking at theprovisions made in the RGMWM inthe context of Madhya Pradeshunder the Department of Panchayatand Rural Development. It needs tobe mentioned here that theDepartment of Agriculture in thestate for the purposes ofimplementing NWDPRA follows theguidelines provided at the Centrallevel.
Department of Land Resource, MoRD SSttaatteed d OObbjjeeccttiivveess 1995
guidelines 2001
(Revised guidelines)
2003 (Hariyali Guidelines)
NWDPRA, MoA, 2000
Restoration of ecological balance P P P P
Conservation, development and use of natural resources P P P P# Drought mitigation P P * P Employment generation and poverty alleviation P P P P Community action to maintain assets P P P Simple, easy and affordable technological solutions using local knowledge
P P P
Attention to resource poor P P P Equitable distribution of the benefits of land and water P @ @ Site specific development P Stress on drinking water P Generating resources for panchayats through NRM P Reduction of disparity between irrigated and rain-fed areas P
Table 4.1: Comparison of Objectives of Watershed Programmes Undertaken by theMinistries of Rural Development and Agriculture
Note: * withrespect to bothhuman andlivestockpopulation# special focuson increasingagriculturalproductivity@ the CommonGuidelines, 2000,makesprovisions forequitable sharingof resources withpreferentialtreatment to thepoor.Source: GoI,1995; 2000;2001; and 2003.

4 7
It may be noted that the programmescan be more convergent or divergentin their spirit than their statedobjectives convey. This exercise,nevertheless gives us a feel of thedifferences in thrusts over time andacross programmes. Though by andlarge the MoRD has been consistentin terms of the objectives of theprogrammes run under its aegis afew changes have occurred overtime (Table 4.1). It is easy toappreciate the rationale of commonguidelines brought out by theGovernment of India from even acursory look at Table 4.1. Though inspirit the watershed programmesundertaken by different ministrieshave sustaining livelihoods of thepoor as an objective equitabledistribution of benefits from land andwater management activities is nolonger an objective as per the 2001guidelines. This does not necessarilymean that at the state level itbecomes irrelevant as an objectivesince the 2001 guidelines makesallowance for the state governmentto implement the programmes as�may be found suitable for localenvironment�. But given the fact thatequity aspects, particularly withrespect to access to incrementalnatural resources, have been one ofthe areas of failure in manywatershed programmes, what theCentral Government keeps in focusis of crucial importance.Beginning with the formulation of theHariyali guidelines, no separatemention is made of the landless orthe resource-poor, though thegeneral objective of employmentgeneration and poverty alleviation isretained. In these guidelines, there isa greater stress on improving thedrinking water situation � a welcomeaddition to the list of objectives, giventhe severe competition for water fordifferent purposes. Generatingfinancial resources for the panchayatiraj institutions through developmentand management of naturalresources has become one of theexplicitly stated objectives for WDPsin the Hariyali guidelines for the first
time. Such resources can begenerated either from additionallyaugmented water and/or fromCommon Property Land Resources(CPLRs). The latter seems to be adoubtful proposition on two counts.First, the evidence from WDP impactassessment by and large indicatesthat rejuvenation of commonproperty resources has drawn ablank in most cases. Second, giventhe importance of village pasturesand forests for the livelihood of thelandless, additional competition forbenefits generated from theseresources could further weaken thepossibility of the landless derivinggains from these programmes.A comparison of the objectives givenin the guidelines of the two ministriesin 2000-2001 reveals that thereexists a lot of commonality in thebasic objectives of the twoprogrammes. Restoration ofecological balance by strengtheningthe linkages between land, water,and vegetation is a common thrust.Similarly, conservation, developmentand sustainable use of naturalresources are common goals. In thisregard, the MoA primarily focuses onbenefits from the crops andconsequently aims to reducedisparities between the irrigated andrain-fed regions through improvedperformances in agriculture. TheMoRD has probably a more broad-based focus.a) Rajiv Gandhi Mission forWatershed ManagementBy creating a new institution of theMission in the mid-nineties, theGovernment of M.P. sought to�impart a sense of urgency to someof the unfinished tasks�, particularlywhich have crucial bearing on thelives of the common man (GoMP,2003). WDPs form one of the fivetasks carried out by the RGMWM;however the degree of importanceaccorded to the watershedprogrammes in the state is probablyunparalleled among the states ofIndia. The rationale for this emanates

4 8
from the understanding that rain-fedfarming is crucially important forlivelihood of the rural people. Thestate government recognises thepotential of raising the livingstandards in rainfed farming areasby �conserving the soil and waterresources and optimising their usewith a view to generating naturalresource and increase agriculturalproductivity.� Given the pooremployment prospects in the state,managing natural resources with alabour intensive strategy wasconsidered a key objective. Thewatershed mission was an effort to�unlock the physical (natural) and thehuman potential� of the state through�people-centred activities�, thusrecognising the interconnectednessof the �bio-physical and the social�through participation of the localcommunity.
OObbjjeeccttiivveess 1995 2002 AAuuggmmeennttaattiioonn, , ccoonnsseerrvvaattiion on aand nd uuttiilliissaattiioon on of f ssooil il aannd d
wwaatteerr PP PP
DDrroouughght t mmiittiiggaattiioonn PP PP DDeevveelloop p rreepopossiittoorry y oof f sscciieennttiiffiic c aannd d tteecchhnnoollogogiiccaal l
iinpnpuutts s ffoor r aarreea a ssppeecciiffiic c ppllanannniinngg PP PP TTo o rreessttoorre ee eccoollogogiiccaal l bbaallaannccee PP PP
TTo o mmaaxxiimmiisse pe peeoopplleess� � ppaarrttiicciippaattiioon n iin pn pllaannnniinngg, , iimmpplleemmeennttaattiionon, , aannd d mmaaiinntteenananncce e tto o mmaakke e sscchheemme e
mmoorre e eeffffeeccttiivve ane and d ttrraannssppaarreenntt PP PP
TTo bo brriinng abg aboouut t eqequuaall ddiissttrriibbuuttiioon on of f rreessoouurrccees s aannd d sshhaarriing ong of f bbeeneneffiitts s tto o iimmpprroovve e tthe he ddiissadadvvaannttaaggeed d
ccoommmmuunniittiieess PP
Table 4.2:Evolution ofthe Objectivesof RGMWMSource: GoMP(1995b)
The objectives of RGMWM were inconformity with the centralgovernment guidelines for both theNinth and the Tenth Plans. TheMission�s articulation of the need tomaximise people�s participationstems from the vital purpose ofmaking the scheme more effectiveand transparent. The key differencein the evolution of the centralgovernment and the Mission�sthrusts is that while the formerdilutes the equity principles in somesense over time, the Missionstrengthens the same. The latter notonly aims at sharing the benefits of
15 The area of awatershed woulddepend, amongother things, onthecharacteristics ofthe slope of anarea.
the programme, but also iscommitted to bringing about a moreequitable distribution of theresources. It is not clear whether theequity principle is applicable to thestock or to the increment ofresources. The mission documentsare also somewhat unclear aboutthe mechanisms to achieveequitable distribution of resources.The issue of scale of operation ofwatersheds has been of concern tothe researchers in the field. It isargued that first, a micro-watershedmay be too small as a planning unitto efficiently capture the externalityimpacts (Joy and Paranjape, 2004).Secondly, given the vast variationsin the topography in the country ingeneral and in the state in particular,uniformly prescribing an averagearea of a watershed is probably notdesirable15 ; it may induce the localimplementers to deviate from the�ridge to valley� principle.Thus it needs to be noted that thecentre and the state conceptualisethe planning unit, i.e., the watershedarea, in distinctly different ways. The1995 MoRD guidelines, based onthe Hanumantha Rao Committeerecommendations, stated that�Watershed DevelopmentProgramme in Drought Prone/Desert/Non-forest wasteland areaswill be implemented by taking upprojects for development ofwatersheds of 500 hectares each
4 9
(approximately) in every village in aphased manner.� The 2001guidelines by the same ministry,while not relaxing the actual norms,allowed for greater conceptualflexibility. To quote the 2001guidelines,��the watershed approach is aproject based, ridge to valleyapproach for in situ soil and waterconservation, afforestation etc. Unitof development will be a watershedarea of about 500 ha. each inwatershed development projects.However, the actual area of a projectmay vary keeping in view thegeographical location, the size ofvillage etc.�The RGMWM, in 1995, was cautiousin accepting the 500 hectare norm ofa micro-watershed verbatim. TheMission preferred to arrive at anoptimal size for a planning unit evenas it cautioned that the area of anywatershed depends on manyinterrelated factors. It affirmed that�planning unit too small leads toproblems in downward integration ofschemes as the watershed cascadesinto the next unit, while a planningunit too large would tend to make theground level plan too sketchy in itsdetails� (GoMP, 1995, p. 8). TheMission therefore suggested aplanning unit of milli-watershed of5,000 to 10,000 hectares as a baseunit, which is then integrateddownstream into the next plan unit ofthe sub-watershed of approximately50,000 to 100,000 hectares. Forexecution of works, the Missionhowever tends to agree with the GoIguidelines and settles for units of 500ha. each simply because it is only atthis micro-scale that sufficient carecan be given to the execution of thekind of works that are required in thefarmers� fields.The Mission suggests demarcationof three zones within each milli-watershed: the recharge zone, thetransition zone, and the dischargezone. The first zone with highgradients and greater susceptibility to
soil has been identified as the zonerequiring the most intensivetreatment (GoMP, 1995, p.9) 16 .There is thus an inbuilt principle ofprioritisation within the milli-watershed in the Mission documentof 1995, at least with respect to theintensity of work to be done. Tosome extent, this is consistent withthe fund-allocation format of thecentral government, which allows forgreater expenditure for an area withhigher slopes. There is however, nomention about prior sequencing ofmicro watersheds located in therecharge zones, though this wouldhave been a logical follow-up ofdemarcation of the three zones.The Mission recognised that theorganisational multiplicity working forwatershed development is a hurdlein achieving an integrated approach.This is due to two reasons. First, thestructure of the various departmentslegitimises their focusing on one orthe other natural resource 17.Secondly, each agency works on astructure which is best suited to the�availability of resources andexpertise�, which precludes thepossibility of optimising the selectionof structures keeping in view both thelocation and nature of the structure.The Mission, at its very inception,pointed out the futility of �prescriptive�formats handed down from theCentre given the importance ofcarrying out work to suit thetopographic features of eachwatershed. It clearly recognises thatthe broad plans for the western hardrock, semi-arid regions have to bequite different from those in therelatively humid region dominated bylimestone. The Mission points outthat the groundwater conditions areextremely heterogeneous: whereasthere is a high potential for trappinggroundwater through artificialrecharge structures in the Westernregion characterised by desaturatedphreatic aquifers, the eastern regionwhich on an average receives 140cm. of rainfall, have more scope for
16 Therecharge zoneis an upstreamregioncomprisinglands with highgradients, thetransition zonehas gentlergradients, andthe dischargezone has flatlands. TheRGMWMrecommendsdifferent kinds ofactivities for thethree zones.Effective soiland waterimpedingstructures andintensivecatchmenttreatment issuggested forthe first zone,in-situ moistureconservation isspecified for thesecond zone,and efficientwater-spreadingtechniques forthe third zone.17 �Typically allexistingwatershed planswith theagriculturedepartmentblank out all theforest land fromtheir maps asuntouchableareas even withthe knowledgethat these areasneed criticaltreatment. Theforestwatershed plansare equallyintractable withrespect to thenon-forestareas, no matterwhat thetopographicrealities may be.Similarly thegeo-hydrologists �have littlecontribution tomake to theterrestrialrealities (GoMP,1995b, p. 6).

5 0
surface water storage 18 .The limitation of data available forscientific watershed planning hasbeen noted from the start and hasled to an addition in the objectives ofthe mission, viz. to create a scientificdatabase 19 . The mission thus hasmade provisions for preparingmanual and digital watershed mapsfor all implementing agencies andline departments. The importance ofgenerating thematic maps for thewatershed pertaining to its geology,hydrology, land-use, topography, etc.has been recognised by the Missionat its very inception. The use ofaerial photographs and satelliteimageries has been suggested forupdating the status of these maps.The lack of expertise, training, andmotivation is considered one of theweaker links in operationalisingwatershed projects in the state. TheMission has the provision for invitingconsultants from NGOs andagricultural universities, and otherexperts for building better planningstrategies; it has allocated 1 per centof the total project cost for thepurpose.Some of the more recent changes(post-2002) undertaken eitherdirectly or indirectly under theinstitutional structure of RGMWMhave attempted to incorporate newaspects that minimise weaknessesand make missing elements good.An element of convergence hasbeen brought about by bringing 18districts � the districts that havereceived funds earmarked for theNational Rural EmploymentGuarantee Scheme (NREGS) � ofthe state into the fold of thewatershed programme. Majordifferences have come to the fore asa result of the convergence of funds;the convergence has enabled thestate government to sidestep theHariyali Guidelines. The MPgovernment has appointed NGOs asPIAs and allocated Rs.8000/- perhectare for the programme asagainst Rs. 6500/- allowed under the
provisions of the Hariyali guidelines.Also, the allocation under theadministrative head has been raisedto 20 per cent to strengthen thetraining and community organisationcomponent.Kapil Dhara is a recent initiative thatprovides �functional irrigation sourceto proactive backward farmers withsubstantial operational rainfedlandholdings in all NREGS district�.If the farmer belongs to a marginalsocial group, practices rain-fedagriculture, and has no source ofirrigation, he is deemed �backward�.This scheme, however, is notavailable to small and marginalfarmers as it is meant for farmerswho have operational holding above2 ha. Thus, while the principle ofequity is applied to sociallydisadvantageous groups, it fails tomake an impact on the economicallydisadvantageous groups.A more recent drive towardspromoting jetropa plantation maytake care of the issue of treatingCPLRs to some extent. Thisinitiative proposes to treat not only20 per cent of the wasteland in thestate but also generate livelihoodsupport at a later stage for the usergroups of the plantation. It is notclear, however, whether theproposed plantation will be raised onprivate or common propertywasteland.The organisational structure of theMission is in conformity with theMoRD as well as the CommonGuidelines (Table 4.3).
18 Exploratorydrills in Vindhyaregion suggestthat there isscope for storinggroundwater insome of theeastern districtswhich has thelimestone in theChhattisgarhplateau usingwater-spreadingtechnology andinjection wells.19 Though theHanumanthaRao CommitteeReportexpressesconcern aboutthe lack ofscientific data-base forwatershedplanning, thecentralgovernment, inits subsequentguidelines hasnot madeprovisions forbuilding one. TheRGMWMDocuments of1995 and 2002,remarkably,continue to giveimportance tobuilding arepository of(digital andmanual)database forwatershedplanning.

5 1
Level Leading Official
Agency Responsible Functions Supporting
Institutions
State Secretary, RGMWM (Mission Director)
Department of Panchayat and
Rural Development
1.Information node
2.Facilitator for long term capacity building
3.Monitoring implementation
District Collector (Mission Leader)
Zila Panchayat 1. Implementing 2. Monitoring
1. Dist. Watershed
Management Advisory Comm.
(Selection of watersheds) 2. Technical
Advisory Committee
Block * Project Officer
Project Implementing Agency (PIA)
and Watershed Development
Team
1.Overseeing Action Plan
2. Action Research
3. Capacity Building
4. Aiding in execution of plan, record (activity and
finance) maintenance
Project Coordinator
(one for every 1500 ha.)
Village Watershed
Committee and
Community Based
Organisations (CBOs)
(UGs, SHGs, Women�s Groups)
Micro-watershed/
village
Chairperson, Village
Watershed Committee / Panch. GP
Gram Panchayat #
1.Execution of Action Plan
2.Maintenance of Records
3.Disbursement of Fund for
developmental Work Vistarit Pani
Roko Samiti #
Table 4.3:InstitutionalStructureAdopted forRGMWM* Usually onemilli watershedis selected forevery block inone plan period.However, due toincomplete workin many of thesewatersheds,many Ninth Planmilli-watershedswere taken upagain in theTenth Plan.# Post HariyaliGuidelinesSource:Adopted fromGoMP, 2003.
The concern for inadequate technicalsupport since its inception getsmention in the Mission documentsand has been attempted to beaddressed by the provision ofsupport to the Zilla (District) Parishadby the District WatershedManagement Advisory Committeeand the Technical AdvisoryCommittee. This however, hasbecome somewhat diluted under theHariyali guidelines, whereresponsibilities of the DistrictWatershed Management Advisory
Committee, viz. selectingwatersheds, sanctioning watershedaction plans, and monitoringimplementation have been entrustedto the Zilla Parishad. At the blocklevel, the PIA is assisted by amultidisciplinary WatershedDevelopment Team, which isappointed for the purpose of thewatershed work. This consists ofspecialists from different linedepartments20.There has been a general
20 This team iscomposed ofpersons withbackground inPublic HealthEngineering,Forest,Agriculture,Horticulture,Sericulture,AnimalHusbandry, etc.Therepresentativefrom the forestdepartment ismandatory if theselectedwatershed hasarea underforest land.

5 2
apprehension that the increasedimportance of panchayats given inthe Hariyali guidelines may do awaywith the Village WatershedCommittees and bypass the interestsof groups that are not powerful orvocal. The RGMWM has worked outsome balance in the institutionalstructure, whereby an independentinstitution � Vistarit Pani RokoSamiti21� will advise and guide theGram Panchayat about thewatershed work.
21 The PaniRoko Abhiyan(2001) (see thenext section) andin the non-watershedvillages PaniRoko Samiti arenow expandedand renamed asthe Vistarit PaniRoko Samiti. Thelatter hasrepresentationfrom all UserGroups, SelfHelp Groups andWomen�s Thriftand CreditSocieties.
Village Watershed Committees/ Vistarit
Pani Roko Samiti User Groups Self Help Groups Women�s Groups
Federation at milli-watershed Accessing funds from other organisations Insurance schemes Marketing products (farm and non-farm)
NABARD Rashtriya Mahila Kosh
SGSY Credit DPIP Marketing MPRLP for off-farm
work
Grain Bank (Food Security)
Community
Swarn Jayanti Gram Swarozgar Yojana for non-farm work
The Community BasedOrganisations (CBOs) are set up tostrengthen the linkages betweennatural resource management andlivelihood. The user groups are thelandowners who enjoy direct benefitsof NRM activities. Other that soil andwater conservation activities, suchgroups, which also include groups ofsmall and marginal farmers, havealso been linked with land-basedactivities like nursery development,horticulture, plantation, andfloriculture. Self Help Groups (SHGs)of the land-poor classes have been
Figure 4.1: Supporting InstitutionalStructures at the Micro-Watershed Level
involved in the off-farm work likeraising poultry, dairy industry, andmanaging fisheries and even non-farm traditional handicrafts(particularly in the tribal pockets) likeworking with terracotta or bell metal,and chanderi and kosa weaving.The off-farm work is furtherstrengthened by parallel schemeslike Swarnjayanti Gram SwarozgarYojana (SGSY), District PovertyInitiatives Program (DPIP) andMadhya Pradesh Rural Livelihoods
Project (MPRLP), while themarketing links for the non-farmcategory of work are facilitated byHaat Bazar or SGSY. Federations atthe milli-watershed levels aid theSHGs to have greater access tocredit for irrigation pumps, livestock,and equipment for non-farmactivities. The federation alsoinitiates insurance schemes to covercrop, assets, livestock, health,maternity, old age securitymeasures, etc. Grain bank isanother institution that aims toprovide food security during lean
5 3
season to scheduled castes andschedules tribes and other needyfamilies on loan basis.Thus it can be seen that thesupporting institutional structuresanctioned by the provisions of theMission has substantial scope tostrengthen linkages between NRMand livelihood on the one hand andhelping the landless who may notdirectly benefit from the NRMactivities. The mission has alsoattempted to use the institutionscreated under watershedprogrammes to enhance the socialquality of life in the rural areas,following the watershed plusapproach of integrated development.Specifically, as per the missiondocument (GoMP 2003b), promotionof awareness about both natural andsocial environment through panchtatwa22 has been used as a criterionfor selection of the watershed villagewithin a milli-watershed.There is also a provision for anexternal agency monitoring theMission that uses yardsticks such asequitable sharing of resources,participation in planning andimplementation, restoration ofecological benefits and socio-economic conditions of the village,optimisation of resource utilisation,etc. Evaluations are carried out once45 per cent of the fund has beenutilised to allow for mid-termcorrections and the same is repeatedat the end of the project. Theguidelines for evaluation have beenprovided by the central government.What is innovative in the Mission�sevaluation process is a system ofsocial audit or nirakh parikh which isconcurrent rapid participatoryevaluation by beneficiaries. Themultidimensional evaluationtechnique maps all the inputs and theoutputs in a khasra (cadastral) map,validates the watershed committee�sclaims, and identifies the membersand areas in the watershed that havebeen bypassed by the programme.This process of social auditing allowsincreased ownership of the
stakeholders in the project,transparency, and scope for furthercorrections even outside theparameters of the project.b) Pani Roko AbhiyanPani Roko Abhiyan is a water-conservation and harvestingmovement that was initiated after thewidespread kharif drought in 2001.This movement was undertaken bythe RGMWM in all non-watershedvillages. These drought proofingefforts use simple, low-cost waterharvesting methods and areundertaken by the community with itsown resources with the aim of in-situwater conservation. Under the PaniRoko Abhiyan , old tanks and waterharvesting structures have beenrenovated to make the efforts cost-effective. The following sourcesfunded the water conservationmovement:1. Rural development programmeslike EAS, SGRY, Tribal DevelopmentFund, etc.2. State and central financecommissions.3. DFID funding routed throughUNICEFThe two major initiatives thatsupported the action plans werewater budgeting, i.e., assessment ofthe difference between waterrequirement and water availability,based on which the villagers madethe plans. The water resourceregister, which is maintained by thevillagers, contains relevant detailsabout all surface and ground watersources in the village. Since the PaniRoko Abhiyan followed a disasterwhose effects were etched in theminds of the people, this media-supported movement was said to beextremely successful. The Abhiyanfor water harvesting has now mergedwith the Panch Ja Abhiyan (Jal, Jan,Jangal, Jamin, and Janwar )23
incorporating other aspects of ruraldevelopment. Though the watershedprogrammes run by the Panchayatand the Rural Development
22 The panchtatwa includeskulaharbandi(ban on fellingtrees),charaibandi(ban on opengrazing),angutha bandi(completeliteracy),nashabandi(ban on liquor)and nas bandi(adoption offamily planningmeasures).
23 The PanchJa Abhiyan aimat sustainabledevelopmentencompassingJal (water), Jan(Community),Jangal (forest),Jamin (land),and Janwar(livestock).

5 4
department and the Pani RokoAbhiyan are, strictly speaking, notcomparable, the latter appear moresignificant in terms of theexpenditure in only the last two years(2001-2003), compared to totalexpenditures on the watershedprojects undertaken under EAS,DPAP, and IWDP put together since1995 (up to 2003) (Rs. 1458 croreagainst Rs.1052 crore). In allprobability this is due to the highercoverage of the Pani Roko Abhiyanwhich is operative in all non-watershed villages of the state. Thepeoples� share in the expenditure inthe Pani Roko Abhiyan amounts to17.6 per cent, which is higher thanthe general cost sharing normseffective in the watershedprogrammes. The most significantcontribution of the Pani RokoAbhiyan, however, is in terms ofcreating community-basedinstitutions in almost every village inMadhya Pradesh that are resource-literate and in tune with the conceptof livelihood support through naturalresource enhancement.
CAPART-Supported ProjectsMadhya Pradesh is one of theimportant recipients of CAPART-funds for implementing WatershedConservation and DevelopmentProjects. The approach adopted byCAPART is substantially differentfrom the two discussed above.CAPART assistance is divided intofour components: 75 per cent forwatershed treatment/developmentwork, 5 per cent each for communityorganisation and training and 15 percent for meeting administrativeoverheads.As per the guidelines, new voluntaryorganisations (VOs) are first put in �B�track and only after they havesuccessfully completed their trainingunder one of the Support VoluntaryOrganisations (SVOs) is the approvalfor preparation of Action plan undertrack �A� given. The emphasis is onthe capacity building and involvementof people at every stage, right fromplanning and implementation tosharing of usufruct and maintenanceof the watershed.
An Alternative ModelLupin foundation, which is a voluntary organisation founded by a pharmaceutical firm startedwork in Madhya Pradesh (Raisen district) in 1988 along with Rajasthan, Maharashtra, andUttanchal. It has adopted a total of 1600 villages in India and 60 in Madhya Pradesh. Thefoundation started work under the RGMWM framework, but withdrew later since it wanted tofollow a different model. There were conflicts with the forest department and the Foundation wasnot allowed to work in the forest area while working with RGMWM funds. The organisation nowindependently undertakes natural resource management activities with its own fund and supportfrom external (international) sources, which the organisation argues, gives them greater freedom.The Lupin model is different from RGMWM framework in two major ways:1. The foundation has not compromised with the ridge to valley approach and initiallytreated ridgelines in the milli-watershed (Varna, Raisen district), irrespective of micro-watershedboundaries.2. The Foundation believes that intervention lasting 5 years is not sufficient to make a longterm impact and therefore it does not withdraw at the end of 5 years. Though the watershedprogrammes undertaken by it continues to operate for 7 years, the Foundation stays at least for20 years in the village for the other programmes, which it feels generate multiplier effects instrengthening participatory institutional structures at the village level.Further, the foundation undertakes other human development programmes in the same villagesalong with the watershed programme (health, education, veterinary programmes, agriculturalextension etc.). The complementarities in the different projects aid in making significant dent inrural livelihoods. The foundation acts only as a facilitator, while villagers take decisions in thevillage level committee and the various user groups. The foundation intervenes only whenapproached by the village committee for conflict resolution.

5 5
Besides watershed projects,CAPART has also funded 11 projectsfor drought proofing in the state.Experiences from these projects mayhave significant bearing on theapproach for watershed developmentin drought prone areas in the state(http://capart.nic.in/function.htm#WATERSHED).Samaj Pragati Sahyog (SPS),located in Bagli in Dewas district, hasbeen functioning as an SVO inMadhya Pradesh. The role of theSVO is to reach out to a largenumber of sincere groups in civilsociety who are scattered andprovide them support right from thestage of resource mobilisation toproject implementation. An SVOwould support 200 partners over aperiod of 20 years; each partnercould implement 10 watersheds of2,500 ha each. SPS, has made asignificant contribution in thisdirection though, we do not havefurther details on their outreach aswell as activities for including it in thereview. The report by theParthasarthy Committee has stronglyendorsed the approach of SVOsespecially, for up-scalingparticipatory watersheddevelopment, based on the CAPARTguidelines (See, �From Hariyali toNeeranchal�, GoI, 2006).Apart from functioning as an SVO toabout 23 partners in 11 districts inthe state, SPS has implementeddrought proofing project covering6000 ha. in 20 villages in Dewasdistrict of M.P. The project, over thepast 10 years, has made a significantimpact: there has been almost three-fold increase in the irrigated areawhereas out migration from theproject villages and their peripherieshave come down.
4.2 Aspects of Implementation ofWatershed Projects in MadhyaPradeshThere have been two broad basedevaluation studies of watershed
projects in MP, both have looked atthe performance of RGMWMprojects. One has been carried outby TARU Leading Edge (2001)(Delhi/Hyderabad) in associationwith Sanket and has been submittedto UNICEF24. The other has beenundertaken by the Centre forAdvanced Research andDevelopment (CARD), Bhopal, forthe Government of India, Ministry ofRural Development, MonitoringDivision (2002). 25 In this section, wehave depended a great deal on thesetwo studies, primarily because of theextent of their spatial coverage and alarge number of samples. In addition,a large number of other studies thatrefer to separate single micro-watersheds/ milli-watershed, havealso been used 26. These also includea large number of mid-termevaluation reports of various projectssubmitted to the Panchayat andRural Development Department ofthe Government of Madhya Pradesh.To the extent possible, we have triedto include a variety of reports thatcover not only projects from differentparts of Madhya Pradesh, but alsoprojects implemented by differentagencies. However, scant material isavailable on NWDPRA projects, andthis is one of the limitations of ourreview at this stage. We have,however, tried to supplement thereview with some field visits primarilyto comment upon some of theprocess variables, though these areby no means representative of thestate.
24 A total of 58project villagesspread over 30milli-watersheds� two in eachstudy district,with theexception ofJabalpur,Jhabua, andSarguja wherethree milli-watershedshave beenstudied �covering a totalof 13 districtsspread across12 major agro-ecologicalzones of M.P.Preference wasgiven to milli-watershedswhereinterventionswere initiated inor before 1996-97; there were25 such casesmilli-watersheds. Inaddition to theproject areas,13 controlvillages spreadover 7 agro-ecologicalzones/ districtswere also takenintoconsideration.
25 The CARD study had representatives of both the DPAP and theIWDP programmes. It was undertaken in 29 districts of MP covering atotal of 121 blocks, 372 micro-watersheds and 383 villages. UnderDPAP, 105 blocks of 21 districts were covered and under IWDP, 16blocks from 12 districts were covered. A total of 2926 beneficiariesand 718 non-beneficiaries were covered under DPAP, whereas underIWDP, 274 beneficiaries and 89 non-beneficiaries were covered. Bothbeneficiaries and non-beneficiaries were from the same villages.According to the report, most of the non-beneficiaries were below thepoverty line.26 Two of these include studies of NWDPRA and Rural Developmentprojects compiled by The Energy Research Institute (TERI) for a largenumber of states in India.

5 6
a) Limitations of Review ofAssessment StudiesAn assessment of the firstgeneration watershed programmeson the basis of published andunpublished documents can provideuseful insights into some of theelements of our normativeframework. However, two issues areimportant in this context. First, thequality of such an exercise woulddepend upon the nature ofdocumentation, its methodologicalstrengths and coverage, both interms of spatial and of issues dealtwith. Secondly, the degree ofachievement is expected to varyfrom project to project depending onthe location, institutional framework,the prevailing class and castestructure in each project area, andthe time-caveat in which the impactanalysis was done. There are someinherent limitations in drawingsystematic conclusions from studiesthat adopt different methodologies orframeworks of analysis. In manycases, there is a problem of siftingout the impact of watershedprogramme. To isolate the impact ofwatershed programme, a control
sample is required not only from anon-watershed area, but preferablyfrom a location which does not enjoypositive externality impact from thewatershed work undertaken in thebroader catchment 27. At the sametime, the general socio-economiccharacteristics in the pre-projectperiod of the watershed and controlsample have to be comparable. Inmost of the project evaluations, theanalyses have depended on recallsurveys, and some mention this as alimitation of their analysis. Aspreviously explained, regionalissues in the state with regard towatershed development aredifferent; a comparison of differentregions will not be possible from theavailable information.b) Administration and Funding:Most of the studies agree thatdelays in release of funds reduceefficacy of the project. (TARULeading Edge, 2001; CARD, 2002d).Since the funds from the state arenot released before mid-termreviews which take place after thesecond year, analysis of expenditurepatterns show that only about three-
27 TARU (2001)study takescontrol samplesfrom villagesoutside the milli-watershedscovering 7 agro-climatic zonesand to that extenttakes care of thismethodologicallimitation.
Period Types of Work Share of Total Fund (%) Release to PIA
Year 1 Administration, Community Organisation, Village Level Training, Entry Point Activity
15
Year 2 Administration, Community Organisation, Village Level Training
5
Year 3 Administration, Village Level Training
5
Release to VWC Year 1 10 Year 2 Instalment 1 Instalment 2
15 20
Year 3 Instalment 1 Instalment 2
10 10
Year 4
Watershed Works
10
Table 4.4:Phases ofFinancialDisbursementto PIA andVWC fromRGMWMState Office
Source: TaruLeading Edge,2001

5 7
fourth of the sanctioned funds arespent by the end of the fifth year.Also, a large part of the fund is spenttowards the end of the project, thuspresumably compromising on natureof activities undertaken towards theend of the projects. The pattern ofrelease of funds is given in Table 4.4.It can be seen that at least 30 percent of the fund to be released to theVWC for the developmental activitiesare likely to be delayed if the mid-term review is delayed.The actual expenditures is not verydifferent from the share of thesanctioned funds except the fodderdevelopment and �other� activities,which primarily include financialsupport to the CBOs, spendsubstantially less than their averageshare of the sanction (Table 4.5).Also, the variations in expenditureunder these heads in different micro-watersheds are far greater than thedeviations under other heads. Whilethe fodder development possibilitiescould vary substantially acrosslocations, given the factors likeavailability of common pastureland,the need for strengthening CBOs isexpected to have a more similardemand pattern. It has beenobserved by different studies,consequently, that these are twoareas that the projects have oftenfailed to address.It needs to be re-emphasised at thisstage that this review is not meant tobe an assessment of the watershedprojects in the state. Given ournormative framework, we wouldrestrict our review to the threeaspects of sustainability, livelihood,and equity and finally deal with theprocess indicators of institutions andparticipation that would not onlyensure success in terms of the abovecriteria, but also are crucial forsustenance of the project after theformal withdrawal of the projectfunding.
Activity Average share of sanction
Average share of
expenditure Standard Deviation
CV
Soil Conservation 30 33 16 48 Water Conservation 40 46 9 20 Afforestation 10 11 6 55 Fodder Development 10 3 3 100 Others 10 6 7 117
Table 4.5: Heads of Activities andVariability in Expenditures
Source: Computed from Taru Leading Edge, 2001
c) Environmental SustainabilityThe systemic linkages between thethree important natural resources ofland, water, and vegetation within thewatershed offers the potential toenhance all three resources,provided that the soil and waterconservation technique adoptedwithin the programme is sound andsuited to the local conditions. Thispotential, according to thediscussions held with keyinformants28 , is not fully actualised inMadhya Pradesh. In most cases theforest areas within the watershedcannot be treated as they comeunder the forest-working plan 29.Though soil and moistureconservation treatment is one of thecomponents of forest conservationunder the forest-working plan, thistreatment does not follow the ridge tovalley approach. It emerges from thediscussions with our key informantsthat the benefits of work done in oneforest range or compartment couldaccrue to another range orcompartment as the ranges cutacross watershed boundaries. Sincethe forest cover is so extensive in thestate, maintaining associationbetween land and water with thisresource is particularly important.In a majority of currently documentedcases of watershed programmes inM. P., the benefits of soil and waterconservation works are clearly
28 These keyinformants werefrom the stategovernment andfrom the IndianInstitute ofForestManagement,Bhopal.29 Work iscarried out asper workingcirclesdemarcated bythe forestdepartments.Forest circlesare divided intodivisions, whichare separatedinto sub-divisions, furtherinto forestranges andfinally intocompartments.The two kinds offorest circlesthat aredemarcated areproductioncircles for thedense forestsandconservationcircles for thedegradedforests. Only 5.4per cent forestarea isdemarcated asconservationcircles (GoMP,1998).

5 8
visible, particularly in terms ofpositive land-use changes due toimproved water availability.According to Taru Leading Edge(2001), while 80 per cent of thewatershed villages have reportedincrease over the project period, only60 per cent of the control villageshave done the same. It has beenreported that the increase in the areahas been fed not only from thecultivable land (i.e. fallows andcultivable wasteland), but also fromthe land that was previouslyclassified as barren and unculturablewasteland (CARD 2002d)30 .Similarly, non-crop biomass increasehas been reported in 14 per cent ofthe watershed villages. Incomparison, none of the controlvillages showed such improvements.The water availability, particularlyfrom drinking and irrigation hasexperienced both a horizontalincrease, i.e., in numbers andcatchments of water sources, as wellas vertical increase i.e., the rise ofthe water table in existing groundwater sources (CARD, 2002d;TARU, 2001; CSWCRTI, 2004).Existing literature indicates that, attimes, a comparison of beneficiariesand non-beneficiaries in terms ofagricultural parameters resemblesthe comparison between irrigatedand unirrigated agriculture. Themulti-state review of NWDPRA findsthat in M. P. (Chanderi Nala,Khargaon District) the difference inthe extent of irrigation betweenwatershed and control householdswas very large: 75 per cent in the
former and 23 per cent in the latter(Deshpande and Narayanmoorthy,1999). The availability ofgroundwater in wells and from hand-pumps shows a distinctimprovement in the watershedvillages when compared with thecontrol villages (Table 4.6). Althoughall the water problems in thewatershed villages have not beentaken care of, definite improvementsin the dry months of March and Aprilhave been noted. There is onlymarginal increase in the availabilityof water in May and June. In somewestern parts of the state, watermarkets have emerged with theincrease in water availability, asnoted from DANIDA experiences.(Cohesion 2005) 31 .The CARD study, which conducteda survey in 2001, the year ofextensive kharif drought, is lessoptimistic about the generalincreases in the water table. Thesurvey showed a decline in thesown area in parts of the JhabuaHills and Malwa Plateau, andattributed it to both drought and lowefficiency of watershed projects.This probably indicates that theobjective of drought proofing has notbeen addressed adequately in thestate.The general increase in both theextent and intensity of agriculturalland-use as a result of better wateravailability has been reported fromextensive surveys, both throughprimary surveys and satelliteimageries (CARD 2002d; TERI
30 CARD(2002) reportsthat there hasbeen an increaseof about 24 ha. inthe area underplough per micro-watershed underDPAP projects(assuming thearea of a micro-watershed to beroughly 500hectare, thisworks out to benearly 5 percent) , of whichabout a third isreportedlycontributed bybarren andwasteland.31 I n suchcases, smallfarmers who donot have thecapital to accessground waterhave startedbuying waterfrom largefarmers.
Per cent of Sample Watershed Villages
Per cent of Sample Control Villages
Months
1995 2000 Difference in per cent
1995 2000 Difference in per cent
March 37.9 24.1 -13.8 38.5 38.5 0 April 63.8 53.4 -10.3 53.8 53.8 0 May 89.7 87.9 -1.7 92.3 92.3 0 June 81.0 81.0 0.0 92.3 92.3 0
Table 4.6: Percentage of Sample Villages Reporting Dry Ground Water Sources inPre- and Post-Watershed Periods
Source:Calculated fromTaru, 2001
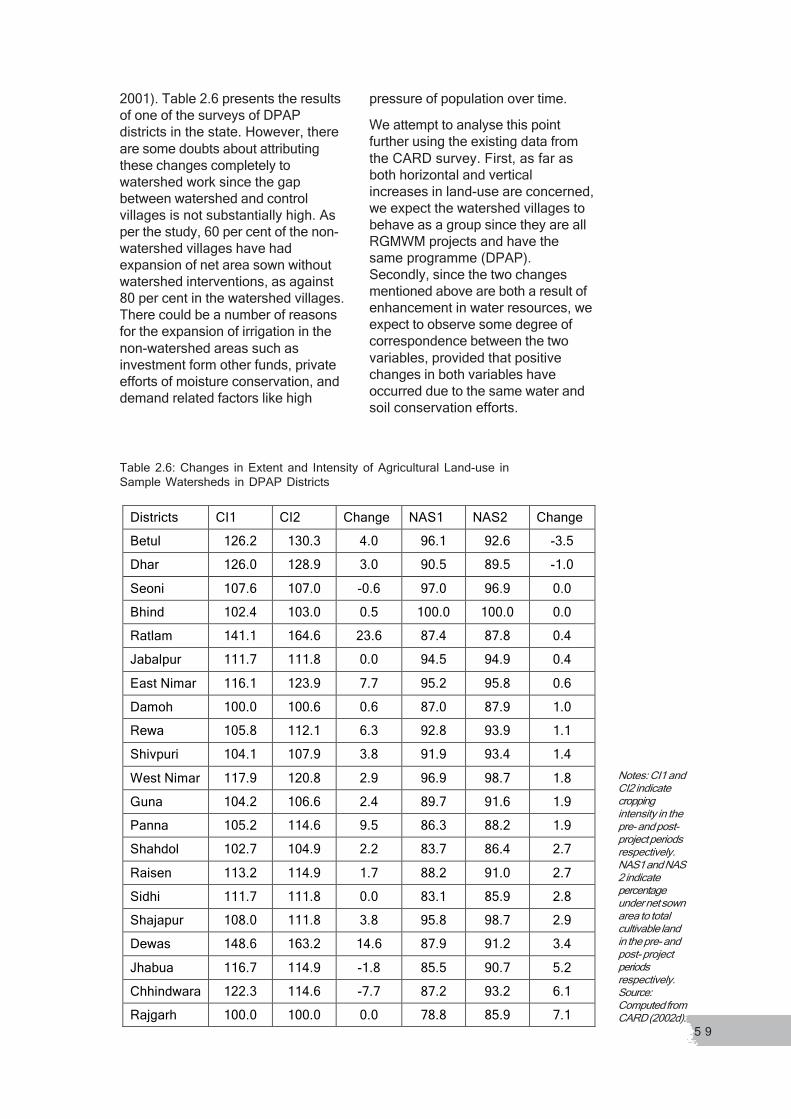
5 9
2001). Table 2.6 presents the resultsof one of the surveys of DPAPdistricts in the state. However, thereare some doubts about attributingthese changes completely towatershed work since the gapbetween watershed and controlvillages is not substantially high. Asper the study, 60 per cent of the non-watershed villages have hadexpansion of net area sown withoutwatershed interventions, as against80 per cent in the watershed villages.There could be a number of reasonsfor the expansion of irrigation in thenon-watershed areas such asinvestment form other funds, privateefforts of moisture conservation, anddemand related factors like high
pressure of population over time.We attempt to analyse this pointfurther using the existing data fromthe CARD survey. First, as far asboth horizontal and verticalincreases in land-use are concerned,we expect the watershed villages tobehave as a group since they are allRGMWM projects and have thesame programme (DPAP).Secondly, since the two changesmentioned above are both a result ofenhancement in water resources, weexpect to observe some degree ofcorrespondence between the twovariables, provided that positivechanges in both variables haveoccurred due to the same water andsoil conservation efforts.
Districts CI1 CI2 Change NAS1 NAS2 Change Betul 126.2 130.3 4.0 96.1 92.6 -3.5 Dhar 126.0 128.9 3.0 90.5 89.5 -1.0 Seoni 107.6 107.0 -0.6 97.0 96.9 0.0 Bhind 102.4 103.0 0.5 100.0 100.0 0.0 Ratlam 141.1 164.6 23.6 87.4 87.8 0.4 Jabalpur 111.7 111.8 0.0 94.5 94.9 0.4 East Nimar 116.1 123.9 7.7 95.2 95.8 0.6 Damoh 100.0 100.6 0.6 87.0 87.9 1.0 Rewa 105.8 112.1 6.3 92.8 93.9 1.1 Shivpuri 104.1 107.9 3.8 91.9 93.4 1.4 West Nimar 117.9 120.8 2.9 96.9 98.7 1.8 Guna 104.2 106.6 2.4 89.7 91.6 1.9 Panna 105.2 114.6 9.5 86.3 88.2 1.9 Shahdol 102.7 104.9 2.2 83.7 86.4 2.7 Raisen 113.2 114.9 1.7 88.2 91.0 2.7 Sidhi 111.7 111.8 0.0 83.1 85.9 2.8 Shajapur 108.0 111.8 3.8 95.8 98.7 2.9 Dewas 148.6 163.2 14.6 87.9 91.2 3.4 Jhabua 116.7 114.9 -1.8 85.5 90.7 5.2 Chhindwara 122.3 114.6 -7.7 87.2 93.2 6.1 Rajgarh 100.0 100.0 0.0 78.8 85.9 7.1
Table 2.6: Changes in Extent and Intensity of Agricultural Land-use inSample Watersheds in DPAP Districts
Notes: CI1 andCI2 indicatecroppingintensity in thepre- and post-project periodsrespectively.NAS1 and NAS2 indicatepercentageunder net sownarea to totalcultivable landin the pre- andpost- projectperiodsrespectively.Source:Computed fromCARD (2002d).

6 0
Change in Pe rce nt ag e of Area un der Ploug h to To tal Cultivable L an d in DPAP Sam ple Water she ds in M ad hya
Prade sh
R2 = 0.8283
75
80
85
90
95
100
75 80 85 90 95 100
p re- pro ject
po
st p
roje
ct
Figure 4.2
Ch ange in Crop ping In te nsit y Ch an ge in DPAP Sam ple Wate rsh eds in M adh ya Prad esh
R2 = 0 .9081
100
110
120
130
140
150
160
170
100 110 120 130 140 150 160 170
p re- pro ject
po
st-p
roje
ct
Relationship of Changes in Agricultural Area Extension and Land-use Intensity
-6.0
-4.0
-2.0
0.0
2.0
4.0
6.0
8.0
-10.0 -5.0 0.0 5.0 10.0 15.0 20.0 25.0 30.0
percentage CI change
perc
enta
ge N
AS
chan
ge
Figure 4.3
Figure 4.4

6 1
Figures 4.2 and 4.3 show that interms of the increases in bothexpansion of net sown area andcropping intensity, the selectedmicro-watersheds in the 21 DPAPdistricts follow a consistent pattern.However, there is no associationbetween the changes in the twovariables, indicating that some ofthese changes may have occurreddue to processes other thanwatershed management efforts(Figure 4.4). This raises the questionof attribution in a study, which seeksto compare pre-post situations whereseveral interventions are taking placesimultaneously.One of the missing links in the effortsat environmental sustainability is thefailure to address the CPLRdegradation. Inadequacy of fundspent under this head and itsvariability across villages has beenidentified as one of the reasons forneglecting CPLRs.. The otherproblem is that CPLRs have beenencroached upon by the powerfulmembers of the village community. Itis not easy to handle the issue withinthe framework of the VWCs as theyhave no regulatory powers. It is to behoped that such problems would bedealt with better through thepanchayats under the Hariyaliguidelines. Some instances ofsuccess have been observed in thisregard in homogenous tribalcommunities, for example, inDANIDA project in Jhabua.The need for intervention in commonland is probably greater in upstreamareas than in downstream, onaccount of both natural and socialreasons. The degraded forest area inthe upper catchments, particularly inthe tribal dominated regions isextensive due to deforestation. Sincethe slopes are greater, the need forafforestation and pasturedevelopment in these areas is moreurgent. Also, such soil and moistureconservation work would havepositive externalities in the micro-watersheds located downstream.Moreover, the people in the upper
catchment usually have access toless land and it is of a poorer quality(Hooja and Puskar, 2005). Theydepend primarily on livestock andhence their fodder requirement isintrinsically linked to their livelihoods.Some of the weaknesses that havebeen identified by the existingdocumentation that lead to reducedefficacy in terms of environmentalsustainability are:
Delays in release of fund (CARD2002d)Inadequacy of allocated fundsunder certain heads and the scaleof operationsPriorities and attitude of thecommunity not in tune with theaction plansProblems of planning and technicalweaknesses in watershed works(ANARDe Foundation 2005b,CARD 2002a32).Social conflicts over sites of waterharvesting structures (CARD2002c).
d) Livelihood EnhancementThe benefits of watershed projects,especially supporting and enhancinglivelihoods, need to be relatedclosely to the activities undertakenwithin the watershed. Much of thelivelihood benefits are supposed tooriginate from the natural resourcemanagement, for example, theincrease in agricultural productionand greater availability of fodder andfuel from afforestation, plantation andpastures. Some of the livelihoodchanges can occur through theinstitutions created in the course ofwatershed work like SHGs andWomen�s Thrift and Credit Societies.While strengthening the formersource of livelihood would primarilybenefit the landed class (other thanthe income coming from the CPRs),enhancement from the latter isusually geared towards the land-poorand the landless. Both sources are
32 Theexperience inBetul of DPAPprojects showthat there hasbeen apreference forconstructingbiggerstructures whensmallerstructures canserve thepurpose. Also,similarstructures hadvarying costs.
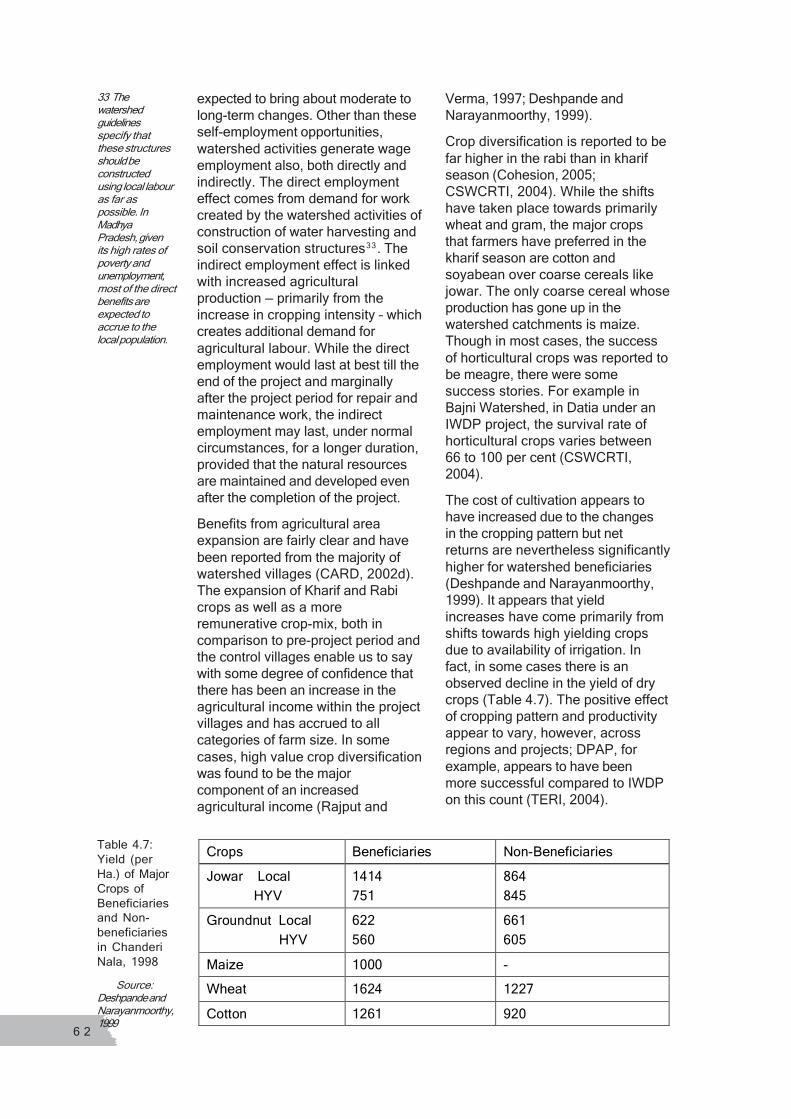
6 2
expected to bring about moderate tolong-term changes. Other than theseself-employment opportunities,watershed activities generate wageemployment also, both directly andindirectly. The direct employmenteffect comes from demand for workcreated by the watershed activities ofconstruction of water harvesting andsoil conservation structures33. Theindirect employment effect is linkedwith increased agriculturalproduction � primarily from theincrease in cropping intensity � whichcreates additional demand foragricultural labour. While the directemployment would last at best till theend of the project and marginallyafter the project period for repair andmaintenance work, the indirectemployment may last, under normalcircumstances, for a longer duration,provided that the natural resourcesare maintained and developed evenafter the completion of the project.Benefits from agricultural areaexpansion are fairly clear and havebeen reported from the majority ofwatershed villages (CARD, 2002d).The expansion of Kharif and Rabicrops as well as a moreremunerative crop-mix, both incomparison to pre-project period andthe control villages enable us to saywith some degree of confidence thatthere has been an increase in theagricultural income within the projectvillages and has accrued to allcategories of farm size. In somecases, high value crop diversificationwas found to be the majorcomponent of an increasedagricultural income (Rajput and
Verma, 1997; Deshpande andNarayanmoorthy, 1999).Crop diversification is reported to befar higher in the rabi than in kharifseason (Cohesion, 2005;CSWCRTI, 2004). While the shiftshave taken place towards primarilywheat and gram, the major cropsthat farmers have preferred in thekharif season are cotton andsoyabean over coarse cereals likejowar. The only coarse cereal whoseproduction has gone up in thewatershed catchments is maize.Though in most cases, the successof horticultural crops was reported tobe meagre, there were somesuccess stories. For example inBajni Watershed, in Datia under anIWDP project, the survival rate ofhorticultural crops varies between66 to 100 per cent (CSWCRTI,2004).The cost of cultivation appears tohave increased due to the changesin the cropping pattern but netreturns are nevertheless significantlyhigher for watershed beneficiaries(Deshpande and Narayanmoorthy,1999). It appears that yieldincreases have come primarily fromshifts towards high yielding cropsdue to availability of irrigation. Infact, in some cases there is anobserved decline in the yield of drycrops (Table 4.7). The positive effectof cropping pattern and productivityappear to vary, however, acrossregions and projects; DPAP, forexample, appears to have beenmore successful compared to IWDPon this count (TERI, 2004).
33 Thewatershedguidelinesspecify thatthese structuresshould beconstructedusing local labouras far aspossible. InMadhyaPradesh, givenits high rates ofpoverty andunemployment,most of the directbenefits areexpected toaccrue to thelocal population.
Crops Beneficiaries Non-Beneficiaries Jowar Local HYV
1414 751
864 845
Groundnut Local HYV
622 560
661 605
Maize 1000 - Wheat 1624 1227 Cotton 1261 920
Table 4.7:Yield (perHa.) of MajorCrops ofBeneficiariesand Non-beneficiariesin ChanderiNala, 1998 Source:Deshpande andNarayanmoorthy,1999
6 3
Given the methodologies adopted inmany of the studies, the problemagain is whether the positivechanges in farm livelihoods can bejustifiably attributed to watershed soiland conservation work. It may benoted that most of the changes incropping pattern observed in primarysurveys are similar to the changes atthe state level. The increase of areaunder wheat and soyabean is clearlya state level phenomenon. Studieswith more cautious approaches, infact, are doubtful as to whetherincreases in yield, land values, andthe number of livestock have resultedfrom the watershed activities sincesimilar increases have beenobserved in areas outside thewatershed.The direct wage employment fromthe project has been significant andthe landless in most cases have gotsubstantial relief from the additionalincome. There is also some evidencethat the rate of migration hastemporarily gone down in many ofthe villages. Also, the wages paidfrom the watershed projects havebeen reported to be higher than theexisting wage rates. About a third ofthe sample household from theDANIDA funded projects in thewestern districts of the state havereported 50 per cent rise inemployment. The long-term indirectemployment effect from increasedagricultural production is less clear.There is no major difference betweenthe watershed and control villages inthis respect, except in isolatedcases.An assessment of impact onmigration is complex as migrationoccurs due to both, push and pullfactors. The push factors may haveweakened, without resulting in anysignificant change in out-migration.Some districts have experienced areduction in seasonal out-migration,but the overall impact on this aspectis mixed. Our field visits in Jhabua(for both NWDPRA and RGMWMprojects) reveal that migration ofyoung couples to states like Gujarat
and Rajasthan (Kota, in particular)continue in spite of increases inproductivity and employment. Theelderly and the children stay back,the former looking after the fields andthe latter to attend schools. TheDANIDA-funded projects underNWDPRA programme, report asignificant reduction in migrationboth in the number of familymembers migrating and the durationof migration as a result of anincrease in employmentopportunities spread over a greaterperiod of the year.The objective of drought mitigation,according to the CARD study, hasbeen more or less fulfilled in somedistricts. Examples of districts whereDPAP has alleviated the effect ofdrought are Guna, Khargaon,Shajapur, and Shivpuri (CARD2002d). However, in spite of highintensity of watershed work in lowrainfall and high variability areas likeJhabua, Dhar and Ratlam, theprogramme has failed to offer reliefduring drought in three successiveyears from 1999 to 2001. The failureto address drought in these casesmay be on the one hand related tothe nature of work done as a part ofthe project but on the other, may alsobe due to the severity and frequencyof drought in these districts. TheDANIDA experience from the samedistricts, interestingly, does not showsignificant reduction in income duringthe same period (Cohesion, 2005).Thus, changing the model ofoperation somewhat may provideencouraging results.Though a lot of livelihood-enhancingvariables have undergone positivechanges at the village level, one ofthe issues of concern is thatinterventions have bypassed a largenumber of village communitymembers. The study carried out byCARD (2002d), which uses non-beneficiaries from the watershedvillages as control samples, statesthat most of them are from BPLfamilies. This, in itself, raises aquestion about equitability in the
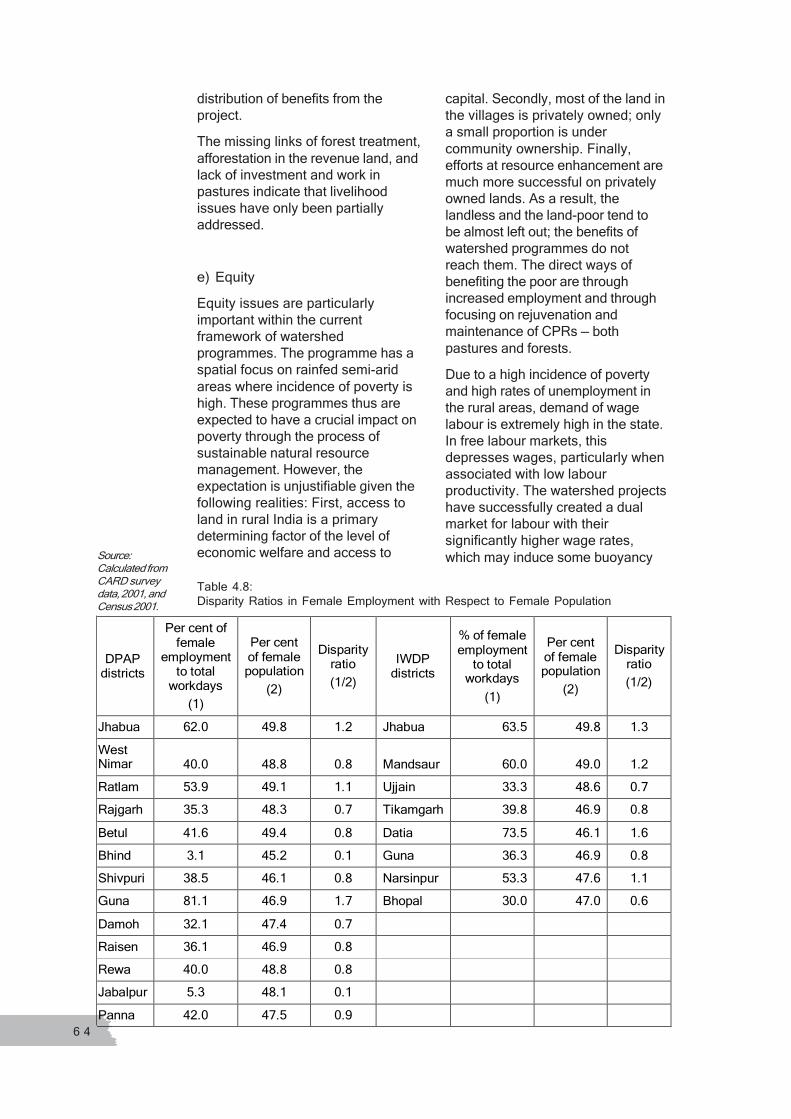
6 4
distribution of benefits from theproject.The missing links of forest treatment,afforestation in the revenue land, andlack of investment and work inpastures indicate that livelihoodissues have only been partiallyaddressed.
e) EquityEquity issues are particularlyimportant within the currentframework of watershedprogrammes. The programme has aspatial focus on rainfed semi-aridareas where incidence of poverty ishigh. These programmes thus areexpected to have a crucial impact onpoverty through the process ofsustainable natural resourcemanagement. However, theexpectation is unjustifiable given thefollowing realities: First, access toland in rural India is a primarydetermining factor of the level ofeconomic welfare and access to
capital. Secondly, most of the land inthe villages is privately owned; onlya small proportion is undercommunity ownership. Finally,efforts at resource enhancement aremuch more successful on privatelyowned lands. As a result, thelandless and the land-poor tend tobe almost left out; the benefits ofwatershed programmes do notreach them. The direct ways ofbenefiting the poor are throughincreased employment and throughfocusing on rejuvenation andmaintenance of CPRs � bothpastures and forests.Due to a high incidence of povertyand high rates of unemployment inthe rural areas, demand of wagelabour is extremely high in the state.In free labour markets, thisdepresses wages, particularly whenassociated with low labourproductivity. The watershed projectshave successfully created a dualmarket for labour with theirsignificantly higher wage rates,which may induce some buoyancy
DPAP districts
Per cent of female
employment to total
workdays (1)
Per cent of female population
(2)
Disparity ratio (1/2)
IWDP districts
% of female employment
to total workdays
(1)
Per cent of female population
(2)
Disparity ratio (1/2)
Jhabua 62.0 49.8 1.2 Jhabua 63.5 49.8 1.3 West Nimar 40.0 48.8 0.8 Mandsaur 60.0 49.0 1.2 Ratlam 53.9 49.1 1.1 Ujjain 33.3 48.6 0.7 Rajgarh 35.3 48.3 0.7 Tikamgarh 39.8 46.9 0.8 Betul 41.6 49.4 0.8 Datia 73.5 46.1 1.6 Bhind 3.1 45.2 0.1 Guna 36.3 46.9 0.8 Shivpuri 38.5 46.1 0.8 Narsinpur 53.3 47.6 1.1 Guna 81.1 46.9 1.7 Bhopal 30.0 47.0 0.6 Damoh 32.1 47.4 0.7 Raisen 36.1 46.9 0.8 Rewa 40.0 48.8 0.8 Jabalpur 5.3 48.1 0.1 Panna 42.0 47.5 0.9
Table 4.8:Disparity Ratios in Female Employment with Respect to Female Population
Source:Calculated fromCARD surveydata, 2001, andCensus 2001.
6 5
to the general wage rates. Thisaspect needs to be looked at ingreater detail in future field-basedresearch.Some elements of gender equity arevisible in the watershed areas both indirect and indirect forms. While thereis a significant difference in the male-female rural wage rates in the state,women get equal wage rates in allthe project areas. Also,documentation of watershed projectsin the state notes a change in theattitude of government officialstowards women due to theimportance accorded to them withinthe framework of the project. Someof the indirect benefits have affectedwomen positively because they arethe members of beneficiaryhouseholds or on account of thegender division of labour. Forexample, both the existing literatureand our field visits confirm thatimproved natural resource situationhave led to reduced drudgery offetching water, fodder and fuel in anumber of project villages.A quantitative analysis of the womenwork-participation ratio of thewatershed area with respect to thedistrict as a whole would have givenus some idea about the effect ofwatershed projects on gender equity.Since the requisite information is notavailable, we have attempted toanalyse the share of femaleworkdays with respect to the share offemale population in the area. Thisratio, it may be noted, is not the idealway of looking at gender dimensionsof work. Due to patriarchalhierarchies that are embedded inmost of rural India, the women aredisproportionately engaged inhousehold activities and are lessavailable to take up workopportunities available around them.Since watershed projects are locatedwithin such social realities, to startwith, we do not expect ratios of unityon an average. In tribal societies,such hierarchies are known to beless pronounced about 33 per cent (6districts with Jhabua figuring for both
IWDP and DPAP) of the villageshave a disparity ratio above unity(Table 4.8). Out of these only Jhabuaand Ratlam have tribal concentrationhigher than that of the state as awhole. Another 40 per cent of thedistricts exhibit ratios close to unity(between 1 and 0.8). This indicatesthat watershed programmes havesucceeded in bringing about genderequity to some extent.The phenomenon, however,confirms the general trend ofrelatively higher participation byfemale workers in employmentgeneration programmes as has beenamply evidenced in the case ofEmployment Guarantee Scheme inMaharashtra. In this context, themove by the state government to linkup watershed programmes with therecently enacted National RuralEmployment Guarantee Act(NREGA) has special significancefrom the viewpoint of women�s workparticipation.As mentioned earlier, in its presentformat, the watershed programmesin MP � or for that matter in anyother state � is heavily biasedtowards the landed class. It can beargued that a more equitabledistribution of land would lay a strongfoundation for an equitabledistribution of watershed benefits.Land reforms, though not successfulin most parts of the country in theirprevious form, would becomplementary to the long-termobjectives of watershed projects.The earlier experiences of landreforms have demonstrated thedifficulties in improving the skeweddistribution of land ownershipthrough either redistribution of landor imposition of ceilings. Given thissituation, it is necessary to reviewthe possibilities of liberalising land-lease markets, which have thepotential to reduce inequities indistribution of operational land.Our field visits reinforce what isfound in literature: in scheduled tribedominated areas, both broad-based
6 6
participation and equitabledistribution of benefits has beenachieved (CSWCRTI, 2004; Gate2001). In mixed communities,particularly where there is adominant land-owning class or casteand where the section of land-poorand landless depends primarily onagricultural wages, the in-built socialhierarchy prevents effectiveparticipation from some quarters. Inmany cases, such hierarchies areexpressed in terms of spatialsegmentation within the village; thelandless live in the fringes of thevillage settlement, and hence theyfeel only weakly connected to anyactivity that takes place in the centralpart of the village.The current documentation of theassessment of watershed projects inM.P. is in agreement with thefindings of the evaluation ofwatershed programmes in otherstates about tackling equity issues.Economic inequalities are onlymarginally tackled at best, throughthese projects (CARD 2002c; Datarand Prakash, 2001), though there issome evidence that agriculturalincome has risen, in the absolutesense, even for the small farmers(Rajput and Verma, 1997). However,in relative terms, there are adequateindications that larger farmers havebenefited more from the soil-waterconservation works. One of thereasons is that most such work iscarried out on private land, whereascommon lands, with which thelivelihood of the land-poor isintrinsically linked, are in most casesaddressed in a half-hearted manner.In fact, there are studies that indicatethat WDPs, while leading toincreased crop production andproductivity, appear to haveaccentuated inter-householdinequities by ignoring, or sometimesadversely affecting, the interests ofthe landless and livestock (Puskar,Bouma, and Scott, 2004).One of the inherent flaws in thecurrent form of watershed models inthe state is the modality of
contribution to the development fundof the watershed. The fund is meantto be used for the repair andmaintenance of watershedstructures. It is a common practiceto retain part of the wages ascontribution for the watershed fund,even from landless labourers whohave no stake in the watershedstructures aimed at benefitingprivate land. The practice tends toundermine equity in watershedprojects.
f) ParticipationThe importance of the watershedprogrammes in the state can begauged by the fact that by virtue ofwatershed projects in general, andRGMWM in particular, the villagecommunity, particularly those whohave been associated with theVillage Watershed Committees(VWCs), have become moreresource-aware. Water has beenbrought in the mainstreamdiscourse, albeit with the supportfrom the media. Through the VWCs,a pool of community leadership hasemerged that has the potential tocomplement democratisation ofPRIs and challenge the existingpower structure of the villages (seeBox 4.1). Through the Pani RokoSamities, there has been a scalingup of similar institutional structuresin terms of spatial coverage.The reach and influence of village-level watershed institutions,however, has been limited in manycases. There is also some evidenceof watershed institutions becomingan extension and expression of theexisting social hierarchy in thecommunity. There often has beenlimited appreciation and convictionof NRM principles in the villagecommunities, with the exception ofhomogenous tribal societies.
A feature of the RGMWM frameworkin the state encouragingparticipation is Nirakh Parikh, i.e.,social audit, of the programme by
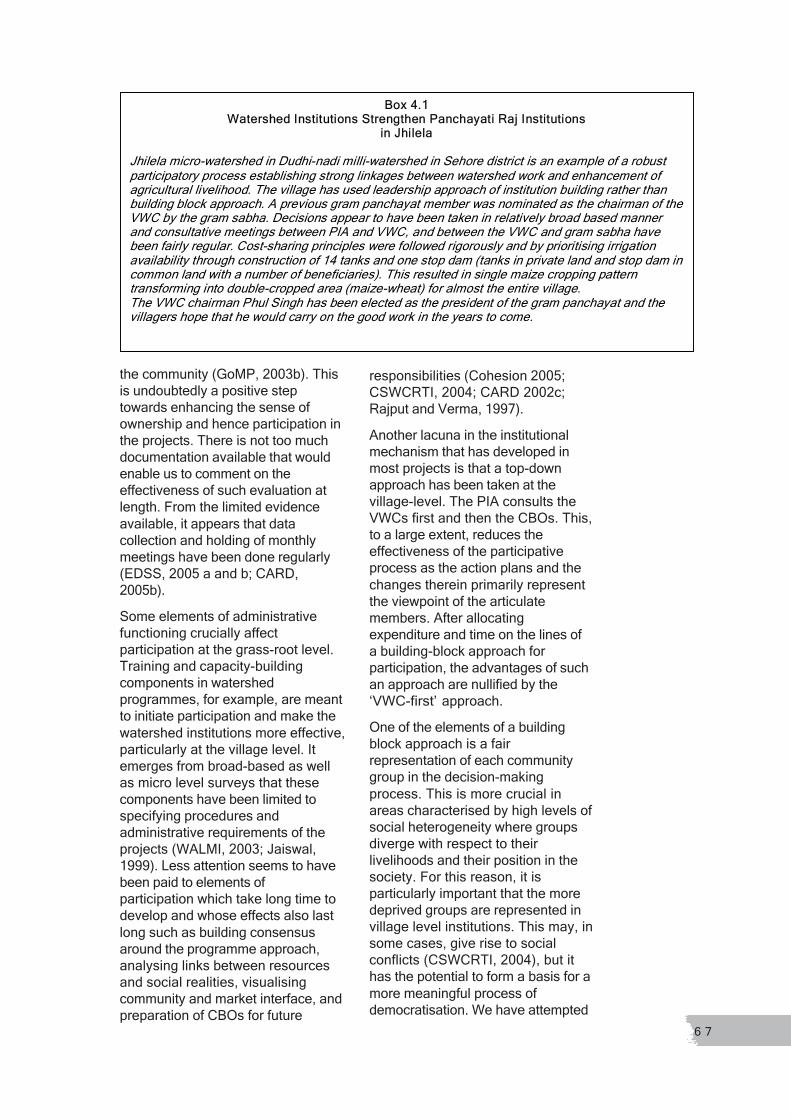
6 7
BBoox x 44..11 WWaatteerrsshheed d IInnssttiittuuttiioonns s SSttrreennggtthheen n PPaanncchhaayyaatti i RRaaj j IInnssttiittuuttiioonnss
iin n JJhhiilleellaa Jhilela micro-watershed in Dudhi-nadi milli-watershed in Sehore district is an example of a robust participatory process establishing strong linkages between watershed work and enhancement of agricultural livelihood. The village has used leadership approach of institution building rather than building block approach. A previous gram panchayat member was nominated as the chairman of the VWC by the gram sabha. Decisions appear to have been taken in relatively broad based manner and consultative meetings between PIA and VWC, and between the VWC and gram sabha have been fairly regular. Cost-sharing principles were followed rigorously and by prioritising irrigation availability through construction of 14 tanks and one stop dam (tanks in private land and stop dam in common land with a number of beneficiaries). This resulted in single maize cropping pattern transforming into double-cropped area (maize-wheat) for almost the entire village. The VWC chairman Phul Singh has been elected as the president of the gram panchayat and the villagers hope that he would carry on the good work in the years to come.
the community (GoMP, 2003b). Thisis undoubtedly a positive steptowards enhancing the sense ofownership and hence participation inthe projects. There is not too muchdocumentation available that wouldenable us to comment on theeffectiveness of such evaluation atlength. From the limited evidenceavailable, it appears that datacollection and holding of monthlymeetings have been done regularly(EDSS, 2005 a and b; CARD,2005b).Some elements of administrativefunctioning crucially affectparticipation at the grass-root level.Training and capacity-buildingcomponents in watershedprogrammes, for example, are meantto initiate participation and make thewatershed institutions more effective,particularly at the village level. Itemerges from broad-based as wellas micro level surveys that thesecomponents have been limited tospecifying procedures andadministrative requirements of theprojects (WALMI, 2003; Jaiswal,1999). Less attention seems to havebeen paid to elements ofparticipation which take long time todevelop and whose effects also lastlong such as building consensusaround the programme approach,analysing links between resourcesand social realities, visualisingcommunity and market interface, andpreparation of CBOs for future
responsibilities (Cohesion 2005;CSWCRTI, 2004; CARD 2002c;Rajput and Verma, 1997).Another lacuna in the institutionalmechanism that has developed inmost projects is that a top-downapproach has been taken at thevillage-level. The PIA consults theVWCs first and then the CBOs. This,to a large extent, reduces theeffectiveness of the participativeprocess as the action plans and thechanges therein primarily representthe viewpoint of the articulatemembers. After allocatingexpenditure and time on the lines ofa building-block approach forparticipation, the advantages of suchan approach are nullified by the�VWC-first� approach.One of the elements of a buildingblock approach is a fairrepresentation of each communitygroup in the decision-makingprocess. This is more crucial inareas characterised by high levels ofsocial heterogeneity where groupsdiverge with respect to theirlivelihoods and their position in thesociety. For this reason, it isparticularly important that the moredeprived groups are represented invillage level institutions. This may, insome cases, give rise to socialconflicts (CSWCRTI, 2004), but ithas the potential to form a basis for amore meaningful process ofdemocratisation. We have attempted

6 8
to analyse the representation ofdisadvantaged social groups such asscheduled castes, scheduled tribes,and women in the village levelinstitutions, for example in VWCs, inrelation to their proportion in thepopulation of the district.Data given in Table 4.9 reveal thatthe social category of women isextremely under-represented in thevillage level institutions in theselected RGMWM districts underDPAP and IWDP. Women�s
Deviation of share in VDC membership from population share
of Per cent share
of SC and ST in VWC as Sl
No. Selected Districts
Population share of SC and ST in
district (rural) SC ST SC+ST Wome
n Presidents
Secretaries
1 West Nimar 52.1 --1100..33 25.0 14.7 --2211..22 67 39 2 East Nimar 50.5 2.0 -6.3 -4.3 --3300..44 17 17 3 Dhar 68.0 -0.2 17.9 17.7 --3333..55 89 78 4 Shajapur 27.4 --88..33 -0.4 --88..77 --2244..44 100 100 5 Rajgarh 22.3 -0.5 23.8 23.3 --2200..77 50 50 6 Tikamgarh 29.8 --2211..88 8.6 --1133..22 --2266..99 0 0 7 Bhind 22.4 --1133..99 -0.2 --1144..11 --2244..33 0 0 8 Shivpuri 32.3 2.7 4.0 6.6 --2299..22 NA NA 9 Guna 33.0 10.3 10.9 21.2 --2211..55 68 9
10 Narsimhapur 31.2 --1166..00 13.9 -2.2 --3333..44 0 0 11 Bhopal 25.1 --1188..22 22.7 4.5 --1199..77 0 0 12 Damoh 34.5 -3.4 1.8 -1.6 --2244..22 6 18 13 Raisen 35.5 -5.8 11.5 5.7 --1177..99 20 15 14 Dewas 39.9 -2.8 -6.3 -9.2 --2244..11 25 17 15 Rewa 30.5 -3.0 --1122..99 --1155..88 --2266..00 20 0 16 Jabalpur 40.4 7.7 1.0 8.7 --2277..66 100 100 17 Panna 37.5 --1111..77 --1177..00 --2288..77 32.5 33 22 18 Shahdol 61.3 12.5 --2200..77 --88..22 --2233..11 45 50
Per cent of districts having positive deviation
28 61 44 6
Per cent of districts having negative deviation
72 39 56 94
Table 4.9:Comparative Representations of Social Groups in Village Watershed Committeesvis-à-vis Their Shares in Population at the District Level
Source:Calculated fromCARD surveydata, 2001, andCensus 2001.
representation on VWCs is between15 to 25 per cent in most districts,whereas their share in thepopulation is almost 48 per cent (atthe state level). In Panna, the soleexception, the share of womenrepresentation is nearly 80 per cent.Thus, gender equity issues do ariseunder watershed approach. Thusthe observation that �watershedprogrammes have failed to addressconcerns of the women as they havenot been allowed to access theresource or make decisions about
6 9
improving their livelihood� seem to besubstantiated to a large extent (Datarand Prakash, 2001: p-223).The scheduled tribe population hasbeen represented favourably (morethan their share in the population) in61 per cent of the villages. However,since the scheduled tribe populationhas high concentration even at themicro-level, it is likely that theselected watershed villages havehigher concentration of the tribalpopulation than that in the districts.However, it is clear that in majority ofcases, except for three districts outof eighteen, the under-representationof scheduled tribe is not of asignificant nature.The under-representation ofscheduled castes, though not assignificant as that of women, issubstantial (72 per cent districtsshowing negative deviation).Literature indicates that theconvergence between schedulecaste population and the landlessand land-poor is considerable(Chadha et al., 2004). Thus under-representation of scheduled castepopulation indirectly hasunfavourable implications withrespect to equitable distribution ofbenefits in watershed programmes.It has been observed from a largenumber of studies that though SHGshave been formed in most cases,they have not been functional inmajority of the villages. Women�sThrift and Credit Societies havefunctioned somewhat better, buteven in these cases (Gate, 2001),there has only been a marginalimpact on the livelihoods. Somefailures of these institutions havebeen attributed to the insufficiency offunds and their delayed release andinadequate capacity building. As aresult, the programmes have failed togenerate a sense of ownershipamong the poor and the vulnerable.The DANIDA experience in theComprehensive WatershedDevelopment Programme (CWDP)(under the umbrella of NWDPRA)
indicates that success in micro-creditwork requires professionalinvolvement in the complex issues ofrepayment and profit sharingprinciples. These institutions have tobe enabled to serve as catalysts ofwatershed work for effectivelivelihood linkages. Such treatmentneeds to be scaled-up to the generalwatershed programmes carried outsolely by government institutions. Inspite of the relatively successfulefforts of community organisation inDANIDA projects, sustaining micro-credit groups has been recognisedas one of the gaps in the CWPD(Cohesion, 2005). Lack of repaymenthas been one of the major reasonsfor the failure of the micro-creditinstitutions (the success rate inDANIDA projects has beenestimated to be only 25 per cent).It has been pointed out that theparticipatory planning process, onthe whole, has failed to addressthree important aspects:
1. Scale and protectionarrangements of forest and fodderdevelopment and thus long-termlivelihood enhancement needs ofthe landless and land-poor.2. Technical aspects of waterharvesting structures as choice oflocation, capacity and maintenanceof water harvesting structures.3. The frameworks of action plansare stereo-typed and not inaccordance with the baselinesurveys and PRAs conducted atthe inception of the projects.
4.3 Summing UpNatural resource management underthe watershed approach is expectedto have a long term positive impacton rural livelihoods which shouldideally be sustained long after theproject is completed. This isexpected to be achieved throughaccess to improved quality andenlarged natural resources base.The benefits from the enhancement

7 0
of privately owned natural resourceslike the cultivated land would accrueto those who have access to land.Successful treatment of CPRs cancorrect the imbalance to some extentby creating benefits for those whohave no land.MP, like other states, has two majordepartments, Panchayat and RuralDevelopment, and Agriculturehandling the watershed projects.While the latter follows by and largethe guidelines of the Ministry ofAgriculture at the Centre, the formerhas a clear framework of its own atthe state level, which is consistentwith the focus of the Tenth Plan�empowerment and strengthening oflocal level democratic institutions.The RGMWM under the Departmentof Panchayat and RuralDevelopment appears to be moreprogressive in its conceptualisationof the watershed programme, forinstance, its conceptualisation ofscale of a watershed project.However, in some ways the Missionhas been constrained by the centrallevel guidelines and funding patterns.Madhya Pradesh has a moreequitable land distribution comparedto most other states, and henceaccrual of incremental benefits fromagricultural income may not be asskewed as it is in other parts of thecountry. In spite of some problems,environmental benefits and the risein agricultural incomes, bothresulting from increased availabilityof water, have been fairlywidespread in the state. The landdistribution scenario, however, isworsening rapidly, with the increasein the number of landless in the ruralareas over the last two decadesbeing much larger than the increasein the country as a whole. It is hopedthat the watershed programmeswould be in a position to diminishnon-viability of small farms to someextent and halt displacement of smallfarmers due to economic reasons inturn. Treatment of forests andpastures, nevertheless, is of crucialimportance for sustaining the
livelihoods of the growing populationof the landless. One of the importantgaps in watershed programmes inIndia is the total lack of co-ordinationbetween the forest and the revenuedepartment on the issue of treatingthe forest area within the watershed.This lack of harmony hampers theefficacy of watershed projects in thestate more than in any other part ofthe country. The resultant largeareas of degraded forests without adoubt diminish the efficacy ofenvironmental rejuvenation efforts,given the extensive forest cover inthe state.Participation of the local communityin the watershed projects in the stateis weak and has, in turn,undermined the objective ofequitable distribution of the benefitsof the project. Like other states,there are some success stories, butthese efforts have not been scaled-up adequately. From the existingdocumentation, it appears thatfeeble interaction between the PIAsand the local community as well asinadequate training and entry pointactivities have affected participationpotential adversely. However, one ofthe strengths of the state is creationof village level institutions in theform of Pani Roko Samitis in a largenumber of villages through theRGMWM. These institutions, evenunder the Hariyali guidelines arebeing used as supporting agenciesto the gram panchayats, thusretaining the essence of broad -based participation. An increasedrepresentation of women, scheduledcaste and the landless in thedecision-making process in thewatershed programmes of the statecan be tied up systematically withdevelopment of common propertyresources, both forests andpastures, on the one hand, andimproved livelihood conditions forthe marginalised population, on theother.

7 1
Watershed Programmes in JhabuaDistrictA Sub-Regional Analysis
5.1 Jhabua District: A ProfileJhabua district, located in thewesternmost semi-arid agro-climaticzone is one of the five mostbackward districts of the country.Jhabua�s relative position in the stateis somewhat like Madhya Pradesh�srelative position in the country.Information given in Table 5.1 helpsin positioning the district with respectto the state. Jhabua has a very high
Chapter 5 concentration of tribal population,and this has given the district most ofits characteristic features. Thedistrict has a high share of areaunder barren and unculturablewasteland; on the other hand,urbanisation and literacy rates aremuch lower. Due to high pressure onagricultural land, the forest resourcesof the district have been rapidlydeclining. Though 87 per cent of theworkers are engaged in theagricultural sector, neither thenatural resource base nor theexisting infrastructure is conducive togenerating high incomes from thesector. The district is prone tofrequent consecutive droughts. (Thevariability of rainfall is 42 per centcompared to 26 per cent in the stateas shown in Table 5.1.) Thus theaverage annual rainfall, which isabout 750 mm, is extremely erratic(Figure 5.1). Farmers report a cropfailure in 3-4 years out of ten, andserious shortfall occurs in 4 to 5years out of ten (ASA, 2005). Theyield levels are much lower than thatof the state, which, in turn, are muchlower than the country average.These very features are also the
IIndndiiccaattoorrss MMadhadhyya a PPrradeadesshh JJhabuahabua Population Density 196 205 0-6 Sex Ratio 932 974 Share of ST population 20.3 87 Total Literacy Rate 52.4 28.4 Female Literacy Rate 41.2 19.9 Level of Urbanisation (%) 26 9 Marginal to Total Worker (%) 25.9 33.4 Non Worker to Population (%) 57.3 47.5 Agricultural Workers to Total Workers (%) 71 87 Barren and Uncultivable Wasteland (5) 4 12 Average Rainfall (mm) 977 868 Rainfall variability (%) 26 42 Irrigated Area (%) 11 27 Yield of Kharif Food-grain (kg/ha) 901 688 Yield of Wheat (kg/ha) 1392 1092 Cropping Intensity (%) 128 112
Table 5.1:Comparisonof MadhyaPradesh andJhabua:SomeIndicators
Source:Census, 2001and DistrictStatisticalProfile, Jhabua,1997-98

7 2
reasons for a clear connectionbetween the livelihoods of the peopleand natural resource managementand conservation activities in thedistrict.The entire district has witnesseddeterioration in natural environmentwhich has resulted in the decline infarm yields. As a result, the ability ofthe average households in the areato maintain a stable access toresources to fulfil basic humanneeds has gone down (ASA, op cit).Once forested extensively, thedegradation of the environment hasbeen caused by a combination offactors. The denudation of forestcover has led to extensive soilerosion in the generally undulatingtopography of the area and reducedthe livelihood base of many tribals 34 .According to existing literature,declining farm productivity in thedistrict has added to the pressure onnatural resources and furtheraccelerated degradation byinappropriate agriculture practices.The contribution of livestock to thelivelihood is significant which can befurther enlarged if forests andpastures become the focus of naturalresource management activities.The terrain of the district is hilly andundulating and is typically known as�Jhabua hills topography�. In thistopography, the difference betweenthe highest and the lowest pointsvaries between 20 to 50 meters(jhabua.nic.in). The variation in reliefrises as one moves towards thesouth of Jhabua � towards AlirajpurSubdivision. Jhabua Hills agro-climatic zone (Refer to Chapter 1)
Percent Deviation from Normal Rainfall:Jhabua 1991- 2003
-80
-60
-40
-20
0
20
40
60
80
1 2 3 4 5 6 7 8 9 10 11 12 13
years
per
cen
t
Figure 5.1Source: IndianMeteorologicalDepartment
can be further subdivided into threesub-regions. Towards the north, thePetlawad sub-region includingPetlawad, Thandla, Megnagar andparts of Jhabua block comes underMalwa region and is characterisedby relatively higher rainfall, deepersoils and a large number of rivers.Jhabua region with parts of JhabuaRama, Ranapur, Bhabra, Udaigarhand most of Jobat block constitutesthe second subdivision withmoderate rainfall and soils ofmoderate depth. The third sub-region consisting of Alirajpursubdivision is the most deprived interms of resource base. It has lowand erratic rainfall, and is almostentirely hilly and intersected bynarrow valleys and low Vindhyaranges covered with degraded forestareas. Though notified forest area islarge in the third subdivision, thearea is devoid of vegetation coverexcept in Katthiwada block and afew other patches and is full of hillyareas; the area suffers from skeletalsoils with shallow to very shallowdepth.According to ASA (2005), twodistinct agro-climatic conditions ofthe area are favourable forstrategising comprehensive landand water resources development.First, the geological formation of thearea consists of compact basalt rockwhich favours discharge of water inthe form of base flow as a result ofvarious mechanical measures of soiland water conservations in theridges of the watersheds. Due toincreased sub-surface recharge,there is a potential for substantialrise in the availability of water instreams and valleys. Secondly, thearea has innumerable small streamsdraining into rivulets flowing throughthe area. These streams and smallrivers are seasonal in nature andare alive only during the monsoons.The network of these streams andrivers are part of the basins and sub�basins of the bigger rivers of theregion. This condition createscapacity to store water during themonsoon which can support
34 Tribalscommonlysupplementedtheir income fromagriculture withminor forestproduce such ashoney, gum, andmedicinal plantswhile also usingthe forest areasfor pasture andfirewood.

7 3
livelihood base in the dry months.The above two conditions holdsenormous potential if a mechanismof ridge to valley treatment isadopted for the development ofnatural resources.The purpose of this chapter, asmentioned in our framework ofanalysis, is to focus on a region,where first, concentration ofwatershed work has been very high,and secondly, which has been widelyrecognised as a success story (GoI,1995; Tiwari and Amezaga 2005).Therefore, information available onthis district is more extensive thaninformation on other districts.Further, some information availableto us was at the micro-level andcould have been meaningfullyanalysed only at the district level 35.Thus, analysis enables us tocomment on aspects that we havenot dealt with at the state level.
5.2 Spatial Spread of WDPs inJhabuaThis section deals with the spatialspread of both RGMWM andNWDPRA projects in the district andcomments on prioritisation ofwatershed activities at the block levelfor the district36. In the third section,a comparison of the NWDPRA andRGWM projects primarily in terms ofadministrative functioning has beenattempted using data available fromthe DRDA and agricultural office inthe district, interviews with keypersons and field visits. The purposeof this exercise is to bring out thepositive elements from both type ofprojects, and comment upon theissue of convergence of watershedprojects. Next, the nature ofinvolvement of NGOs in RGMWMprojects is analysed for the pre-Hariyali RGMWM projects. Thoughin the post-Hariyali set up, the scopefor NGO involvement is limited theycan still be involved at the trainingand capacity building stage. Also,government projects addressinglivelihood and safety-net issues for
the rural poor (for instance, Food forWork Programmes) can be carriedout using approaches similar to thatof watershed projects 37 . Lastly, someNRM based models are presentedas practised by independentorganisations (including NGOs withinthe RGMWM framework) and public-private partnerships from Jhabua.As in other districts of the state, theRGMWM and the state DoA are thetwo major agencies carrying outwatershed projects. The Missiontakes up three kinds of projects inthe district, DPAP, IWDP, and EAS 38
under the broad guidelines andfunding from the MoRD, Governmentof India. The state DoA takes upNWDPRA using the funds availablein the MoA, Government of India.The latter has two types of projectsin the state; some are funded entirelyby the MoA, and others funded partlyby DANIDA39 and implemented on apartnership basis with an NGOcalled Sampark. There are othersporadic efforts at natural resourcemanagement funded from non-governmental sources, such as theRatan Tata Trust, ChristianChildren�s Fund, and Church�sAuxiliary for Social Action. They areimplemented by NGOs like theNCHSE and they are not expected tobe significant in terms of the areacovered.At the outset, it needs to bementioned that information availableat the district level for RGMWM andNWDPRA projects is not comparablefor a variety of reasons. While theformer allocates funds as per thegeographical area of the watershed,the latter does it on the basis oftreated area, which excludes areaunder water bodies, protectedforests, area under non-agriculturaluses, etc. Consequently, dataprovided by one agency relates tothe geographical area underwatershed and that supplied by thesecond concerns treated area underthe watershed. Correction ofRGMWM project data as pertreatable area would have been ideal
35 A lot of theinformationpresented at theblock level inthe district is theaggregation ofmicro-watershed levelinformation.This exercisehas enabled usto make certaincorrections thatwere notpossible whenone dealt withthe chapters onstate36 A similarexercise hasalready beenattempted at thedistrict level, butit is expectedthat the basis ofprioritisation islikely to bedifferent at thedistrict andblock levels, asthey involvedifferentagencies. Also,Jhabua being asuccess casemay throw uplessons for therest of the state.37 Some of ourfield visits inJhabua showedthat this indeedwas the case; anumber ofNGOs arereplicatingwatershedmodels underothergovernmentprogrammes.38 As per thecentralgovernmentdirective, 50 percent fundsavailable underEAS could beused forwatershed work.39 The MoAprovides 40 percent ofadministrativeexpenses andDANIDA, 60 percent. The entireexpenditure forthe watershedactivities(works) is borneby DANIDA.
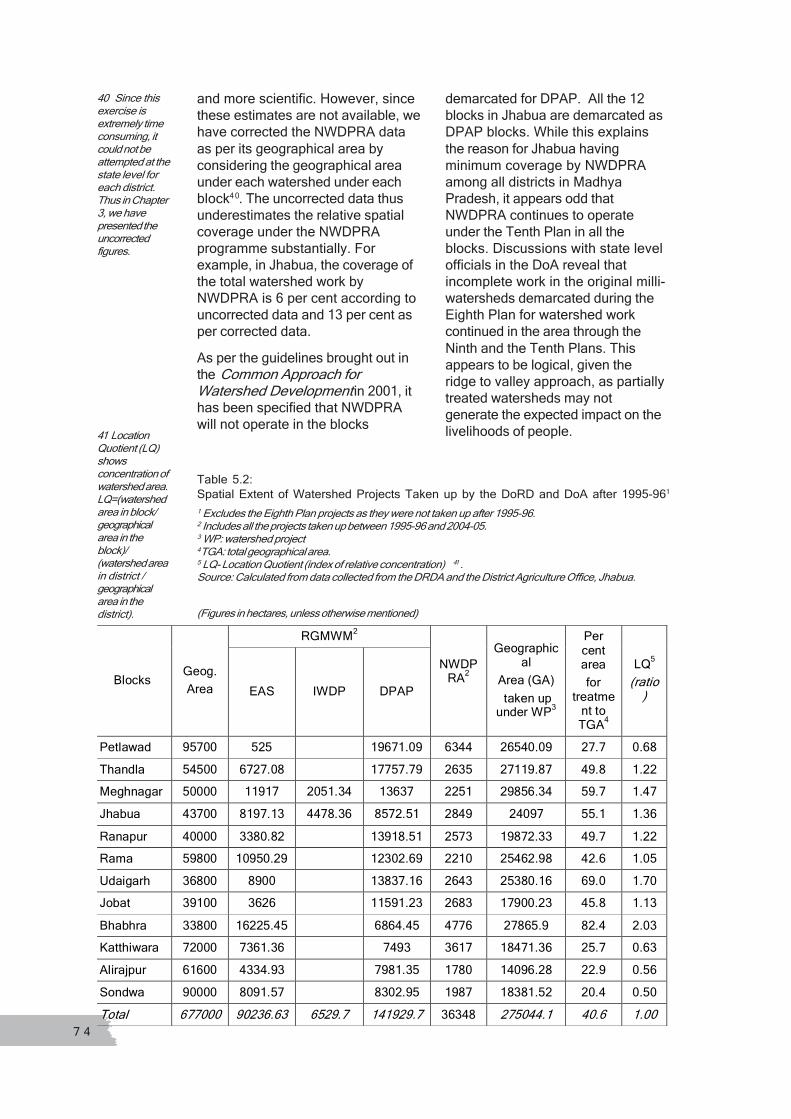
7 4
and more scientific. However, sincethese estimates are not available, wehave corrected the NWDPRA dataas per its geographical area byconsidering the geographical areaunder each watershed under eachblock40. The uncorrected data thusunderestimates the relative spatialcoverage under the NWDPRAprogramme substantially. Forexample, in Jhabua, the coverage ofthe total watershed work byNWDPRA is 6 per cent according touncorrected data and 13 per cent asper corrected data.As per the guidelines brought out inthe Common Approach forWatershed Development in 2001, ithas been specified that NWDPRAwill not operate in the blocks
demarcated for DPAP. All the 12blocks in Jhabua are demarcated asDPAP blocks. While this explainsthe reason for Jhabua havingminimum coverage by NWDPRAamong all districts in MadhyaPradesh, it appears odd thatNWDPRA continues to operateunder the Tenth Plan in all theblocks. Discussions with state levelofficials in the DoA reveal thatincomplete work in the original milli-watersheds demarcated during theEighth Plan for watershed workcontinued in the area through theNinth and the Tenth Plans. Thisappears to be logical, given theridge to valley approach, as partiallytreated watersheds may notgenerate the expected impact on thelivelihoods of people.
40 Since thisexercise isextremely timeconsuming, itcould not beattempted at thestate level foreach district.Thus in Chapter3, we havepresented theuncorrectedfigures.
RGMWM2
Blocks Geog. Area EAS IWDP DPAP
NWDPRA2
Geographical
Area (GA) taken up
under WP3
Per cent area for
treatment to TGA4
LQ5
(ratio)
Petlawad 95700 525 19671.09 6344 26540.09 27.7 0.68 Thandla 54500 6727.08 17757.79 2635 27119.87 49.8 1.22 Meghnagar 50000 11917 2051.34 13637 2251 29856.34 59.7 1.47 Jhabua 43700 8197.13 4478.36 8572.51 2849 24097 55.1 1.36 Ranapur 40000 3380.82 13918.51 2573 19872.33 49.7 1.22 Rama 59800 10950.29 12302.69 2210 25462.98 42.6 1.05 Udaigarh 36800 8900 13837.16 2643 25380.16 69.0 1.70 Jobat 39100 3626 11591.23 2683 17900.23 45.8 1.13 Bhabhra 33800 16225.45 6864.45 4776 27865.9 82.4 2.03 Katthiwara 72000 7361.36 7493 3617 18471.36 25.7 0.63 Alirajpur 61600 4334.93 7981.35 1780 14096.28 22.9 0.56 Sondwa 90000 8091.57 8302.95 1987 18381.52 20.4 0.50 Total 677000 90236.63 6529.7 141929.7 36348 275044.1 40.6 1.00
Table 5.2:Spatial Extent of Watershed Projects Taken up by the DoRD and DoA after 1995-961
(Figures in hectares, unless otherwise mentioned)
1 Excludes the Eighth Plan projects as they were not taken up after 1995-96.2 Includes all the projects taken up between 1995-96 and 2004-05.3 WP: watershed project4TGA: total geographical area.5 LQ- Location Quotient (index of relative concentration) 41 .Source: Calculated from data collected from the DRDA and the District Agriculture Office, Jhabua.
41 LocationQuotient (LQ)showsconcentration ofwatershed area.LQ=(watershedarea in block/geographicalarea in theblock)/(watershed areain district /geographicalarea in thedistrict).
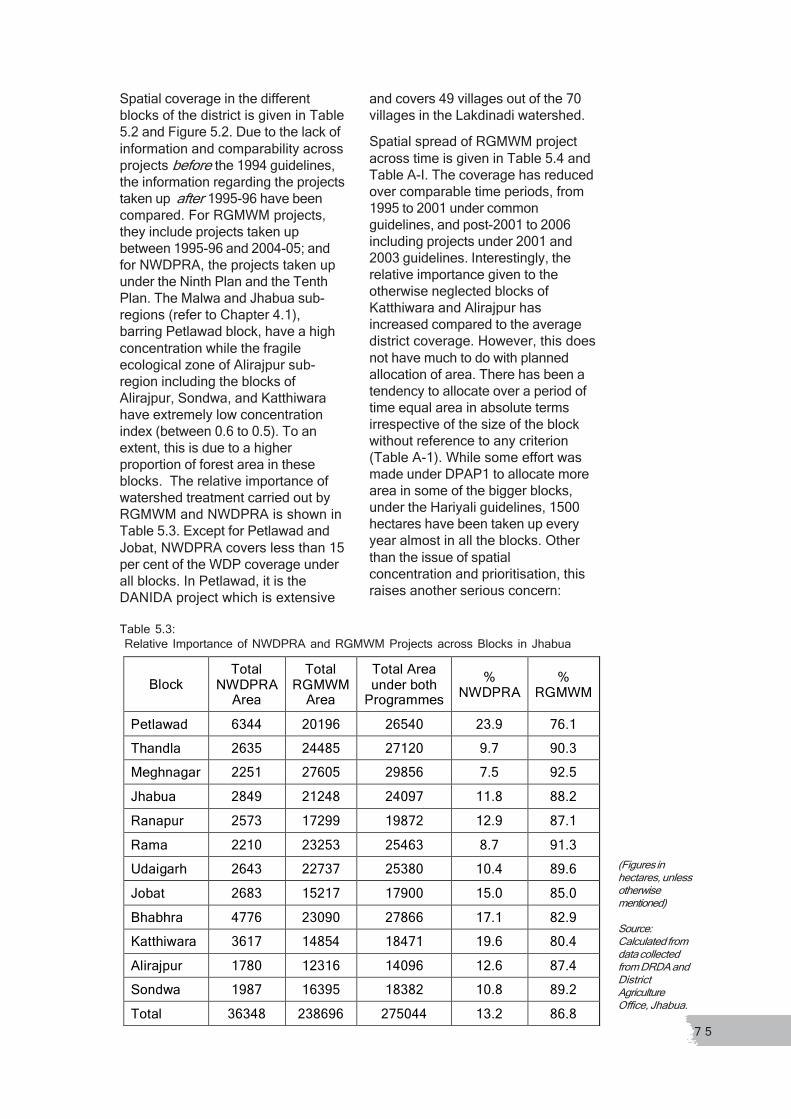
7 5
Spatial coverage in the differentblocks of the district is given in Table5.2 and Figure 5.2. Due to the lack ofinformation and comparability acrossprojects before the 1994 guidelines,the information regarding the projectstaken up after 1995-96 have beencompared. For RGMWM projects,they include projects taken upbetween 1995-96 and 2004-05; andfor NWDPRA, the projects taken upunder the Ninth Plan and the TenthPlan. The Malwa and Jhabua sub-regions (refer to Chapter 4.1),barring Petlawad block, have a highconcentration while the fragileecological zone of Alirajpur sub-region including the blocks ofAlirajpur, Sondwa, and Katthiwarahave extremely low concentrationindex (between 0.6 to 0.5). To anextent, this is due to a higherproportion of forest area in theseblocks. The relative importance ofwatershed treatment carried out byRGMWM and NWDPRA is shown inTable 5.3. Except for Petlawad andJobat, NWDPRA covers less than 15per cent of the WDP coverage underall blocks. In Petlawad, it is theDANIDA project which is extensive
and covers 49 villages out of the 70villages in the Lakdinadi watershed.Spatial spread of RGMWM projectacross time is given in Table 5.4 andTable A-I. The coverage has reducedover comparable time periods, from1995 to 2001 under commonguidelines, and post-2001 to 2006including projects under 2001 and2003 guidelines. Interestingly, therelative importance given to theotherwise neglected blocks ofKatthiwara and Alirajpur hasincreased compared to the averagedistrict coverage. However, this doesnot have much to do with plannedallocation of area. There has been atendency to allocate over a period oftime equal area in absolute termsirrespective of the size of the blockwithout reference to any criterion(Table A-1). While some effort wasmade under DPAP1 to allocate morearea in some of the bigger blocks,under the Hariyali guidelines, 1500hectares have been taken up everyyear almost in all the blocks. Otherthan the issue of spatialconcentration and prioritisation, thisraises another serious concern:
Block Total
NWDPRA Area
Total RGMWM
Area Total Area under both
Programmes %
NWDPRA %
RGMWM Petlawad 6344 20196 26540 23.9 76.1 Thandla 2635 24485 27120 9.7 90.3 Meghnagar 2251 27605 29856 7.5 92.5 Jhabua 2849 21248 24097 11.8 88.2 Ranapur 2573 17299 19872 12.9 87.1 Rama 2210 23253 25463 8.7 91.3 Udaigarh 2643 22737 25380 10.4 89.6 Jobat 2683 15217 17900 15.0 85.0 Bhabhra 4776 23090 27866 17.1 82.9 Katthiwara 3617 14854 18471 19.6 80.4 Alirajpur 1780 12316 14096 12.6 87.4 Sondwa 1987 16395 18382 10.8 89.2 Total 36348 238696 275044 13.2 86.8
Table 5.3: Relative Importance of NWDPRA and RGMWM Projects across Blocks in Jhabua
(Figures inhectares, unlessotherwisementioned)Source:Calculated fromdata collectedfrom DRDA andDistrictAgricultureOffice, Jhabua.
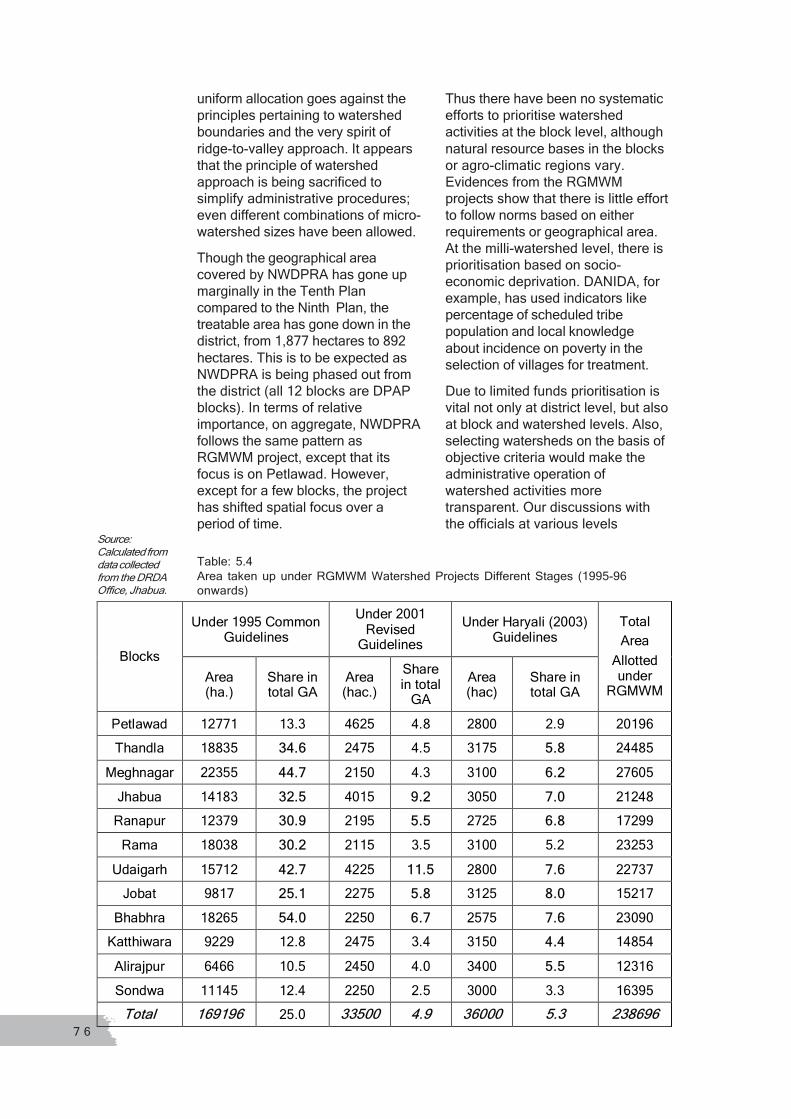
7 6
uniform allocation goes against theprinciples pertaining to watershedboundaries and the very spirit ofridge-to-valley approach. It appearsthat the principle of watershedapproach is being sacrificed tosimplify administrative procedures;even different combinations of micro-watershed sizes have been allowed.Though the geographical areacovered by NWDPRA has gone upmarginally in the Tenth Plancompared to the Ninth Plan, thetreatable area has gone down in thedistrict, from 1,877 hectares to 892hectares. This is to be expected asNWDPRA is being phased out fromthe district (all 12 blocks are DPAPblocks). In terms of relativeimportance, on aggregate, NWDPRAfollows the same pattern asRGMWM project, except that itsfocus is on Petlawad. However,except for a few blocks, the projecthas shifted spatial focus over aperiod of time.
Under 1995 Common Guidelines
Under 2001 Revised
Guidelines Under Haryali (2003)
Guidelines Blocks
Area (ha.)
Share in total GA
Area (hac.)
Share in total
GA Area (hac)
Share in total GA
Total Area
Allotted under
RGMWM
Petlawad 12771 13.3 4625 4.8 2800 2.9 20196 Thandla 18835 3344..66 2475 4.5 3175 55..88 24485
Meghnagar 22355 4444..77 2150 4.3 3100 66..22 27605 Jhabua 14183 3322..55 4015 99..22 3050 77..00 21248
Ranapur 12379 3300..99 2195 55..55 2725 66..88 17299 Rama 18038 3300..22 2115 3.5 3100 5.2 23253
Udaigarh 15712 4422..77 4225 1111..55 2800 77..66 22737 Jobat 9817 2255..11 2275 55..88 3125 88..00 15217
Bhabhra 18265 5544..00 2250 66..77 2575 77..66 23090 Katthiwara 9229 12.8 2475 3.4 3150 44..44 14854 Alirajpur 6466 10.5 2450 4.0 3400 55..55 12316 Sondwa 11145 12.4 2250 2.5 3000 3.3 16395
TToottaall 116699119966 25.0 3333550000 44..99 3366000000 55..33 223388669966
Table: 5.4Area taken up under RGMWM Watershed Projects Different Stages (1995-96onwards)
Source:Calculated fromdata collectedfrom the DRDAOffice, Jhabua.
Thus there have been no systematicefforts to prioritise watershedactivities at the block level, althoughnatural resource bases in the blocksor agro-climatic regions vary.Evidences from the RGMWMprojects show that there is little effortto follow norms based on eitherrequirements or geographical area.At the milli-watershed level, there isprioritisation based on socio-economic deprivation. DANIDA, forexample, has used indicators likepercentage of scheduled tribepopulation and local knowledgeabout incidence on poverty in theselection of villages for treatment.Due to limited funds prioritisation isvital not only at district level, but alsoat block and watershed levels. Also,selecting watersheds on the basis ofobjective criteria would make theadministrative operation ofwatershed activities moretransparent. Our discussions withthe officials at various levels

7 7
Ninth Plan*1 Tenth Plan
Blocks GA
covered Share to total GA
GA covered
Share to total GA
GA covered In Ninth and Tenth Plans
Petlawad 2661 22..88 3683 33..88 6344 Thandla 1502 22..88 1133 2.1 2635 Meghnagar 1400 22..88 851 1.7 2251 Jhabua 1443 33..33 1406 33..22 2849 Ranapur 1014 2.5 1559 33..99 2573 Rama 874 1.5 1336 22..22 2210 Udaigarh 1273 33..55 1370 33..77 2643 Jobat 1007 22..66 1676 44..33 2683 Bhabhra 1844 55..55 2932 88..77 4776 Katthiwara 2857 44..00 760 1.1 3617 Alirajpur 428 0.7 1352 2.2 1780 Sondwa 983 1.1 1004 1.1 1987 TToottaall 1728617286 22..66 1906219062 22..88 3634836348
Table 5.5:Area Takenup underNWDPRAWatershedProjects atDifferentStages 1 Excludes theunfinished areafrom oldwatershedsagain taken upfor Tenth Planto avoid doublecounting.Source: DistrictAgriculturalOffice, Jhabua
revealed that no systematic databaseon technical variables such assediment-yield index is available,which many feel should be theprimary basis for prioritisation. TheRGMWM office is presently engagedin creating a geo-spatial database forthe state of Madhya Pradesh, whichcould be utilised as a basis forprioritisation.In the absence of database on someof the more relevant variables, wehave used the available informationto work out a scheme of prioritisationfor Jhabua. Given the integratedthrust of watershed projects, we havederived an overall index ofprioritisation based on a simplemethodology using criteria of land-access, resource-base and socio-economic indicators. (A note on themethodology of prioritisation used forJhabua district is given in AppendixI). Since the index is positivelyrelated to the degree of deprivation,ideally, the coverage of watershedactivity should also be positivelyrelated to the index (in terms of areaunder watershed activity as a shareof geographical area of the individualblocks). The indices at the blocklevel are provided in Table A II.
Using the indices of deprivation, wehave attempted to identify the blocksthat have been neglected in relativeterms. The derived indices ofdeprivation have been ranked andsubtracted from the rank as per thewatershed work (the most depriveddistrict has a rank of 1). A positivedeviation of rank means that a block isbetter placed in terms of its relativeneed, whereas a negative deviationindicates that the block has beenneglected.The variability of resource variables isthe maximum, followed by that ofland-access. It is noted, however, thatwhile resource and socio-economicvariables are highly correlated, spatialdistribution of land access has a weakrelationship with resource and socio-economic variables (Table A.2).According to our index of overall aswell as resource and socio-economicdeprivation, Sondwa and Katthiwaraare the two most deprived districts(Table 5.6 and Figure 5.3). They havealso received the least attention; theyhave been bypassed largely and theirneeds are not met 42. On the otherhand Udaigarh and Bhabhra have gotmore attention compared to their need(positive deviation of 8 and 7respectively).
41 Sondwa hasthe highestpossiblenegativedeviation, as itis the mostdeprived blockaccording to thedeprivationindex. It hasalso got theleast attention interms ofwatershedactivities.

7 8
BBlloocckkss WWaatteerrsshheed d
WWoorrkk OOvveerraalll l
DDeepprriivvaattiionon LLaannd d AAcccceesss s DDeepprriivvaattiionon
NNaattuurraal l RReessoouurrcce e
DDeepprriivvaattiionon SSoocciioo--
eeccoonnoommiic c DDeepprriivvaattiionon
aa BB bb--aa cc cc--aa dd dd--aa ee ee--aa BBhhababhhrraa 1 8 77 4 33 10 99 10 99 UUddaaiigagarrhh 2 10 88 11 99 7 55 8 66 Meghnagar 3 3 00 1 --22 3 00 9 66 Jhabua 4 4 00 3 --11 5 11 4 00 Thandla 5 5 00 2 --33 4 --11 6 11 Ranapur 6 7 11 7 11 6 00 11 55 Jobat 7 11 44 10 33 11 44 7 00 Rama 8 6 --22 6 --22 8 00 5 --33 Petlawad 9 12 33 9 00 12 33 12 33 KKaatttthhiiwwaarraa 10 2 --88 5 --55 2 --88 2 --88 Alirajpur 11 9 --22 12 11 9 --22 3 --88 SSoondndwwaa 12 1 --1111 8 --44 1 --1111 1 --1111
Table 5.6:Deviations of Rank between Deprivation Indices and Concentration of WatershedWork
Source:Calculated fromdata collected inDRDA andDistrictAgricultureOffice, Jhabua.
R a m a
P e t l a v a d
J o b a t
S o n d w a
K a t t h i w a r a A l i r a j p u r
T h a n d a l a
J h a b u a
U d a i g a r h
R a n a p u r
B h a b a r a
M e g h n a g a r
l o c a t i o n q u o t i e n t
0 . 5 - 1
1 - 1 . 5
1 . 5 - 2
2 - 2 . 5
n
e w
s
Figure 5.3 Spatial Concentration of Watershed Programmes
JHABUA
Figure 5.3

7 9
5.3 Comparison of RGMWM andNWDPRA ProjectsA comparison of projects by the twomajor agencies in the state as wellas the district is undertaken with thelimited purpose of learning lessons.These lessons will be crucial as
inputs if the future policy is to movetowards convergence of allwatershed projects. This analysiswould primarily be restricted toadministrative functioning of theprojects, and therefore some of theelements discussed here would berelevant for the state as well.
Table 5.7:Projects Administered by RGMWM and DoA�A Comparisons
NNWWDDPPRRAA FFeaeattuurreess RRGGMMWWM M pprroojjeeccttss GGeneenerraall DDAANNIIDDAA
Funding Mechanism By geographical area under micro-watershed
By treatable area under micro-watershed
Funding criteria Flat Slope criteria- higher for steeper slopes Funding amount (current)
Rs. 6000/- per hectare Rs. 4500 to 6000/- per hectare
Implementing Agency
NGO and GO, now under Hariyali guidelines, NGOs� role limited
GO GO-NGO partnership
Technical Capability in PIA
Project officer not necessarily (often not) trained in SMC techniques
Mandatory that Project Officer is trained in soil moisture conservation techniques
Participation Very important -- regular meetings of VWCs and PIA
Important, but technical details of soil-moisture conservation first. Meetings of VWCs and PIA less regular.
Extremely important- does not undertake work in the first two years before confidence building.
Cost limits for water harvesting structures (current)
Preferably should not go up beyond minor irrigation structures �flexible
Rs. 35000/- per structure
Rs. 25000/- per structure
Thrust /primary objective
Livelihood enhancement Increase in agricultural income
Livelihood enhancement and control of social expenditure
Operation of VWC Account
By president and secretary of VWC
By one VWC representative and block level agricultural development officer
By two members of VWC
Financial Monitoring Social Audit Accountant general, NWDPRA
Social audit and accountant general, NWDPRA

8 0
Interviews with the key officials aswell as the existing documentationenable us to build a comparativepicture of the frameworks adopted bythe two agencies. Since someaspects of the comparison,presented in Table 5.7, are of aqualitative nature and based onlimited interactions, there may not becomplete agreement on the featurespresented here. In general, it may beobserved that while RGMWMprojects are stronger in terms of theirthrust on participation; NWDPRAprojects put technical details first.Thus though the latter has asomewhat top-down approach, thequality of the NRM work done tendsto be better. Usually there is a trade-off between technical details andparticipation. Unless the training andcapacity building components areextremely strong, allowing people toselect activities, sequence them, andchoose sites without guidance fromtechnical personnel may fail togenerate expected benefits and inturn may affect participation in thelong run. On the other hand, a top-down non-participatory approachmay show results, but due to the lackof sense of ownership, allarrangements tend to collapse afterthe project is over. The DANIDAmodel, in some ways seems to havestruck a balance between the two.There appears to be some elementsof rigidity in the NWDPRA projects. Itmay be argued, however, that thisvery rigidity that makesadministrative processes rigorous isprobably due to the adoption of morescientific methods in prioritisationand fund allocation. For example,since the fund allocation for theseprojects is worked out by slopescharacterising treatable areas, soilmoisture conservation plans areworked out differently for moreadverse parts43 . The fund allocationfor NWDPRA is according to thetopography of the place, whileRGMWM allocates funds at a flatrate (See Table A.III). Also, if fundallocation criterion is madecomparable for both projects, i.e.,
allocated fund per unit ofgeographical area of watershed isworked out, NWDPRA has muchlower allocation per hectare of area(Table A.III).In addition, while the cost limits forwatershed structures may seem tobe somewhat rigid in these projects,this could ensure a betterdistribution of resources amongbeneficiaries and probably serve theequity purpose better. Finally,according to the officials at the statelevel office, block level monitoring ofaccounts prevents financialmalpractices to a large extent.We have compared the physical andfinancial performance of completedprojects carried out under RGMWMand NWDPRA. The projectsimplemented by the two agenciesare compared using the criterion ofphysical efficiency and two criteriafor financial efficiency (Table 5.8).Though projects are not strictlyspeaking comparable acrosswatersheds some general trendscan be discerned from Table 5.8. Interms of completion of the allottedwork, RGMWM has performed farbetter than NWDPRA projects. Thiscould be due to the lack of funds andinsistence on the rigour in workdone in NWDPRA projects.From Eighth Plan onwards,NWDPRA has been taking upunfinished work within watershedsas part of subsequent plans. Interms of money actually spent perunit of area treated, NWDPRA hasspent much less. This may not be afair comparison, as the fundallocated under this programme isalso lower. However, even in termsof the ratio of fund spent to fundallocated per unit of area, NWDPRAhas been relatively inexpensive. Inall the blocks, it has actually spentless than its allocation norm,whereas RGMWM has spent morethat its fund norms. The ratio of fundspent to the fund allocated does notindicate efficiency of expenditure inany case; the ratio has to be seen
43 During ourfield visit toAmpliphaliawatershed inJhabua blockimplementedunder NWDPRAproject, we foundthat differentialNRM measuresfor differentslopes arecarried out withrigour.
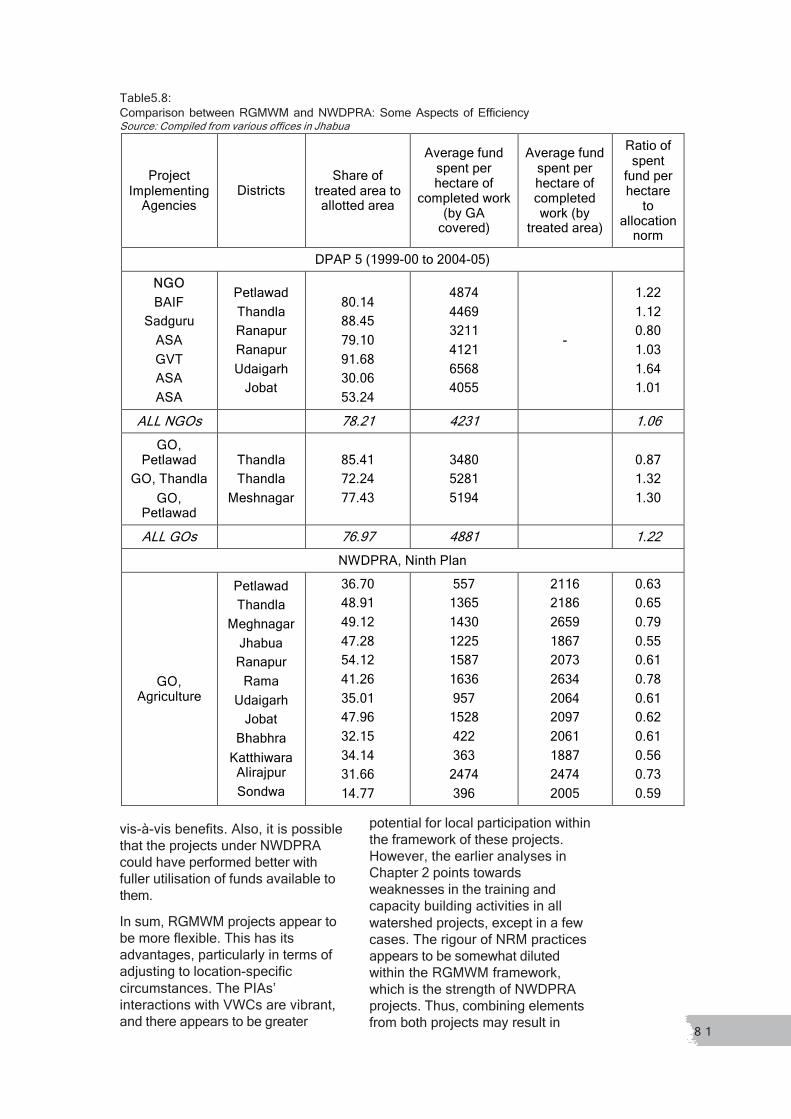
8 1
Table5.8:Comparison between RGMWM and NWDPRA: Some Aspects of EfficiencySource: Compiled from various offices in Jhabua
vis-à-vis benefits. Also, it is possiblethat the projects under NWDPRAcould have performed better withfuller utilisation of funds available tothem.In sum, RGMWM projects appear tobe more flexible. This has itsadvantages, particularly in terms ofadjusting to location-specificcircumstances. The PIAs�interactions with VWCs are vibrant,and there appears to be greater
potential for local participation withinthe framework of these projects.However, the earlier analyses inChapter 2 points towardsweaknesses in the training andcapacity building activities in allwatershed projects, except in a fewcases. The rigour of NRM practicesappears to be somewhat dilutedwithin the RGMWM framework,which is the strength of NWDPRAprojects. Thus, combining elementsfrom both projects may result in
Project Implementing
Agencies Districts
Share of treated area to allotted area
Average fund spent per hectare of
completed work (by GA
covered)
Average fund spent per hectare of completed work (by
treated area)
Ratio of spent
fund per hectare
to allocation
norm DPAP 5 (1999-00 to 2004-05)
NNGOGO BAIF
Sadguru ASA GVT ASA ASA
Petlawad Thandla Ranapur Ranapur Udaigarh
Jobat
80.14 88.45 79.10 91.68 30.06 53.24
4874 4469 3211 4121 6568 4055
-
1.22 1.12 0.80 1.03 1.64 1.01
ALL NGOs 78.21 4231 1.06 GO,
Petlawad GO, Thandla
GO, Petlawad
Thandla Thandla
Meshnagar
85.41 72.24 77.43
3480 5281 5194
0.87 1.32 1.30
ALL GOs 76.97 4881 1.22 NWDPRA, Ninth Plan
GO, Agriculture
Petlawad Thandla
Meghnagar Jhabua Ranapur
Rama Udaigarh
Jobat Bhabhra
Katthiwara Alirajpur Sondwa
36.70 48.91 49.12 47.28 54.12 41.26 35.01 47.96 32.15 34.14 31.66 14.77
557 1365 1430 1225 1587 1636 957 1528 422 363 2474 396
2116 2186 2659 1867 2073 2634 2064 2097 2061 1887 2474 2005
0.63 0.65 0.79 0.55 0.61 0.78 0.61 0.62 0.61 0.56 0.73 0.59
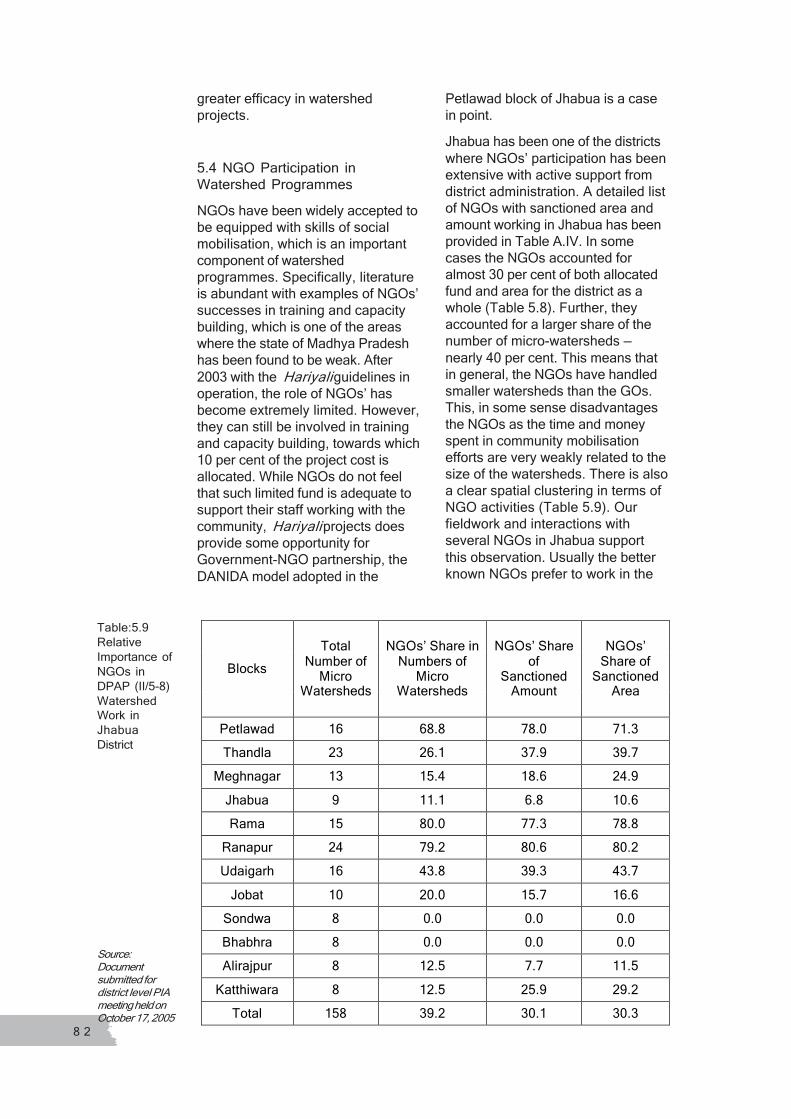
8 2
greater efficacy in watershedprojects.
5.4 NGO Participation inWatershed ProgrammesNGOs have been widely accepted tobe equipped with skills of socialmobilisation, which is an importantcomponent of watershedprogrammes. Specifically, literatureis abundant with examples of NGOs�successes in training and capacitybuilding, which is one of the areaswhere the state of Madhya Pradeshhas been found to be weak. After2003 with the Hariyali guidelines inoperation, the role of NGOs� hasbecome extremely limited. However,they can still be involved in trainingand capacity building, towards which10 per cent of the project cost isallocated. While NGOs do not feelthat such limited fund is adequate tosupport their staff working with thecommunity, Hariyali projects doesprovide some opportunity forGovernment-NGO partnership, theDANIDA model adopted in the
Petlawad block of Jhabua is a casein point.Jhabua has been one of the districtswhere NGOs� participation has beenextensive with active support fromdistrict administration. A detailed listof NGOs with sanctioned area andamount working in Jhabua has beenprovided in Table A.IV. In somecases the NGOs accounted foralmost 30 per cent of both allocatedfund and area for the district as awhole (Table 5.8). Further, theyaccounted for a larger share of thenumber of micro-watersheds �nearly 40 per cent. This means thatin general, the NGOs have handledsmaller watersheds than the GOs.This, in some sense disadvantagesthe NGOs as the time and moneyspent in community mobilisationefforts are very weakly related to thesize of the watersheds. There is alsoa clear spatial clustering in terms ofNGO activities (Table 5.9). Ourfieldwork and interactions withseveral NGOs in Jhabua supportthis observation. Usually the betterknown NGOs prefer to work in the
Blocks Total
Number of Micro
Watersheds
NGOs� Share in Numbers of
Micro Watersheds
NGOs� Share of
Sanctioned Amount
NGOs� Share of
Sanctioned Area
Petlawad 16 68.8 78.0 71.3 Thandla 23 26.1 37.9 39.7
Meghnagar 13 15.4 18.6 24.9 Jhabua 9 11.1 6.8 10.6 Rama 15 80.0 77.3 78.8
Ranapur 24 79.2 80.6 80.2 Udaigarh 16 43.8 39.3 43.7
Jobat 10 20.0 15.7 16.6 Sondwa 8 0.0 0.0 0.0 Bhabhra 8 0.0 0.0 0.0 Alirajpur 8 12.5 7.7 11.5
Katthiwara 8 12.5 25.9 29.2 Total 158 39.2 30.1 30.3
Table:5.9RelativeImportance ofNGOs inDPAP (II/5-8)WatershedWork inJhabuaDistrict
Source:Documentsubmitted fordistrict level PIAmeeting held onOctober 17, 2005

8 3
same area for a long period; thisenables them to build upon theconfidence gained from the localcommunity.Even in pre-Hariyali period, fromDPAP-II 5 to 7, the share of micro-watersheds being handled by theNGOs went down steadily (Table5.10). This trend may be indicative ofincreasing general disillusionmentwith NGOs in M.P. (Taru, 2001).
Stages of DPAP Inception
MWS2 with NGOs as
PIAs MWS with
GOs as PIAs
Total % of MWS with NGOs
as PIAs
DPAP 5 1999-2000 37 18 55 67.3
DPAP6 2000-2001 3 4 7 42.9
DPAP 7 2001-2002 6 19 25 24.0
DPAP 8 2002-2003 18 18 36 50.0
DPAP 9 1 2003-2004 0 36 36 0.0
However, their share recorded asudden jump just the year before theHariyali guidelines were announced.From the field experience it wasfound that some difficult projects �involving communities with highlevels of social conflicts and crimerates � handled by the GOs werepassed on to NGOs in 2002-03.Many of these NGOs werereportedly newly set up.
1- First batchunder HariyaliGuidelines2 MWS: MicrowatershedSource:Documentsubmitted fordistrict level PIAmeeting held onOctober 17,2005
Table 5.10:Relative Importance of GOs and NGOs in Phases of DPAP Project in Jhabua
% of Sanctioned Fund Spent Prog-
ramme PIA No. of
MWS Blocks
PIA VWC Total
% of Allotted
Area Treate
d NNGGOOss:: BAIF,
Sadguru, ASA, GVT
37 Petlawad, Jobat,
Thandla, Ranapur, Udaigarh
97.0 92.6 93.4 78.2 DDPPAAP P 55 (starting
1999-2000) GGOO::
CEO,Jan Panchayats
18
Thandla Meghnag
ar 89.8 94.3 93.5 77.0
NNGGOO:: BAIF,
NCHSE 6
Petlawad Meghnag
ar 86.3 80.1 81.4 45.4
DDPPAAP P 77 (starting
2001-2002)
GGOO:: CEO, Jan
Panchayats, Agriculture
Department, BDO
34 Thandla, Jhabua, Jobat,
Sondwa, Alirajpur
71.6 92.8 88.9 60.6
Table 5.11: Comparison of GOs and NGOs with respect to Financial and PhysicalProgress of DPAP 5 and DPAP 7 in Jhabua District (as on October, 2005)
Source: Districtlevel PIAmeeting held onOctober 17,2005

8 4
It is quite evident that delayedrelease of funds from the stategovernment has hampered theefficacy of watershed projects to alarge extent. The delay leads to alarge share of funds being spent inthe last two years. This adverselyaffects � for both GOs and NGOs �selection of activities, sites foractivities, and quality of work done.Watershed projects undertakenunder DPAP 5 which are nearingcompletion, and the ones underDPAP 7, which were due to becompleted during 2005-06 (datapertain to October 2005) have beencompared in Table 5.11. While thereis no significant difference in terms ofany of the indicators for GOs andNGOs with respect to DPAP 5projects, the NGO implementedprojects in DPAP 7 appear to besignificantly worse off. By the end ofthird year, or the first half of thefourth year, the NGOs had spent 80per cent of the total fund forwatershed work from the VWCaccount, but had covered only about45 per cent of the area (therespective figures for GOs were 92per cent and 60 per cent). In terms ofthe spending on entry point activitiesand community mobilisation,however, the NGOs were better offthan the GOs (as reflected by thepercentage of PIA expenditure spent,Table 5.11). This analysis lendssupport to the general observationthat while GOs are better in terms ofwork implementation, NGOs aremore skilled in the field of socialmobilisation. Though moresystematic fieldwork is required tosubstantiate this point for Jhabua,our finding points towardspossibilities of collaborative efforts ofGO and NGOs. Such observationsalso appear in existing reviews of thestate, where it has been suggestedthat NGOs can effectively fill up thegap existing in line departments inthe field of community mobilisationundertaken with the help of womenprofessionals.
5.5 Alternative ModelsTill now our discussion has centredon the broad-based programmeswhich are fully or partially fundedand implemented by the governmentagencies. It is equally important toreview some of the existing modelsin the district. The mode offunctioning of these models revealsinteresting differences in a numberof ways when compared with thegovernment funded models, most ofwhich operate under a set of givenguidelines. Some case studies andalternative models are presented inthis section based on our field visits.a) DANIDA - NWDPRA Project(collaboration of block agriculturaloffice and Sampark (NGO) ,Petlawad)The framework of DANIDA modelhas been briefly presented in Table5.7. As mentioned earlier, thisrepresents a case of successfulGovernment-NGO partnership. It isimportant for future policy directions,given the evolution pattern of thesecond generation watershedprojects. At DANIDA�s insistenceSampark was involved in theproject. There were initialdisagreements about the mode offunctioning of the project which waslater resolved by demarcation ofareas of work to be taken up by thetwo agencies. Sampark has takenup community mobilisation and hasallowed watershed activities onlyafter the participatory institutions arein place and the community isconsiderably motivated. One VWCwas made for each hamlet, ratherthan a village, thus achieving broad-based participation. Informationabout the government activities suchas technical support, agriculturalextension services as well asdistribution of better variety seedsfor vegetables, initiation of cropdiversification, and selection of non-water-intensive crops has beencommunicated successfully throughthe NGO to the local community.The vibrant micro-credit institutions
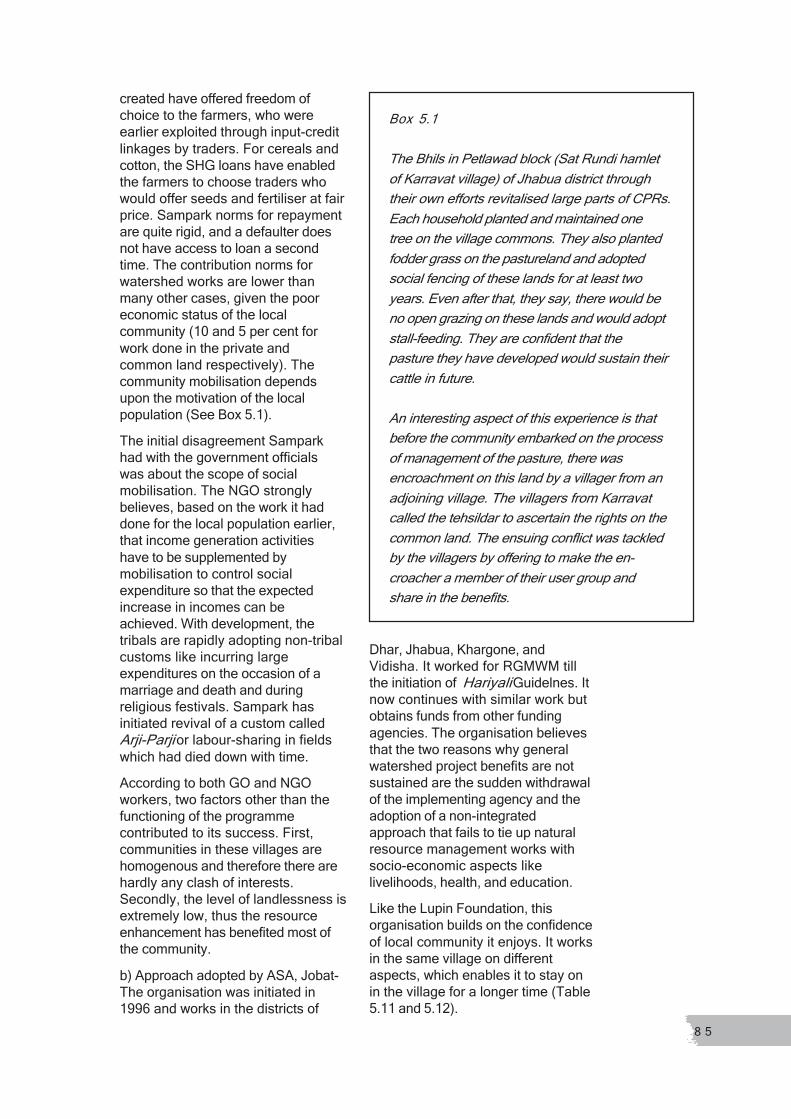
8 5
created have offered freedom ofchoice to the farmers, who wereearlier exploited through input-creditlinkages by traders. For cereals andcotton, the SHG loans have enabledthe farmers to choose traders whowould offer seeds and fertiliser at fairprice. Sampark norms for repaymentare quite rigid, and a defaulter doesnot have access to loan a secondtime. The contribution norms forwatershed works are lower thanmany other cases, given the pooreconomic status of the localcommunity (10 and 5 per cent forwork done in the private andcommon land respectively). Thecommunity mobilisation dependsupon the motivation of the localpopulation (See Box 5.1).The initial disagreement Samparkhad with the government officialswas about the scope of socialmobilisation. The NGO stronglybelieves, based on the work it haddone for the local population earlier,that income generation activitieshave to be supplemented bymobilisation to control socialexpenditure so that the expectedincrease in incomes can beachieved. With development, thetribals are rapidly adopting non-tribalcustoms like incurring largeexpenditures on the occasion of amarriage and death and duringreligious festivals. Sampark hasinitiated revival of a custom calledArji-Parji or labour-sharing in fieldswhich had died down with time.According to both GO and NGOworkers, two factors other than thefunctioning of the programmecontributed to its success. First,communities in these villages arehomogenous and therefore there arehardly any clash of interests.Secondly, the level of landlessness isextremely low, thus the resourceenhancement has benefited most ofthe community.b) Approach adopted by ASA, Jobat-The organisation was initiated in1996 and works in the districts of
Box 5.1
The Bhils in Petlawad block (Sat Rundi hamletof Karravat village) of Jhabua district throughtheir own efforts revitalised large parts of CPRs.Each household planted and maintained onetree on the village commons. They also plantedfodder grass on the pastureland and adoptedsocial fencing of these lands for at least twoyears. Even after that, they say, there would beno open grazing on these lands and would adoptstall-feeding. They are confident that thepasture they have developed would sustain theircattle in future.
An interesting aspect of this experience is thatbefore the community embarked on the processof management of the pasture, there wasencroachment on this land by a villager from anadjoining village. The villagers from Karravatcalled the tehsildar to ascertain the rights on thecommon land. The ensuing conflict was tackledby the villagers by offering to make the en-croacher a member of their user group andshare in the benefits.
Dhar, Jhabua, Khargone, andVidisha. It worked for RGMWM tillthe initiation of Hariyali Guidelnes. Itnow continues with similar work butobtains funds from other fundingagencies. The organisation believesthat the two reasons why generalwatershed project benefits are notsustained are the sudden withdrawalof the implementing agency and theadoption of a non-integratedapproach that fails to tie up naturalresource management works withsocio-economic aspects likelivelihoods, health, and education.Like the Lupin Foundation, thisorganisation builds on the confidenceof local community it enjoys. It worksin the same village on differentaspects, which enables it to stay onin the village for a longer time (Table5.11 and 5.12).

8 6
TThheemmaattiic c aarreeaa GGeoeoggrraaphphiic c llooccaattiioonn Community Based Natural Resources Management
(Watershed) Working since 1996 in 4 small river basins
comprising 42 villages across 4 blocks.
Micro-Finance (MF) Since 1996 for 110 villages (some watershed villages . overlapping)
PRI Capacity Building on livelihood issues Since 2003 for 23 villages in 1 block
Participatory Selection of Crop Varieties &
Promotion
Since 1996 for more than 60 villages. (overlapping watershed & MF villages.)
Providing technical support and inputs to MP-DPIP to implement in 7 7 districts for
320 villages since 2003.
Table 5.12:ASA�a Multi-FacetedActivities inJhabua
Source: ASA,2005.
Regarding the watershed work, itbelieves in putting first those worksthat have an important incomecomponent. It emphasisesdeveloping small irrigation works,which increases the area underirrigation and generates income.Like Sampark, it ensures that atleast one member is included in theVWC from each hamlet. The usergroups for the irrigation work levyuser charg on all beneficiariesthough the mode of payment (crop-
MMiiccrro o ffiinananncce e ffoor r AAggrriiccuullttuurraal l ccrreeddiit t
IInntteennssiiffiiccaattiioon n & & DDiivveerrssiiffiiccaattiioon n oof f AAggrriiccuullttuurre e
WWaatteerrsshheed d ((EEmmpphhaassiis s WWRRDD))
CCBBOOss CCBBOOss
CBOs
PPeeooppllee
AASSAA��s s SSttrraatteeggy y
wise or area-wise) varies betweengroups. A diagrammaticrepresentation of ASA�s strategy isgiven in Figure 5.2. Thedevelopment of water resources iscomplemented by creation of micro-credit institutions for providing creditfor agricultural inputs. It also aids incapacity building needed foradopting new technologies andprovides hybrid seeds from theproject funds.
Figure 5.2

8 7
c) Case of Gramin Vikas Trust,JhabuaThough it has undertaken some workunder the auspices of the RGMWM,it works primarily with funds fromDFID for Western India Rain-fedFarming Project. Its focus is todisseminate knowledge aboutappropriate technology suitable forthe area the Trust is working in.Some volunteers in the village aretrained by the Trust in naturalresource management techniquesand they represent the link betweenthe village and the Trust. Majoractivities are undertaken only afterconfidence building in the localcommunity is completed. Communityis organised in homogenous groupsof people with similar interests andusually work is carried out to benefiteach group separately on the basisof their priority. Among the activities,making drinking water available isalways the first priority, followed bythe repair of existing wells and tubewells. However, after facilitatingparticipatory institution building andcarrying out the watershed work, thetrust offers limited support. In otherwords, the Trust withdraws, unlikeASA and Lupin, at the completion ofthe project. Though the shramdanprinciple for soil-moistureconservation work is comparativelyhigh (25 per cent for common landand 50 per cent for private land), theTrust provides 100 per cent fundingfor capital expenditures of waterharvesting structures. The usergroup, however, is expected to raisefund for operation and maintenance.Water Users Associations (WUAs)usually gain from the waterharvesting structure. The trust hasnot found it difficult to generateinitiatives for maintenance. Thetraining provided to the user groupsis technical in nature and usuallythey can undertake the repair workthemselves.Several useful insights emerge whilecomparing the current models andthe alternative models with thestandard ones implemented at a
larger scale by the differentgovernment departments. First, thecommunity mobilisation aspect getsmuch greater emphasis in thealternative models compared to thestandard ones both in terms ofmethods of initiating participation andnorms of completing communitymobilisation before startingwatershed works. Secondly, thewithdrawal norms adopted are muchmore gradual in the former set ofprojects. Thirdly, most of thealternative models are more holisticin the sense that they tend to tie upnatural resource managementprogrammes with activities in health,education, animal husbandry, etc.The efforts put in communitymobilisation generate much greaterresults in these models. The normsfor user charges are stricter in thealternative models.There are a number of ways in whichthe alternative models differ in theirforms and functioning. One aspect isthe mode of sequencing watershedworks. While some models, forexample, ASA, believe in carryingout the income-generating activitiesfirst, others like GVT focus on workrequiring lower levels of investment(like repair works of existingstructures) first. The nature ofcapacity building varies amongdifferent models. GVT, for example,from the beginning, trains a coregroup in the village in NRM andrelated repair works.
5.6 Overall Impact: What doSecondary Data Tell?The rich and diverse experiencefrom various watershed projects inJhabua depicted above leads one toexpect certain tangible impact atdistrict level. We have tried toascertain this in the light of thechanges that have taken place in theindicators like area under crops,yield, and cropping pattern. Based onthe secondary data, the analysis triesto examine the changes in acomparative framework where the
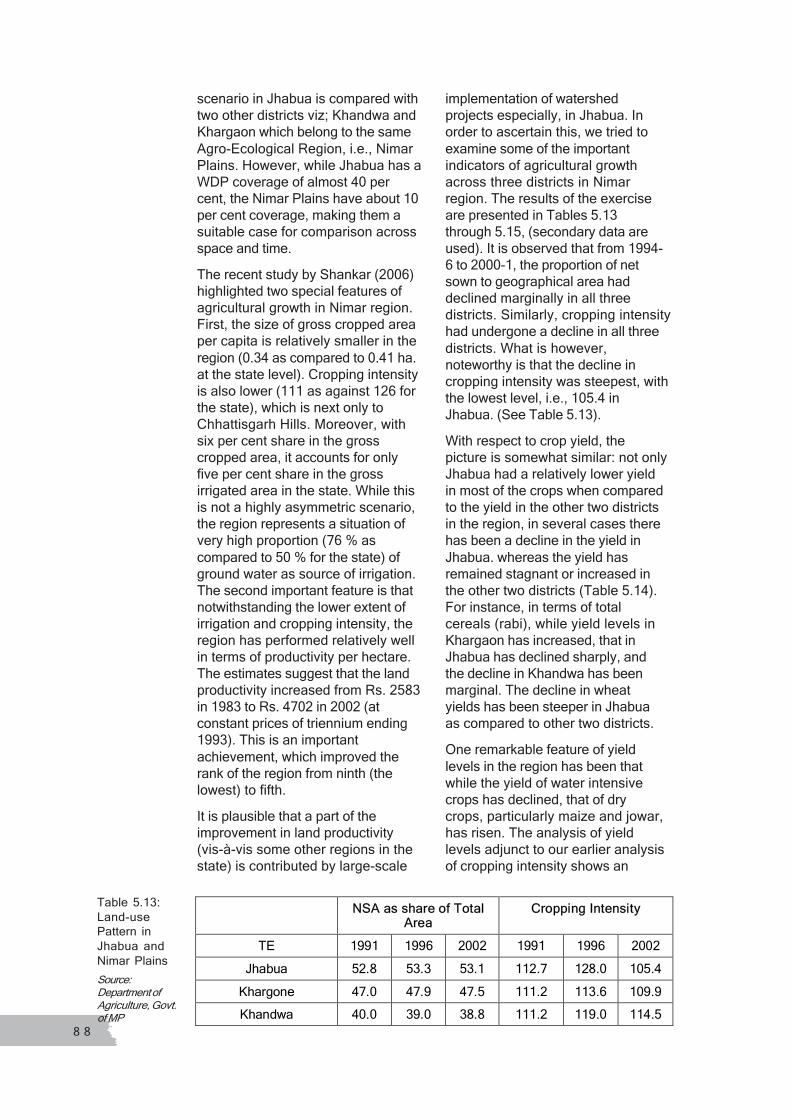
8 8
scenario in Jhabua is compared withtwo other districts viz; Khandwa andKhargaon which belong to the sameAgro-Ecological Region, i.e., NimarPlains. However, while Jhabua has aWDP coverage of almost 40 percent, the Nimar Plains have about 10per cent coverage, making them asuitable case for comparison acrossspace and time.The recent study by Shankar (2006)highlighted two special features ofagricultural growth in Nimar region.First, the size of gross cropped areaper capita is relatively smaller in theregion (0.34 as compared to 0.41 ha.at the state level). Cropping intensityis also lower (111 as against 126 forthe state), which is next only toChhattisgarh Hills. Moreover, withsix per cent share in the grosscropped area, it accounts for onlyfive per cent share in the grossirrigated area in the state. While thisis not a highly asymmetric scenario,the region represents a situation ofvery high proportion (76 % ascompared to 50 % for the state) ofground water as source of irrigation.The second important feature is thatnotwithstanding the lower extent ofirrigation and cropping intensity, theregion has performed relatively wellin terms of productivity per hectare.The estimates suggest that the landproductivity increased from Rs. 2583in 1983 to Rs. 4702 in 2002 (atconstant prices of triennium ending1993). This is an importantachievement, which improved therank of the region from ninth (thelowest) to fifth.It is plausible that a part of theimprovement in land productivity(vis-à-vis some other regions in thestate) is contributed by large-scale
implementation of watershedprojects especially, in Jhabua. Inorder to ascertain this, we tried toexamine some of the importantindicators of agricultural growthacross three districts in Nimarregion. The results of the exerciseare presented in Tables 5.13through 5.15, (secondary data areused). It is observed that from 1994-6 to 2000-1, the proportion of netsown to geographical area haddeclined marginally in all threedistricts. Similarly, cropping intensityhad undergone a decline in all threedistricts. What is however,noteworthy is that the decline incropping intensity was steepest, withthe lowest level, i.e., 105.4 inJhabua. (See Table 5.13).With respect to crop yield, thepicture is somewhat similar: not onlyJhabua had a relatively lower yieldin most of the crops when comparedto the yield in the other two districtsin the region, in several cases therehas been a decline in the yield inJhabua. whereas the yield hasremained stagnant or increased inthe other two districts (Table 5.14).For instance, in terms of totalcereals (rabi), while yield levels inKhargaon has increased, that inJhabua has declined sharply, andthe decline in Khandwa has beenmarginal. The decline in wheatyields has been steeper in Jhabuaas compared to other two districts.One remarkable feature of yieldlevels in the region has been thatwhile the yield of water intensivecrops has declined, that of drycrops, particularly maize and jowar,has risen. The analysis of yieldlevels adjunct to our earlier analysisof cropping intensity shows an
NNSA SA aas ss shaharre e oof f TToottaal l AArreeaa
CCrrooppppiing ng IInnttenenssiittyy
TE 1991 1996 2002 1991 1996 2002 Jhabua 52.8 53.3 53.1 112.7 128.0 105.4
Khargone 47.0 47.9 47.5 111.2 113.6 109.9 Khandwa 40.0 39.0 38.8 111.2 119.0 114.5
Table 5.13:Land-usePattern inJhabua andNimar PlainsSource:Department ofAgriculture, Govt.of MP
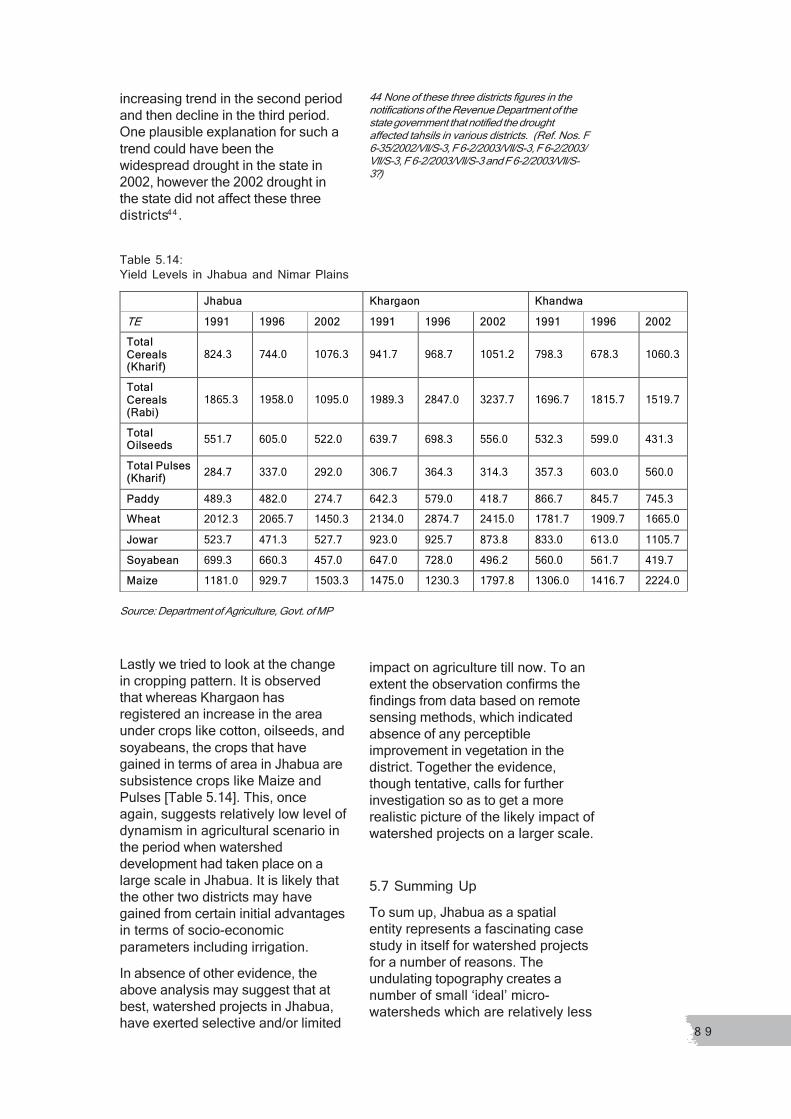
8 9
increasing trend in the second periodand then decline in the third period.One plausible explanation for such atrend could have been thewidespread drought in the state in2002, however the 2002 drought inthe state did not affect these threedistricts44 .
44 None of these three districts figures in thenotifications of the Revenue Department of thestate government that notified the droughtaffected tahsils in various districts. (Ref. Nos. F6-35/2002/Vll/S-3, F 6-2/2003/Vll/S-3, F 6-2/2003/Vll/S-3, F 6-2/2003/Vll/S-3 and F 6-2/2003/Vll/S-3?)
Table 5.14:Yield Levels in Jhabua and Nimar Plains
Lastly we tried to look at the changein cropping pattern. It is observedthat whereas Khargaon hasregistered an increase in the areaunder crops like cotton, oilseeds, andsoyabeans, the crops that havegained in terms of area in Jhabua aresubsistence crops like Maize andPulses [Table 5.14]. This, onceagain, suggests relatively low level ofdynamism in agricultural scenario inthe period when watersheddevelopment had taken place on alarge scale in Jhabua. It is likely thatthe other two districts may havegained from certain initial advantagesin terms of socio-economicparameters including irrigation.In absence of other evidence, theabove analysis may suggest that atbest, watershed projects in Jhabua,have exerted selective and/or limited
impact on agriculture till now. To anextent the observation confirms thefindings from data based on remotesensing methods, which indicatedabsence of any perceptibleimprovement in vegetation in thedistrict. Together the evidence,though tentative, calls for furtherinvestigation so as to get a morerealistic picture of the likely impact ofwatershed projects on a larger scale.
5.7 Summing UpTo sum up, Jhabua as a spatialentity represents a fascinating casestudy in itself for watershed projectsfor a number of reasons. Theundulating topography creates anumber of small �ideal� micro-watersheds which are relatively less
Source: Department of Agriculture, Govt. of MP
JJhhababuuaa KKhhaarrggaoaonn KKhhaandndwwaa TE 11999191 11999696 22000202 11999191 11999696 22000202 11999191 11999696 22000202 TToottaal l CCeerreeaalls s ((KKhaharriiff))
824.3 744.0 1076.3 941.7 968.7 1051.2 798.3 678.3 1060.3
TToottaal l CCeerreeaalls s ((RRababii))
1865.3 1958.0 1095.0 1989.3 2847.0 3237.7 1696.7 1815.7 1519.7
TToottaal l OOililsseeededss 551.7 605.0 522.0 639.7 698.3 556.0 532.3 599.0 431.3 TToottaal l PPuullssees s ((KKhaharriiff)) 284.7 337.0 292.0 306.7 364.3 314.3 357.3 603.0 560.0 PPaaddddyy 489.3 482.0 274.7 642.3 579.0 418.7 866.7 845.7 745.3 WWhheeaatt 2012.3 2065.7 1450.3 2134.0 2874.7 2415.0 1781.7 1909.7 1665.0 JJoowwaarr 523.7 471.3 527.7 923.0 925.7 873.8 833.0 613.0 1105.7 SSooyyababeeanan 699.3 660.3 457.0 647.0 728.0 496.2 560.0 561.7 419.7 MMaaiizzee 1181.0 929.7 1503.3 1475.0 1230.3 1797.8 1306.0 1416.7 2224.0

9 0
TTEE 11999191 TTE E 11999966 TTE E 22000022
KKhhaarriif f PPuullsseess, , MMaaiizzee KKhhaarriif f PPuullsseess, , MMaaiizzee, , RRaabbi i PPuullsseess
MMaaiizzee, , KKhhaarriif f PPuullsseess, , TToot. t. OOiillsseeeedds s
JJhhababuuaa TToot. t. OOiillsseeeeddss, , JJoowwaarr, , PPaaddddyy, , RRaabbi i PPuullsseess, , CCoottttoonn, , WWhheeaatt
TToot. t. OOiillsseeeeddss, , WWhheeaatt, , PPadadddyy, , SSooyyaabbeeanan, , JJoowwaarr, , CCoottttoonn
SSooyyaabbeeanan, , CCoottttoonn, , PPaaddddyy
CCoottttoonn, , JJoowwaarr, , KKhhaarriif f PPuullsseess
CCoottttoonn,, TToott. . OOiillsseeeeddss, , JJoowwaarr, , SSooyya ba beeaannss, , WWhheeaatt
OOiillsseeeeddss, , SSooyyaabbeeanan, , CCoottttoonn, , WWhheeaatt** KKhhaandndwwaa
TToot. t. OOiillsseeeeddss, , WWhheaeat, t, PPaaddddyy KKhhaarriif f PPuullsseess ----
CCoottttoonn, , JJoowwaarr, , KKhhaarriif f PPuullsseess
CCoottttoonn, , JJoowwaarr, , KKhhaarriif f PPuullsseess, , TToot. t. OOiillsseeeeddss
CCoottttoonn, , JJoowwaarr, , TToot. t. OOiillsseeeeddss, , SSooyyaabbeeananss,, KKhhaarrggaaoonn
TToot. t. OOiillsseeeeddss, , WWhheaeatt WWhheeaatt, , MMaaiizzee KKhhaarriif f PPuullsseess, , MMaaiizzee
Table 5.15:CroppingPattern in theJhabua andNimarPlains45 (indecreasingimportance ofcrops)45 Weaver�sMethod hasbeen followed tocalculate thecropping pattern.
linked with functionalities of thelarger watersheds. A largepercentage of population lives justabove or below the poverty line andthere is a high incidence ofunemployment or underemploymentand thus has the characteristicscommon to a seasonally migrantpopulation (to adjoining states ofGujarat and Rajasthan). Thus eventhe temporary employmentopportunities created by watershedprojects at substantially higherwages have the potential to attractthe attention of the populationtowards the watershed projects. Arelatively small incremental incomecan generate interest and motivesfor participation in the long run. Ourfield surveys confirm that the natureof seasonal migration has changed agreat deal in project areas. Theelders who are left behind are moreproductively engaged in raising asecond crop from the field, while alot of children who are also leftbehind regularly attend school. Theyoung couples migrate, but for ashorter time, even after the project isover as there is more work in thefields. The joint decisions about thewatershed structures of SHGs aretaken more easily compared to otherparts of the state due to thehomogenous tribal population. Above
all, Jhabua has a group of highlymotivated government officials whohave been involved in watershedwork for many years. There are alsosome very efficient NGOs whichhave been able to pursue their ownmodels in many cases despite thefact that their method of work isdifferent from the governmentalmethod,.The following issues emerge fromthe case study of Jhabuaspecifically, from which lessons canbe drawn for the rest of the states.
1. There appears to be nosystematic way of prioritisingresources at the sub-district level.Our analysis reveals that a normof a flat area allocation underRGMWM projects has beenfollowed from the post-Haryaliprojects. In this context developingwatershed level information basethat can at least be used at thesub-district level is important.2. The importance of NGOs hadbeen declining even before theHaryali guidelines began to beused in the district. However, theNGOs have accepted the moredifficult watershed works in whichthe GOs have not achievedresults. It needs to be examinedwhether in these cases the NGO
9 1
results are significantly differentafter the completion of theseprojects.3. In general, our findings are inconformity with the generalperception that while the GOs havedone better in terms of watershedworks, the NGOs have been moresuccessful in terms of communityorganisation. This provides ascope to look into GO-NGOpartnerships in future, both withinand outside the Haryali framework,since each has its own area of corecompetence and the two are to alarge extent complementary.
Some thought needs to be given tothe possibility of incorporating a fewfeatures of the existing models in thestates within a broader institutionalframework. For example, whether alonger and a more gradualwithdrawal strategy should beadopted by the implementingagencies needs to be consideredparticularly as the added cost of thechange seems justified vis-à-vis theresults achieved. Also, there couldbe a scope for tying up with some ofthe complementary programmesalready running in the states whichcan benefit from the communitymobilisation incorporated within theframework of watershed projects.

9 2
Summary and Major Findings
6.1 The ContextWatershed DevelopmentProgrammes (WDPSs) havetraversed through fairly richexperiences culminating into varietyof learning experiences and a mixbag of successes and failures. Anumber of studies have tried tosummarise and synthesiseexperiences and outcomes fromdifferent watershed programmesacross different parts of the country.The recent report �From Hariyali toNeeranchal� prepared by theParthasarathy Committee is build onthis vast and varied set ofexperiences and outcomes andthereby sets a stage for the next(say, the third) phase of watersheddevelopment in India. Whereas thefirst phase of watersheddevelopment in the mid-nineties hadfocused mainly on conceptualisation,the second phase seems to haveconsolidated the experiences withrespect to processes andmechanisms of projectimplementation. The next phasetherefore, is to find synergies andachieve convergence acrossresources, projects, and otherdevelopmental initiatives. It isagainst this backdrop that the studyhas reviewed the experiences ofvarious watershed programmes inMadhya Pradesh. Rather than beingevaluative, the analysis has tried tolook at the various projects in thelight of the specific concernspertaining to convergence.
The process of convergenceessentially requires creating a largerpicture so as to be able to gauge thenature, magnitude, and theinterconnectedness of the issuesand solutions- many of them may gobeyond the scope of micro/milliwatershed projects. In this context,issues like prioritisation withinearmarked areas for eachprogramme, upstream-downstreamdynamics, impact on water balanceand ground water profile, promotionof sustainable farming practices,equitable benefit-sharing, cross-subsidisation, and cost-sharing,sustainability of watershedtreatments and institutions andupward linkages with markets arerelevant.A first step towards creating such alarger picture on watersheddevelopment involves a number ofactivities in terms of preparing abroad data-base; reviewing variousexperiences, understanding theadministrative problems, exploringalternative institutional mechanisms,and creating multi-stakeholderplatforms for exchange ofinformation, experiences, and policyfeedback.It is towards this larger goal, thatForum for Watershed Research andPolicy Dialogue (ForWaRD) � aconsortium of three organizationsviz. Society for PromotingParticipative Eco-systemManagement (SOPPECOM),Gujarat Institute of DevelopmentResearch (GIDR), and Centre forInterdisciplinary Studies inEnvironment and Development(CISED) � has undertaken someinitiatives in Maharashtra, MadhyaPradesh, and Karnataka. Thepresent paper is a part of the largerset of studies being undertaken byForWaRD. The paper, besidescollating the finding from alreadyexisting literature covering specificproject in specific areas of the state,seeks to focus on the issues raisedabove. The idea is to go beyond thestock taking and at least highlight
Chapter 6
9 3
some of the new challenges that arelikely to assume critical importancewhile scaling up and at the sametime, enhancing effectiveness of theprogrammes in the times to come.Methodology and ApproachThe purpose of this study was tocarry out a broad review of status ofwatershed programmes in MadhyaPradesh. The fact that WDPs arebeing carried out by numerousagencies, each having their ownindividual model and way offunctioning, probably points to thenotion that these are seen as justone of the numerous ruraldevelopment programmes alsocarried out by the same departments/agencies. In other words, theimportance of watershed �approach�as it deviated from the �sectoral�approach, is in some wayundermined, if not negated. Thishowever, makes a case forcomparing the different models beingpractised in the state using theguidelines of our normative approach� to review and validate the rationaleof convergence of theseprogrammes.The report has been dealt with at twolevels. Initially, an attempt to reviewthe WDPs for the state as a wholehas been made. Since the availablematerial is inadequate to develop acomprehensive review, a case studyof Jhabua district has been added tofill in some of the gaps, primarilybecause of high (almost 38 per cent)coverage of watershed projects inthe district as well as typology ofprojects.The database of this report has beena) collection of documented materialwith respect to the state as well asthe district of Jhabua, b) Interviewwith key persons, and c) preliminaryfield visits in Raisen, Sehore andJhabua for arriving at a qualitativeassessment of the nature ofimplementations of the projects. Itmay be noted here that carrying outa systematic survey was not withinthe scope of our review. The review,
as may be understood from theunderlying approach, is expected tobe broadly qualitative, and probablywill not enable us to say anything ina conclusive manner. Nevertheless,since published material available isextremely scant, even a skeletonstatus report would lay a base for apolicy dialogue between practitionersand policy makers. Also, it is hopedthat it would provide some directionsfor future research in this field.
6.2 Scope and Coverage of WDPsin M. P.Madhya Pradesh constitutes asignificant part of the vast tracts ofdry-land farming land in India, whichin turn, consists of almost two-thirdsof India�s cultivated land; such areasremain vulnerable to risk anduncertainty, degradation of naturalresources and problems of lowproductivity. The topography andother agro-climatic conditions in thestate however, offer a fairlypromising opportunity for watersheddevelopment, as compared to thepredominantly dry land states e.g.Rajasthan, Gujarat, and Maharashtralocated on the western part of thestate. For instance, a fair part of M.P.enjoys sub-humid conditions withaverage annual rainfall exceeding1000 mm, a substantial part of theregion constitutes upper catchmentswhere checking soil erosion mayassume significant importance forsustaining and improving soilproductivity. Further, with almostone-third of land as forest area, andfairly substantial proportion ofcultivated land having beenconverted from erstwhile forest area,the natural productivity is likely to befairly good in most parts of the areawhere poor, especially tribalcommunities are located.Besides these, factors like relativelylow level of commercialisation ofagriculture, especially with respect touse of chemical inputs andsubstantial achievements in terms ofstrengthening decentralized

9 4
governance through reforms inPanchayati Raj system hassignificant bearing for watersheddevelopment in the state.Given the scope, the Government ofMP recognized the need to harnessthe potential of its relatively richnatural resources for simultaneouslyachieving the dual goals ofenvironmental regeneration andpoverty reduction in the state. Thestate is perhaps the pioneer in thecountry in terms of setting up aspecial Mission (i.e. RGMWM) forimplementing watersheddevelopment projects (fundedthrough the MoRD). Implementationof WDP in a mission mode isperhaps a pointer to officialrecognition of the need as well asscope for watershed development inthe state, which otherwise hasremained fairly dormant in terms itsagricultural growth and theassociated poverty reduction.Besides RGMWM, which has adistinction of implementing thelargest number of watershed projectsin the state, there are other agencies/ programmes that have madesignificant contribution towardswatershed development. The othermajor programme is NationalWatershed Programme for RainfedAgriculture (NWDPRA), which tillrecently, had covered less than onethird of the area covered byRGMWM. To a large extent,relatively higher coverage of WDPsby RGMWM is due to the fact that agood number of districts in the statehave been identified under variousarea specific programmes underMoRD like EAS, DPAP and IWDPout of which EAS has a substantialcoverage.RGMWM and NWDPRA togetherwith RVP account for more than fivemillion hectares of area coveredcovering more than 15 per cent ofthe total area in the state (the figuremight not be accurate due toinconsistencies in informationbetween RGMWM and NWDPRA
wherein the former has theinformation of the total area coveredthe latter gives the figure of only theactual treated area).It is observed that the WDPs underRGMWM have concentrated mainlyin twelve districts, constituting about56 per cent of the total area coveredunder the programme. These are:Jhabua, Dhar, Chhindawada,Khargaon, Ratlam, Sidhi, Shahdol,Satna, Sheoni, Shivapuri, Raysen,Bhind. All these districts have morethan one lakh ha. of treated landunder the programme. Similarly,NWDPRA has higher concentrationin eleven districts, accounting for 39percent of the total treated areaunder the programme. These are:Jhabua, Jabalpur, Chhindwada,Satna, Mandasaur, Guna, Betul,Mandla, Indore, Khargaon,Shajapur. Each of these districts hasmore than 30,000 ha. of treated areaunder NWDPRA. Together theseare 17 districts having larger areaunder the two major watershedprogrammes with four appearing inboth the lists, viz. Jhabua,Chhindwada, Satna and Khargaon.The three programmes have been,by and large, implemented in amanner that avoids duplication ofefforts; each one of them caters tospecific areas on priority basis.However, it is likely that there is notmuch of synergy between thevarious programmes because first,the projects are being planned withinthe context of departmentalpriorities; and secondly, the unit forplanning is generally milli and/ormicro watershed rather than astream or river basin. The ForestDepartment also undertakes soilwater conservation treatment ondegraded forest area, constitutingmajor part of the upper catchmentsof watersheds. However, in generalthey don�t implement theconservation measures on awatershed basis and we don�t havemuch information about that, exceptfor a few cases where they act as aPIA for RGMWM.

9 5
WDPs implemented by agencies likeCAPART and Donor Agencies asDFID, EU, ICEF etc. also couldn�t betaken into consideration due to lackof information regarding them in thepublic domain.Although most of the WDPs havebeen implemented by thegovernment agencies there are anumber of NGOs (numbering about100) who have been involved as PIAunder RGMWM and CAPART. TheNGOs vary widely in terms of thepast experience, capabilities, andpresence in the area before and aftercompletion of the WDPs. However,only half of the NGOs seem to havea fairly good understanding as wellas capability in terms ofimplementing WDPs. A largeproportion of these NGOs haveexperience in implementation ofGovernment as well as externallyfunded projects.In absence of synergy across theprogrammes the actualachievements may have remainedsub-optimal, notwithstanding theeffective implementation of themicro/milli watershed projects. It istherefore likely that: (a) the impact ofthe various programmes may haveremained localized; and (b) crosslearning may have remained limited.Hence, a more holistic picturetherefore is needed to address theabove limitations.
6.3 Jhabua District: ADisaggregated AnalysisJhabua district is located in thewesternmost semi-arid agro-climaticzone and is in fact one of the fivemost backward districts of thecountry. Jhabua�s relative position inthe state is somewhat like MadhyaPradesh�s relative position in thecountry. The district has been a mainfocus of attention from variousagencies implementing watershedprojects in the state. The district alsohas a group of extremely motivatedgovernment officials, who have been
involved in watershed work for manyyears. There are also someextremely efficient NGOs whichdespite having different ways ofworking compared to thegovernment�s way of functioninghave been able to pursue their ownmodels in many cases. In that sense,it provides a platform for examiningthe central issues of the study at amore disaggregated level.
Following issues emerge from thecase study of Jhabua:
There appears to be no systematicway of prioritising resources at thesub-district level. Our analysisreveals that a norm of a flat areaallocation under RGMWM projectshas been followed from the post-Haryali projects. In this contextdeveloping watershed levelinformation base that can at leastbe used at the sub-district level isimportant.The importance of NGOs has beendeclining even before the HaryaliGuideline in the district. However,the NGOs have accepted the moredifficult watershed works where theGOs have not achieved results. Itneeds to be examined whether inthese cases the NGO results aresignificantly different after thecompletion of these projects.In general, our findings are inconformity with the generalperception that while the GOs havedone better in terms of watershedworks, the NGOs have been moresuccessful in terms of communityorganisation. This provides ascope to look into GO-NGOpartnerships in future, both withinand outside the Haryali framework,as clearly, their areas of corecompetence is different and to alarge extent complementary.Some thought needs to be given tothe possibility of incorporating afew features of the existingalternative models in the stateswithin a broader institutional
9 6
framework. For example, a longerand a more gradual withdrawalstrategy of the implementingagencies needs to be given someconsideration particularly as theadded cost of this seem to bejustified vis-à-vis the resultsachieved. Also, there could be ascope for tying up with some of thecomplementary programmesalready running in the states whichcan benefit from the communitymobilisation incorporated withinthe framework of watershedprojects.
6.4 Implementation andAchievementsThere is vast set of grey literaturethat has gone into examining theimplementation process and theachievements or impact of thevarious watershed projects in thestate. While most of these studies/reports are project specific, onecould identify common featurescutting across the majorprogrammes especially, RGMWMand NWDPRA. In what follows wehave tried to summarise some of theimportant features pertaining toproject implementation andachievements. These are of course,fairly generalist in nature,nevertheless recapitulating themmay help raising relevant issues anddrawing lessons thereof.The major benefits of theimplementation of watershedprogrammes in the state can besummarised in terms of:
Increased availability of waterthrough water harvestingstructures and enhanced cropsurvival during mild drought.Significant awareness forharvesting and conserving water,inducing private initiatives.Positive demonstration effect of therelatively more successful andsustaining WDPs.
Given the hilly and undulatingterrain, the watershed structureshave by and large yieldedsubstantial benefits to about 8-10farmers per structure. The benefitshave resulted in increase innumber of waterings, increasedcropping intensity, and change incropping pattern in favour of morewater intensive crops.
The following observations can bemade about the mode of projectimplementation in the state byvarious agencies:
Given the earmarked area,selection of milli and microwatersheds generally appears tobe based on socio-politicalconsiderations, rather than takingconnectivity and continuity in ageo-hydrological sense.�Pani Roko Abhiyan� being a pre-cursor, watershed approach in thestate also got to be seen morewithin a micro context, withoutlooking into the issues ofupstream-down stream within alarger watershed or river basin.Although most of the programmesfunction with objectives that arefairly common (especially amongRGMWM, NWDPRA, CAPART,Donor Funded), there aresubstantial differences in themanner in which theseprogrammes are being visualizedand thus in turn, implemented.Whereas institutional developmentassumes a more important place inthe WDPs implemented byRGMWM, agronomic practicesand crop management remaincentral to NWDPRA.The treatment in the forest areasare focused more on vegetativemeasures and regeneration as wellas conservation of forest. In thatsense the intervention does notdirectly link watershed treatment orsoil water conservation to thepeople who live inside or in theperiphery of the forest.

9 7
There is little clarity about themicro watershed projects to betaken up within the area alreadytreated under RVPs.The problem of delay indisbursement of fund is common tomost of the programmes. Thisobviously has a significant bearingon the manner in which project isimplemented especially in terms ofmobilizing people�s participation.The ridge to valley approach isdifficult to follow especially, withinthe time frame of the project. Theobvious preference for waterharvesting structures plays acritical role in getting peopleinvolved in the project. Negotiatingthis against other treatmentstherefore requires substantial skillsin the form of social engineering.Most of the Govt. agencies maynot get into this difficult process,given the other responsibilities onhand. At the same time, NGOsmay lack the requisite skills tosteer the process. As a result theprogramme remains centred roundwater harvesting structures.WDCs and SHGs are formed in thecase of most of the WDPs. Theseinstitutions however often do notlast beyond the project. In case ofWDCs, utilization of funds aftercompletion of the project is difficultespecially in the light of the factthat the recent regulation underRGMWM that the committee canuse only the interest of thedevelopment fund vested with that.In the case of SHGs, most of themcease to function after the PIAwithdraws or many a time evenbefore that. The individual savingsare also withdrawn.The size of the water harvestingstructures seems to be acontentious issue. The areas withhigh slope as well as erosion mayrequire substantially largerstructure that may not be feasiblewithout compromising the equityissue, given the financial allocation.
Although the water harvestingstructures have been made fairlywell and most of them havesurvived at least till 3-4 years aftercompletion of the project the futuremanagement however is a bigquestion.Drinking water continues to remaina missing link in large number ofWDPs. Hand pumps/ stand postsand water tanks including tankerssupplied by other schemes forprovisioning of drinking waterremains the major source.Adopting integrated approach toaugmentation and allocation ofwater across different uses andusers is an unresolved aspect inmost of the WDPs, including someof those implemented by NGOs.Forest and pastures within microwatersheds are rarely treated andprotected. Managing a foddersupply system during the initialphase when the pastures are beingprotected, and regulating the usesubsequently, is often foundunaddressed. Unless this aspect isbrought to the forefront right fromthe beginning of participatoryprocesses of planning andimplementation, management ofCPLRs remains the most difficultchallenge.Little attention is being paidtowards agricultural extensionexcept for distribution of seeds andother inputs. Water use efficiencyis yet to be taken up on board asan important issue for negotiation.Availability of wages during theproject period is an importantbenefit reaching to landless. Usingthe fund generated out of the wageincome could potentially be utilisedby forming SHGs. Such groupsseldom sustain as noted earlier.
6.5 Emerging Issues and FutureDirections:The experience, till now suggest thatwhereas there is increasing

9 8
awareness and interest amongpeoples in WDPs, the project by andlarge suffers from clear resultorientation. The very reason, whichprompted adoption of multifunctionaland participatory approach instead ofmerely activity specific interventionin the earlier schemes implementedby the line department, seems to beblocking the way towards a result (ifnot target) oriented mechanism forproject implementation. It seems thatthe projects attempt to address, intits and bits, most of the aspectsenvisaged by the project -productivity enhancement,employment generation (if notequity), environmental sustainability,democratic decentralization, andsetting up of backward-forwardlinkages (Watershed-plus). And yet,the actual achievements especiallyin terms of sustenance of benefitsappear to be limited.At this juncture when the RuralEmployment Guarantee Act isalready in place, and WDPs is one ofthe most important thrust areas forthe activities to be planned under theemployment programme, it isessential that the lessons learnt fromthe past experience be incorporatedin future planning. Following issuesneed special attention in this context:
Adopting a holistic approach bycoordinating various watershedprogrammes taking a largerwatershed unit for perspectiveplanning. The present state levelcoordination committee should bemade more broad-based.Coordinated efforts are should bemade to create a public databaseon the various important aspectsfor watershed development.Putting information about treatedand planned micro watersheds inpublic domain so as to helpenhancing transparency inplanning and implementation.Link with RVP and Forestwatersheds should be established
keeping the upstream-downstream perspective in place.Setting up priority of treatingCPLRs including the degradedforestland within a microwatershed as an important pre-condition for undertaking theWDP-implementation. This wouldrequire sorting out the legalhitches.Introducing administrative andfinancial flexibility on a resultoriented basis.PIAs may not immediatelywithdraw after completion of theproject. There is a need to dovetailother programmes where theNGOs/PIAs could continue theirinteraction with the villagecommunities, especially in order tohand hold the community basedorganisations created under theproject. The PIAs should bearound at least till the first threerounds of repair/maintenance orregulating the use of pastures arecompleted.The scope for creating largerwater harvesting structures orregenerating degraded forest/otherland could be linked with minorirrigation and forest departmentrespectively; same may apply forschemes for providing drinkingwater in the WDP villages.
A multi-stakeholder platform mayhelp identifying and addressingconceptual as well as practicalissues such as these. While there acouple of networks of WDP-parishioners, these networks needto be strengthened and representedin the state level coordinatingcommittee as part of the process ofbroadening its base.

9 9
ASA: Action for Social Advancement
ANARDe Foundation: ACIL-Navasarjan Rural Development Foundation
ADB: Asian Development Bank
BAIF: Bharatiya Agro Industries Foundation
CAPART: Council for Advancement of People�s Action & Rural Technology
CARD: Centre for Advanced Research and Development
CBO: Community Based Organisations
CGWB: Central Ground Water Board
CISED: Centre for Interdisciplinary Studies in Environment and Development
CPLR: Common Property Land Resource
CSWCRTI: Central Soil and Water Conservation Research and Training Institute
CWDP: Comprehensive Watershed Development Programme
DANIDA: Danish International Development Assistance
DFID: Department for International Development
DPAP: Drought Prone Areas Programme
DPIP: District Poverty Initiatives Program
DRDA: District Rural Development Agency
EAS: Employment Assurance Scheme
EDSS: Eco Development Solution Society
FAO: Food and Agriculture Organisation
ForWaRD: Forum for Watershed Research and Policy Dialogue
GIDR: Gujarat Institute of Development Research
GVT: Gramin Vikas Trust
ICAR: Indian Council for Agricultural Research
ICEF: India-Canada Environment Facility
List of Abbreviations

1 0 0
ICRISAT: Indian Centre for Research in Semi-arid Tropics
IIFM: Indian Institute of Forest Management
IWDP: Integrated Wastelands Development Programme
MoA: Ministry of Agriculture
MoRD: Ministry of Rural Development
MPRLP: Madhya Pradesh Rural Livelihoods Project
NCHSE: National Centre for Human Settlements and Environment
NREGA: National Rural Employment Guarantee Act
NRSA: National Remote Sensing Agency
NWDPRA: National Watershed Development Programme for Rainfed Areas
PIA: Programme Implementation Agency
PRA: Participatory Rural Appraisal
PRI: Panchayati Raj Institutions
RGMWM: Rajiv Gandhi Mission for Watershed Management
RVP: River Valley Programme
SGRY: Sampoorna Gramin Rozgar Yojna
SGSY: Swarnjayanti Gram Swarozgar Yojana
SHG: Self Help Group
SPS: Samaj Pragati Sahyog
UNICEF: United Nations International Children�s Emergency Fund
VDC: Village Development Committee
VWC: Village Watershed Committee
WALMI: Water and Land Management Institute
WDP: Watershed Development Programme
WUA: Water Users Association
1 0 1
ADB (2001), �Madhya Pradesh Integrated Water Management Strategy�, AsianDevelopment Bank, September.ANARDe Foundation (2005a), �Evaluation Study of Watershed Development in DistrictUjjain�.ANARDe Foundation (2005b), �Evaluation Study of Watershed Development in DistrictRatlam�.CARD (2002a), �Evaluation of DPAP in Betul District (6thBatch) of Madhya Pradesh�,submitted to RGMWM.CARD (2002b), �Evaluation of DPAP in Panna District (6th Batch) of Madhya Pradesh�,submitted to RGMWM.CARD (2002c), �Evaluation of DPAP in Seoni District (6th Batch) of Madhya Pradesh�,submitted to RGMWM.CARD (2002d), �Impact Assessment Study of Watershed Programmes in MadhyaPradesh�, Sponsored by Monitoring Department, Ministry of Rural Development,Monitoring Division.CARD (2005a), �Mid Term Evaluation of Drought Prone Area Programme (9th Batch) inJhabua district of Madhya Pradesh�.CARD (2005b), �Mid Term Evaluation of Drought Prone Area Programme (9th Batch) inMandla district of Madhya Pradesh�.CARD (2005c), �Mid Term Evaluation of Drought Prone Area Programme (9th Batch) inKhandwa district of Madhya Pradesh�.Chadha, G. K., Sucharita Sen, and H. R. Sharma (2004), �Land Resources�, 2nd Volume�State of the Indian Farmer: A Millennium Study�, Department of Agriculture andCooperation, Government of India and Academic Foundation, New Delhi.Chopra, Kanchan (1999), �Evaluation of Watershed Programmes in India: A Review� inFarrington, J; Cathryn, T., and James, A.J. (eds.), Participatory Watershed Development:Challenges for the Twenty First Century, Oxford University Press, New DelhiCohesion (2005), Draft Report on �Study on Impact of Project Intervention on the Socio-Economic Condition of Poor Beneficiaries of the Project�, Comprehensive WatershedDevelopment Project Madhya Pradesh, submitter to DANIDA advisor.CSWCRTI (2004), �Participatory Watershed Management for Sustainable Development inBajni Watershed, Datia, Madhya Pradesh, under IWDP�, Central Soil and WaterConservation Research and Training Institute.Dar, William (2003), �Maximising Impacts for Natural Resource Management Research:Overcoming Methodological Changes� in Bekele Shiferaw and Ade Freeman (eds),Methods for Assessing the Impacts of Natural Management Research, ICRISAT,HyderabadDas, Keshab (2006) �Drinking Water and Sanitation in Rural Madhya Pradesh: A Review ofPolicy Initiatives�, Draft Report, September, Gujarat Institute of Development Research,Ahmedabad
References
1 0 2
Datar, C., and A. Prakash (2001), �Engendering Community Rights: A Case for Women�sAccess to Water and Wasteland�, Indian Journal of Gender Studies, 8(2), 223-246.Deaton, 2003 Deaton, A and J. Dreze, (2002), Poverty and Inequality in India: A Re-examination� , Working Paper No. 107, Centre for Development Economics, Delhi Schoolof Economics, New Delhi.Deaton, A. (2003), �Regional Poverty Estimates for India, 1999-2000� Research Programin Development Studies, Princeton University, August 22, 2003.Deshpande, R.S. and A. Narayanmoorthy (1999), �An Appraisal of Watershed ProjectsAcross Regions�, Artha Vijnana, 41(4), pp. 315-415.Deshpande, R.S. and G. Thimmaiah (1999), �Watershed Development Approach andExperience of National Watershed Development Programme in the Country�, Journal ofRural Development, 18(3), pp. 453-469.EDSS, (2005), �Mid-term Evaluation Report, 9th Batch Hariyali D.P.A.P. Shajapur; Bhopal,M.P�.EDSS, (2005), �Mid-term Evaluation Report, 9th Batch Hariyali D.P.A.P. Shivpuri, Bhopal,M.P�.Fan, Shenggen, and Peter Hazell (2000), �Should Developing Countries Invest More inLess-Favoured Areas? An Empirical Analysis of Rural India�, Economic and PoliticalWeekly, Vol. 35 (, No. 17). , April 22, pp. 1455 - 1464Farrington, J.C., Turton, and A.J James (eds) (1999), Participatory WatershedDevelopment: Challenges for the Twenty�First Century, New Delhi, Oxford UniversityPress.FAO (1998), �Bihar Madhya Pradesh Tribal Development Programme�, Socio-economicand Production Systems Study, Food and Agricultural OrganisationGate, S. (2001), �Empowerment of Women in Watershed Management: GuraiyaPanchayat, Madhya Pradesh�, Indian Journal of Gender Studies, 8(2), pp. 247-256.GoI (2000), Warasa-Jan-Sahbhagita Guidelines for National Watershed DevelopmentProject for Rainfed Areas (NWDPRA), Department of Agriculture and Cooperation,Ministry of Agriculture, New Delhi.GoI (2006), �From Hariyali to Neeranchal: Report of the Technical Committee onWatershed Programmes in India�, Department of Land Resources, Ministry of RuralDevelopmentGoI, (1995), �Common Guidelines for Watershed Development Programmes�, Departmentof Land Resources, Ministry of Rural Development, New DelhiGoI, (2001), �Guidelines for Watershed Development (Revised)�, Department of LandResources, Ministry of Rural Development, New Delhi.GoI, (2003), Guidelines for Hariyali, Department of Land Resources, Ministry of RuralDevelopment, New Delhi.GoMP (1995a), �Madhya Pradesh Human Development Report�, Bhopal.GoMP (1995b) �Mission Document, Rajiv Gandhi Mission for Watershed Management�,Panchayat and Rural Development Department.GoMP (1998), �Madhya Pradesh Human Development Report�, Bhopal.GoMP (2003a), �Pani Roko Abhiyan�, Rajiv Gandhi Mission for Watershed Management,Panchayat and Rural Development Department.GoMP (2003b), �Status Paper, Rajiv Gandhi Mission for Watershed Management�,Panchayat and Rural Development Department.GoMP, (2000), �Madhya Pradesh Environmental Status Report�, Bhopal.Hooja, R., and R. Puskar, (2005), �Policy Interventions and Administrative Instruments forSustainable Livestock Development in Watersheds: Some Suggestions Based on theLead Study of Five Watersheds�, Indian Journal of Public Administration, 51(1), pp.70-93.

1 0 3
Jaiswal, A.K. (1999), �Capacity Building in Watershed Development Programme: AnAnatomy�, Journal of Rural Development, 18(4), pp. 597-611Joshi, P. K., V. Pangrave, B. Shiferaw, S. P. Wani, Jetske Bouma, and Christopher Scott(2004), �Watershed Development in India : Synthesis of Past Experiences and Needs forFuture Research�, Indian Journal of Agricultural Economics, 59(3), pp. : 303-320.Joy, K. J., A. Shah, S. Paranjape, S. Badiger and S. Lele (2005):, �Reorienting theWatershed Development Programme in India�, Presentation before the TechnicalCommittee on Watershed Programmes inIndia (Parthasarathy Committee) by K. J. Joy,July 25, PuneForum for Watershed Research and Policy Dialogue Occasional Paper,February Forum for Watershed Research and Policy Dialogue, PuneJoy, K.J. and Suhas Paranjape (2004), �Watershed Development Review: Issues andProspects�, Technical Report, Centre for Interdisciplinary Studies in Environment andDevelopment, BangaloreKerr, J, Pangare, V.L., and Pangare, G. (2002), �Watershed Development Projects inIndia�, an Evaluation. Research Report 127, International Food Policy Research Institute,Washington, D.C.,Kerr, J. (2002), �Watershed Development, Environmental Services and Poverty Alleviationin India�, World Development, 30 (8), pp. :1387-140Khanna, A. and C. Khanna (2006), �Water and Sanitation Programmes in Rural Areas ofMadhya Pradesh�, WaterAid India, New DelhiPuskar, R., J. Bouma, and C. Scott (2004), �Sustainable Livestock Production in Semi-AridWatersheds�, Economic and Political Weekly, 39 (31), July 31, pp. 3477-3483.Radhakrishna, R and S. Ray, (2005), �Handbook of Poverty in India: Perspectives, Policiesand Programmes�, Oxford University Press, New Delhi.Rajput, A.M., and A.R. Verma (1997), �Impact of Integrated Watershed DevelopmentProgramme in Indore District of Madhya Pradesh�, Indian Journal of AgriculturalEconomics, 52(3), pp. 537-539.Rao, C.H.H. (2000), �`Watershed Development in India: Recent Experience and EmergingIssues�, Economic and Political Weekly, Vvol. 35 (45), No. 32, pp. 3943 - 47.Ravindra, A (2004), �Compilation and Assessment of Impact Monitoring Indicators andSystems of Comprehensive Watershed Development Project, Madhya Pradesh, FinalReport�, Submitted to RGMWM, Bhopal.Reddy, V. Ratna, and John Soussan (2003), �Assessing the Impact of ParticipatoryWatershed Development: A Sustainable Rural Livelihoods Approach�, in B. Shiferaw andH. A. Freeman (eds), Methods for Assessing the Impacts of Natural ResourceManagement Research, Summary of the Proceedings of the ICRISAT-NCAP/ICARInternational Workshop, ICRISAT, PatancheruShah, Amita (1998a), �`Watershed Development Programmes in India: Emerging Issues forEnvironment Development Perspective�, Economic and Political Weekly, Vol. 32, No. (26), pp. A66-80.Shah, Amita (1998b), �Impact of Watershed Programmes in Dryland Regions: Evidencesand Policy Imperatives�, paper presented at the National Workshop on WatershedApproaches for Wasteland Development: Challenges for 21st Century, Ministry of RuralAreas and Employment, New Delhi, April 28-30.Shah, Amita (2004), �Rapporteur�s Report on Watershed Development�, Indian Journal ofAgricultural Economics, 59(3), pp. 664-670Shah, Amita (2005), �Poverty and Natural Resources: Understanding the Dynamics inContext of Dry Land Regions in Western India�, Working Paper No. 25, Chronic PovertyResearch Centre and Indian Institute of Public Administration, New DelhiShah, Amita and D. C. Sah (2004), �Chronic Poverty in a Remote Rural District in SouthWest Madhya Pradesh: A Multidimensional Analysis of its Extent and Causes�, WorkingPaper No. 5, Chronic Poverty Research Centre and Indianand Indian Institute of PublicAdministration, New Delhi

1 0 4
Shah, Mihir, D. Banerji, P.S. Vijayshankar and P. Ambastaet al; (1998), Ch2, p8 �iIndia�sdDrylands: Tribal Societies and Development through Environmental Regeneration�,Oxford University Press, New DelhiShankar, P. S. Vijay (2005), �Four Decades of Agricultural Development in MP: An Agro-Ecological Sub-Region Approach� Economic and Political Weekly, Vol. 40, No. 48, Nov.26, pp. 5014-5024Shiferaw, Bekele, and Freeman Ade (2003), �Methods for Assessing the Impacts ofNatural Management Research�, ICRISAT, Hyderabad.Taru Leading Edge (2001), �Executive Summary of Evaluation of RGMWM Watersheds inMadhya Pradesh, Final Report�, prepared for the United Nations Children�s EmergencyFund (UNICEF), in association with SANKET, Bhopal.TERI (2001), �Compendium of Impact Evaluation Studies of the National WatershedDevelopment Project for Rainfed Areas�, The Energy and Research Institute, Submitted toRainfed Farming System Division, Department of Agriculture and Cooperation, Ministry ofAgriculture, Government of India.TERI (2004), �Impact Assessment Study of Watershed Development Programme, ACompendium�, Submitted to Department of Land Resources, Ministry of RuralDevelopment, Government of India.Tiwari, S and J. Amegaza, (2005), Watershed Management in Madhya Pradesh:Examining Research-Policy Interactions, DFID.WALMI (2003), �Mid Term Evaluation of Milli Watershed Project Area Programme (6th
Batch), Rajgarh District, Madhya Pradesh�, submitted to RGMWM.
1 0 5
A note on Methodology of Prioritisation of Watershed Activities in Block Levelused for Jhabua District
Using available information from the Census and District StatisticalHandbook, Jhabua, we have derived three broad criteria, i.e. deprivations interms of land-access, resource base and socio-economic development. Thefollowing variables have been used for obtaining the above criteria.A. Land-access deprivation:
a. Ratio of rural population to agricultural landb. Percentage of small and marginal farmers to total farmers
B. Resource Deprivation:a. Reciprocal of average annual rainfallb. Reciprocal of percentage of net area irrigatedc. Percentage of underutilised agricultural land (culturable waste and
fallows as a percentage to total cultivable land).C. Socio-economic Deprivation
a. Reciprocal of female literacy rateb. Reciprocal of cropping intensityc. Percentage of non-workers to total population.
(We have not used the criteria of percentage of tribal population usedcommonly in Jhabua as there is very little variation at the block level of thisindicator).First we have aggregated the respective variables to arrive at the threeabove-mentioned criteria and further aggregated these three indicators toarrive at the overall index of deprivation.A simple methodology has been used for aggregation due to the smallnumbers of observations. To make the indicators scale-free, ratio of theindividual variables with respect to the district average has been worked out.To combine, we have simply averaged these ratios in the manner specifiedabove.The index derived is directly related to deprivation, i.e., higher the index, thehigher should be the watershed coverage (i.e. share of watershed area inproportion to the geographical area).
Appendix 1

1 0 6
Blocks
DDPPAAPP11 (95-
96/96-97/97-98)
EEAASS (95-
96/96-97/97-
98)
IIWWDDPP ((95-
96/96-97)
DDPPAAPP55 (1999-
00) DDPPAPAP66 (2000-
01) DDPPAPAP77 (2001-
02) DDPPAAPP8 8 (2002-
03)
HHaarriiyyaalli i 11
(2003-04)
HHaarriiyyaalli i 22
(2004-05)
Petlawad 9471 525 0 2775 1600 1325 1700 1300 1500 Thandla 4522 6727 0 7586 850 1625 1675 1500
Meghnagar 5937 11917 2051 2450 950 1200 1600 1500 Jhabua 1508 8197 4478 0 1315 2700 1550 1500
Ranapur 1068 3381 0 7930 1020 1175 1225 1500 Rama 3238 10950 0 3850 965 1150 1600 1500
Udaigarh 5149 8900 0 1663 1900 850 1475 1300 1500 Jobat 5446 3626 0 746 825 1450 1475 1650
Bhabhra 2039 16225 0 0 825 1425 1575 1000 Kaththivada 1868 7361 0 0 1125 1350 1300 1850
Alirajpur 2131 4335 0 0 1000 1450 1900 1500 Sondwa 3053 8092 0 0 950 1300 1500 1500 Total 4455442299 9900223366 66553300 2277000000 33550000 1122000000 1188000000 1188000000 1188000000
Average per block 3786 7520 544 2250 292 1000 1500 1500 1500
C.V. 64 57 252 128 235 17 28 13 13
Appendix Tables
A.1 Area Sanctioned under RGWM Projects over Time across Blocks (area in hectare)
DDiissttrriiccttss OOvveerraallll DDepeprriivvaa--
ttiionon DDiissttrriiccttss Land Land
AAcccceess ss depdeprriivvaattiionon
DDiissttrriiccttss RRee--ssouourrcce e depdeprriivv--aattiionon
DDiissttrriiccttss SSoocciioo--eecconoonommiicc
depdeprriivvaattiionon
Sondwa 1.22 Meghnagar 1.30 Sondwa 1.53 Sondwa 1.15 Katthiwara 1.15 Thandla 1.10 Kathhiwara 1.31 Kathhiwara 1.14 Meghnagar 1.12 Jhabua 1.04 Meghnagar 1.11 Alirajpur 1.13 Jhabua 1.08 Bhavra 1.03 Thandla 1.10 Jhabua 1.09 Thandla 1.07 Kathhiwara 1.01 Jhabua 1.10 Rama 1.08 Rama 1.03 Rama 0.98 Ranapur 1.08 Thandla 1.01 Ranapur 0.99 Ranapur 0.98 Udaigarh 1.03 Jobat 0.98 Bhavra 0.96 Sondwa 0.97 Rama 1.02 Udaigarh 0.97 Alirajpur 0.96 Petlawad 0.93 Alirajpur 0.99 Meghnagar 0.95 Udaigarh 0.94 Jobat 0.85 Bhavra 0.96 Bhavra 0.90 Jobat 0.91 Udaigarh 0.82 Jobat 0.91 Ranapur 0.90 Petlawad 0.87 Alirajpur 0.75 Petlawad 0.80 Petlawad 0.87
Table A.II: Indices of Deprivations across Blocks in Jhabua
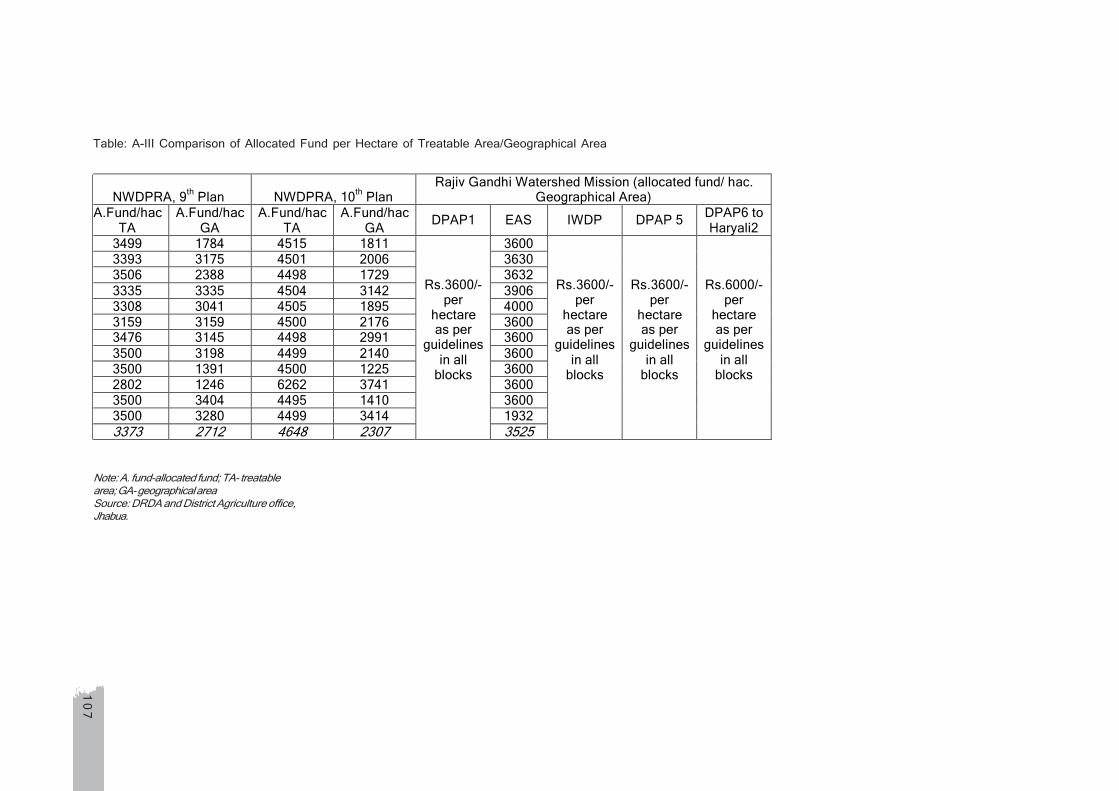
107
NWDPRA, 9th Plan NWDPRA, 10th Plan Rajiv Gandhi Watershed Mission (allocated fund/ hac.
Geographical Area) A.Fund/hac
TA A.Fund/hac
GA A.Fund/hac
TA A.Fund/hac
GA DPAP1 EAS IWDP DPAP 5 DPAP6 to Haryali2
3499 1784 4515 1811 3600 3393 3175 4501 2006 3630 3506 2388 4498 1729 3632 3335 3335 4504 3142 3906 3308 3041 4505 1895 4000 3159 3159 4500 2176 3600 3476 3145 4498 2991 3600 3500 3198 4499 2140 3600 3500 1391 4500 1225 3600 2802 1246 6262 3741 3600 3500 3404 4495 1410 3600 3500 3280 4499 3414 1932 3373 2712 4648 2307
Rs.3600/- per
hectare as per
guidelines in all
blocks
3525
Rs.3600/- per
hectare as per
guidelines in all
blocks
Rs.3600/- per
hectare as per
guidelines in all
blocks
Rs.6000/- per
hectare as per
guidelines in all
blocks
Table: A-III Comparison of Allocated Fund per Hectare of Treatable Area/Geographical Area
Note: A. fund-allocated fund; TA- treatablearea; GA- geographical areaSource: DRDA and District Agriculture office,Jhabua.

1 0 8
SSl l NNoo BBlloocckk PPrroojjeecct t IImmpplleemmeennttiinng g AAggeenncciieess
NNuummbbeer r oof f MMiiccrro o
WWaatteerrsshehedd SSaanncc. . AAmmoouunntt SSaannccttiioonned ed
aarreaea (Rs. Lakh) (hectare)
1 Petlawad NGO (BAIF, Petlawad) 10 203.5 5700 Petlawad
NGO (Vasudha Vikas Samiti, Bamania) 1 10.2 500.00
Petlwad GO, (Petlawad) 5 60.17 2500 2 Thandla NGO(Sadguru WS D, Dahod) 3 102.92 2650.00
Thandla NGO (CARD, Bhopal) 3 34.43 1625.00 Thandla GO (Petlawad and Thandla) 17 225.35 6492.02
3 Meghnagar NGO (Sahara) 1 11.32 600.00 Meghnagar NGO(NCHSE) 1 34.91 950.00 Meghnagar GO(Petlawad and Meghnagar) 11 202.37 4678.70
4 Jhabua NGO(HSRDI, Jhabua) 1 13.96 588.00 Jhabua GO (3 in Jhabua) 8 192.01 4977.00
5 Rama NGO (NCHSE, Jhabua) 12 228.06 5965.00 GO ( Rama) 3 66.80 1600.00
6 Ranapur NGO (ASA, Jobat) 6 96.32 3230.22 Ranapur NGO (GVT, Jhabua) 10 179.81 4700.00 Ranapur NGO (Prayas, Bhabhra) 3 34.57 1175.00 Ranapur GO (Jhabua and Ranapur) 5 74.63 2245.00
7 Udaigarh NGO (ASA, Jobat) 4 49.90 1663.32 Udaigarh NGO(HSRDI, Jhabua) 3 34.39 1475.00 Udaigarh GO (Jobat, Udaigarh, Bhabhra) 9 130.44 4050.00
8 Jobat NGO (ASA, Jobat) 2 22.35 745.68 Jobat GO (Jobat) 8 120.41 3750.00
9 Sondwa GO (Sondwa) 8 112.65 3750.00 10 Bhabhra GO (Bhabhra) 8 759.15 23554.00 11 Alirajpur
NGO (Gramin Vikas Shodh Sansthan, Indore) 1 10.67 500.00
Alirajpur GO (2-Alirajpur) 1 128.70 3850.00 12 Katthiwara
NGO (Kalyani Samudayik Sansthan, Indore) 1 12.02 525.00
GO (Udaigarh and Kaththiwara) 7 34.37 1270.68
Table A-IV:Government and Non Government Organisations Participating in DPAP (II/5-9) in Jhabua District
Source: District level PIA meeting held on October 17, 2005

1 0 9