watford economic delivery assessment · 2015-04-14 · emerging supply of employment space ......
TRANSCRIPT

Watford Economic Growth & Delivery Assessment
Watford Borough Council Final Report November 2014


Watford Economic Growth & Delivery Assessment Final Report Watford Borough Council
November 2014
14036/MS/CGJ/LE
Nathaniel Lichfield & Partners 14 Regent's Wharf All Saints Street London N1 9RL nlpplanning.com

This document is formatted for double sided printing. © Nathaniel Lichfield & Partners Ltd 2014. Trading as Nathaniel Lichfield & Partners. All Rights Reserved. Registered Office: 14 Regent's Wharf All Saints Street London N1 9RL All plans within this document produced by NLP are based upon Ordnance Survey mapping with the permission of Her Majesty’s Stationery Office. © Crown Copyright reserved. Licence number AL50684A

Watford Economic Growth & Delivery Assessment : Final Report
7179769v9
Executive Summary
This Economic Growth and Delivery Assessment (EGDA) has been prepared by Nathaniel Lichfield & Partners (NLP) on behalf of Watford Borough Council. It is intended to provide an evidence base to inform the preparation of a new Economic Development Strategy for the Borough and to inform and shape the Council’s Local Plan Part 2 (and any future Local Plan review).
The study provides an up to date understanding of the existing economic situation in Watford and explores the Borough’s employment growth potential in order to compare this with employment numbers as defined in the Council’s adopted Core Strategy. It considers the current and future balance of demand and supply for employment land in the Borough, and potential policy approaches in relation to employment space for future Local Plan work and the Economic Development Strategy. The EGDA also presents a range of economic impacts that are anticipated to be generated by committed infrastructure and regeneration schemes in the Borough.
The key findings of the study are as follows:
1 Watford has a relatively successful economy reflecting its role as a major sub-regional centre. Nevertheless, recent economic performance has been uneven, with the Borough recording average employment growth, strong working-age population growth, relatively high levels of business start-up and self-employment but below average productivity levels which may in part reflect a mismatch within the local economy between lower skilled jobs available, and a more highly qualified resident workforce, many of whom commute out of the Borough to higher paid employment.
2 The Borough is identified by the Local Enterprise Partnership (LEP) as a key location for growth in Hertfordshire with the construction of the Croxley Rail Link (CRL) providing a key catalyst to enable a series of Major Development Projects to come forward and deliver step-change development within Watford over the plan period. These Major Development Projects have the potential to deliver just under 14,300 jobs in the Borough across a range of commercial, retail, healthcare, education and hospitality sectors.
3 Watford’s employment space is dominated by industrial uses although commercial office stock is also relatively significant at just over 200,000sq.m. Both office and industrial space has gradually been eroded in recent years, driven by significant losses of B class space and increasing pressure from other, higher value uses.
4 The Borough represents a key driver of Hertfordshire’s commercial property market with a critical mass of occupiers ranging from civil engineering to retail, large employers through to a thriving SME community. Watford’s industrial market has been relatively resilient to the recession and demand for industrial premises is now generally strong. By contrast, the Borough’s office market has experienced a more turbulent time in the last few years following the dotcom crash and recent
Watford Economic Growth & Delivery Assessment : Final Report
7179769v9
recession. Nevertheless, the office market has picked up in recent years as occupier demand and take-up of space has risen.
5 An assessment of the Borough’s employment sites undertaken as part of this study indicates that Watford contains a reasonable range of employment sites of differing quality and type. The majority of sites accommodated a combination of both office (B1a/b) and industrial (B1c/B2/B8) uses, although some specific, single use sites were also evident. The overall quality of existing employment sites appeared adequate to meet future needs with all but two sites assessed as being of at least average quality.
6 Four different scenarios of future employment space requirements have been considered for the period up to 2031, based on a number of approaches which reflect economic growth, past development trends and potential labour supply factors. The majority of these indicate higher levels of future economic growth in Watford than the Borough has achieved in the recent past. The overall gross space requirements related to these different scenarios range from -74,275sq.m to 299,750sq.m of all types of B-class employment space to 2031, implying in broad terms a need for between -16.4ha and 36.6ha of employment land. The majority of this requirement relates to office (B1a/b) uses. The lowest (negative) requirement based on past take-up rates continuing provides a less robust basis for understanding objectively assessed needs arising from economic growth as past take-up rates are likely to have been unduly constrained by past losses of space and supply-side factors. This approach would therefore fail to meet the NPPF requirement to plan positively for growth.
7 When compared with employment space in the development pipeline, Watford would appear to have insufficient employment floorspace in quantitative terms to meet future needs up to 2031 under the majority of scenarios of future growth. The starting point for planning policy therefore is that, to varying degrees, additional space will need to be identified if business needs are to be met within Watford over the plan period.
8 The Borough’s employment potential remains constrained by a number of factors. There is an acute shortage of available employment land and market feedback indicates that it requires more industrial space to accommodate indigenous growth and enable the necessary churn and upgrading or intensification of existing sites.
9 There has been a lack of delivery of high quality office space in Watford in recent years (including before the recession) which has led to a perception that the Borough is underperforming in commercial property market terms. Market feedback suggests that the Borough could sustain significantly more office development activity. Therefore, one of the key challenges the Council must seek to manage is how to ensure delivery of new space, particularly in central Watford, but also structuring supply in other parts of the Borough to respond to market opportunities. Funding issues are anticipated to undermine the viability of bringing forward new

Watford Economic Growth & Delivery Assessment : Final Report
7179769v9
office development in Watford over the short term although it is possible that in the foreseeable future tight supply will push values to the level where this can occur.
10 Within the context of accommodating a positive floorspace requirement for both office and industrial uses over the plan period, a number of options emerge for consideration by the Council as summarised below: i adopting a stricter approach to determining planning proposals
seeking change of use and/or loss of employment floorspace;
ii increasing the B Class floorspace capacity currently assumed to be delivered across the Borough’s Major Development Projects;
iii encouraging the upgrading and refurbishment of existing employment areas so that they can be used more efficiently;
iv considering allocating additional sites for office and industrial development to increase the current choice of sites and enable Watford to capture key economic opportunities such as expansion of firms both from within and outside of the Borough; and
v A final option is to not specifically identify additional capacity for employment space, and by implication, assume that these needs are met on non-allocated sites or are displaced to adjoining local authority areas that fall within the Borough’s functional economic market area.
11 The Borough’s Local Plan Part 1 identifies a target to provide at least 7,000 additional jobs in the Borough between 2006 and 2031 based on EEFM employment forecast data published in 2009/2010. The latest EEFM baseline projections (obtained from the EEFM Spring 2013 release) imply a scale of job growth in Watford for the plan period that is nearly twice as high as the Core Strategy figure, underlining the difficulty in comparing datasets over time. Nevertheless, both sets of employment projections point to a similar level of workforce jobs in Watford in 2031 (at around 66,000) and a general alignment in workforce jobs by around 2020. It is therefore recommended that the Council adopt the EEFM (excluding employment activities) as a consistent dataset against which to monitor progress against its job target over the Local Plan period, recognising that fluctuations will occur in overall recorded employment within the Borough as and when new datasets are released

Watford Economic Growth & Delivery Assessment : Final Report
7179769v9
Contents
1.0 Introduction 1 Background ........................................................................................................ 1 Scope of the Study ............................................................................................ 1 Structure of the Report ...................................................................................... 2
2.0 Economic Context 3 Spatial Overview ................................................................................................ 3 Economic Conditions and Trends ...................................................................... 5 Conclusions ..................................................................................................... 16
3.0 Commercial Property Market Signals and Intelligence 18 Overview of Employment Space ...................................................................... 18 Development Rates ......................................................................................... 21 Emerging Supply of Employment Space ......................................................... 23 Market Intelligence ........................................................................................... 24 Market Segments ............................................................................................. 25 Conclusions ..................................................................................................... 31
4.0 Review of Employment Sites Portfolio 33 Overview .......................................................................................................... 33 Special Policy Areas ........................................................................................ 34 Allocated sites .................................................................................................. 37 Non allocated sites .......................................................................................... 43 Conclusions ..................................................................................................... 47
5.0 Impact of Major Development Projects 48 Ascot Road ...................................................................................................... 49 Town Centre Enhancements ........................................................................... 50 Watford Business Park .................................................................................... 52 Watford Health Campus .................................................................................. 54 Watford Junction .............................................................................................. 56 Summary ......................................................................................................... 58
6.0 Future Requirements for Employment Space 60 Methodology .................................................................................................... 60 A. Forecasts of Job Growth ............................................................................. 60 B. Past Development Rates ............................................................................. 65 C. Future Labour Supply .................................................................................. 66 Net Employment Space Requirements ............................................................ 69 Gross Employment Space Requirements ........................................................ 71 Sensitivity Tests ............................................................................................... 74 Conclusions ..................................................................................................... 78

Watford Economic Growth & Delivery Assessment : Final Report
7179769v9
7.0 Demand/Supply Balance 80 Quantitative Balance ....................................................................................... 80 Qualitative Factors........................................................................................... 83 Conclusions ..................................................................................................... 84
8.0 Conclusions and Policy Implications 86 Overview of Watford ........................................................................................ 86 Progress against Local Plan Job Target .......................................................... 87 Functional Economic Market Area ................................................................... 88 Policy Implications ........................................................................................... 90 Office Uses ...................................................................................................... 92 Industrial Uses ................................................................................................. 95 Accommodating a Positive Requirement......................................................... 96 Other Policy Issues........................................................................................ 101
Watford Economic Growth & Delivery Assessment : Final Report
7179769v9
Figures
Figure 2.1 Spatial Context of Watford Borough .................................................................. 3 Figure 2.2 Route Map for Croxley Rail Link ........................................................................ 4 Figure 2.3 Changes in Total Workforce Jobs and B Class Jobs in Watford, 1991 - 2014 .. 5 Figure 2.4 Workforce Jobs by Sector in Watford, 2014 ...................................................... 6 Figure 2.5 Change in Working Age Population and Total Workforce Jobs for each
Borough in the London Arc West, 1996 - 2013 ................................................. 7 Figure 2.6 Spatial Distribution of Employment by Sector in Watford .................................. 9 Figure 2.7 Changes in JSA Claimant Rates in Watford, 2006 - 2014 ............................... 11 Figure 2.8 Travel-to-Work Flows for Watford, 2011 .......................................................... 13 Figure 2.9 Out-Commuting Flows from Watford for Higher Skilled Workers, 2001 .......... 15 Figure 2.10 In-Commuting Flows into Watford for Higher Skilled Workers, 2001 .............. 15 Figure 2.11 Travel-to-Work Flows for Watford by Occupation Type, 2001 ......................... 16 Figure 3.1 Change in Business Floorspace in Watford, 2000 - 2012 ............................... 18 Figure 3.2 Components of Employment Floorspace by Local Authority, 2008 ................. 19 Figure 3.3 Spatial Distribution of Employment Floorspace in Watford ............................. 20 Figure 3.4 Gross Development Rates in Watford 2004-2013 ........................................... 21 Figure 3.5 Net Development Rates in Watford 2004-2013 ............................................... 22 Figure 3.6 Office Take-up in the Greater Watford Area since 2006 ................................. 28 Figure 4.1 Map of Employment Sites Assessed ............................................................... 33 Figure 5.1 Location of Major Development Projects in Watford ....................................... 48 Figure 6.1 Annual Job Growth Implied by the EEFM Baseline ......................................... 63 Figure 6.2 Gross Floorspace Requirements by Scenario (sq.m) ...................................... 72 Figure 6.3 Gross Land Requirement by Scenario (ha) ..................................................... 73 Figure 6.4 Annual Job Growth Implied by Scenarios ........................................................ 74 Figure 7.1 Forecast surplus of office and industrial space to 2031 by scenario ............... 83 Figure 8.1 Local Plan Job Growth Target Compared with 2013 EEFM Employment
Forecasts ......................................................................................................... 87 Figure 8.2 Change in Working Age Population and Total Workforce Jobs for each
Borough in the London Arc West, 2014-2031 ................................................. 89
Watford Economic Growth & Delivery Assessment : Final Report
7179769v9
Tables
Table 2.1 Average GVA per Worker for each Borough in the London Arc West, 2014 ..... 7 Table 2.2 Proportion of B Class Jobs and Total Jobs in Watford Supported at the EMP1
Sites ................................................................................................................... 8 Table 2.3 Share of Knowledge-Based Firms for each Borough in the London Arc West,
2007 ................................................................................................................. 10 Table 2.4 Changes in Travel-to-Work Flows in Watford, 2001 - 2011 ............................. 13 Table 3.1 Location of Employment Floorspace in Watford .............................................. 20 Table 3.2 Emerging Employment Land Supply in Watford .............................................. 23 Table 3.3 Typical Industrial Asking Rents in Watford ...................................................... 27 Table 3.4 Industrial Rents in Watford and Comparator locations .................................... 27 Table 3.5 Typical Office Asking Rents in Watford ........................................................... 31 Table 3.6 Office Rents in Watford and Comparator locations ......................................... 31 Table 4.1 Summary Site Assessment Matrix ................................................................... 47 Table 5.1 Summary of the Gross Development Impacts for Ascot Road ........................ 49 Table 5.2 Summary of the Net Additional Development Impacts for Ascot Road ........... 50 Table 5.3 Summary of the Gross Development Impacts for the Town Centre
Enhancements ................................................................................................. 51 Table 5.4 Summary of the Net Additional Development Impacts for the Town Centre
Enhancements ................................................................................................. 52 Table 5.5 Summary of the Gross Development Impacts for Watford Business Park ...... 53 Table 5.6 Summary of the Net Additional Development Impacts for Watford Business
Park ................................................................................................................. 54 Table 5.7 Summary of the Gross Development Impacts for Watford Health Campus .... 55 Table 5.8 Summary of the Net Additional Development Impacts for Watford Health
Campus ........................................................................................................... 56 Table 5.9 Summary of the Gross Development Impacts for Watford Junction ................ 57 Table 5.10 Summary of the Net Additional Development Impacts for Watford Junction ... 58 Table 5.11 Summary of the Net Additional Development Impacts for each Major
Development Project ....................................................................................... 59 Table 6.1 Fastest Growing and Declining Employment Sectors in Watford, 2006 - 2031 62 Table 6.2 Forecasted Employment Change in Watford, 2006 - 2031 .............................. 63 Table 6.3 EEFM Job Growth Based Net Employment Space Requirements in Watford,
2006 - 2031 ...................................................................................................... 65 Table 6.4 Annual Completion Rates of Employment Space in Watford, 2004 - 2013 ..... 65 Table 6.5 Employment Space Requirements Based on Past Completion Trends
Continuing, 2006 - 2031 .................................................................................. 66 Table 6.6 Forecast Labour Supply and Job Requirements for Watford, 2006 – 2031
(Local Plan Dwelling Target) ............................................................................ 67 Table 6.7 B Class Employment Floorspace Required from Labour Supply Growth (Local
Plan Dwelling Target) ...................................................................................... 68 Table 6.8 Forecast Labour Supply and Job Requirements for Watford, 2006 – 2031
(2012 Based SNPP) ........................................................................................ 69
Watford Economic Growth & Delivery Assessment : Final Report
7179769v9
Table 6.9 B Class Employment Floorspace Required from Labour Supply Growth (2012 Based SNPP) .................................................................................................. 69
Table 6.10 Net Floorspace Requirements in Watford by Scenario to 2031 (sq.m) ........... 70 Table 6.11 Safety Margin Allowances ............................................................................... 70 Table 6.12 Gross Floorspace Requirements in Watford by Scenario to 2031 (sq.m) ....... 72 Table 6.13 Gross Land Requirement by Scenario to 2031 (ha) ........................................ 73 Table 6.14 EEFM Baseline Job Growth Scenario (including 25% of Employment Activities
Sector) ............................................................................................................. 75 Table 6.15 Employment Impacts of Major Development Projects over and above EEFM
Baseline ........................................................................................................... 76 Table 7.1 Emerging Employment Land Supply in Watford .............................................. 81 Table 7.2 Demand/Supply of B Class Employment Space in Watford (to 2031) ............. 82 Table 7.3 Demand/Supply for office and industrial space to 2031 (sq.m) ....................... 83

Watford Economic Growth & Delivery Assessment : Final Report
7179769v9
Appendices
Appendix 1 Consultees/Workshop Attendees Appendix 2 Employment Data Issues Appendix 3 Site Plans Appendix 4 Site Assessment Criteria Appendix 5 Site Assessments Appendix 6 Definition of B Class Sectors Appendix 7 EEFM Baseline Forecasts
Watford Economic Growth & Delivery Assessment : Final Report
7179769v9 P1
1.0 Introduction
1.1 Watford Borough Council (‘the Council’) commissioned Nathaniel Lichfield & Partners (‘NLP’) to prepare an Economic Growth and Delivery Assessment (‘EGDA’) for the Borough.
1.2 The purpose of the EGDA is to provide an evidence base both to inform the preparation of a new Economic Development Strategy for the Borough and to inform and shape the Council’s Local Plan Part 2 (and any future Local Plan review) by assessing economic development needs objectively in line with the National Planning Policy Framework (NPPF) and Planning Practice Guidance (PPG). Key requirements of the brief include:
a take stock of the existing situation and provide an economic baseline for the Borough;
b prepare an economic impact analysis of committed infrastructure and regeneration schemes;
c review the existing evidence base and economic projections with particular regard to employment numbers as defined in the Council’s adopted Core Strategy;
d undertake an updated commercial property market review and compare the expected future demand for land/floorspace, by type, against available and planned supply; and
e identify key development options and provide recommendations for future Local Plan work and Economic Development Strategy.
Background
1.3 The Council has commissioned the EGDA in the context of major ongoing physical investments in the Borough, significant progress in recent years on delivery targets as defined in the 2013 Watford Local Plan Core Strategy – Part 1, and with the requirement to create a robust evidence base to inform future funding applications and potential funding mechanisms for the ‘next wave’ of physical development and regeneration projects within the Borough.
1.4 The study updates the employment evidence used to support the adopted Local Plan Core Strategy – Part 1 and uses a range of established economic forecasting methods which have now been refreshed or updated in light of changing regional governance arrangements as well as improving national economic prospects following the recent period of recession.
Scope of the Study
1.5 The focus of this report is on the employment space needs for the group of B-class sectors outlined below:

Watford Economic Growth & Delivery Assessment : Final Report
P2 7179769v9
B1 Business (including B1a offices, B1b research and development and B1c light industry);
B2 General Industrial (typically comprising factory and production space); and
B8 Storage or Distribution (including wholesale warehouses and distribution centres).
1.6 Demand for B-class employment land and floorspace represents the particular focus of this study. This reflects the approach of the NPPF which states that significant weight should be placed on supporting growth and planning proactively to meet the development needs of businesses. The study also considers future projections for growth in non B-class sectors although does not specifically assess the space implications of these other sectors because they are planned for using different methodologies and are/will be considered within other evidence base documents.
1.7 An important consideration for any work of this type is that it is inevitably a point-in-time assessment. The study has incorporated the latest data and other evidence available at the time of preparation. The accuracy of data derived from third party sources has not been checked or verified by NLP. In line with market conventions, values (i.e. rents) for commercial space are expressed in £ per ft2 although metric units of measurements (i.e. m2) have generally been used elsewhere in the report.
Structure of the Report
1.8 The report is structured as follows:
Section 2.0 provides a review of current economic conditions and recent trends in the Borough and its economic strengths and weaknesses that may affect future needs for employment space;
Section 3.0 reviews the Borough’s commercial property market and key market signals;
Section 4.0 provides an appraisal of the Borough’s portfolio of employment sites;
Section 5.0 assesses the potential economic impacts arising from the Borough’s proposed major development projects;
Section 6.0 assesses the employment space requirements arising from a range of scenarios of future economic growth to 2031;
Section 7.0 considers the overall demand/supply balance of employment land in the Borough to meet future needs; and
Overall conclusions and policy implications are set out in Section 8.0.
1.9 Details of assumptions and other supporting information are set out in the appendices, including a list of study consultees (Appendix 1). Draft findings from the study were presented to a workshop of local commercial property agents held in July 2014.
Watford Economic Growth & Delivery Assessment : Final Report
7179769v9 P3
2.0 Economic Context
2.1 This section establishes the economic and labour market context for the study by summarising recent economic conditions and trends within Watford, relative to Hertfordshire, the East of England region and the national economy. This is important for identifying the existing strengths and weaknesses of the local economy, and the factors likely to influence the nature and level of future demand for employment space.
Spatial Overview
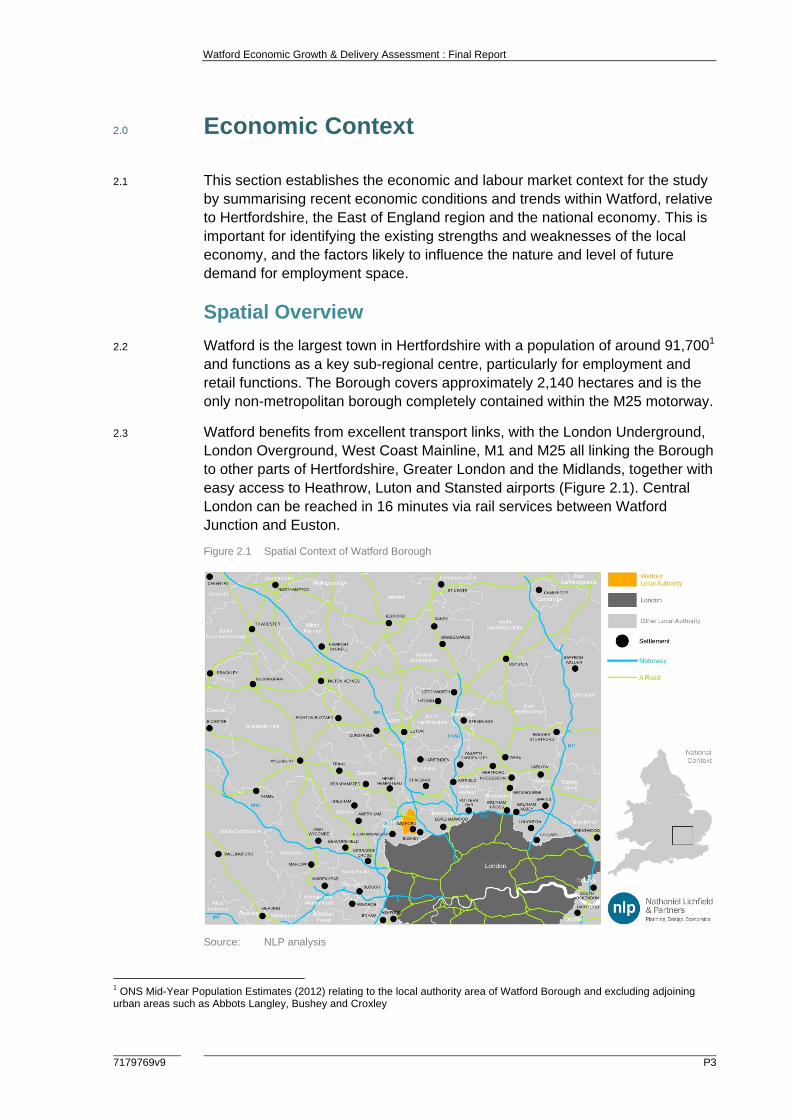
2.2 Watford is the largest town in Hertfordshire with a population of around 91,7001 and functions as a key sub-regional centre, particularly for employment and retail functions. The Borough covers approximately 2,140 hectares and is the only non-metropolitan borough completely contained within the M25 motorway.
2.3 Watford benefits from excellent transport links, with the London Underground, London Overground, West Coast Mainline, M1 and M25 all linking the Borough to other parts of Hertfordshire, Greater London and the Midlands, together with easy access to Heathrow, Luton and Stansted airports (Figure 2.1). Central London can be reached in 16 minutes via rail services between Watford Junction and Euston.
Figure 2.1 Spatial Context of Watford Borough
Source: NLP analysis
1 ONS Mid-Year Population Estimates (2012) relating to the local authority area of Watford Borough and excluding adjoining urban areas such as Abbots Langley, Bushey and Croxley
Watford Economic Growth & Delivery Assessment : Final Report
P4 7179769v9
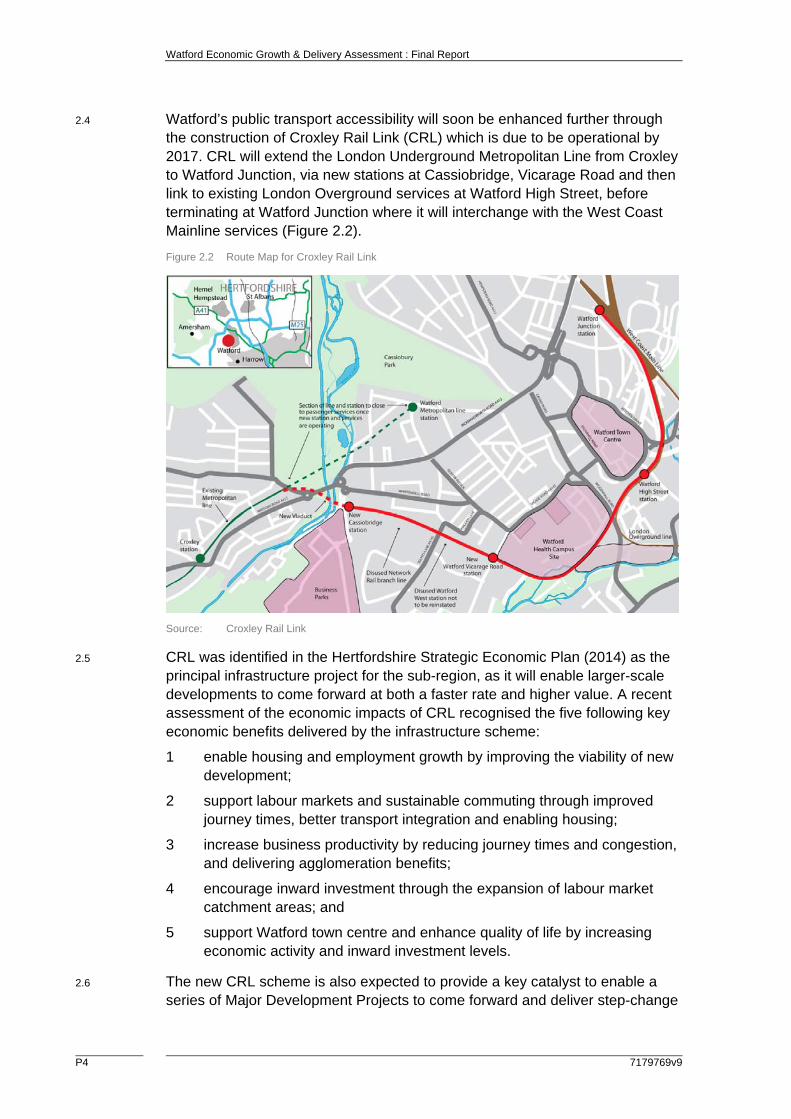
2.4 Watford’s public transport accessibility will soon be enhanced further through the construction of Croxley Rail Link (CRL) which is due to be operational by 2017. CRL will extend the London Underground Metropolitan Line from Croxley to Watford Junction, via new stations at Cassiobridge, Vicarage Road and then link to existing London Overground services at Watford High Street, before terminating at Watford Junction where it will interchange with the West Coast Mainline services (Figure 2.2).
Figure 2.2 Route Map for Croxley Rail Link
Source: Croxley Rail Link
2.5 CRL was identified in the Hertfordshire Strategic Economic Plan (2014) as the principal infrastructure project for the sub-region, as it will enable larger-scale developments to come forward at both a faster rate and higher value. A recent assessment of the economic impacts of CRL recognised the five following key economic benefits delivered by the infrastructure scheme:
1 enable housing and employment growth by improving the viability of new development;
2 support labour markets and sustainable commuting through improved journey times, better transport integration and enabling housing;
3 increase business productivity by reducing journey times and congestion, and delivering agglomeration benefits;
4 encourage inward investment through the expansion of labour market catchment areas; and
5 support Watford town centre and enhance quality of life by increasing economic activity and inward investment levels.
2.6 The new CRL scheme is also expected to provide a key catalyst to enable a series of Major Development Projects to come forward and deliver step-change
Watford Economic Growth & Delivery Assessment : Final Report
7179769v9 P5
development within Watford over the plan period. These are considered in more detail in Section 5.0.
Economic Conditions and Trends
2.7 The latest East of England Forecasting Model (EEFM) released in Spring 2013 can be used to understand the historic and forecasted level of job growth in Watford during the period 1991 to 2031. However the published dataset for the local authority does note an anomaly in the ‘employment activities’ sector that significantly impacts on the number of jobs recorded in the economy. For this reason, the employment activities sector has been excluded from analysis of the employment levels in Watford (i.e. for both historic data and forecasting purposes). Further information relating to the discrepancy in the employment activities sector within the latest EEFM for Watford is presented in Appendix 2.
Employment
2.8 Watford recorded 56,800 workforce jobs in 2014, representing an increase of 16.1% from its 1991 level. This growth in workforce jobs was higher than in the UK (14.6%), but was outpaced by employment growth in Hertfordshire (24.3%) and the East (19.6%) during this period.
2.9 Between 2001 and 2005, Watford experienced a loss of 9,250 jobs, with large sector losses recorded in health (2,3702), telecoms (2,130) and finance (1,450). While the Borough has seen continual employment growth since this period of job losses, the level of employment still remains below that attained during the early 2000s when workforce jobs peaked at 61,370 (Figure 2.3).
Figure 2.3 Changes in Total Workforce Jobs and B Class Jobs in Watford, 1991 - 2014
Source: EEFM Spring 2013 / NLP analysis
2 The 2013 EEFM records relatively significant declines in healthcare employment in Watford over these five years, with healthcare employment standing at 6,460 in 2001, 5,660 in 2003 and 4,090 in 2005
0
10,000
20,000
30,000
40,000
50,000
60,000
70,000
To
tal
Wo
rkfo
rce
Job
s
Total Workforce Jobs B Class Jobs Offices Industrial

Watford Economic Growth & Delivery Assessment : Final Report
P6 7179769v9
2.10 The share of B class jobs (i.e. offices, industrial and warehousing activities) in the Borough has remained largely constant over the last 24 years, representing between 43% and 50% of all jobs within Watford. While B class jobs peaked at 30,470 in 2000, this figure has declined by almost 10% since to 27,480. Over this period, office jobs have gradually represented an increasing contribution to all B class jobs in Watford, reflecting a simultaneous decline of industrial jobs.
Figure 2.4 Workforce Jobs by Sector in Watford, 2014
Source: EEFM Spring 2013 / NLP analysis
2.11 In employment terms, the largest sector in Watford in 2014 was professional services (22.4%), with retail (16.1%), health & care (10.6%), wholesale (7.8%), and media & technology (5.7%), also accounting for a significant proportion of employment. The education, hospitality, and public administration sectors are under-represented compared with the regional and national rates (Figure 2.4).
2.12 Between 1991 and 2014, employment growth within Watford was largely driven by professional services (8,150 jobs), retail (2,500 jobs), health & care (1,180 jobs), and arts & entertainment (1,150 jobs). At the same time, it experienced significant job losses in public administration, finance, and media & technology.
2.13 It should also be noted that Watford’s working-age population grew at a faster rate than total workforce jobs between 1996 and 2013, which was in contrast to some other local authorities in the sub-region that recorded higher job growth when compared with working-age population growth (e.g. Welwyn Hatfield, St Albans and Three Rivers) (Figure 2.5). These trends suggest that the Borough has been exporting greater levels of labour during this period, as working residents sought suitable employment positions outside the Borough. It may also underline the Borough’s ability in recent years to attract new working-age residents to live in Watford but who continue to work elsewhere. However in overall terms, the Borough remains a net importer of labour from elsewhere as significant flows of workers commute into Watford from outside the Borough.
0%
5%
10%
15%
20%
25%
% o
f T
ota
l W
ork
forc
e Jo
bs
Watford East UK
Watford Economic Growth & Delivery Assessment : Final Report
7179769v9 P7
Figure 2.5 Change in Working Age Population and Total Workforce Jobs for each Borough in the London Arc West, 1996 - 2013
Source: ONS Mid-Year Population Estimates 2012 / EEFM Spring 2013 / NLP analysis
Productivity
2.14 Productivity as measured by Gross Value Added (GVA3) per worker within the labour force in Watford (£44,160 per worker) is about average when compared with regional rates, but higher than the national rate (£41,080). Watford has the fifth highest labour productivity level out of the eight local authorities making-up the London Arc West (Table 2.1).
Table 2.1 Average GVA per Worker for each Borough in the London Arc West, 2014
Rank Borough GVA per Worker Total GVA
1 Three Rivers £54,090 £2.17 billion
2 Hertsmere £50,070 £2.63 billion
3 Stevenage £46,060 £2.28 billion
4 Dacorum £44,730 £3.03 billion
5 Watford £44,160 £2.51 billion
6 North Hertfordshire £43,990 £2.33 billion
7 Welwyn Hatfield £43,550 £3.69 billion
8 St Albans £39,990 £3.09 billion
Source: EEFM Spring 2013 / NLP analysis
3 GVA measures the value of goods and services produced by an individual producer, industry, sector or region
Watford Economic Growth & Delivery Assessment : Final Report
P8 7179769v9
2.15 A lower productivity level compared with other areas within the sub-region may reflect a mismatch within the local economy between the jobs available, which includes a high proportion of service-related jobs, and a more highly qualified and professional resident workforce, many of whom commute out of Watford to higher paid employment.
Business Demography and Enterprise
2.16 Watford has a slightly lower proportion of small firms employing between 0 and 9 workers (88.1%) than in Hertfordshire (90.4%), the East (89.3%) and the UK (88.7%). However it does accommodate a somewhat higher proportion of large firms employing at least 100 workers (1.6%) when compared with Hertfordshire (1.0%), the East (0.9%) and the UK (1.0%).
2.17 The Borough supports high levels of business start-up rates, with 93 new VAT registered businesses per 10,000 working-age inhabitants in 2010, which is much higher than county (81), regional (61) and national (59) averages. Self-employment in Watford is also high, with 14.0% of the working-age population falling within this category compared with 11.0% in the East and 9.8% in the UK in March 2014. These indicators suggest good levels of entrepreneurship. However, Watford performs less well in terms of business survival rates, with 43% of new start-ups surviving at least five years in the Borough. This compares with 44% across Hertfordshire, 46% across the wider East of England and 44% across the UK as a whole.
2.18 Drawing on IDBR data, the spatial distribution of key business clusters within Watford can be identified (Figure 2.6). The illustration of the IDBR data shows the location of all sectors by scale of employment, and indicates the presence of a wide range of business sectors in Watford. The largest concentrations of businesses are situated at Clarendon Road and Station Road, Imperial Way and Colonial Way, Watford Business Park, and the Watford town centre area.
2.19 The share of B class jobs and total jobs in Watford supported on the Borough’s seven key employment areas (as defined by Policy EMP 1 in the Part 1 Local Plan, adopted January 2013) is presented in Table 2.2. It is estimated from the IDBR data that almost half of all B class jobs and a quarter of total jobs (i.e. across all sectors) in Watford are found within the Policy EMP1 sites. This underlines the important role that non-allocated employment areas play in accommodating the Borough’s workforce.
Table 2.2 Proportion of B Class Jobs and Total Jobs in Watford Supported at the EMP1 Sites
EMP1 Site % B Class Jobs % Total Jobs
Clarendon Road / Station Road 18.6% 9.4%
Fishers / Wiggenhall Road Industrial Estate 0.4% 0.2%
Imperial Way / Colonial Way 14.2% 7.1%
Greycaine Road / Odhams Trading Estate 4.0% 2.0%
Watford Business Park 7.7% 3.8%

Watford Economic Growth & Delivery Assessment : Final Report
7179769v9 P9
EMP1 Site % B Class Jobs % Total Jobs
Ascot Road 0.5% 0.3%
Sandown Road 2.3% 1.2%
Total Proportion of Jobs 47.6% 23.9%
Source: IDBR / NLP analysis
Figure 2.6 Spatial Distribution of Employment by Sector in Watford
Source: IDBR / NLP analysis
Watford Economic Growth & Delivery Assessment : Final Report
P10 7179769v9
Knowledge-Based Industries
2.20 Around 26.3% of businesses in Watford were classified as knowledge-based in 2007, which was higher than the East (21.1%) and national (21.1%) averages. Knowledge-based industries are those sectors were value-added is derived from the accumulation of knowledge, often fostered through innovative actions and the increasing use of technology. These sectors tend to have more growth potential, and so are important signals of an economy’s competitiveness. While Watford is well represented in knowledge-based activities compared with the region and nationally, it is less well represented compared with other areas in the sub-region (Table 2.3). This may reflect the fact that Watford is home to a greater share of larger employers (many of which operate in knowledge-based industries) compared with other authorities in the sub-region that are characterised as having a greater SME business base.
Table 2.3 Share of Knowledge-Based Firms for each Borough in the London Arc West, 2007
Rank Borough Knowledge-Based Businesses
(% of Total Businesses)
1 St Albans 35.4%
2 Three Rivers 29.6%
3 Dacorum 28.8%
4 Hertsmere 28.3%
5 North Hertfordshire 27.1%
6 Welwyn Hatfield 26.7%
7 Watford 26.3%
8 Stevenage 24.5%
Source: UK Competitiveness Index 2010 / NLP analysis
Creative Industries
2.21 The Department for Culture, Media and Sport (DCMS) defines creative industries as “those industries which have their origin in individual creativity, skill and talent and which have a potential for wealth and job creation through the generation and exploitation of intellectual property”. The DCMS separates creative sectors from other industries by determining which occupations and industry codes comprise a high proportion of their workforce in creative roles.4
2.22 The creative economy in Watford is considered to be relatively underdeveloped given the proximity of the local economy to London, and the commercial and lifestyle benefits this offers. The Watford Cultural Plan indicates that whilst the future development of creative industries in Watford will be starting at a lower baseline, there is “considerable scope to bring the sector up to and beyond the national and South East average”.5 The development of Warner Bros Studios
4 Department for Culture, Media and Sport, Creative Industries Economic Estimates: Statistical Release, January 2014 5 Tom Fleming Creative Consultancy, Watford Cultural Plan: Action Plan and Needs Assessment, July 2011, p. 16
Watford Economic Growth & Delivery Assessment : Final Report
7179769v9 P11
Leavesden (which falls on the boundary with Three Rivers District) in 2012 could act as a catalyst for the growth of creative businesses in Watford.
2.23 Using the latest IDBR data, it is estimated that approximately 280 businesses within Watford are operating within creative industries, which support around 1,680 creative jobs in the local economy. The highest shares of jobs in these creative sectors are found in IT & computer services (49%), publishing (24%), music & performing arts (8%), advertising & marketing (6%), and media (6%).
Labour Market
2.24 The economic activity rate (i.e. the proportion of working age residents either in or seeking employment) in Watford at 88.9% is higher than both the regional (80.3%) and national (77.4%) figures. This suggests that limited capacity exists to expand local labour supply from current residents. The remaining 11.1% of the working age resident population are classed as economically inactive, comprising students, temporary and long-term sick, retired and those looking after family/home.
2.25 Claimant unemployment rose in Watford by 146% over two years beginning in early 2008, reflecting the onset of the recession. This high level of claimant unemployment remained this way through 2010 to 2012, before falling in 2013. By May 2014, claimant unemployment reached a five-year low of 2.1%, which was similar to the East (2.0%) but lower than the national rate (2.6%) (Figure 2.7). Unemployment levels in Watford have historically been comparable to the regional average but lower than the national average.
Figure 2.7 Changes in JSA Claimant Rates in Watford, 2006 - 2014
Source: NOMIS / NLP analysis
2.26 The proportion of working age residents claiming Employment and Support Allowance (ESA) and incapacity benefits in Watford at 4.3% falls below the regional (4.8%) and national (6.2%) averages.
0.0
0.5
1.0
1.5
2.0
2.5
3.0
3.5
4.0
4.5
May
-06
Sep
-06
Jan-
07
May
-07
Sep
-07
Jan-
08
May
-08
Sep
-08
Jan-
09
May
-09
Sep
-09
Jan-
10
May
-10
Sep
-10
Jan-
11
May
-11
Sep
-11
Jan-
12
May
-12
Sep
-12
Jan-
13
May
-13
Sep
-13
Jan-
14
May
-14
JSA
Cla
iman
t U
nem
plo
ymen
t R
ate
(%)
Watford
East
Great Britain
Watford Economic Growth & Delivery Assessment : Final Report
P12 7179769v9
2.27 In November 2012 (latest available data), there were 1.8 claimant unemployed workers for every unfilled job centre vacancy in the Borough. This was lower than the ratios for the East region (2.8) and Great Britain (3.5), suggesting a fairly tight labour market exists locally compared with other parts of the country.
2.28 Resident wages in Watford (£642 per week) were higher than the East (£543) and national (£518) averages in 2013. However wage levels for workplace jobs within Watford (£565) are 14% lower than resident wages. This suggests that residents are commuting to higher paid jobs outside the Borough, particularly in Central London.
2.29 Watford is characterised as having low levels of deprivation, with a ranking of 189th out of 326 local authorities on the Indices of Multiple Deprivation (2010) ranking it in the 50% least deprived areas in England. However the Borough wide profile masks variations across Watford, with long-term unemployment and worklessness remaining entrenched in pockets of deprivation in areas such as the wards of Central, Meriden, Holywell and Stanborough, where areas are ranked within the 30% most deprived in the country.
Functional Economic Market Area
2.30 Examining commuting flows can help define the functional economic market area of a particular local economy.6 These commuting flows can be assessed using the latest travel-to-work patterns data from the 2011 Census.
2.31 In 2011, around 63% of Watford’s working residents travelled outside of the Borough for employment. The Borough’s self-containment rate (i.e. the proportion of residents also working within the Borough) was therefore about 37%, having declined from 49% at the time of the 2001 Census. The outflow equated to 24,720 out-commuters, with the most significant flows being to Three Rivers (14%), Westminster (10%), Hertsmere (9%), St Albans (6%) and Dacorum (6%). Destinations within Greater London collectively accounted for approximately 47% of all out-commuting residents from Watford.
2.32 At the same time, around 28,690 workers commuted into the Borough for work in 2011, primarily from the local authorities of Three Rivers (20%), Dacorum (11%), Hertsmere (9%), Harrow (8%) and St Albans (6%). Workers from Greater London also represented a significant proportion of the in-commuters into Watford (27%), illustrating the important role the Borough plays in providing employment for Hertfordshire and parts of north London (Figure 2.8).
6 CLG, Functional Economic Market Areas: An Economic Note, 2010

Watford Economic Growth & Delivery Assessment : Final Report
7179769v9 P13
Figure 2.8 Travel-to-Work Flows for Watford, 2011
Source: Census 2011 / NLP analysis
2.33 On balance, Watford is characterised as being a net-importer of labour, with a net inflow of around 3,963 workers, which is approximately 9% of all workplace jobs within the Borough (Figure 2.8).
2.34 However, between 2001 and 2011, Watford has become a larger exporter of labour as the number of in-commuting workers has remained relatively static whilst the number of residents working elsewhere has increased by 18%. These trends explain the decline in the Borough’s self-containment rate from 49.8% to 36.7% over the 2001 to 2011 period (Table 2.4).
Table 2.4 Changes in Travel-to-Work Flows in Watford, 2001 - 2011
2001
Census 2011
Census Change
(2001 - 2011)
Out-Commuting Working Residents 20,890 24,720 + 18.3%
% of Working Residents Employed in Greater London
44.5% 47.2% +25.3%
In-Commuting Workers 28,730 28,690 - 0.2%
% of In-Commuting Workers from Greater London
24.1% 27.3% +13.1%
Net In-Commuting Flow 7,840 3,940 - 49.8%
Self-Containment Rate for Watford 49.8 36.7 - 26.3%
Source: Census 2001 & 2011 / NLP analysis
2.35 Growth in the number of working residents leaving the local economy to find employment may, in part, be a reflection of lower job growth within Watford
Watford Economic Growth & Delivery Assessment : Final Report
P14 7179769v9
compared to the increases in the working-age population, as illustrated in Figure 2.5. Whilst there can be a number of benefits associated with high levels of workforce self-containment (including reduced congestion and traffic at peak times, a better work-life balance and increased local expenditure, as an area’s population grows) it can become increasingly difficult to provide local employment opportunities unless business growth (through indigenous expansion and/or inward investment) can keep pace. This can be particularly challenging in constrained locations such as Watford where availability of employment space is limited and development land comes under pressure from a range of competing uses.
2.36 It is also clear that the significant employment offering in Greater London has increasingly attracted labour from the Borough, as local job growth has failed to keep pace with Watford’s working-age population growth in recent years. Between 2001 and 2011, the volume of working residents travelling to London for work increased by some 25%, with a high share of these persons employed in such Central London boroughs as Westminster, Camden and Islington. The number of in-commuting workers originating from London also increased by 13% over this time, highlighting the growing economic and spatial connectivity between Watford and the capital.
2.37 Analysis of commuting flows for Watford in 2001 also shows that the majority of workers travelling in and out of the Borough were high skilled, with 56% of out-commuters and 50% of in-commuters working in high skilled roles. This reflects the fact that higher skilled, higher paid workers have more incentive to travel further distances to work and are more likely to accept longer commutes than their lower skilled counterparts. In terms of higher skilled out-commuters, these residents are more likely to gain employment in Central London than lower skilled workers, a trend which is supported by the Borough’s strong transport links with the Capital (Figure 2.9).7
7 Origin-destination data for commuting flows has not yet been released for the 2011 Census

Watford Economic Growth & Delivery Assessment : Final Report
7179769v9 P15
Figure 2.9 Out-Commuting Flows from Watford for Higher Skilled Workers, 2001
Source: Census 2001 / NLP analysis
2.38 Meanwhile, higher skilled workers commuting into Watford from nearby areas originate from a more dispersed residence base, including local authority areas within Hertfordshire, London, Buckinghamshire and Bedfordshire (Figure 2.10).
Figure 2.10 In-Commuting Flows into Watford for Higher Skilled Workers, 2001
Source: Census 2001 / NLP analysis
Watford Economic Growth & Delivery Assessment : Final Report
P16 7179769v9
2.39 Census 2001 occupational data8 also points to a slight mismatch in terms of the skills levels associated with in and out commuters to and from Watford, with out-commuters more likely to be employed within higher skilled occupations (such as managerial and professional occupations) than in-commuters (Figure 2.11). Residents that both live and work in Watford are most likely to be employed as sole traders (Figure 2.11).
Figure 2.11 Travel-to-Work Flows for Watford by Occupation Type, 2001
Source: Census 2001 / NLP analysis
Conclusions
2.40 Watford functions as a key sub-regional centre and benefits from excellent transport links and strategic connectivity. Transport accessibility will be enhanced further through the construction of Croxley Rail Link (CRL), identified in the Hertfordshire Strategic Economic Plan (2014) as the principal infrastructure project for the sub-region, which will enable larger-scale developments to come forward at both a faster rate and higher value.
2.41 Watford has recorded average employment growth over the last 24 years (16.1%), which is similar to national trends but lower than county and regional rates. The growth in workforce jobs over this period was relatively uneven, with Watford experiencing periods of strong job growth and decline. The proportion of B class jobs has however remained largely the same during this period, with declining industrial employment being offset by growth in office jobs.
2.42 Key sectors in Watford that have experienced strong employment growth over the last 24 years include professional services, retail, and health & care, while other large employment sectors include wholesale and media & technology. At the same time, large job losses have been recorded in public administration and finance sectors.
8 Origin-destination data for commuting flows has not yet been released for the 2011 Census
0%
5%
10%
15%
20%
25%
30%
35%
40%
HigherManagerial
Occupations
HigherProfessionalOccupations
LowerManagerial &ProfessionalOccupations
IntermediateOccupations
SmallEmployers &Own Account
Workers
LowerSupervisory& TechnicalOccupations
Semi-RoutineOccupations
RoutineOccupations
Full-TimeStudents
% o
f W
ork
ers
Live & Work in Watford
In-Commuters
Out-Commuters
Watford Economic Growth & Delivery Assessment : Final Report
7179769v9 P17
2.43 The business base in Watford accommodates a slightly lower share of smaller firms and a higher share of larger firms compared with regional and national averages. It is also characterised by relatively high levels of business start-up and self-employment. The largest concentrations of businesses are positioned along Clarendon Road and Station Road, Imperial Way and Colonial Way, and at Watford Business Park and Watford town centre. The key employment sites for Watford (i.e. Policy EMP1 sites) support almost half of B class jobs.
2.44 The Borough is currently characterised as being a large importer of labour, with a net inflow of almost 4,000 workers into the local workplace. However over the last decade Watford has increasingly become an exporter of labour as the volume of out-commuting residents has significantly increased. This is in part a reflection of lower job growth in comparison to the increase in the working age population in Watford over the past fifteen years. In particular, the number of local working residents commuting to London for employment has also increased significantly over the last decade (i.e. particularly to such Central London areas as Westminster, Camden and Islington). This highlights the evolving economic and spatial connectivity between Watford and London.
2.45 Census data also points to a slight skills mismatch between in and out commuters, with out-commuters more likely to be employed within higher skilled occupations than those travelling into the Borough for work. This trend is not uncommon within greater South East authorities that benefit from good access to the Capital’s employment base and is likely to reflect the fact that higher skilled, higher paid workers have more incentive to travel further distances to work and are more likely to accept longer commutes than their lower skilled counterparts. This does however imply that if measures can be put in place to enable Watford to retain a higher proportion of working residents in future, this is likely to have a positive impact upon the skills base of the local workforce and in turn, the types of higher skilled jobs that are able to be accommodated in Watford.

Watford Economic Growth & Delivery Assessment : Final Report
P18 7179769v9
3.0 Commercial Property Market Signals and Intelligence
3.1 This section provides an overview of the current stock of employment space in Watford, while also reviewing the recent trends and changes to the supply of this employment space. The latest market signals and the emerging supply of employment land in these areas are also reviewed, drawing comparisons with surrounding local authority areas where appropriate.
Overview of Employment Space
3.2 The amount of employment land and quantity of built employment space has been considered across the three main types of employment uses (i.e. offices (B1a/b), manufacturing (B1c/B2), and warehousing and distribution (B8)). This analysis was based on data taken from the following sources:
Commercial floorspace data from the ONS and various datasets from the Valuation Office Agency (VOA);
Watford Borough Council’s monitoring data on commercial space; and
EGi Property Link database and other commercial property sources.
Current Stock of Employment Space
3.3 In 2012, Watford contained approximately 672,000m2 of B class floorspace. The total stock of commercial office space in the Borough decreased by almost 6% over the 12 year period between 2000 and 2012 according to published VOA data (Figure 3.1), which compares to a 15% increase over the same period across the East of England region as a whole. Industrial space also fell by around 11% during this period, which compares with regional growth of 4%.
Figure 3.1 Change in Business Floorspace in Watford, 2000 - 2012
Source: VOA Business Floorspace Statistics / NLP analysis
200,000
250,000
300,000
350,000
400,000
450,000
500,000
550,000
2000 2001 2002 2003 2004 2005 2006 2007 2008 2009 2010 2011 2012
To
tal
Flo
ors
pac
e (m
2 )
Offices Industrial
- 5.7%
- 11.3%
Watford Economic Growth & Delivery Assessment : Final Report
7179769v9 P19
3.4 A breakdown of the employment space by main uses in 2008 is shown in Figure 3.2, including a comparison with employment space levels in surrounding local authorities.
Figure 3.2 Components of Employment Floorspace by Local Authority, 2008
Source: VOA 2008 / NLP analysis
Note: VOA business floorspace analysis presented in this section draws upon a number of different VOA datasets. Although these have been published at different time (2008, 2010, 2012), they have been used as each provides information in a slightly different and complementary format.
3.5 This indicates that the supply of employment space within Watford is relatively evenly split across offices (33%), factories (27%) and warehouses (40%). Compared to other local authorities, Watford has a smaller stock of office space than London boroughs such as Hillingdon and Barnet, as well as Dacorum, but more than other Hertfordshire districts such as St. Albans and Three Rivers and similar to the London Borough of Harrow. The stock of factory space is the third highest (after Hillingdon and Harrow) and larger than other parts of Hertfordshire such as St. Albans and Three Rivers. Warehousing accounts for the largest share of Watford’s total stock of commercial space, with more than Harrow, Hertsmere and Three Rivers but less than Barnet, Dacorum, Hillingdon and St. Albans. Given that Watford is one of the smallest authorities in the sub-region with an area of 8.4 square miles, this employment space is generally characterised by its high density, particularly in and around the town centre.
Spatial Distribution
3.6 Figure 3.3 and Table 3.1 show the distribution of B class employment space across Watford using latest available VOA data. This indicates that about 43% of the Borough’s office space is concentrated within the Clarendon Road/Station Road employment area and to a lesser extent Imperial Way/Colonial Way (19%) to the north of Watford Junction. Approximately one quarter (25%) of the Borough’s office space is dispersed more widely across Watford, including at Watford Business Park and Greycaine Road.
0
100,000
200,000
300,000
400,000
500,000
600,000
700,000
800,000
900,000
Watford Barnet Dacorum Harrow Hertsmere Hillingdon St AlbansThree Rivers
To
tal
Flo
ors
pac
e (m
2 ) Offices
Factories
Warehouses
Watford Economic Growth & Delivery Assessment : Final Report
P20 7179769v9
3.7 By contrast, industrial space tends to be more evenly distributed across the Borough, with the most significant concentrations in and around Imperial Way/Colonial Way (25%), Greycaine Road/Odhams Trading Estate (20%) and Watford Business Park (19%). Just over a third (34%) of industrial floorspace is located across a number of smaller sites including Sydney Road, Shakespeare Industrial Estate and Rickmansworth Road (Figure 3.3).
Figure 3.3 Spatial Distribution of Employment Floorspace in Watford
Source: VOA 2010 / NLP analysis
Table 3.1 Location of Employment Floorspace in Watford
Location Proportion of Office
Space Proportion of
Industrial Space9
Clarendon Road/Station Road 43% 0%
Fishers/Wiggenhall Road Industrial Estate 0% 2%
Imperial Way/Colonial Way 19% 25%
Greycaine Road/Odhams Trading Estate/Sandown Road
2% 20%
Watford Business Park 11% 19%
Elsewhere in the Borough 25% 34%
Watford Total 100% 100%
Source: VOA 2010 / NLP analysis
9 As defined by factory, workshop and warehouse space

Watford Economic Growth & Delivery Assessment : Final Report
7179769v9 P21
Development Rates
Gross completions
3.8 The gross amount of floorspace developed for employment uses in Watford over the last nine years is shown in Figure 3.4. This indicates that just over 65,500sq.m of gross B Class space was developed across the Borough between 2004 and 2013, equivalent to an average of 7,280sq.m per annum.
3.9 Half of new floorspace was developed for industrial uses (50%), with just over a quarter (28%) developed for mixed B uses. The remaining 22% of gross floorspace was developed for office uses.
Figure 3.4 Gross Development Rates in Watford 2004-2013
Source: Watford Borough Council / NLP analysis
3.10 Figure 3.4 shows that the level of new development in Watford has been relatively uneven over recent years, with the reporting years 2005/06 and 2011/12 standing out as recording significant levels of gross B class development (equivalent to 13,270sq.m and 18,670sq.m respectively) which represented at least double the annual average rate of development over this period. Gross completions in 2011/12 were driven by a number of smaller developments including at Greycaine Road and Colonial Way. Completions elsewhere in the Borough were relatively modest by comparison.
Net completions
3.11 Across the period as a whole the net development rate (i.e. taking account of losses of employment space) was negative, reflecting significant losses of employment space which outpaced the level of gross development recorded. Between 2004 and 2013, the Borough recorded net development in the order of -84,740sq.m, or an average of -9,415sq.m per annum (Figure 3.5). This means that across all B use classes, the loss of employment space exceeded
0
2,000
4,000
6,000
8,000
10,000
12,000
14,000
16,000
18,000
20,000
2004/05 2005/06 2006/07 2007/08 2008/09 2009/10 2010/11 2011/12 2012/13
Gro
ss C
om
ple
tio
ns
(Sq
.m)
Mixed B
Industrial (B1c/B2/B8)
Offices (B1a/b)
Annual Average
Greycaine Rd & Colonial Way

Watford Economic Growth & Delivery Assessment : Final Report
P22 7179769v9
gains by around 9,415sq.m each year, resulting in a reduction of B class space in Watford over the last nine years (as echoed by Figure 3.2).
Figure 3.5 Net Development Rates in Watford 2004-2013
Source: Watford Borough Council / NLP analysis
3.12 A review of the Council’s monitoring data indicates that the majority of these losses related to industrial (B1c/B2/B8) space, equivalent to 8,870sq.m per annum on average or 53% of the total10. Whilst these losses were recorded across the Borough and mainly comprised of a large number of smaller developments, a significant proportion of these losses were driven by a handful of larger developments such as at the former Sun Chemicals site in Cow Lane, Willow Grange on Church Road, East Of Tinsley Estate on Queen Marys Avenue and Melton House on Clarendon Road, all of which were redeveloped for residential or hotel uses. They represent ‘one off’ redevelopments (for example following the closure/relocation of a large firm in the Borough) rather than the ongoing gradual erosion of B class space in Watford.
3.13 Some of these losses represented a change of use from one B class to another largely within the boundary of the existing site. Where B class space was lost to other non B class uses, the majority of this (84%) occurred outside of the Borough’s main employment areas (i.e. as defined by areas E1 to E7 in the Watford Local Plan (adopted January 2013)) and two thirds (66%) was lost to residential uses. This reflects the increasing pressure that has been placed upon the supply of land and space for business uses in the Borough in recent years, in particular from higher value uses such as residential.
Impact of Permitted Development Rights
3.14 In May 2013, the Government introduced Permitted Development (PD) Rights to allow for change of use from B1(a) offices to residential, whereby premises
10 With the remaining 34% relating to office (B1a/b) uses and 13% relating to mixed B Class uses
-25,000
-20,000
-15,000
-10,000
-5,000
0
5,000
10,000
2004/05 2005/06 2006/07 2007/08 2008/09 2009/10 2010/11 2011/12 2012/13
Net
Flo
ors
pac
e C
om
ple
tio
ns
(Sq
.m)
Mixed B
Industrial (B1c/B2/B8)
Offices (B1a/b)
Willow Grange& 31-35 Clarendon Rd
Sun Chemicals, Cow Lane
Annual Average
Watford Economic Growth & Delivery Assessment : Final Report
7179769v9 P23
can undergo change of use without the need to obtain planning permission, at least for an initial three-year period. The effect of the new permitted development rights could be to increase the rate of losses of office space potentially above past trends. This would apply even with the general protection of employment land under Core Strategy Policy EMP1.
3.15 The Council have subsequently introduced an Article 4 Direction covering the employment area around Clarendon Road and Station Road which withdraws these permitted development rights in order to help protect the employment designation of the properties within Clarendon Road/Station Road.
3.16 Outside of this specified area, Council monitoring data indicates that eight Prior Approval Notices11 have so far been submitted for change of use from office to residential in the Borough under the new PD rights which would result in a gain of 127 residential units. The majority of these office premises are located in or adjoining the town centre, with a further two located near to Watford Junction12.
3.17 If all of these prior approval notices were to be implemented, this would equate to a total loss of just over 7,000 sq.m of office space across Watford, equivalent to just over 3% of existing office stock in the Borough or just under 880sq.m per notice. This quantum of space is higher than the annual average loss of office floorspace recorded in the Borough over the last nine years i.e. before the PD rights were introduced. Although comprehensive monitoring data is not yet available for the most recent reporting year (i.e. 2013/14), this analysis suggests that the effect of the office to residential PD rights policy has been to more than double the rate of office floorspace losses in Watford, thereby accelerating the rate of contraction of the Borough’s office stock.
Emerging Supply of Employment Space
3.18 The supply of employment space in the development pipeline comes from outstanding planning permissions (that have yet to be implemented) and the Borough’s major development projects which are expected to come forward for B class development (either in part or in whole) over the plan period.
3.19 Based on Council monitoring data at March 2013, the Borough’s employment land supply totals just under 81,000sq.m, broken down as follows in Table 3.2.
Table 3.2 Emerging Employment Land Supply in Watford
Additional Floorspace Gain (Sq.m)
Office (B1a/b) Industrial
(B1c/B2/B8) Total
Extant Planning Permissions -8,530 -2,330 -10,860
Major Development Projects* 93,650 -1,800 91,850
Total 85,120 -4,130 80,990
Source: WBC / NLP analysis * Note: Emerging supply from Watford Health Campus is included within extant planning permissions
11 As at July 2014 12 Archway House, Orphanage Road and 186 St Albans Road

Watford Economic Growth & Delivery Assessment : Final Report
P24 7179769v9
3.20 The majority of this supply relates to proposals for Watford’s major development projects which comprise a range of mixed uses including B class employment development. The Ascot Road and Watford Junction projects are anticipated to make the most significant contribution to bringing forward new employment space over the plan period, equivalent to 41,800 sq.m and 46,450sq.m of B1a office space respectively. Further details about these major development projects and the estimated economic impacts associated with their implementation are explored in more detail in section 5.0.
3.21 In addition, there are a number of sites within the Borough which have been granted planning permission for B class development that has remained unimplemented. At March 2013, these permissions amounted in total to a gross gain of 45,500sq.m and loss of 56,360sq.m of B class floorspace. Whilst there is no guarantee that these permissions will be implemented in full, these permissions imply a net loss of 10,860sq.m of employment space across the Borough, and would represent a continuation of recent trends of development in Watford (see Figure 3.5) whereby the stock of employment space has been gradually eroded over time.
3.22 It is also worth noting that the majority of this emerging supply relates to office (B1a/b) uses, with an overall loss of industrial space anticipated from both the major development projects and extant planning permissions. This indicates that, in net terms, there is no emerging capacity for new industrial development across the Borough over the Plan period.
Market Intelligence
3.23 This section provides an overview of the commercial property market in Watford, including recent trends in demand and supply. The findings are mainly based on discussions with a number of commercial property agents who are currently active in the area and where appropriate this has been supplemented with information derived from commercial property availability databases and published market reports.
3.24 Although the primary focus of this study is the Borough of Watford, in functional economic terms Watford’s commercial property market extends beyond its boundaries to include a number of out-town developments which are actually located in neighbouring local authorities. For example, Croxley Green Business Park and Leavesden Park are located within Three Rivers District. While not within the Borough, these developments effectively form part of Watford’s commercial property market. Consequently, the commentary includes reference to this extended functional market area.
Market Geography
3.25 Watford is a key driver of Hertfordshire’s commercial property market. It has a diverse economy with a critical mass of occupiers ranging from civil engineering to retail, large employers through to a thriving SME community and with an active Chamber of Commerce. The Borough lies at the heart of the
Watford Economic Growth & Delivery Assessment : Final Report
7179769v9 P25
Hertfordshire LEP’s M1/M25 Growth Area and through a major programme of investment and interventions such as the Croxley Rail Link, has the potential to continue to deliver significant economic growth in future.
3.26 Most employment activity in the Borough is focused on four market locations: Clarendon Road, Watford’s prime office location, which forms a direct visual and physical link between the station and the edge of the town centre; Watford Business Park in the south west; Imperial Way/Colonial Way, immediately to the north of Watford Junction station, and the Greycaine Road/Odhams Industrial Estate employment area next to North Western Avenue (the A41).
3.27 Because of Watford’s close proximity to London, like other towns in the Home Counties, in the past it has been able to attract relocations from London. While Watford has benefited from this, it highlights that the Borough has always faced intense competition, not only from other parts of Hertfordshire such as St Albans and Hemel Hempstead both of which have established property markets, but also from Greater London itself and towns like Hatfield which have similar connectivity with central London.
3.28 Recently Watford has struggled to contend with this competition as the calibre of office accommodation offered in places such as Croxley Green Business Park and St Albans now generally exceeds the quality available in Clarendon Road, and it has very few premises which can accommodate larger occupiers. In the same vein, old industrial stock and high land values for alternative land uses has restricted the supply of new industrial accommodation in the Borough.
3.29 The Borough’s commercial market has also been affected by the economic downturn with the pace of development slowing considerably. Nonetheless, significant losses of employment space over the past decade, coupled with a constrained administrative boundary, places continued pressure on a limited supply of employment space to accommodate future growth in Watford.
Market Segments
Industrial
3.30 Most of the Borough’s industrial stock is provided within the key employment areas of Imperial Way/Colonial, Watford Business Park and the Greycaine Road/Odhams Industrial Estate. Imperial Way/Colonial Way has the largest provision and this overwhelmingly comprises B8 uses and some trade counters. Watford Business Park has a slightly smaller provision than Imperial Way/Colonial Way and mainly provides a mixture of B8 and light industrial units, which tend to be older than what is provided on the adjacent Croxley Green Business Park and therefore usually achieves lower rents. Both of these employment areas also contain some non-B uses. B8 provision is also a significant component of the Greycaine Road/ Odhams Industrial Estate, though it mainly comprises small industrial units, some of which are dated and poorly specified.

Watford Economic Growth & Delivery Assessment : Final Report
P26 7179769v9
3.31 Immediately beyond Watford’s boundary are a number of industrial estates, including several developments on Tolpits Lane (Wolsey Business Park, Metro Centre, and industrial/warehousing on Moor Park and Vale Industrial Estate). However, Tolpits Lane is constrained by relatively poor access to the strategic road network and lack of through access to Watford Business Park which is adjacent. Otterspool Way in Bushey provides some further industrial supply, including a 19,500 sq.m distribution centre occupied by Porcelanosa, although more recently has come under pressure from car showroom uses. Other than this, the industrial estates on Watford’s fringes are relatively minor industrial locations.
3.32 Demand for industrial premises in Watford is generally strong, and locations that are close to Junction 5 of the M1 are particularly sought after for distribution purposes, because of the good access such sites have to the M25 and national road network. This demand mainly stems from the town’s large and diverse base of firms involved in some aspect of industrial activity, including what appears to be a relatively high number of specialist manufacturers, for example DDD Ltd, Prism Power, Sigma Pharmaceuticals, Siemens, Teledyne TSS and Whippendell Marine Ltd are all based within the Borough.
3.33 According to local agents most demand is for smaller industrial units of up to 465sq.m. However, there are a number of larger industrial occupiers in the Borough and local commercial agents cited several large active requirements for Watford-based companies ranging from sites of between 1.6 and 2 hectares, and for accommodation ranging in size from c. 2,800sq.m to 4,650sq.m. Market feedback points to an acute shortage of available land to accommodate these types of requirements.
3.34 There is evidence that this issue has already constrained industrial activity in the Borough, with Lambert Smith Hampton commenting in early 2013: “…Watford experienced limited annual take-up of premises [in 2012] due to the limited supply of good quality industrial stock”13. This lack of new industrial space puts Watford at a distinct disadvantage to Hemel Hempstead – one of the main distribution centres around the M25 and southern part of the M1 – where buildings are continually being churned (demolished and rebuilt), and there is now a large proportion of modern and purpose-built accommodation catering for small to large businesses.
3.35 Moreover, the overall industrial vacancy rate presently stands at c. 7.5% and availability has remained at this low level for quite some time, preventing the churn, intensification and upgrading of existing sites that would be expected to take place within a normal market environment (i.e. one that faces fewer land constraints).
3.36 The overwhelming view amongst local agents is that a continued lack of supply will severely impede Watford’s future economic growth potential, in a sector that has proved more resilient during the recession and which offers the
13 ‘Industrial and Logistics Market 2013’, Lambert Smith Hampton
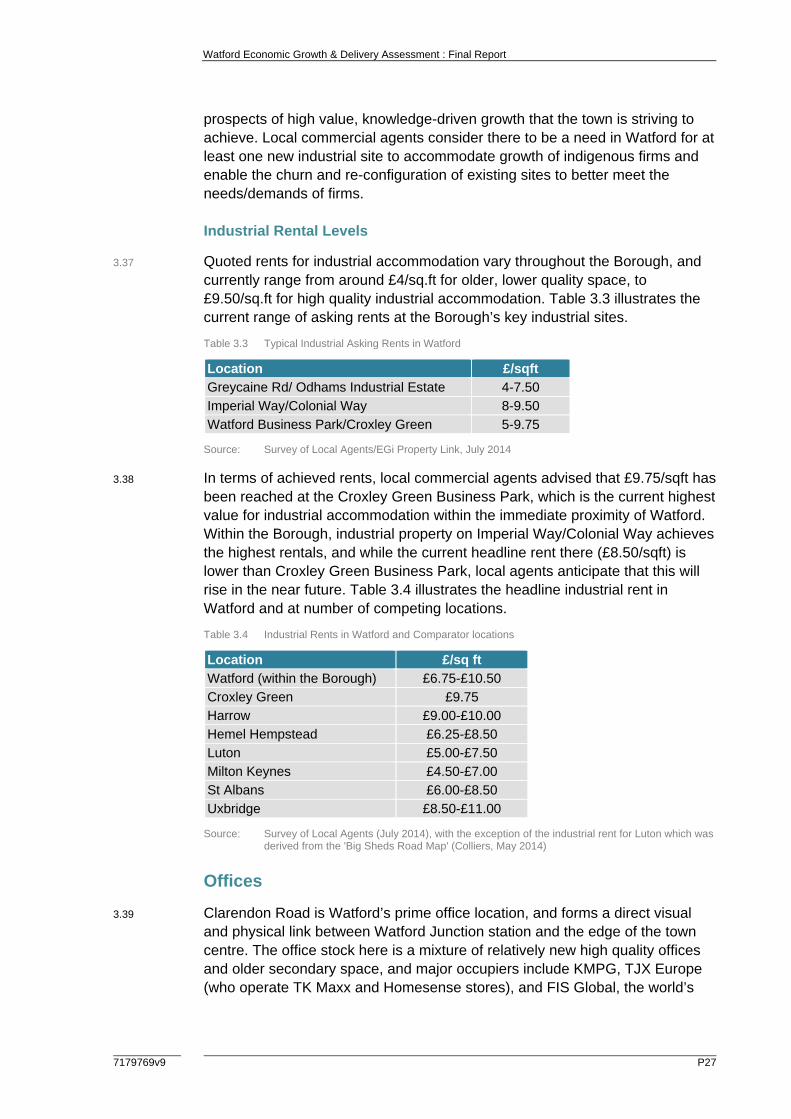
Watford Economic Growth & Delivery Assessment : Final Report
7179769v9 P27
prospects of high value, knowledge-driven growth that the town is striving to achieve. Local commercial agents consider there to be a need in Watford for at least one new industrial site to accommodate growth of indigenous firms and enable the churn and re-configuration of existing sites to better meet the needs/demands of firms.
Industrial Rental Levels
3.37 Quoted rents for industrial accommodation vary throughout the Borough, and currently range from around £4/sq.ft for older, lower quality space, to £9.50/sq.ft for high quality industrial accommodation. Table 3.3 illustrates the current range of asking rents at the Borough’s key industrial sites.
Table 3.3 Typical Industrial Asking Rents in Watford
Location £/sqft Greycaine Rd/ Odhams Industrial Estate 4-7.50
Imperial Way/Colonial Way 8-9.50
Watford Business Park/Croxley Green 5-9.75
Source: Survey of Local Agents/EGi Property Link, July 2014
3.38 In terms of achieved rents, local commercial agents advised that £9.75/sqft has been reached at the Croxley Green Business Park, which is the current highest value for industrial accommodation within the immediate proximity of Watford. Within the Borough, industrial property on Imperial Way/Colonial Way achieves the highest rentals, and while the current headline rent there (£8.50/sqft) is lower than Croxley Green Business Park, local agents anticipate that this will rise in the near future. Table 3.4 illustrates the headline industrial rent in Watford and at number of competing locations.
Table 3.4 Industrial Rents in Watford and Comparator locations
Location £/sq ft
Watford (within the Borough) £6.75-£10.50
Croxley Green £9.75 Harrow £9.00-£10.00 Hemel Hempstead £6.25-£8.50
Luton £5.00-£7.50
Milton Keynes £4.50-£7.00 St Albans £6.00-£8.50
Uxbridge £8.50-£11.00
Source: Survey of Local Agents (July 2014), with the exception of the industrial rent for Luton which was derived from the 'Big Sheds Road Map' (Colliers, May 2014)
Offices
3.39 Clarendon Road is Watford’s prime office location, and forms a direct visual and physical link between Watford Junction station and the edge of the town centre. The office stock here is a mixture of relatively new high quality offices and older secondary space, and major occupiers include KMPG, TJX Europe (who operate TK Maxx and Homesense stores), and FIS Global, the world’s

P28
3.40
3.41
3.42
14 As reported15 As reported
Watford Ec
largest strong pofferingor near
BeyondImperiaclustersColoniaMajesticfeatureswithin th
While thmarkedby CBRhotspot confidenacquisitover theimprove
In additWatfordBoroughwas achfirst halfWhile sreasonaTJX Eu
Figure 3.6
Source:
in ‘National Off
in Property We
conomic Growth
provider of presence of accommodcapacity.
Clarendonl Way/Colo
s of good qual Way whicc Wine; ands the head ohe Borough
here is still aly in Watfor
RE concludinfor letting a
nce in the totion of Meride coming yees through a
ion, as indicd area (i.e. ih boundaryhieved in 20f of 2014, inmall transaable sized arope’s acqu
Office Take-u
Perry Holt &
fice Market Rev
eek 23/6/2014
h & Delivery Ass
bank paymf serviced odation on a
Road, it is nial Way emuality office h is occupied Campus Poffices of H most office
an element rd in recent ng that duriactivity in thown, as is idien Houseears as the a series of r
cated in Figncluding ma) during 20010. Approxndicating thactions rema
acquisitions uisition of c.
up in the Greate
Co, July 2014
view’, CBRE Re
sessment : Fina
ment systemoffice provid
short term,
relevant to mployment accommod
ed by a numPark, which ilton Worldwe provision
of caution, years. Occng the first
he M25 Nortllustrated b
e on ClarendBorough’s regeneratio
gure 3.6 belajor develo12 and 201ximately 13at 2014 hasain the main
have recen. 4,460 sq.m
er Watford Area
esearch, July 20
al Report
s. Clarendoers, includinflexible bas
highlight tharea, which
dation: Belfrymber of firm
is closer towide and Wis provided
the office mcupier demahalf of 2014th area14, any M&G Readon Road.15
infrastructun programm
ow, office tapments imm3 was cons,200sq.m hs the potentnstay of the ntly occurrem at 40 Clar
a since 2006
14
on Road alsng Regus asis and larg
he office proh notably coy Business s including
o Watford JuWeatherspoo
on Watford
market has and has rise4 Watford hnd there is gal Estate’s r5 This is likere and conn
mes and inv
ake-up in thmediately ousiderably higas been let tial to be a smarket, a nd in the Borrendon Roa
717
so features and i2Officegely operatin
ovision in thomprises tw
Park on HSBC and
unction andon’s. Elsewhd Business
improved en, with resehas been a growing invrecent ely to continnectivity vestment.
he Greater utside of thegher than wt or sold in tstrong yearnumber of rough, inclu
ad.
79769v9
a , ng at
he wo
here Park.
earch
vestor
nue
e what
he .
uding

Watford Economic Growth & Delivery Assessment : Final Report
7179769v9 P29
3.43 However, in recent years only a very small amount of new office space has been completed in the Borough reflecting continued market uncertainty. This has also meant that the proposed redevelopment of Gresham House (53 Clarendon Road) to provide 8,360sq.m of office space is still yet to occur, as rather than speculatively develop this scheme it is understood that the developer is seeking a pre-let. Market feedback suggests that to finance the development of this scheme it would be necessary to achieve a rent of around £25/sq ft for a 10 year term, if not longer, and this sort of rental level is well in excess of the £20/sq ft currently being achieved in the Borough. Consequently, in the short term at least, there is a major issue in funding new office developments, undermining the viability of bringing forward office schemes not only on Clarendon Road but potentially across the Borough.
3.44 Based on analysis of information derived from EG Property Link, there is around 31,420sq.m of office space currently being marketed as available in the Borough. This implies that the overall office vacancy rate is about 15%, which is noticeably down from 2010 when it was reported to be 24%16. It is possible that tight supply will push up values to the level where stock can be renewed and in this respect it is relevant to note the limited availability of high quality stock. Indeed, more detailed analysis of available space indicates that the grade ‘A’ vacancy rate in the Borough is currently only 4.1%17 suggesting that the majority of available office stock is of a secondary nature including older, out-dated premises that no longer meet modern business needs. This trend is not unique to Watford and can be seen across the wider South East reflecting changing occupational preferences and viability issues associated with bringing forward new office development.
Clarendon Road
3.45 Given the significance of Clarendon Road in terms of Watford’s office market there are several location specific points to note:
a With the possible exception of Iveco House, which is multi-tenanted, none of the buildings in this location (or indeed anywhere else in the Borough) are particularly large. As a result, Watford may be missing out on a number of sizeable, active requirements which are a feature of the market at the moment. It also means that some existing employers, for example TJX Europe, are forced to operate from several premises on Clarendon Road and potentially the desire to consolidate activities or expand may prompt this firm to look elsewhere for accommodation in future. This could have implications for the Borough’s ability to retain larger employers.
b Since Clarendon Road is exceptionally well-serviced by public transport the area has the lowest car parking standard ratios in the Borough.18 Agents noted that this could be a factor that is deterring some businesses from moving to this location. In addition, since car parking
16 As reported in the 2010 Employment Land Review 17 Availability recorded at July 2014; ‘Grade A’ vacancy rate refers to property graded ‘AA’ 18 As mentioned at a Development Control Committee meeting, Thursday, 31st October, 2013
Watford Economic Growth & Delivery Assessment : Final Report
P30 7179769v9
standards have been higher in the past, the current low ratio may act as a disincentive for some of Clarendon Road’s older, less well specified office stock from coming forward for redevelopment because any replacement parking provision would be less generous that what already exists.
c There has been recent pressure to provide housing in the Clarendon Road area. Local commercial agents felt that it is important that this area retains its position as Watford’s prime office location and were generally supportive of the Council’s recent decision to exercise an Article 4 Direction to preserve the area’s office-based employment use.
Office Provision on Watford’s fringes
3.46 As noted earlier, there are a number of commercial developments just beyond Watford’s administrative boundary that lie within Three Rivers and Hertsmere districts. With the exception of Croxley Green Business Park and Leavesden Park, these are relatively minor office locations.
3.47 Croxley Green Business Park is well maintained and has been the subject of an extensive rolling refurbishment the outcome of which is a high quality campus office environment. However, the scheme still lacks critical mass as an office location, and while it now offers a good range of amenities this is not as extensive as found in Watford’s town centre, and one of the key strengths of Watford is its rail links to London (although Croxley Green will benefit from the opening of the Croxley Rail Link in the future).
3.48 Leavesden Park is a good quality scheme of around 27,000sq.m, which was initially mainly occupied by BT as part of its Workstyle initiative to move staff out of central London, but much of this space is now back on the market. The scheme suffers from poor public transport links and low demand for large floorplates.
Office Rental Levels
3.49 Quoted rents for office accommodation currently range from around £12/sqft for older and poorly specified space with limited or no car parking, to £24/sqft for the best quality space at Watford Business Park and Clarendon Road – albeit in the current cycle, as noted below, Clarendon Road is yet to achieve this level. It is also pertinent to note that £22.50/sqft is sought in the Imperial Way/Colonial Way employment area, which is the asking price for the remaining two floors of Oak House, Central Park, a ‘grade AA’ rated property. Table 3.5 illustrates the current range of asking rents at the Borough’s key office sites.
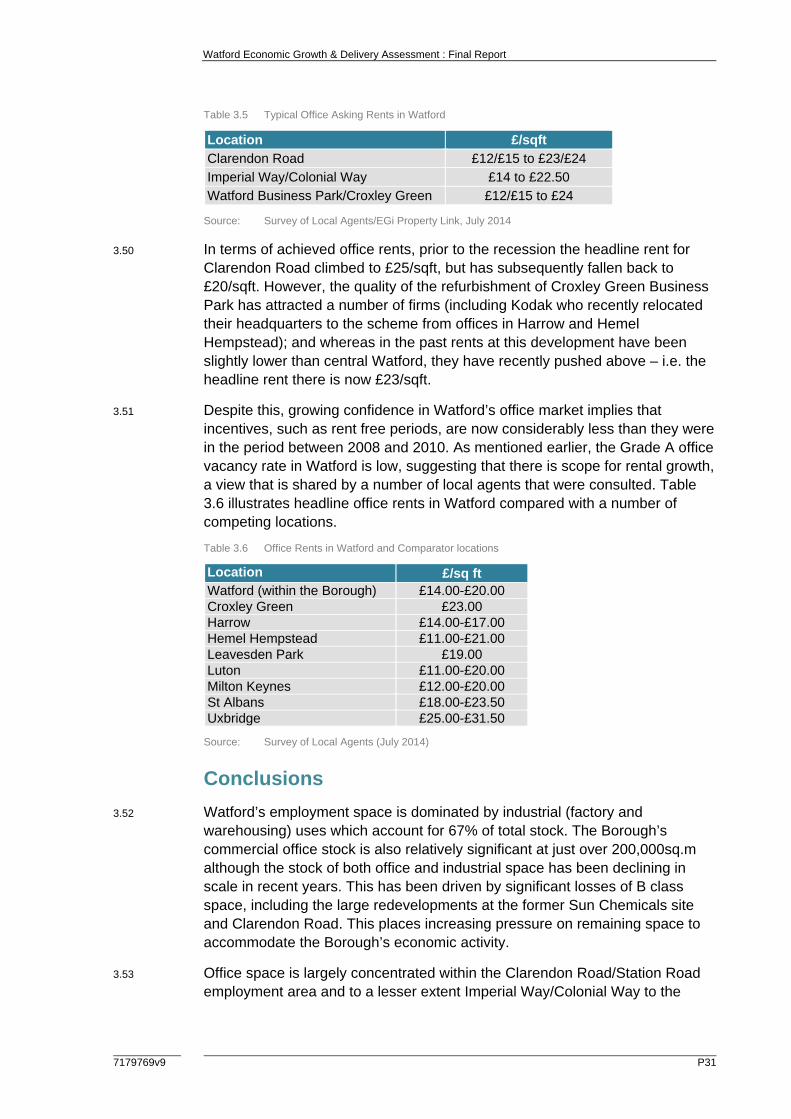
Watford Economic Growth & Delivery Assessment : Final Report
7179769v9 P31
Table 3.5 Typical Office Asking Rents in Watford
Location £/sqft
Clarendon Road £12/£15 to £23/£24
Imperial Way/Colonial Way £14 to £22.50 Watford Business Park/Croxley Green £12/£15 to £24
Source: Survey of Local Agents/EGi Property Link, July 2014
3.50 In terms of achieved office rents, prior to the recession the headline rent for Clarendon Road climbed to £25/sqft, but has subsequently fallen back to £20/sqft. However, the quality of the refurbishment of Croxley Green Business Park has attracted a number of firms (including Kodak who recently relocated their headquarters to the scheme from offices in Harrow and Hemel Hempstead); and whereas in the past rents at this development have been slightly lower than central Watford, they have recently pushed above – i.e. the headline rent there is now £23/sqft.
3.51 Despite this, growing confidence in Watford’s office market implies that incentives, such as rent free periods, are now considerably less than they were in the period between 2008 and 2010. As mentioned earlier, the Grade A office vacancy rate in Watford is low, suggesting that there is scope for rental growth, a view that is shared by a number of local agents that were consulted. Table 3.6 illustrates headline office rents in Watford compared with a number of competing locations.
Table 3.6 Office Rents in Watford and Comparator locations
Location £/sq ft Watford (within the Borough) £14.00-£20.00 Croxley Green £23.00 Harrow £14.00-£17.00 Hemel Hempstead £11.00-£21.00 Leavesden Park £19.00 Luton £11.00-£20.00 Milton Keynes £12.00-£20.00 St Albans £18.00-£23.50 Uxbridge £25.00-£31.50
Source: Survey of Local Agents (July 2014)
Conclusions
3.52 Watford’s employment space is dominated by industrial (factory and warehousing) uses which account for 67% of total stock. The Borough’s commercial office stock is also relatively significant at just over 200,000sq.m although the stock of both office and industrial space has been declining in scale in recent years. This has been driven by significant losses of B class space, including the large redevelopments at the former Sun Chemicals site and Clarendon Road. This places increasing pressure on remaining space to accommodate the Borough’s economic activity.
3.53 Office space is largely concentrated within the Clarendon Road/Station Road employment area and to a lesser extent Imperial Way/Colonial Way to the
Watford Economic Growth & Delivery Assessment : Final Report
P32 7179769v9
north of Watford Junction. By contrast, industrial space tends to be more evenly distributed across the Borough, including in and around Imperial Way/Colonial Way, Greycaine Road/Odhams Trading Estate, Sandown Road and Watford Business Park.
3.54 The recent introduction of Permitted Development right for change of use from office to residential has started to have an impact in Watford, with Council monitoring data indicating that eight Prior Approval Notices have so far been submitted, mainly in and around the town centre. If implemented in full, this would equate to a loss of just over 7,000sq.m of office space across Watford or just over 3% of existing office stock in the Borough. The analysis suggests that the effect of the office to residential PD rights policy has thus far been to more than double the rate of office floorspace losses recorded in Watford in the past.
3.55 The supply of employment space in the Borough’s development pipeline comprises just under 81,000 sq.m of outstanding planning permissions (that have yet to be implemented) and major development projects which are expected to deliver some B class development (either in part or in whole) over the Plan period. This supply is distributed across the Borough but concentrated particularly strongly across a number of key sites at Watford Junction and Ascot Road. In net terms, there is no emerging capacity for new industrial development across the Borough over the Plan period.
3.56 Watford is a key driver of Hertfordshire’s commercial property market. Its industrial market has been relatively resilient to the recession and demand for industrial premises in Watford is now generally strong, and locations that are close to Junction 5 of the M1 are particularly sought after for distribution purposes. By contrast, its office market has experienced a more turbulent time in the last few years, following the ‘dotcom crash’ of the early 2000s, recent recession and strong competition from competing locations such as Croxley Green Business Park and St Albans. Nevertheless, the office market has improved markedly in recent years as occupier demand and take-up of space has risen.
3.57 The Borough’s employment potential remains constrained by a number of factors. There is an acute shortage of available employment land and market feedback indicates that it requires more industrial space to accommodate indigenous growth and enable the necessary churn and upgrading or intensification of existing sites. In addition, there is a major issue in funding new office developments, undermining the viability of bringing forward office schemes in Watford over the short term. It is possible that in the foreseeable future tight supply will push values to the level where this can occur and there are some examples of business space being upgraded in the Borough including at Watford Business Park where the process of redevelopment is underway.
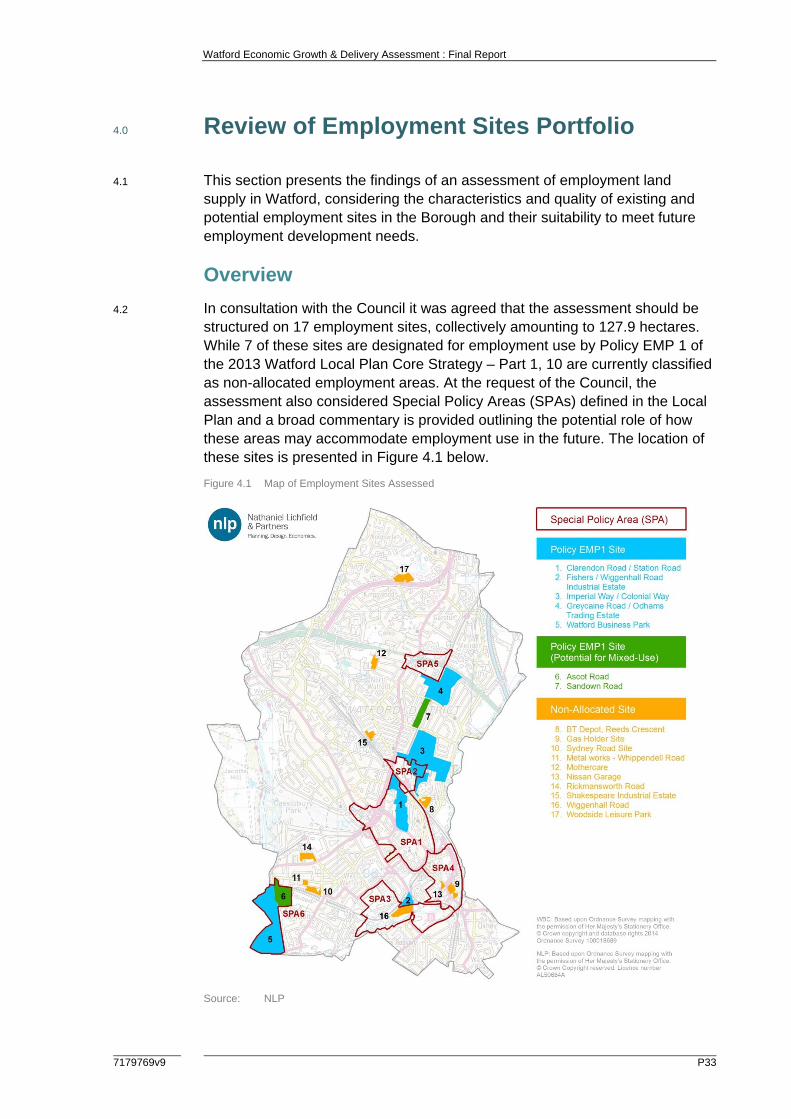
Watford Economic Growth & Delivery Assessment : Final Report
7179769v9 P33
4.0 Review of Employment Sites Portfolio
4.1 This section presents the findings of an assessment of employment land supply in Watford, considering the characteristics and quality of existing and potential employment sites in the Borough and their suitability to meet future employment development needs.
Overview
4.2 In consultation with the Council it was agreed that the assessment should be structured on 17 employment sites, collectively amounting to 127.9 hectares. While 7 of these sites are designated for employment use by Policy EMP 1 of the 2013 Watford Local Plan Core Strategy – Part 1, 10 are currently classified as non-allocated employment areas. At the request of the Council, the assessment also considered Special Policy Areas (SPAs) defined in the Local Plan and a broad commentary is provided outlining the potential role of how these areas may accommodate employment use in the future. The location of these sites is presented in Figure 4.1 below.
Figure 4.1 Map of Employment Sites Assessed
Source: NLP
Watford Economic Growth & Delivery Assessment : Final Report
P34 7179769v9
4.3 All the SPAs and the 17 employment sites were inspected and in terms of the latter, in accord with Government guidance on Employment Land Reviews, these were assessed against the following criteria:
a strategic and local road access;
b proximity to labour and services;
c adjoining uses that might constrain employment uses;
d site size, characteristics and potential development constraints; and
e market attractiveness.
4.4 Other factors were also noted including suitability for specific uses, planning constraints, potential timescale for delivery, and whether there were any barriers to the delivery of undeveloped sites. Site plans are included at Appendix 3. Details of the criteria used to assess sites are in Appendix 4 and Appendix 5 contains a detailed assessment of each site against these criteria.
4.5 It should be noted, however, that this assessment process in itself does not necessarily provide a complete picture of the local significance of certain sites. A site, for example, could be considered as having the potential of satisfying particular business or sector needs, which can be important reasons for retaining it, even if it does not perform well against conventional site assessment criteria. A broader commentary is therefore provided on each site to supplement the formal scoring exercise.
4.6 It is also important to note that the assessment is based on the current conditions and intrinsic qualities of each site and the associated scoring has been derived on this basis. It is possible that the scoring and relative ranking of sites could change in future if measures were to be put in place to improve their functioning as employment sites (for example through new infrastructure and servicing). Where there are known to be such improvements in the pipeline, these are noted but are not specifically factored in as part of the assessment.
Special Policy Areas
4.7 The Borough’s Core Strategy identifies a number of Special Policy Areas (SPAs) which form an important part of the spatial strategy. These areas have special policy status due to there being a significant level of change expected in the area, or a particular need for some change, either in terms of new development and infrastructure or through wider opportunities for improvements to be made to the physical environment. Some commentary is provided below with regards to the market positioning and potential for the SPAs to accommodate employment uses over the plan period.
SPA 1 – Town Centre
4.8 The main objective of this SPA is to strengthen and consolidate Watford’s position as a regional shopping (and leisure) destination, and to provide a more balanced provision of town centre facilities, infrastructure and uses, including
Watford Economic Growth & Delivery Assessment : Final Report
7179769v9 P35
employment. Its designation also recognises the important role that the retail and leisure sectors play in supporting the Borough’s wider economy. The Clarendon Road/Station Road employment site is included in SPA 1, and this clearly office cluster is considered separately below. However, outside this employment site and dispersed throughout SPA 1, is a relatively large provision of B1 office space and some small workshops/light industrial units. None of this provision has adequate critical mass to be considered as an employment location, most is long standing, poorly specified, and has limited market appeal.
4.9 Some buildings which were initially developed for employment use in the area have already been converted to another use, and some are currently earmarked to be put to another use - an example of this is the proposed change of use of first and second floor offices (B1 use) at JSA House, 110 The Parade to provide 64 flats. Analysis presented in the previous section shows that office space in the town centre (outside of the Clarendon Road /Station Road area covered by an Article 4 Direction) is at particular risk of conversion to residential use under Permitted Development rights. Nevertheless this area also contains one or two high quality office developments such as Royalty House on King Street and some reasonable sized office buildings, notably including Exchange House.
SPA 2 – Watford Junction
4.10 A major mixed-use regeneration scheme is proposed for this area, which includes part of the Imperial Way/Colonial Way employment site. The scheme will improve the station transport facilities and is intended to include residential, employment, retail and leisure accommodation. The scale and complexities of bringing this scheme forward firmly suggests that it remains a medium/long-term project. As noted earlier, Imperial Way/Colonial Way is an active employment site, but at the moment, other than this, there is very limited B use employment activity in SPA 2. Going forward, there clearly is an initial need to develop a strategy that addresses the issues that have held back the potential of Clarendon Road as an office location. However, once this is in place and the Clarendon Road ‘offer’ has been strengthened, there appears to be a good opportunity of extending Watford’s provision of office space, outwards from Clarendon Road so as to link with Central Park. Some of the accommodation in this new provision could provide for larger office occupiers.
SPA 3 – Health Campus
4.11 The regeneration of this site has been a long-term strategic objective for the Council, and a proposal for a major mixed-use scheme is now being progressed which will notably include a new hospital, a substantial residential provision (of up to 681 new dwellings), 3,685 m2 of offices/laboratories (B1a and B1b) and 8,477m2 of business space (B1c, B2, B8). The latter is earmarked to be developed in phases. Seven units providing 6,950 m2 will be
Watford Economic Growth & Delivery Assessment : Final Report
P36 7179769v9
developed between 2014 and 2016 in ‘Business Area (south)’, and following on from this 1,527m2 is intended to be provided in ‘Business Area (north)’.19
4.12 Local agents consulted were supportive of this scheme and expressed that there would be strong interest in ‘Business Area (south)’ if a long leasehold/freehold stake could be acquired in the individual units. Views on ‘Business Area (north)’ were that the space must be flexible, but probably not have an office content of more than 15%.
SPA 4 – Lower High Street
4.13 Currently this SPA overwhelmingly comprises retail warehousing and a large edge of town superstore, though it also features a small provision of B-use employment stock, most of which is B1 offices located on the High Street. The SPA includes the Gas Holder site, which has B-use employment potential. The site assessment for this site concluded warehousing, workshops and a small element of office space may be most suitable here, alongside the restoration of Grade II* listed Frogmore House. National Grid, who currently owns a large part of the site, have obtained permission to demolish the gas holder, and it is envisaged that market interest in this in this site will be strengthened if this occurs.
SPA 5 – Dome Roundabout
4.14 Out of town retail dominates this SPA, but it also notably features the large locally listed Odhams Press which is now operated by Trinity Mirror. The area also includes the ‘Red Bus’ Lemarie Centre for Charities, a small office building dating from the 60s; a fire station, an NHS clinic, a school, and a library. There is very little scope for any further development in this SPA. However, from an employment land perspective it may be prudent to give some thought to the possibility of Trinity Mirror deciding in the future that its facilities here are surplus to requirements. In such a case it is likely that there will be strong market interest in this site for a B use employment activity, though the cost of redevelopment and the need to retain its listed features will obviously limit its potential.
SPA 6 – Western Gateway
4.15 The main objective of this SPA is to deliver redevelopment that improves and upgrades this area from an economic development and environment perspective, and to capitalise on the potential of the new CRL station at Ascot Road. The strategy promotes the mixed-use redevelopment of the former Royal Mail sorting office site, to provide a variety of uses including a new school and foodstore, which has recently opened. While this scheme will provide a range of benefits to this part of Watford, it has been at the expense of losing much of what had been a reasonable sized employment site in totality. Agents consulted as part of this study were of the view that the parcel of land that has been provisionally earmarked as an office block as part of the
19 All of these details were derived from Planning Support Statement for the Health Campus dated March 2014
Watford Economic Growth & Delivery Assessment : Final Report
7179769v9 P37
mixed-use redevelopment of the Ascot Road site should be retained for employment use. However, viability issues may undermine the ability of a purely commercial scheme to come forward, whilst pressure is expected to build in the short term for the land to be redeveloped in time for the opening of the new CRL station in 2017. A more detailed assessment of the existing Ascot Road employment site is presented below.
4.16 The SPA also includes Watford Business Park, which has suffered from the encroachment of non B uses in the past and ideally measures should be put in place to restrict this in the future. Potentially there is also scope to provide Watford Business Park with a new access road linking up with Tolpits Lane, which will not only benefit this employment area but possibly the whole of SPA 6 and the nearby employment sites in Three Rivers District. In terms of transport connectivity, it is also clear that SPA 6 will be benefit significantly from the Croxley Rail Link.
Allocated sites
4.17 This section provides an overview of each of the allocated sites visited during the site assessment, with a corresponding reference number shown in square brackets.
Clarendon Road/Station Road [1]
4.18 Totalling 13.2 hectares this employment area is considered to be Watford’s prime office location. It comprises a mixture of some relatively new high quality offices and older secondary space, and is situated in very close proximity to Watford Junction station within SPA 1. The location has excellent access to labour and local services, and reasonable access to the strategic road network. However, at times, both Clarendon Road and Station Road can be particularly congested with traffic, and while the area is well serviced by a number of public car parks, most buildings in employment use have limited off street parking.
4.19 Some properties in the area have available space to let, or for sale, and as such were actively being marketed. However, local agents do not consider that this factor means that the area suffers from a high vacancy rate20 – indeed, in any market there is always an element of occupier churn. This is distinct from the fact that a number of buildings on Clarendon Road seem underutilised, as appears to be the case with Gresham House (53 Clarendon Road), or are no longer in office use. The latter particularly relates to 36 Clarendon Road, which comprises a 3-storey vacant office building. The impact of this empty building is compounded by the fact that the adjacent former Watford Registry Office (class D2) is also vacant, as is 32 Clarendon Road, a former bank. The nine storey Melton House situated at the corner of Clarendon Road and Shady Road is also no longer in office use, with planning permission has been granted here for a 157 bed hotel (Class C1)21, though at the time of the assessment this wasn’t operation. It is understood that there
20 As per the findings of the 2010 Employment Land Review 21 Permission for change use was initially granted in August 2008 (08/00931/COU), then renewed in 2011 (11/00872/EXT)

Watford Economic Growth & Delivery Assessment : Final Report
P38 7179769v9
had been no demand for this 5,820m2 building after Network Rail’s lease (who had been the previous occupier) expired in 2006, and that it had stood unoccupied for a period of two and half years prior to a change of use application being submitted in mid-200822. At the time of the site assessment it was also noted that the upkeep of several of these sites (which are either underutilised or are no longer in office use) has been neglected, and that some are now only used for car parking – this has a negative effect on the perception of this employment area.
4.20 There is now also pressure to provide housing (C3) in the area. Given that residential land values are so high in Watford this could significantly undermine the viability of this designated employment area as it would erode the possibility for new office developments to be brought forward. Consequently, it is considered that the use of Article 4 Direction powers to preserve the area’s office-based employment use is wholly appropriate.
4.21 In summary, Clarendon Road rates highly as an employment location when considered against assessment criteria. It is recommended that the site is retained and that a strategy is adopted to address the issues outlined in this assessment.
Fishers/Wiggenhall Road Industrial Estate [2]
4.22 This is a fully developed employment site which is within walking distance of the town centre, though only a modest amount of amenities are found close by. Amounting to 2.3 hectares the site has good access off Wiggenhall Road and mainly comprises workshops and small warehouse units. While some of the stock here is dated, generally it appears to be of reasonable quality and is likely to satisfy the requirements of local businesses and there is reported to be a good level of demand for the site. At the time of the assessment there was no vacant accommodation in this employment area.
4.23 In terms of environmental constraints, it is noted that part of this site is classified as being in flood zone 3 and it is understood that some flood damage was caused to premises in early 2014. Access to the strategic road network from this site is currently considered relatively poor because of the need to travel through Watford’s urban area.
4.24 In overall terms this site is rated as average against the site assessment criteria.
Imperial Way/Colonial Way [3]
4.25 Amounting to 33.4 hectares this irregular shaped employment site has been developed on a piecemeal basis over many years, and this is likely to imply that it is fragmented in terms of ownership. To the southwest of the site is Watford Junction, otherwise it is mainly surrounded by housing areas. It has good access to the strategic road network, though reasonably poor access to
22 As per the planning statement in support of 08/00931/COU
Watford Economic Growth & Delivery Assessment : Final Report
7179769v9 P39
local services. The site appears to comprise three distinct zones detailed as follows:-
Zone A – The western flank of the employment site, centred on Imperial Way but including Regal Way and part of Colonial Way. This area features several detached office buildings, including the prominently located 15 Imperial Way, which was formerly occupied by Volvo Penta but is now vacant, and Sovereign House, but the provision in this area is dominated by B8 uses including several trade counters at Imperial Park and the large Dhamecha cash & carry.
Zone B - The eastern section of Colonial Way and Rhodes Way, which particularly on the northern side of Colonial Way comprises a number of purpose-built, high quality office buildings, probably dating from the 1990s. It was noted that Rhodes Way includes Axis, which consists of several two storey high-tech units of reasonable quality.
Zone C – Central Park a relatively small cluster of high quality office accommodation fronting onto Reeds Crescent, alongside some recently developed housing. J D Weatherspoon and Hilton Worldwide have their head offices here.
4.26 A small proportion of the industrial accommodation in Zone A appears dated, notably including a building occupied by WT Boroughs Coachworks fronting onto Colonial Way. In addition, it was observed that a parcel of land at the end of Clive Way was currently in use as a car wash business. Arguably, such plots are suitable for redevelopment, though the overall potential in this respect appears to relate to a relatively small amount of employment land.
4.27 It is evident that both Zones A and B are suffering from the encroachment of non B class uses. For example, a yoga firm now operates from a unit on the Penfold Trading Estate, an application has been submitted to operate a gym at 15 Imperial Way23, and Axis 1 on Rhodes Way together with the adjoining former Sanyo building are earmarked to become the Watford University Technical College.24
4.28 The calibre of accommodation in Zones B and C generally appears to be very good and it seems unlikely that a significantly higher utilisation of employment land could be achieved in these areas.
4.29 Generally, the employment site has ample off-street parking and is well serviced by internal roads, although is congested at peak time, particularly in Zone A.
4.30 At the time of the assessment there were a number of vacant properties in all three zones, some industrial units, and some office accommodation (including as mentioned earlier the Volvo Penta unit). However, market feedback indicated that generally there is strong demand for all types of accommodation on this employment site. Overall, this site performs reasonably well against the
23 As per application ref: 14/00875/FUL 24 As detailed in the report for application ref: 14/00563/FUL
Watford Economic Growth & Delivery Assessment : Final Report
P40 7179769v9
assessment criteria, and can be regarded as one of Watford’s premier employment locations for industrial uses.
Greycaine Road/Odhams Industrial Estate [4]
4.31 This site consists of warehouses, industrial and office accommodation. The employment area effectively comprises two sites, split by the St Albans – Watford railway line. To the east, is the core of the employment area, a high-density warehouse and industrial estate, centred on Greycaine Road. This area predominantly comprises older stock in small and medium-sized units. It features a wholesale unit occupied by Booker and the Wenta Business, which comprises small workshops and office units and is heavily involved in local business support. The Greycaine Road area is generally well serviced by internal roads, and there appears to be a reasonable provision of off-site parking.
4.32 The site on the western side of the railway mainly comprises some industrial units forming part of the Odhams Industrial Estate and several warehouses, where occupiers include UPS and Diary Crest. This site is accessed either from Bushey Mill Lane or from Odhams Road. The latter connects with the access road for the adjacent Asda and at times the flow of traffic to and from this superstore is likely to restrict access to this part of the employment site.
4.33 Overall, this is a functioning employment location though several units in the Greycaine Road area were noted to be vacant at the time of the assessment. The site has good access to labour and local services, and has reasonable access to the strategic road network. Much of the stock in this employment area appears in need of renewal. Despite this, in overall terms the site performs reasonably well against the assessment criteria.
Watford Business Park [5]
4.34 Amounting to 29.5 hectares, Watford Business Park is one of the largest employment areas in the Borough and comprises a mix of warehouse, industrial and office accommodation. The north of the site includes part of Croxley Green Business Park, with modern, high quality accommodation. Occupiers in this part of this site notably include Teledyne TSS, who specialise in marine navigation systems, and Skillnet. Similarly, Caxton Court to the south of the site consists of relatively modern space which has been developed to a good standard; and this scheme is near to a large datacentre which also appears to be of a good build quality, albeit covering a large site area with a low employment density. The remaining stock in this employment area varies in terms age, speciation, and size; and includes Watford Enterprise Centre, which comprises small industrial units, and the building occupied by Flexspace, who provide office and workshop accommodation on a short term basis. Several buildings in the employment area were vacant at the time of the assessment, including the recently refurbished 32/34 Greenhill Crescent, which comprises 3,894m2 of warehouse space, though it is understood that this property is now under offer.

Watford Economic Growth & Delivery Assessment : Final Report
7179769v9 P41
4.35 Watford Business Park has relatively good access to the strategic road network, and strengthened by the W30 bus service has reasonable access to local labour. Despite the scale of the site however there is only a modest amount of amenities/services nearby. The single access road to the site could be a pinch point to traffic which may result in congestion at peak times. Consideration could be given to improving this by providing a second access road on the southern side of the site, linking up with Dwight Road and Tolpits Lane (A415). An access road here may also benefit the adjacent employment area in Three Rivers District.
4.36 While this is a fully developed employment site there may be some potential to achieve a higher utilisation of employment land. Potentially this may include upgrading some of the accommodation that is provided here and possibly also involve relocating some more space-intensive occupiers. For example, the unit currently occupied Jewsons includes a relatively large yard for the storage of aggregates which only seems to be partially used. In addition, given that several car showrooms currently feature in the employment area it may be prudent to consider whether it is appropriate to introduce measures to restrict further encroachment of this sui generis use, or to encourage these activities to locate elsewhere (for example along the A41 corridor) so that the B-class potential of the site can be maximised. On the whole this employment site performed relatively well when considered against assessment criteria.
Ascot Road [6]
4.37 This site is located at the gateway to the Croxley and Watford Business Parks, and has relatively good access to the strategic road network. To the north it borders the mixed-use redevelopment of much of the former Sun Printers site, fronting Whippendell Road. To the east are playing fields and the St Anthony’s Primary School, and in the southwest is Watford Business Park.
4.38 The disused railway line which will become part of the Croxley Rail Link runs through the site. On the northern side of the railway line the site comprises a relatively small, overgrown plot. The majority of the site is situated south of the railway line, and this area previously comprised a large Royal Mail sorting office and the Ascot Centre, which features several industrial warehouse units. However, a new mixed-use development is earmarked to occupy this part of the site. The sorting office has therefore now been demolished, and some of the land has already been redeveloped to provide a Morrisons supermarket which has recently opened. A certain amount of information relating to this mixed-use scheme was included in the committee report for the proposed development of the Morrisons25, including an indicative masterplan for the mixed-use scheme, which other than the supermarket, illustrates a new school, three residential blocks, a hotel with a restaurant, a multi-storey car park, and a single office block. While this planned mixed-use development may severely reduce the employment potential of this site it is noted that the office element of the scheme is earmarked to have a prominent position, directly facing onto
25 Committee report in respect 12/00793/FULM, dated 22 November 2012

Watford Economic Growth & Delivery Assessment : Final Report
P42 7179769v9
Ascot Road at a key gateway location into the town. The committee report also highlights some potential environmental constraints at this site, including land and groundwater contamination and archaeological remains.
4.39 As regards to the northern part of the site, the Sun Clock Tower has previously been subject to proposals for an office development. However, in late 2013 an application was lodged to develop a 25 storey landmark residential tower on the site.26 Any scheme that is developed on this parcel of land will be constrained by the need to retain the clock tower and potentially limited by the amount of off street car parking that can be provided.
4.40 In summary, this is a good employment site when considered against assessment criteria and has the potential to perform a much stronger role in accommodating future business growth in the Borough, supported by the introduction of the Croxley Rail Link and other infrastructure and public realm improvements through the wider Western Gateway regeneration programme.
Sandown Road [7]
4.41 Totalling 4.13 hectares, this rectangular shaped site extends down most of the eastern side of Sandown Road, while on the western side of the road there is housing. Immediately to the south of the site and also on Sandown Road, is Chiswell Court, a residential development, and to the east the site is flanked by a railway line. It consists of the very long standing Mowart, Paramount, and Sandown Road industrial estates, which mostly comprise small light industrial units. In addition, to the north of the site is the Eclipse Centre, which has been developed much more recently and comprises office space and some warehousing.
4.42 The quality of the accommodation in the industrial estates varies – some is reasonable, some is dated and possibly no longer fit for purpose. While the latter may fulfil a local requirement for affordable business space, it is considered to have very limited market appeal, and may entail poor utilisation of the site. At the time of the assessment there was a reasonable amount of activity in this employment area, though this particularly involved Abtap, a trade counter. It was also noted that only a small number of units were vacant.
4.43 The site has inadequate access to the strategic road network. In addition, parking on Sandown Road appears constrained and the condition of the road itself is very poor. Nevertheless, there is a certain amount off street parking within each of the estates and at the Eclipse Centre.
4.44 The Council has identified this site as having the potential for mixed-use development. However, there may be costs associated with potential remediation works which could impact on the viability of bringing forward new employment space. In overall terms the site achieved an average score in this assessment.
26 Application reference 13/00931/OUTM

Watford Economic Growth & Delivery Assessment : Final Report
7179769v9 P43
Non allocated sites
4.45 The following section provides an overview of the non-allocated sites assessed as part of the study.
BT Depot, Orphanage Road [8]
4.46 This relatively large, triangular shaped site is located on the southern side of Orphanage Road, and is bounded by the railway line to the southwest. The site is a functioning employment location, which is mainly used to store and repair BT vehicles. It is well located in relation to local labour, public transport and local services; and has good access to the strategic road network via the A408, though Orphanage Road can suffer from heavy traffic. If the site were to become available for development, it is well located and has prominent frontage onto Orphanage Road implying that it may be suitable for B1 office space. In summary, this is a relatively good employment site when considered against assessment criteria.
Gas Holder Site [9]
4.47 This site amounts 1.87 hectares and is located near to the southern end of Lower Higher Street in SPA 4. It lies between the eastern side of Lower Higher Street and the River Colne, fronting onto Westfields Way (the A41) to the north, and extending just beyond Lower Higher Street‘s junction with Dalton Way to the south. The site has an irregular shape, almost taking the form of a figure of eight, and the southern end is set back from Lower Higher Street behind several properties fronting onto this street.
4.48 Currently, the site comprises the now redundant gas holder and a number of buildings, including Frogmore House, a Grade II* listed property which is vacant and partially derelict; a terrace of four locally listed houses known as Frogmore Cottages, which are in residential use; and several small workshops and open areas in use for coach parking. The site has two relatively good access roads, and is considered to have good access to the strategic road network although is subject to congestion at peak times. In addition, Bushey mainline station is just a short walk from the site. However, it is located in Flood Risk Zone 3 and therefore flood mitigation works may be required. In addition, there is a wildlife site within 250 metres of the site.
4.49 In late 2013, National Grid, who currently owns a large part of the site, obtained permission to demolish the gas holder.27 Market interest in this in this site will be strengthened if this occurs. The site offers potential for more intensive mixed industrial and warehousing uses, but would need to be considered alongside flood mitigation measures and the potential need to support restoration of Frogmore House. On the whole this employment site performed relatively well when considered against assessment criteria.
27 Application reference: 13/01011/DEM
Watford Economic Growth & Delivery Assessment : Final Report
P44 7179769v9
Sydney Road Site [10]
4.50 Located on the southern side of Sydney Road, in a mainly residential area, this is a functioning employment area with some average quality commercial buildings including light industrial units and warehousing. The removals and storage business WH Humphreys & Son have their premises on this employment site, as do a number of small, specialist manufacturing firms, including Three Rivers (Displays) Ltd and Fine Cut Finishing. However, it seems that the site is mostly used for non-B use employment activity. Indeed the largest building on the site, which according to VOA data amounts 4,753m2, is currently used by Watford Laundries & Cleaners. In addition, a good amount of land is used by a car wash business, and the Watford Martial Arts Centre is also based here. The site has no direct access to an A road and Highway access is poor, but it does have good access to labour and local services, and a tube station is within walking distance. In overall terms this site achieved an average score in this assessment.
Metal works – Whippendell Road [11]
4.51 This square shaped site fronts onto Whippendell Road to the north and Sydney Road to the south, and comprises the former Wemco factory, which dates from the 1920s and is locally listed. Whippendell Group owns the site but has downsized and rents out their surplus accommodation, which has been reconfigured to mainly comprise small office and storage units, to SMEs. About thirty businesses currently operate from this accommodation and there is reported to be strong demand for the office units. The site has relatively good access to the A415, and is well located in terms of the Croxley Rail Link. However, parking on the site is very limited. Whippendell Group currently has an arrangement with the Council whereby it can obtain parking permits for some of its tenants, but this scheme is being withdrawn next year, and this may force some SMEs to move away. In overall terms this site achieved a reasonable score in this assessment. Given that this is an active employment site and that it accommodates a high number of SMEs it is recommended that it should be designated as an employment area.
Mothercare [12]
4.52 Fronting onto Cherry Tree Road, the Mothercare site is a located in a predominately residential area. There are allotments to the northwest of the site, but otherwise it is surrounded by housing. Local access is therefore poor as this is via residential streets. The site consists of a four storey white rendered building dating from the 1930s, which mainly comprises B1 office accommodation and is the head office of Mothercare. The building is well maintained, and a number of improvements have been made to it over the years – such as the installation of an air conditioning. While the building appears to currently satisfy Mothercare’s occupational needs, in 2012 the firm
Watford Economic Growth & Delivery Assessment : Final Report
7179769v9 P45
announced that it may need to make up to 98 redundancies at this site28. If the site were to become available for development in the future, it seems less likely that a site of this sizee would be attractive to other potential occupiers given the poor local road access and proximity to residential uses. In summary, this site achieved an average score in the assessment.
Nissan Garage [13]
4.53 This triangular-shaped site is situated on the western side of Lower Higher Street at the junction with Westfields Way (the A41) in SPA 4. It has good access to the strategic road network and is within walking distance of Watford High Street station. The site is mainly fully developed as a Nissan showroom and garage. To the rear of this, and with access off Local Board Road, is Brookside Works, a locally listed industrial building, which has recently been renovated as small office/workshop units. Beyond this, and also accessed from Local Board Road, is the locally listed Pump House, used as an arts centre and theatre. These buildings are clustered close together, and if this was to form part of the site there would be very little scope for any infill. If the Nissan site became available, it would have potential for employment uses. Potentially, this could entail small office/workshop units and effectively extend the scheme at Brookside Works. In overall terms this site achieved an average score in this assessment.
Rickmansworth Road [14]
4.54 The Rickmansworth Road employment site is located on the north side of Rickmansworth Road, immediately to the west of Watford Grammar School for Boys. Comprising a small cluster of dated commercial buildings it is mostly set back from Rickmansworth Road (A412) and mainly surrounded by housing. The site is active and in reasonable condition. The self-storage business Blue Box Storage currently operates from a number of buildings on the eastern side of the site, but it is mainly occupied by DDD, whose holdings here include a two storey factory used for manufacturing pharmaceutical products. The site is close to Watford underground station, although this will close following the opening of the Croxley Rail Link. While the A412 provides good connections to the M1 and the M25, access directly onto the site can be tight particularly for larger vehicles. The site includes ample off street parking. However, Rickmansworth Road is exceptionally busy, particularly at peak times. Some of the buildings on this site may come to the end of their natural life in the next 10-15 years. In summary, this is an average employment site when considered against assessment criteria.
Shakespeare Industrial Estate [15]
4.55 This is a long standing and active employment site, which mainly comprises small industrial workshops, but there are also a number of small office units
28 As reported in reported in the Daily Telegraph (12/4/2012) http://www.telegraph.co.uk/finance/newsbysector/retailandconsumer/9201093/Mothercare-From-baby-boom-to-mid-life-crisis.html

Watford Economic Growth & Delivery Assessment : Final Report
P46 7179769v9
which are of recent construction. The site is surrounded by housing apart from the western side which is railway land and a wildlife corridor. It seems that the industrial estate has always been, and continues to be, a source of employment for people living in this part of Watford, and a broad range of services within walking distance. Access to the site is via several relatively narrow residential streets, where residential parking can clearly be an issue. At the time of the site visit there were also a significant volume of vehicles parked within the site, limiting manoeuvrability for larger vehicles. Despite being relatively close to the A412 and the A41, the site is considered to have relatively poor access to the strategic road network, as this will entail travelling through at times narrow and/or busy residential streets. In overall terms this site achieved a poor score in this assessment, although seems to be continuing to meet small-scale local needs and has been subject to some recent investment.
Wiggenhall Road [16]
4.56 This site is located within the area for the new Health Campus, and as such it will be affected by the Compulsory Purchase Order that is connected with this development. It is situated immediately to the south of Wiggenhall Road Industrial Estate (as detailed earlier), between the disused railway line, the river and Wiggenhall Road; and was formerly used for railway purposes. The site is used by several businesses mainly for storage purposes. Although it amounts to 3.65 hectares a large part of this site is unused, neglected and overgrown. The site has poor local and strategic access and only a modest amount of amenities are found nearby.
4.57 In overall terms, this is the lowest scoring site in this assessment, reflecting the low value uses currently occupying the site. It will however benefit from new infrastructure and upgrading as part of the Health Campus development and it is therefore highly likely that the site’s suitability for business uses and associated scoring will increase over time.
Woodside Leisure Park [17]
4.58 This site currently comprises a multiplex cinema (operated by Vue), a bowling alley and restaurants. The 3.15 hectare site is fully developed, and includes a large surface car park. None of the units at the leisure park were vacant at the time of the site visit. Currently, this is the only cinema complex in Watford. As the site fronts onto the North Orbital Road (the A405) and is only a short distance away from Junction 6 of the M1, this site, is considered to have excellent access to the strategic road network. With the exception of the A405, the site is bordered by trees, beyond which there is housing and the Woodside playing fields. Back in 2008 it was suggested that Vue may relocate from this site.29 If the site were to become available for development in the future, warehousing/distribution uses would be particularly suitable here although may be limited by the size of the site. As a former landfill site, any future
29 As documented in ‘shlaa-volume-3c---woodside.pdf’ as available via: http://www.dacorum.gov.uk/docs/default-source/planning-development/shlaa-volume-3c---woodside.pdf?Status=Master&sfvrsn=0

Watford Economic Growth & Delivery Assessment : Final Report
7179769v9 P47
redevelopment may be subject to remediation. Alternatively the site would also be suitable for a small business park.
Conclusions
4.59 Overall, the assessments of identified employment sites indicate that the Borough contains a reasonable range of employment sites of differing quality and type, totalling just under 128 ha. 41% of sites (in land area terms) have a specific policy status and are safeguarded for employment uses and are therefore afforded a degree of protection from competing land uses. Most of the sites accommodated a combination of both office (B1a/b) and industrial (B1c/B2/B8) uses, although some specific, single use sites were also evident.
4.60 Generally, the range of sites comprises of good quality, well maintained stock with low vacancy levels. This demonstrates that this type of space meets requirements of the market. This is reflected in the assessment rankings with 88% of sites achieving good or average quality status (96% of employment land). The assessment process identified three high performing, good quality sites, 12 average performing sites with just two sites ranked as poor quality.
Table 4.1 Summary Site Assessment Matrix
Source: NLP analysis
Site Ref
Site Name Site statusSize (ha)
Potential UsesTotal Score
/ 30Rank
1 Clarendon Road/Station Road EMP 1 site 13.2 B1a 26
17 Woodside Leisure ParkNon allocated site (Leisure Park)
3.2 B8 24
3 Imperial Way/Colonial Way EMP 1 site 33.4 B1, B2 and B8 23
5 Watford Business Park EMP 1 site 29.6 B1, B2 and B8 21
4Greycaine Road/Odhams Trading Estate
EMP 1 site 18.1 B1, B2 and B8 20
8 BT Depot, Reeds Crescent Non allocated site 1.9 B1, B2 and B8 20
6 Ascot RoadEMP1 Site (Potential for Mixed-use)
8.2 All types of B1, B2 19
9 Gas Holder Site Non allocated site 1.9 B1, B2 and B8 19
2Fishers/Wiggenhall Road Industrial Estate
Policy EMP 1 site 2.3B1b, B1c, B2 and B8
18
11 Metal works - Whippendell Road Non allocated site 0.6 All types of B1, B2 18
10 Sydney Road Site Non allocated site 1.8 All types of B1, B2 17
12 Mothercare Non allocated site 1.6 B2, B8, Live Work 16
14 Rickmansworth Road Non allocated site 2.3All types of B1 & B8
16
7 Sandown RoadEMP1 Site (Potential for Mixed-use)
4.4B1, B2, B8 and Live work
16
13 Nissan Garage Non allocated site 0.5 All types of B1, B2 16
15 Shakespeare Industrial Estate Non allocated site 1.4 All types of B1 15
16 Wiggenhall Road Non allocated site 3.7 B8 14
Good
Average
Poor

Watford Economic Growth & Delivery Assessment : Final Report
P48 7179769v9
5.0 Impact of Major Development Projects
5.1 This section sets out the economic and financial impacts created by a number of major development projects coming forward within Watford over the plan period to 2031, taking into consideration both the gross outputs of these sites after the developments have been completed, as well as the net additional impacts of the developments over and above existing employment and output levels in Watford.
5.2 These developments have been identified as possible step-change projects for the local economy with regards to the scale and nature of employment growth and regenerative value they will deliver. The analysis of the socio-economic impacts for each of the committed projects in Watford has drawn upon information obtained from Watford Borough Council and other stakeholders, as well as industry standard assumptions, to assess the socio-economic benefits that would arise from the developments. The summary provided in this section is based upon a series of more detailed individual economic impact reports that have been prepared separately for the Council.
5.3 The location of each of the five major development projects planned in Watford during the plan period is shown in Figure 5.1. This also shows the proposed route of the Croxley Rail Link which will play a key role in unlocking these sites, but which has been subject to a separate socio-economic impact appraisal.
Figure 5.1 Location of Major Development Projects in Watford
Source: NLP analysis
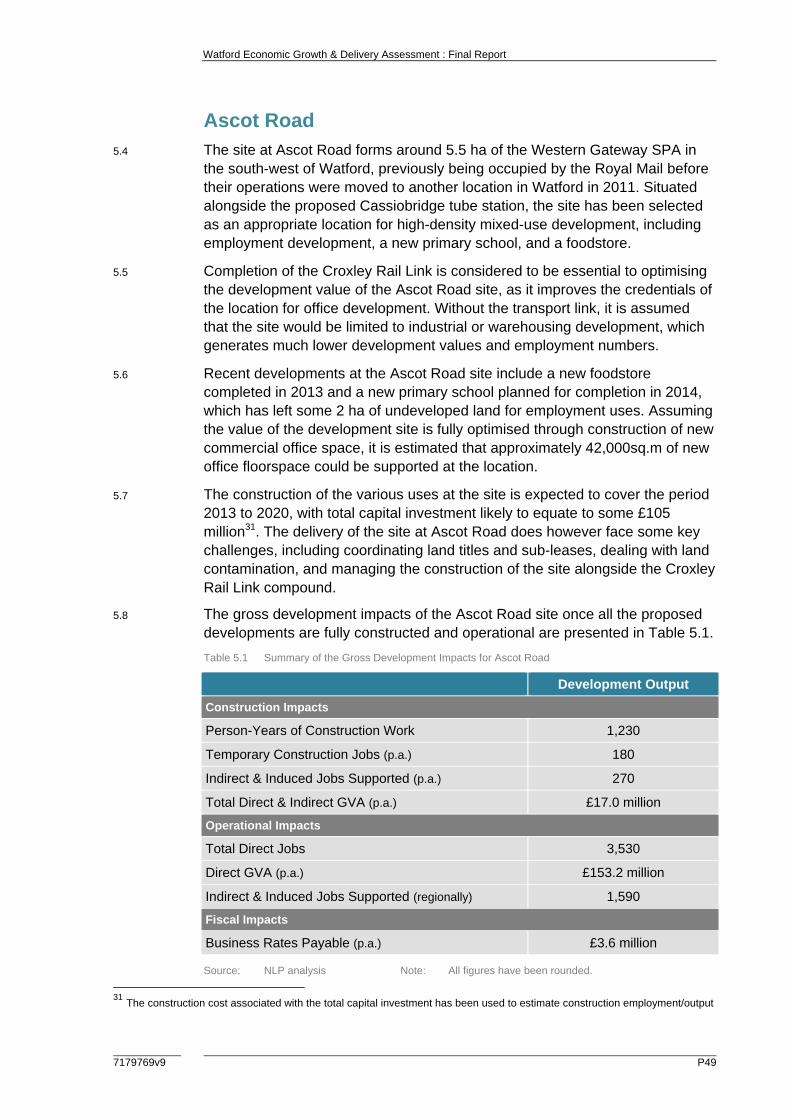
Watford Economic Growth & Delivery Assessment : Final Report
7179769v9 P49
Ascot Road 5.4 The site at Ascot Road forms around 5.5 ha of the Western Gateway SPA in
the south-west of Watford, previously being occupied by the Royal Mail before their operations were moved to another location in Watford in 2011. Situated alongside the proposed Cassiobridge tube station, the site has been selected as an appropriate location for high-density mixed-use development, including employment development, a new primary school, and a foodstore.
5.5 Completion of the Croxley Rail Link is considered to be essential to optimising the development value of the Ascot Road site, as it improves the credentials of the location for office development. Without the transport link, it is assumed that the site would be limited to industrial or warehousing development, which generates much lower development values and employment numbers.
5.6 Recent developments at the Ascot Road site include a new foodstore completed in 2013 and a new primary school planned for completion in 2014, which has left some 2 ha of undeveloped land for employment uses. Assuming the value of the development site is fully optimised through construction of new commercial office space, it is estimated that approximately 42,000sq.m of new office floorspace could be supported at the location.
5.7 The construction of the various uses at the site is expected to cover the period 2013 to 2020, with total capital investment likely to equate to some £105 million31. The delivery of the site at Ascot Road does however face some key challenges, including coordinating land titles and sub-leases, dealing with land contamination, and managing the construction of the site alongside the Croxley Rail Link compound.
5.8 The gross development impacts of the Ascot Road site once all the proposed developments are fully constructed and operational are presented in Table 5.1.
Table 5.1 Summary of the Gross Development Impacts for Ascot Road
Development Output
Construction Impacts
Person-Years of Construction Work 1,230
Temporary Construction Jobs (p.a.) 180
Indirect & Induced Jobs Supported (p.a.) 270
Total Direct & Indirect GVA (p.a.) £17.0 million
Operational Impacts
Total Direct Jobs 3,530
Direct GVA (p.a.) £153.2 million
Indirect & Induced Jobs Supported (regionally) 1,590
Fiscal Impacts
Business Rates Payable (p.a.) £3.6 million
Source: NLP analysis Note: All figures have been rounded.
31 The construction cost associated with the total capital investment has been used to estimate construction employment/output

Watford Economic Growth & Delivery Assessment : Final Report
P50 7179769v9
Net Additional Impacts
5.9 The assumptions underpinning the assessment of the net additional impacts of the proposed developments at Ascot Road are summarised as follows:
No employment activities were maintained at the site prior to the build-out of the new foodstore in 2013, meaning that the net capacity of the site also equates to the gross development impact of the site (i.e. 3,530 jobs).
Taking into account various property and labour market factors, as well as the high office job projections for Watford, it is assumed that employment displacement relating to the new commercial office space will be low (15%).
Considering the location of the development site, as well as the identified capacity for more convenience shopping space in Watford, it is assumed that employment displacement relating to the new foodstore will be low (10%). No displacement is expected in relation to employment supported at the new primary school.
5.10 With net capacity of Ascot Road estimated at 3,530 jobs, and the total level of displacement equating to around 510 jobs, it is assumed that the net additional impact of the development project equates to 3,020 jobs (Table 5.2).
Table 5.2 Summary of the Net Additional Development Impacts for Ascot Road
Development Output
Operational Impacts
Total Direct Jobs 3,020
Direct GVA (p.a.) £130.8 million
Indirect & Induced Jobs Supported (locally) 880
Indirect & Induced Jobs Supported (regionally) 1,360
Source: NLP analysis Note: All figures have been rounded.
Town Centre Enhancements
5.11 The redevelopment of Watford town centre incorporates two key elements: the regeneration of Charter Place and the enhancement of the town centre parade which includes development of a new market and improvements to the public realm.
5.12 The Charter Place site covers some 2 ha of land in the Town Centre SPA. The redevelopment of the existing shopping centre at the site aims to significantly increase the amount of retail, hospitality and leisure floorspace delivered within Watford, contributing to a more diverse and modern town centre offering. Once completed, the site will represent one of the largest shopping centres within the UK, with some 34,450sq.m of retail, hospitality and leisure space (not including a new nine screen cinema plaza) supported within the town centre.
5.13 Improvements to the overall town centre area relates to both the enhancement of the public realm at Watford Parade and along the High Street, as well as the redevelopment of the market at Charter Place. It is anticipated that the new

Watford Economic Growth & Delivery Assessment : Final Report
7179769v9 P51
market place will have a capacity for approximately 72 pitches, with 30 of these stalls designated for temporary usage. It is also assumed that 22 of the current market pitches will be relocated to the new market. The overall impacts of the improvements to the town centre public realm will be to increase footfall and dwelling time, as well as to enhance the vibrancy and viability of the retail area.
5.14 The various town centre development projects will be completed between 2013 and 2017, with much of the improvements to the public realm having already been finished. The construction cost to redevelop the Charter Place shopping centre is estimated to be around £100 million, while improvements to the town centre are estimated at approximately £8 million. The total capital investment required to undertake the town centre enhancements therefore amounts to £108 million.
5.15 The total gross development impacts of the various town centre improvement projects once fully constructed and operational are presented in Table 5.3.
Table 5.3 Summary of the Gross Development Impacts for the Town Centre Enhancements
Development Output
Construction Impacts
Person-Years of Construction Work 1,270
Temporary Construction Jobs (p.a.) 420
Indirect & Induced Jobs Supported (p.a.) 640
Total Direct & Indirect GVA (p.a.) £40.8 million
Operational Impacts
Total Direct Jobs 2,220
Direct GVA (p.a.) £54.3 million
Indirect & Induced Jobs Supported (regionally) 1,000
Fiscal Impacts
Business Rates Payable (p.a.) £2.7 million
Source: NLP analysis Note: All figures have been rounded.
Net Additional Impacts
5.16 The assumptions underpinning the assessment of the net additional impacts of the proposed town centre enhancements are summarised as follows:
Some 22 existing stalls will relocate to the new market place (equivalent to 30 jobs), while around 1,020 existing jobs at the Charter Place shopping centre will be retained at the site after the redevelopments. The net development capacity of the two town centre sites therefore equates to some 1,170 jobs.
With the redevelopment of the Charter Place shopping centre representing a step-change in the retail offering in Watford, as well the local economy having capacity for further comparison shopping space, it is assumed that employment displacement relating to the new shopping centre will be low

Watford Economic Growth & Delivery Assessment : Final Report
P52 7179769v9
(10%). This also takes into account the forecasted decline in retail jobs over the plan period.
No displacement is expected in relation to the new market place due to the distinctive nature of the market and the limited competition within Watford.
5.17 With net capacity of the town centre sites estimated at 1,170 jobs, and the total level of displacement relating to the shopping centre at Charter Place equating to around 110 jobs, it is assumed that the net additional development impact of the town centre projects will amount to approximately 1,060 jobs (Table 5.4).
Table 5.4 Summary of the Net Additional Development Impacts for the Town Centre Enhancements
Development Output
Operational Impacts
Total Direct Jobs 1,060
Direct GVA (p.a.) £23.9 million
Indirect & Induced Jobs Supported (locally) 310
Indirect & Induced Jobs Supported (regionally) 470
Source: NLP analysis Note: All figures have been rounded.
Watford Business Park
5.18 Watford Business Park (WBP) forms around 26.5 ha of the Western Gateway SPA in the south-west of Watford, supporting approximately 100 businesses and employing in the region of 1,120 people. While considered a strategic landholding of major employment significance, a large portion of the premises within the site are deteriorating and are of poor specification, with poor supporting road and communication infrastructure within the area.
5.19 As with Ascot Road, the forthcoming Croxley Rail Link will significantly elevate the strategic importance of the employment area, particularly in terms of reviving the location for commercial office developments. The redevelopment of the site does however face some major challenges in terms of rationalising landholdings, which if not overcome, could reduce the value of redevelopment and result in the further deterioration of WBP.
5.20 The redevelopment of WBP relates to a number of sites in the northern part of the employment area that are currently underperforming in terms of land-use efficiency and quality. Intensification of these sites is a key component of the development project as existing land-uses in WBP are highly inefficient (at around 1 job per 76sq.m) compared with Croxley Green Business Park (1 job per 22sq.m). From these developments, the quantum of floorspace accommodated at WBP will equate to around 80,000sq.m, equivalent to an increase of 3,600sq.m, which will support employment growth within both office and industrial based sectors.
5.21 The phased redevelopment of WBP is expected to occur over a fifteen year timeframe to 2030, although in reality its implementation will be largely based
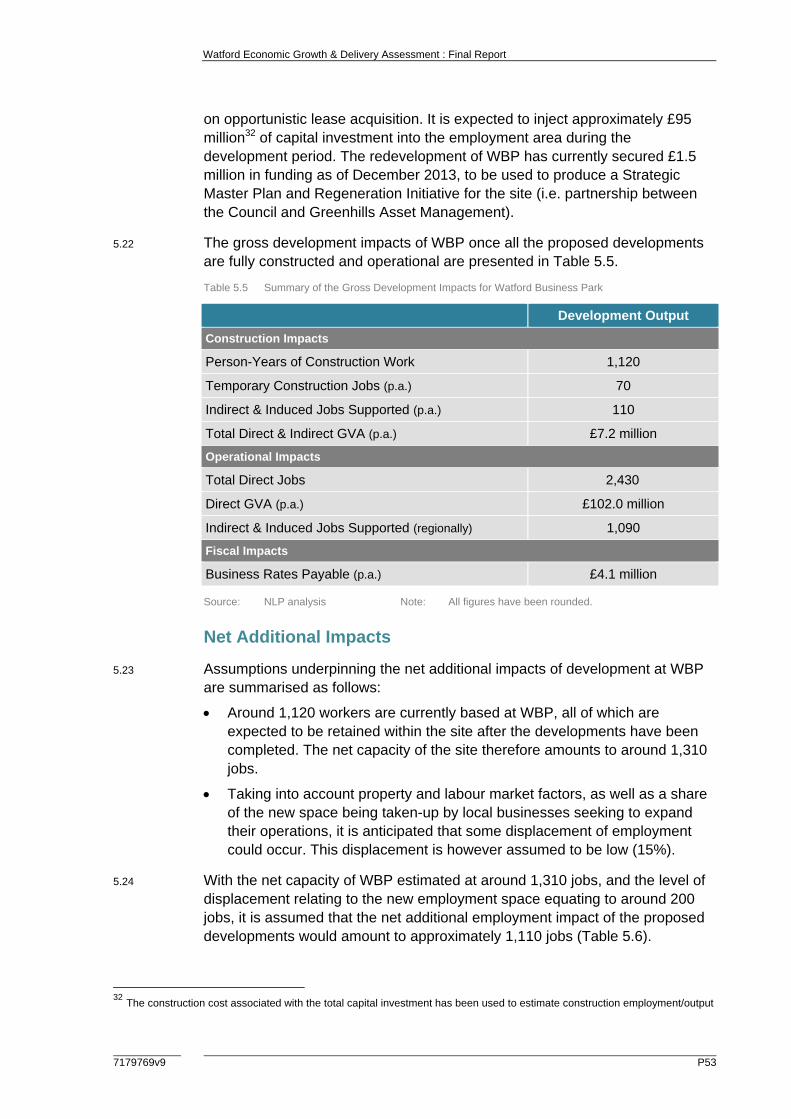
Watford Economic Growth & Delivery Assessment : Final Report
7179769v9 P53
on opportunistic lease acquisition. It is expected to inject approximately £95 million32 of capital investment into the employment area during the development period. The redevelopment of WBP has currently secured £1.5 million in funding as of December 2013, to be used to produce a Strategic Master Plan and Regeneration Initiative for the site (i.e. partnership between the Council and Greenhills Asset Management).
5.22 The gross development impacts of WBP once all the proposed developments are fully constructed and operational are presented in Table 5.5.
Table 5.5 Summary of the Gross Development Impacts for Watford Business Park
Development Output
Construction Impacts
Person-Years of Construction Work 1,120
Temporary Construction Jobs (p.a.) 70
Indirect & Induced Jobs Supported (p.a.) 110
Total Direct & Indirect GVA (p.a.) £7.2 million
Operational Impacts
Total Direct Jobs 2,430
Direct GVA (p.a.) £102.0 million
Indirect & Induced Jobs Supported (regionally) 1,090
Fiscal Impacts
Business Rates Payable (p.a.) £4.1 million
Source: NLP analysis Note: All figures have been rounded.
Net Additional Impacts
5.23 Assumptions underpinning the net additional impacts of development at WBP are summarised as follows:
Around 1,120 workers are currently based at WBP, all of which are expected to be retained within the site after the developments have been completed. The net capacity of the site therefore amounts to around 1,310 jobs.
Taking into account property and labour market factors, as well as a share of the new space being taken-up by local businesses seeking to expand their operations, it is anticipated that some displacement of employment could occur. This displacement is however assumed to be low (15%).
5.24 With the net capacity of WBP estimated at around 1,310 jobs, and the level of displacement relating to the new employment space equating to around 200 jobs, it is assumed that the net additional employment impact of the proposed developments would amount to approximately 1,110 jobs (Table 5.6).
32 The construction cost associated with the total capital investment has been used to estimate construction employment/output

Watford Economic Growth & Delivery Assessment : Final Report
P54 7179769v9
Table 5.6 Summary of the Net Additional Development Impacts for Watford Business Park
Development Output
Operational Impacts
Total Direct Jobs 1,110
Direct GVA (p.a.) £47.8 million
Indirect & Induced Jobs Supported (locally) 320
Indirect & Induced Jobs Supported (regionally) 500
Source: NLP analysis Note: All figures have been rounded.
Watford Health Campus
5.25 The existing Watford Health Campus (WHC) site (i.e. excluding Farm Terrace) comprises around 26.5 ha of land in the south of the Borough. The site is primarily occupied by ad-hoc facilities used by the general hospital, with the Cardiff Road Industrial Estate and Wiggenhall Road Goods Yard also situated within the area. These industrial sites have recently been vacated which means the only activities to be retained within WHC are related to the hospital.
5.26 The master plan for WHC will be developed in phases over the period 2014 to 2023, and will include around 8,500sq.m of industrial and warehousing space, 3,700sq.m of office and research space, 8,800sq.m of retail and leisure space, 80 bedroom hotel, and around 750 new residential dwellings. In addition, the master plan provides space to accommodate future expansion of the hospital facilities. The regeneration of the underused land at WHC will help deliver new growth in a variety of employment sectors, provide much needed housing and transform the area into considerably more effective use.
5.27 It is estimated that the total capital investment required to deliver the WHC master plan will equate to around £300 million33. This includes the abnormally high costs associated with land remediation, construction of road infrastructure, and other public realm and open space improvements.
5.28 The gross development impacts of WHC once all the proposed developments are fully constructed and operational are presented in Table 5.7.
33 The construction cost associated with the total capital investment has been used to estimate construction employment/output
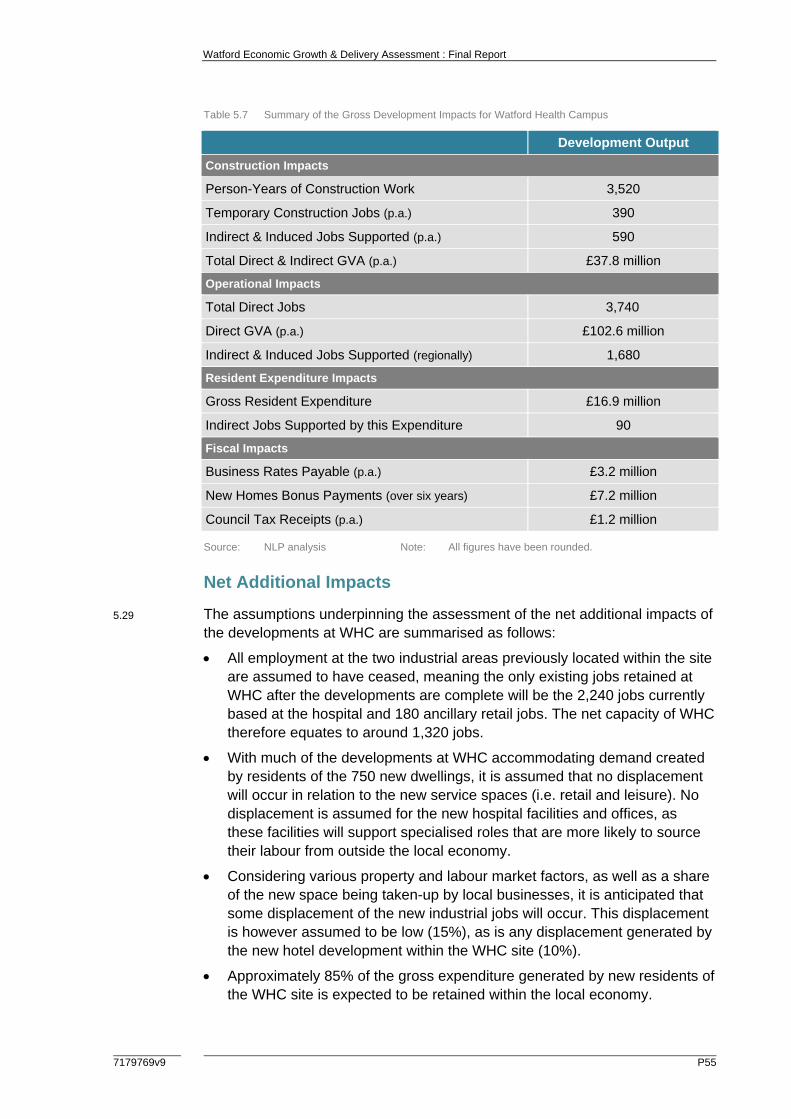
Watford Economic Growth & Delivery Assessment : Final Report
7179769v9 P55
Table 5.7 Summary of the Gross Development Impacts for Watford Health Campus
Development Output
Construction Impacts
Person-Years of Construction Work 3,520
Temporary Construction Jobs (p.a.) 390
Indirect & Induced Jobs Supported (p.a.) 590
Total Direct & Indirect GVA (p.a.) £37.8 million
Operational Impacts
Total Direct Jobs 3,740
Direct GVA (p.a.) £102.6 million
Indirect & Induced Jobs Supported (regionally) 1,680
Resident Expenditure Impacts
Gross Resident Expenditure £16.9 million
Indirect Jobs Supported by this Expenditure 90
Fiscal Impacts
Business Rates Payable (p.a.) £3.2 million
New Homes Bonus Payments (over six years) £7.2 million
Council Tax Receipts (p.a.) £1.2 million
Source: NLP analysis Note: All figures have been rounded.
Net Additional Impacts
5.29 The assumptions underpinning the assessment of the net additional impacts of the developments at WHC are summarised as follows:
All employment at the two industrial areas previously located within the site are assumed to have ceased, meaning the only existing jobs retained at WHC after the developments are complete will be the 2,240 jobs currently based at the hospital and 180 ancillary retail jobs. The net capacity of WHC therefore equates to around 1,320 jobs.
With much of the developments at WHC accommodating demand created by residents of the 750 new dwellings, it is assumed that no displacement will occur in relation to the new service spaces (i.e. retail and leisure). No displacement is assumed for the new hospital facilities and offices, as these facilities will support specialised roles that are more likely to source their labour from outside the local economy.
Considering various property and labour market factors, as well as a share of the new space being taken-up by local businesses, it is anticipated that some displacement of the new industrial jobs will occur. This displacement is however assumed to be low (15%), as is any displacement generated by the new hotel development within the WHC site (10%).
Approximately 85% of the gross expenditure generated by new residents of the WHC site is expected to be retained within the local economy.

Watford Economic Growth & Delivery Assessment : Final Report
P56 7179769v9
5.30 With the net capacity of WHC estimated at around 1,320 jobs, and the level of displacement relating to the new industrial space and hotel equating to 40 jobs, it is assumed that the net additional impact of the developments would amount to approximately 1,280 jobs (Table 5.8).
Table 5.8 Summary of the Net Additional Development Impacts for Watford Health Campus
Development Output
Operational Impacts
Total Direct Jobs 1,280
Direct GVA (p.a.) £41.4 million
Indirect & Induced Jobs Supported (locally) 370
Indirect & Induced Jobs Supported (regionally) 580
Resident Expenditure Impacts
Additional Resident Expenditure £14.4 million
Indirect Jobs Supported by this Expenditure 80
Source: NLP analysis Note: All figures have been rounded.
Watford Junction
5.31 The development site at Watford Junction is a piece of land adjacent to the railway station that essentially comprises the Watford Junction SPA. Existing uses at the site include employment, retail and station parking, while the proposed site also comprises some areas of vacant land.
5.32 The regeneration of the Watford Junction site will deliver a high-density mixed-use scheme that will include an enhanced transport interchange, new homes, employment space, retail and leisure space, and community facilities. As with the other major development projects in Watford, the catalyst for development at Watford Junction is the construction of the Croxley Rail Link, which will improve access to the site and increase the flow of passengers.
5.33 Due to the proposed development project still being in the conceptual stage, the precise make-up of the scheme is yet to be determined. For this reason, the assessment of the scheme only considers the operational impacts associated with 46,500sq.m of office space and 1,800 new homes to be constructed in the site. This assessment of the operational impacts of the proposed development can therefore be considered conservative, as further employment will subsequently be generated at the site from new retail, leisure and other civic developments.
5.34 It is estimated that the total capital investment needed to fully develop the site at Watford Junction (i.e. relating to the whole mixed-use scheme) between 2017 and 2030 amounts to around £440 million34, with £80 million of this capital investment used for major upfront infrastructure costs.
34 The construction cost associated with the total capital investment has been used to estimate construction employment/output

Watford Economic Growth & Delivery Assessment : Final Report
7179769v9 P57
5.35 The gross development impacts of the Watford Junction site once all the proposed developments are built-out and operational are shown in Table 5.9.
Table 5.9 Summary of the Gross Development Impacts for Watford Junction
Development Output
Construction Impacts
Person-Years of Construction Work 5,170
Temporary Construction Jobs (p.a.) 400
Indirect & Induced Jobs Supported (p.a.) 600
Total Direct & Indirect GVA (p.a.) £38.4 million
Operational Impacts
Total Direct Jobs 2,350
Direct GVA (p.a.) £105.9 million
Indirect & Induced Jobs Supported (regionally) 1,060
Resident Expenditure Impacts
Gross Resident Expenditure £40.7 million
Indirect Jobs Supported by this Expenditure 230
Fiscal Impacts
Business Rates Payable (p.a.) £3.2 million
New Homes Bonus Payments (over six years) £17.3 million
Council Tax Receipts (p.a.) £2.8 million
Source: NLP analysis Note: All figures have been rounded.
Net Additional Impacts
5.36 The assumptions underpinning the assessment of the net additional impacts of the developments at Watford Junction are summarised as follows:
As this assessment only considers the operational impacts of 46,500sq.m of new commercial office space, the only employment assumed to exist and be retained at the site relates to the 100 office-based jobs currently based at the Watford Junction site. The net capacity of the area therefore equates to 2,250 jobs.
Taking into account various property and labour market factors, as well as a proportion of the new space developed at Watford Junction being taken-up by local businesses seeking to expand their operations, it is anticipated that some displacement of the new jobs could occur. This displacement is however assumed to relatively low (15%).
Approximately 85% of the gross expenditure generated by new residents to the Watford Junction site is assumed to be retained in the local economy.
5.37 With the net capacity of the Watford Junction site estimated at 2,250 jobs, and the level of displacement relating to the new office space equating to some 340
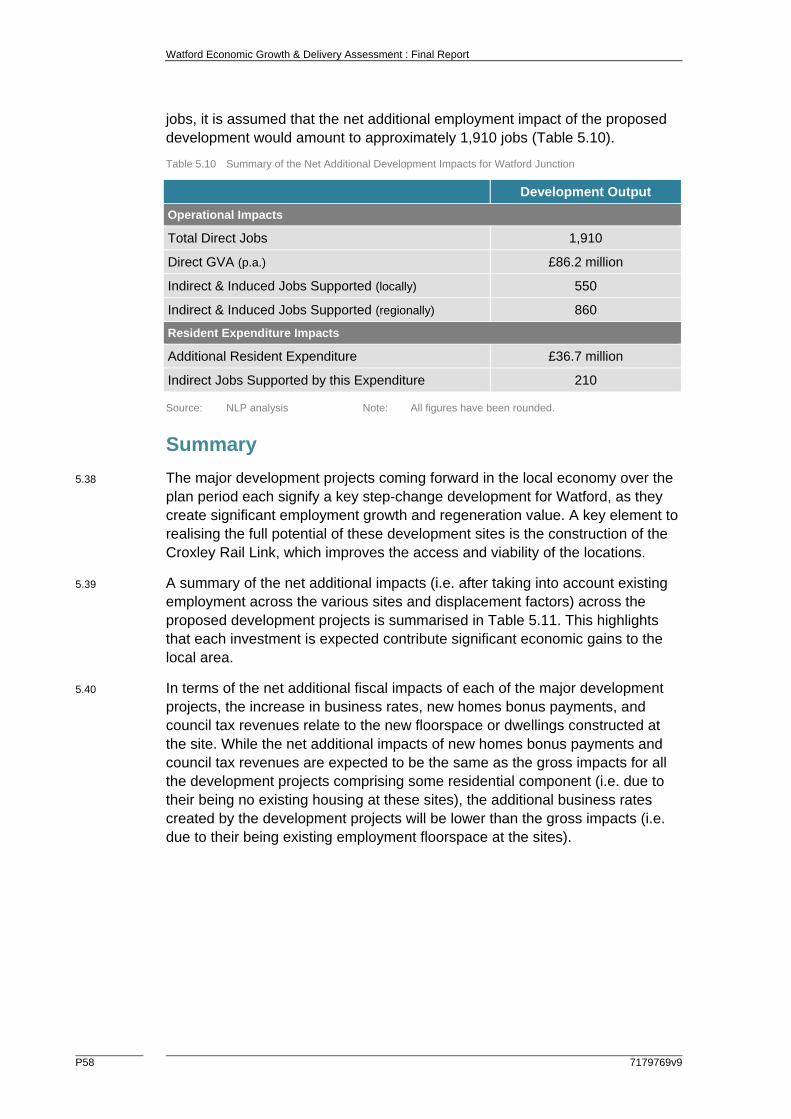
Watford Economic Growth & Delivery Assessment : Final Report
P58 7179769v9
jobs, it is assumed that the net additional employment impact of the proposed development would amount to approximately 1,910 jobs (Table 5.10).
Table 5.10 Summary of the Net Additional Development Impacts for Watford Junction
Development Output
Operational Impacts
Total Direct Jobs 1,910
Direct GVA (p.a.) £86.2 million
Indirect & Induced Jobs Supported (locally) 550
Indirect & Induced Jobs Supported (regionally) 860
Resident Expenditure Impacts
Additional Resident Expenditure £36.7 million
Indirect Jobs Supported by this Expenditure 210
Source: NLP analysis Note: All figures have been rounded.
Summary
5.38 The major development projects coming forward in the local economy over the plan period each signify a key step-change development for Watford, as they create significant employment growth and regeneration value. A key element to realising the full potential of these development sites is the construction of the Croxley Rail Link, which improves the access and viability of the locations.
5.39 A summary of the net additional impacts (i.e. after taking into account existing employment across the various sites and displacement factors) across the proposed development projects is summarised in Table 5.11. This highlights that each investment is expected contribute significant economic gains to the local area.
5.40 In terms of the net additional fiscal impacts of each of the major development projects, the increase in business rates, new homes bonus payments, and council tax revenues relate to the new floorspace or dwellings constructed at the site. While the net additional impacts of new homes bonus payments and council tax revenues are expected to be the same as the gross impacts for all the development projects comprising some residential component (i.e. due to their being no existing housing at these sites), the additional business rates created by the development projects will be lower than the gross impacts (i.e. due to their being existing employment floorspace at the sites).
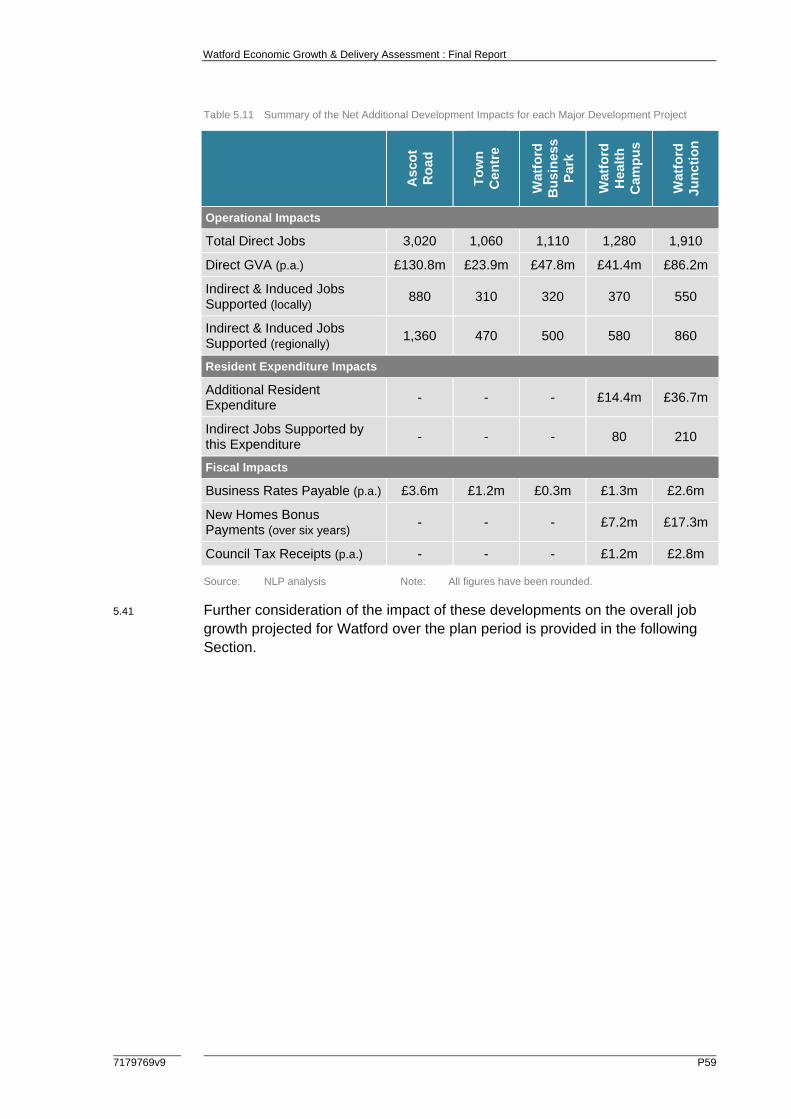
Watford Economic Growth & Delivery Assessment : Final Report
7179769v9 P59
Table 5.11 Summary of the Net Additional Development Impacts for each Major Development Project
Asc
ot
Ro
ad
To
wn
C
entr
e
Wat
ford
B
usi
nes
s P
ark
Wat
ford
H
ealt
h
Cam
pu
s
Wat
ford
Ju
nct
ion
Operational Impacts
Total Direct Jobs 3,020 1,060 1,110 1,280 1,910
Direct GVA (p.a.) £130.8m £23.9m £47.8m £41.4m £86.2m
Indirect & Induced Jobs Supported (locally)
880 310 320 370 550
Indirect & Induced Jobs Supported (regionally)
1,360 470 500 580 860
Resident Expenditure Impacts
Additional Resident Expenditure
- - - £14.4m £36.7m
Indirect Jobs Supported by this Expenditure
- - - 80 210
Fiscal Impacts
Business Rates Payable (p.a.) £3.6m £1.2m £0.3m £1.3m £2.6m
New Homes Bonus Payments (over six years)
- - - £7.2m £17.3m
Council Tax Receipts (p.a.) - - - £1.2m £2.8m
Source: NLP analysis Note: All figures have been rounded.
5.41 Further consideration of the impact of these developments on the overall job growth projected for Watford over the plan period is provided in the following Section.

Watford Economic Growth & Delivery Assessment : Final Report
P60 7179769v9
6.0 Future Requirements for Employment Space
6.1 This section considers future economic growth needs in Watford by drawing on a number of methodologies guided by the PPG. These scenarios are used to inform the assessment of the Borough’s future employment land requirements for office and industrial (i.e. manufacturing and distribution) uses.
Methodology
6.2 The NPPF requires local authorities to “set out a clear economic vision and strategy for their area which positively and proactively encourages sustainable economic growth” (para 21). Considering this in evidence base terms, this should be underpinned by a “clear understanding of business needs within the economic markets operating in and across their area” (para 160).
6.3 Within this context, a number of potential future economic scenarios have been developed through this study to provide a framework for considering future economic growth needs and B class employment space requirements within Watford over the period to 2031. In line with PPG, these scenarios draw upon:
a projections of employment growth within the main B class sectors (labour demand) derived from economic forecasts produced by EEFM;
b consideration of past trends in completions of employment space based on monitoring data supplied by Watford Borough Council, and how these might change in the future;
c estimating future growth of local labour supply based on the housing target figure contained in the Local Plan Part 1 (Core Strategy 2013) and the amount of jobs and employment space that this can support; and
d estimating future growth of local labour supply based on the latest Government population projections (2012 SNPP).
6.4 All these approaches have limitations and consideration needs to be given as to how appropriate each is to circumstances in Watford. Further, to be robust, the economic growth potential and likely demand for employment floorspace in Watford needs to be assessed under different future scenarios, to reflect both lower and higher economic growth conditions arising in the future.
6.5 It should also be noted that the ultimate judgement as to the level of need for which Watford should plan is not purely quantitative, and that there will be qualitative factors (i.e. set out elsewhere in this report). These factors will influence the future employment space requirements that need to be planned for, and must be considered alongside the modelled scenarios in this section.
A. Forecasts of Job Growth
6.6 Forecasts of employment growth within Watford up to 2031 were obtained from the Spring 2013 release of the East of England Forecasting Model (EEFM), which takes account of recent regional and national macroeconomic

Watford Economic Growth & Delivery Assessment : Final Report
7179769v9 P61
assumptions. Such assumptions of the economic conditions in the East of England include sluggish levels of economic growth in 2013; labour market growth set to outstrip that in the UK with job growth in the East driven by exporting service sectors, wholesale and retail; while population growth is also meant to outpace that in the UK as the East remains a desirable location for international migrants. Economic recovery in the East is expected to become more established and gain momentum in 2014.
6.7 It is important to note that there are inherent limitations to the use of economic forecasts of this type, particularly within the context of recent changes in the economy. National macroeconomic assumptions are taken as the starting point and then modelled down to the regional and local level by reference to the existing economic profile and sectoral composition of an area. Local level data is less comprehensive and reliable than at national and regional levels, which can affect how the modelling is calibrated. Similarly, top-down forecasts do not take account of specific local factors that might influence employment growth such as major local investment or regeneration projects. However forecasts are seen as a valuable input to indicate the broad scale and direction of future economic growth within different sectors, which help assess the future land requirements of a local area.
6.8 Population projections form one of a number of inputs to the production of economic forecasts, both in terms of future changes in working-age population (which directly impacts on demand for jobs) and total population (which generates demand for consumption activities e.g. local goods and services). The EEFM 2013 model uses official projections of natural increase and Oxford Economics’ projected rates of net migration. It is important to note that population projections are frequently revised, as are assumptions around future working age population, economic activity rates and national changes to the pension age. The forecasts also assume that existing patterns of commuting remain unchanged and this means that future updates to this study will need to take account of the 2011 Census origin-destination commuting data when released and incorporated into the EEFM model.
Scenario 1: Baseline Job Growth
6.9 The forecasts of job growth by sector used here reflect recent trends, and are based on projections at the regional level and how sectors within Watford have fared relative to historic growth in the region. For example, where particular sectors have performed well compared with the regional (i.e. East of England) average, the forecasts generally assume that these sectors will continue to drive employment growth within the Borough in the future. These forecasts also reflect the current post-recession economic climate.
6.10 It should be noted that the Spring 2013 EEFM dataset for Watford identifies a methodological anomaly within the ‘employment activities’ sector that significantly impacts on the number of jobs recorded in this sector of the Borough’s economy. For this reason, the employment activities sector has been excluded from analysis of employment in Watford for both historic data
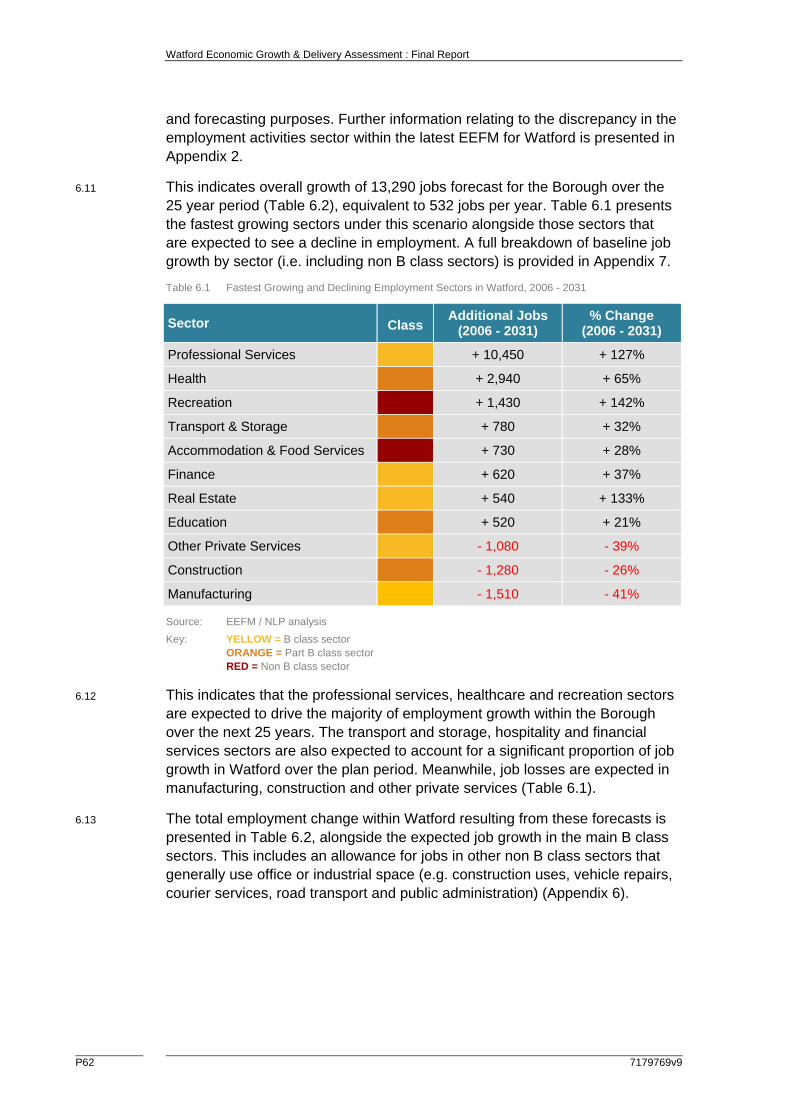
Watford Economic Growth & Delivery Assessment : Final Report
P62 7179769v9
and forecasting purposes. Further information relating to the discrepancy in the employment activities sector within the latest EEFM for Watford is presented in Appendix 2.
6.11 This indicates overall growth of 13,290 jobs forecast for the Borough over the 25 year period (Table 6.2), equivalent to 532 jobs per year. Table 6.1 presents the fastest growing sectors under this scenario alongside those sectors that are expected to see a decline in employment. A full breakdown of baseline job growth by sector (i.e. including non B class sectors) is provided in Appendix 7.
Table 6.1 Fastest Growing and Declining Employment Sectors in Watford, 2006 - 2031
Sector Class Additional Jobs
(2006 - 2031) % Change
(2006 - 2031)
Professional Services + 10,450 + 127%
Health + 2,940 + 65%
Recreation + 1,430 + 142%
Transport & Storage + 780 + 32%
Accommodation & Food Services + 730 + 28%
Finance + 620 + 37%
Real Estate + 540 + 133%
Education + 520 + 21%
Other Private Services - 1,080 - 39%
Construction - 1,280 - 26%
Manufacturing - 1,510 - 41%
Source: EEFM / NLP analysis
Key: YELLOW = B class sector ORANGE = Part B class sector RED = Non B class sector
6.12 This indicates that the professional services, healthcare and recreation sectors are expected to drive the majority of employment growth within the Borough over the next 25 years. The transport and storage, hospitality and financial services sectors are also expected to account for a significant proportion of job growth in Watford over the plan period. Meanwhile, job losses are expected in manufacturing, construction and other private services (Table 6.1).
6.13 The total employment change within Watford resulting from these forecasts is presented in Table 6.2, alongside the expected job growth in the main B class sectors. This includes an allowance for jobs in other non B class sectors that generally use office or industrial space (e.g. construction uses, vehicle repairs, courier services, road transport and public administration) (Appendix 6).
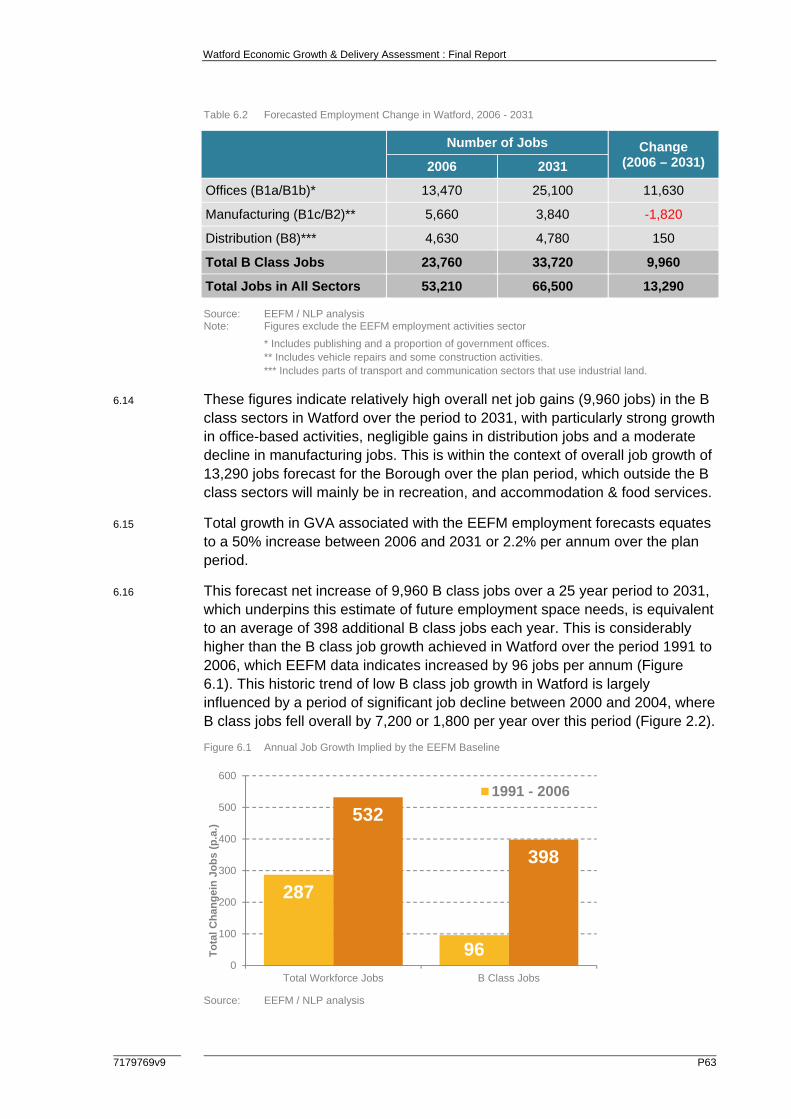
Watford Economic Growth & Delivery Assessment : Final Report
7179769v9 P63
Table 6.2 Forecasted Employment Change in Watford, 2006 - 2031
Number of Jobs Change
(2006 – 2031) 2006 2031
Offices (B1a/B1b)* 13,470 25,100 11,630
Manufacturing (B1c/B2)** 5,660 3,840 -1,820
Distribution (B8)*** 4,630 4,780 150
Total B Class Jobs 23,760 33,720 9,960
Total Jobs in All Sectors 53,210 66,500 13,290
Source: EEFM / NLP analysis Note: Figures exclude the EEFM employment activities sector
* Includes publishing and a proportion of government offices. ** Includes vehicle repairs and some construction activities. *** Includes parts of transport and communication sectors that use industrial land.
6.14 These figures indicate relatively high overall net job gains (9,960 jobs) in the B class sectors in Watford over the period to 2031, with particularly strong growth in office-based activities, negligible gains in distribution jobs and a moderate decline in manufacturing jobs. This is within the context of overall job growth of 13,290 jobs forecast for the Borough over the plan period, which outside the B class sectors will mainly be in recreation, and accommodation & food services.
6.15 Total growth in GVA associated with the EEFM employment forecasts equates to a 50% increase between 2006 and 2031 or 2.2% per annum over the plan period.
6.16 This forecast net increase of 9,960 B class jobs over a 25 year period to 2031, which underpins this estimate of future employment space needs, is equivalent to an average of 398 additional B class jobs each year. This is considerably higher than the B class job growth achieved in Watford over the period 1991 to 2006, which EEFM data indicates increased by 96 jobs per annum (Figure 6.1). This historic trend of low B class job growth in Watford is largely influenced by a period of significant job decline between 2000 and 2004, where B class jobs fell overall by 7,200 or 1,800 per year over this period (Figure 2.2).
Figure 6.1 Annual Job Growth Implied by the EEFM Baseline
Source: EEFM / NLP analysis
287
96
532
398
0
100
200
300
400
500
600
Total Workforce Jobs B Class Jobs
To
tal
Ch
ang
ein
Jo
bs
(p.a
.)
1991 - 2006
Watford Economic Growth & Delivery Assessment : Final Report
P64 7179769v9
6.17 Overall employment growth is also expected to accelerate beyond the level of growth recorded in the Borough between 1991 and 2006, at a rate of 245 additional jobs per annum, or an 85% increase over historic trends (Figure 6.1). On the basis of past performance, the baseline job growth scenario could be regarded as a more optimistic estimate of employment growth.
6.18 The Watford Local Plan Part 1 identifies a target to provide at least 7,000 additional jobs in the Borough between 2006 and 2031 in order to maintain Watford’s role as a regional centre. It is understood that this figure is based upon employment growth forecasts and scenarios discussed in the Council’s Employment Topic Paper 2010 which included reference to the Autumn 2009 and Autumn 2010 EEFM baseline employment forecasts for the Borough with an allowance for a higher rate of office and health related job growth over the plan period to 2031. The majority of this job growth target related to B class (i.e. office and industrial) uses.
6.19 The latest EEFM employment forecasts (obtained from the Spring 2013 release) imply a scale of job growth in Watford for the period 2006 to 2031 that is nearly twice as high as the Core Strategy figure. This divergence is likely to reflect the different macro-economic outlook that prevailed at the time that the EEFM was prepared, with the latest forecasts driven by an optimistic outlook as the UK firmly enters recovery. It also partly reflects the significant variation in total employment recorded for 2006 (i.e. the start year of the plan period) between the two EEFM datasets, with the Spring 2013 EEFM projections implying a much lower level of employment in 2006 (at 53,210 workforce jobs) in Watford than the 2009 based EEFM data (58,920 workforce jobs).
6.20 The B class element of these employment growth forecasts have been converted to net future employment space requirements by applying the latest published density figures for employment space which take account of recent trends in occupancy for the different B class uses. To estimate space needs, the following average ratios have been applied:
Offices: 1 job per 12.5m2 for general office space;
Industry/manufacturing: 1 job per 43m2 as an average across B1c and B2 uses; and
Warehousing: 1 job per 65m2 for general, smaller scale warehousing (assumed to account for 90% of total stock) and 1 job per 75m2 for large scale, lower density units (assumed to account for 10% of total stock).
6.21 These assumptions are based on latest HCA/OffPAT guidance on employment densities published in 2010.36 The guidance takes into account recent trends in terms of the changing use of employment space, with the main change being the more efficient use of office space through flexible working and hot-desking.
6.22 An allowance of 10% is added to all floorspace requirements to reflect normal levels of market vacancy in employment space. Where a reduction in jobs is
36
Based on HCA/OffPAT Employment Densities Guide (2010) and converted to Gross External Area (GEA) and total workforce jobs by NLP.
Watford Economic Growth & Delivery Assessment : Final Report
7179769v9 P65
forecast (e.g. manufacturing sector), the associated negative floorspace was halved. This reflects that while there may be ongoing manufacturing job losses (e.g. as firms use more efficient production methods), it doesn’t automatically follow that all of the existing employment space is lost.
Table 6.3 EEFM Job Growth Based Net Employment Space Requirements in Watford, 2006 - 2031
Floorspace (Sq.m)
Offices (B1a/B1b) 159,900
Manufacturing (B1c/B2) -39,230
Distribution (B8) 11,040
Total B Class Jobs 131,710
Source: NLP analysis
B. Past Development Rates
6.23 Because they reflect market demand and actual development patterns on the ground, in some cases long term completion rates of employment floorspace can provide a reasonable basis for informing future land needs. Completions over such a period as ten years or more should even out demand fluctuations over a business cycle, and normally provide a reasonable basis for estimating future needs provided land supply has not been unduly constrained. Whereas job forecasts show growth in net terms, past trend-based assessments take into account development that offsets the redevelopment of employment sites, and from the recycling of sites.
Scenario 2: Past Development Rates
6.24 Monitoring data on past completions by B class use was provided by Watford Borough Council, providing total completions for the period 2004 to 2013. This provides a reasonably long period in which to reflect on a full business cycle, especially for a period that experienced both economic growth and recession. During this period, average annual net completions for B class uses amounted to some -9,415sq.m of employment floorspace, as broken down in Table 6.4. Gross completions were significantly higher at an average of 7,280sq.m annually, although this masks significant losses of employment space that have occurred over this period.
Table 6.4 Annual Completion Rates of Employment Space in Watford, 2004 - 2013
Use Class Net Annual
Completions (Sq.m) Gross Annual
Completions (Sq.m)
Offices (B1a/B1b) -4,125 2,625
Industrial (B1c/B2/B8) -5,290 4,655
Total -9,415 7,280
Source: Watford Borough Council / NLP analysis
Note: ‘Mixed B’ completions have been split into B1a/B1b (office) and B1c/B2/B8 (industrial) use categories on a 50:50 basis for the purpose of analysis
Watford Economic Growth & Delivery Assessment : Final Report
P66 7179769v9
6.25 As explored in Section 3.0, historic negative net take-up rates in the Borough have been driven by significant losses of employment space. Where B class space has been lost to other non B class uses, the majority of this (84%) occurred outside of the Borough’s main employment areas, i.e. on those sites that do not benefit from protection or safeguarding for B class uses. There is little market evidence to suggest that this trend will change significantly over the plan period, particularly as pressure from higher value uses such as residential continues in future.
6.26 One view of future growth in Watford could therefore simply assume that development rates carry on in the future at the long term average achieved in the past. If it were assumed that the past net completion rates noted in Table 6.4 were to continue over the next 25 year period, it would equate to a loss of 132,250sq.m of industrial space and a loss of 103,125sq.m of office space. Overall, this would indicate demand for a loss of around 235,375sq.m of employment space by 2031, a figure that is significantly lower than that estimated using job forecasts (Table 6.3).
Table 6.5 Employment Space Requirements Based on Past Completion Trends Continuing, 2006 - 2031
Assumed Net
Floorspace Change (p.a.) (Sq.m)
Net Floorspace Needs (2006 - 2031)
(Sq.m)
Offices (B1a/B1b) -4,125 -103,125
Industrial (B1c/B2/B8) -5,290 -132,250
Total -9,415 -235,375
Source: Watford Borough Council / NLP analysis Totals rounded
6.27 Using typical ratios of jobs to floorspace for the different B uses (i.e. as outlined above), it is possible to estimate that this continued erosion of employment space would generate a loss of 10,420 B class jobs over the 25 year period to 2031, which is equivalent to around 417 lost B class jobs each year over the plan period.
C. Future Labour Supply
6.28 It is also important to take into account how many jobs, and hence how much employment space, would be necessary to broadly match forecast growth of the resident workforce in the Borough. In contrast to the other two approaches, this approach focuses on the future supply of labour rather than labour demand. It then indicates the amount of new jobs needed to match the future supply of working-age population, and how much employment space would be needed to accommodate these jobs.
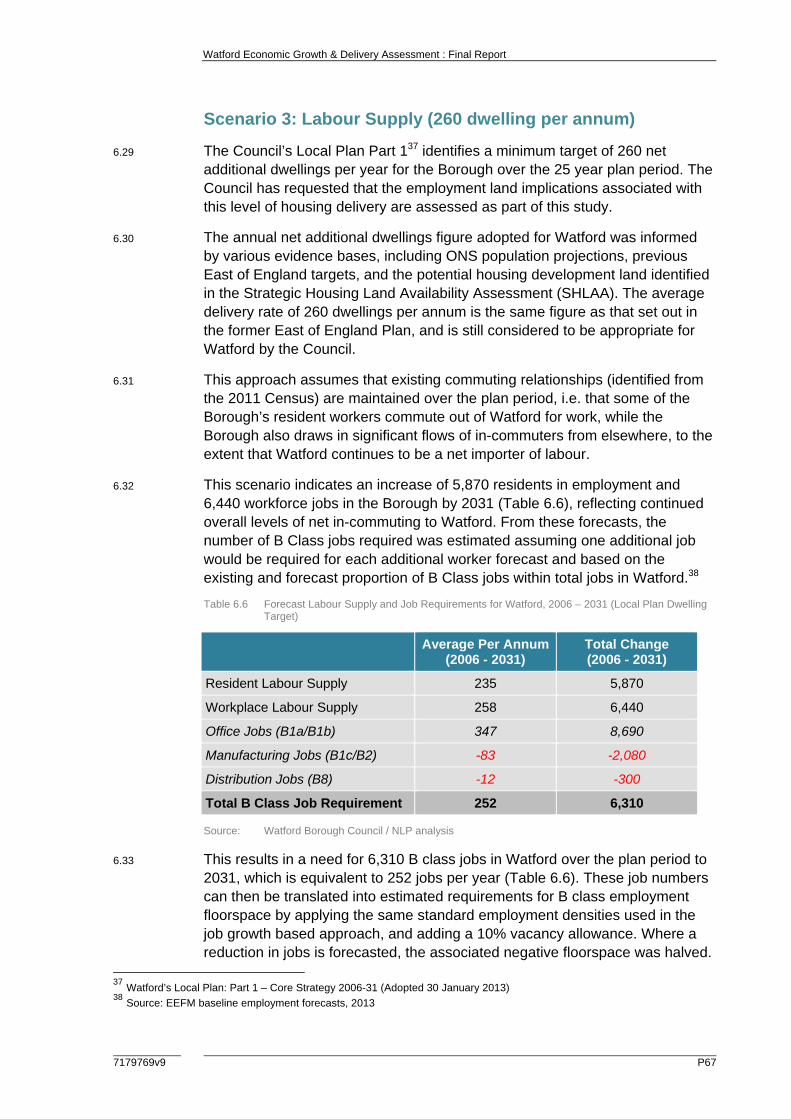
Watford Economic Growth & Delivery Assessment : Final Report
7179769v9 P67
Scenario 3: Labour Supply (260 dwelling per annum)
6.29 The Council’s Local Plan Part 137 identifies a minimum target of 260 net additional dwellings per year for the Borough over the 25 year plan period. The Council has requested that the employment land implications associated with this level of housing delivery are assessed as part of this study.
6.30 The annual net additional dwellings figure adopted for Watford was informed by various evidence bases, including ONS population projections, previous East of England targets, and the potential housing development land identified in the Strategic Housing Land Availability Assessment (SHLAA). The average delivery rate of 260 dwellings per annum is the same figure as that set out in the former East of England Plan, and is still considered to be appropriate for Watford by the Council.
6.31 This approach assumes that existing commuting relationships (identified from the 2011 Census) are maintained over the plan period, i.e. that some of the Borough’s resident workers commute out of Watford for work, while the Borough also draws in significant flows of in-commuters from elsewhere, to the extent that Watford continues to be a net importer of labour.
6.32 This scenario indicates an increase of 5,870 residents in employment and 6,440 workforce jobs in the Borough by 2031 (Table 6.6), reflecting continued overall levels of net in-commuting to Watford. From these forecasts, the number of B Class jobs required was estimated assuming one additional job would be required for each additional worker forecast and based on the existing and forecast proportion of B Class jobs within total jobs in Watford.38
Table 6.6 Forecast Labour Supply and Job Requirements for Watford, 2006 – 2031 (Local Plan Dwelling Target)
Average Per Annum
(2006 - 2031) Total Change (2006 - 2031)
Resident Labour Supply 235 5,870
Workplace Labour Supply 258 6,440
Office Jobs (B1a/B1b) 347 8,690
Manufacturing Jobs (B1c/B2) -83 -2,080
Distribution Jobs (B8) -12 -300
Total B Class Job Requirement 252 6,310
Source: Watford Borough Council / NLP analysis
6.33 This results in a need for 6,310 B class jobs in Watford over the plan period to 2031, which is equivalent to 252 jobs per year (Table 6.6). These job numbers can then be translated into estimated requirements for B class employment floorspace by applying the same standard employment densities used in the job growth based approach, and adding a 10% vacancy allowance. Where a reduction in jobs is forecasted, the associated negative floorspace was halved.
37 Watford’s Local Plan: Part 1 – Core Strategy 2006-31 (Adopted 30 January 2013) 38 Source: EEFM baseline employment forecasts, 2013
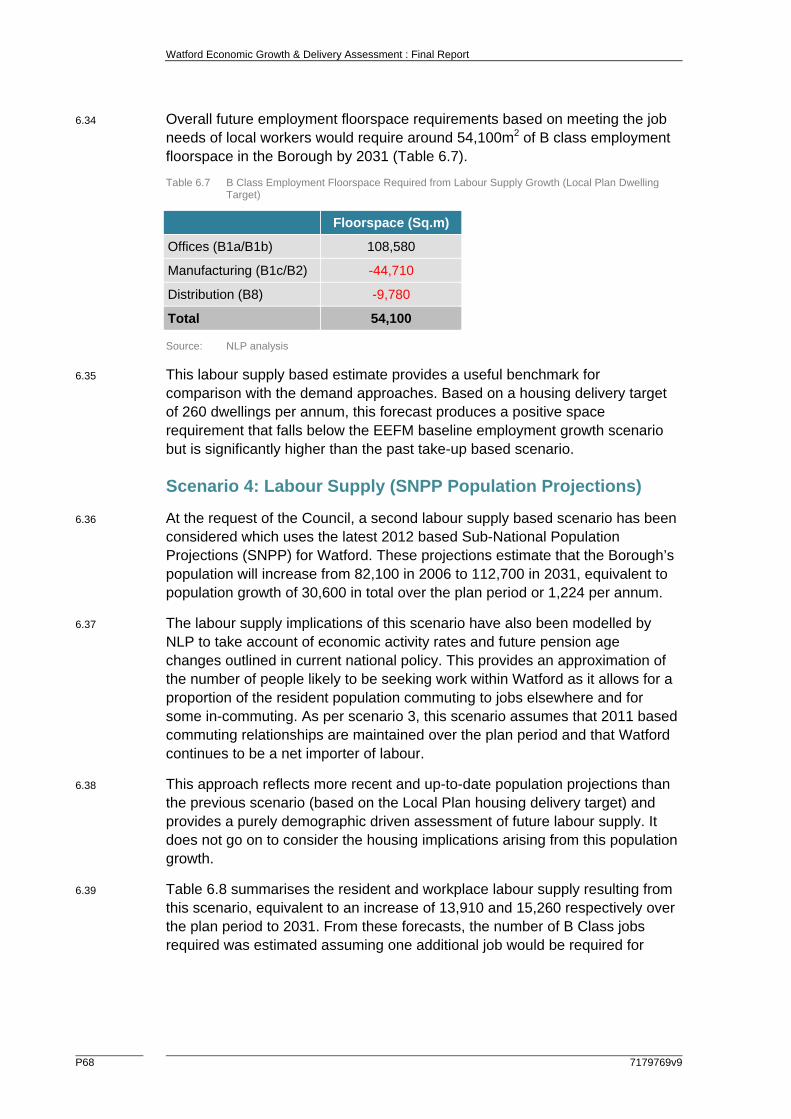
Watford Economic Growth & Delivery Assessment : Final Report
P68 7179769v9
6.34 Overall future employment floorspace requirements based on meeting the job needs of local workers would require around 54,100m2 of B class employment floorspace in the Borough by 2031 (Table 6.7).
Table 6.7 B Class Employment Floorspace Required from Labour Supply Growth (Local Plan Dwelling Target)
Floorspace (Sq.m)
Offices (B1a/B1b) 108,580
Manufacturing (B1c/B2) -44,710
Distribution (B8) -9,780
Total 54,100
Source: NLP analysis
6.35 This labour supply based estimate provides a useful benchmark for comparison with the demand approaches. Based on a housing delivery target of 260 dwellings per annum, this forecast produces a positive space requirement that falls below the EEFM baseline employment growth scenario but is significantly higher than the past take-up based scenario.
Scenario 4: Labour Supply (SNPP Population Projections)
6.36 At the request of the Council, a second labour supply based scenario has been considered which uses the latest 2012 based Sub-National Population Projections (SNPP) for Watford. These projections estimate that the Borough’s population will increase from 82,100 in 2006 to 112,700 in 2031, equivalent to population growth of 30,600 in total over the plan period or 1,224 per annum.
6.37 The labour supply implications of this scenario have also been modelled by NLP to take account of economic activity rates and future pension age changes outlined in current national policy. This provides an approximation of the number of people likely to be seeking work within Watford as it allows for a proportion of the resident population commuting to jobs elsewhere and for some in-commuting. As per scenario 3, this scenario assumes that 2011 based commuting relationships are maintained over the plan period and that Watford continues to be a net importer of labour.
6.38 This approach reflects more recent and up-to-date population projections than the previous scenario (based on the Local Plan housing delivery target) and provides a purely demographic driven assessment of future labour supply. It does not go on to consider the housing implications arising from this population growth.
6.39 Table 6.8 summarises the resident and workplace labour supply resulting from this scenario, equivalent to an increase of 13,910 and 15,260 respectively over the plan period to 2031. From these forecasts, the number of B Class jobs required was estimated assuming one additional job would be required for

Watford Economic Growth & Delivery Assessment : Final Report
7179769v9 P69
each additional worker forecast and based on the existing and forecast proportion of B Class jobs within total jobs in Watford.39
Table 6.8 Forecast Labour Supply and Job Requirements for Watford, 2006 – 2031 (2012 Based SNPP)
Average Per Annum
(2006 - 2031) Total Change (2006 - 2031)
Resident Labour Supply 556 13,910
Workplace Labour Supply 610 15,260
Office Jobs (B1a/B1b) 481 12,020
Manufacturing Jobs (B1c/B2) -63 -1,570
Distribution Jobs (B8) 13 340
Total B Class Job Requirement 431 10,780
Source: Watford Borough Council / NLP analysis
6.40 This increase in 10,780 B class jobs in Watford over the plan period to 2031 is equivalent to 431 jobs per year (Table 6.8). These job numbers were then translated into estimated requirements for B class employment floorspace by applying the same standard employment densities used in the job growth based approach, and adding a 10% vacancy allowance. Where a reduction in jobs is forecasted, the associated negative floorspace was halved.
6.41 Overall future employment floorspace requirements based on meeting the labour supply needs associated with the 2012 SNPP population projections would require around 138,650sq.m of B class employment floorspace in the Borough by 2031 (Table 6.9). This net requirement is more than double the scale of requirement derived from the Local Plan housing delivery target (i.e. 260 dwellings per annum) labour supply scenario but is comparable with the scale of spatial growth implied by the baseline EEFM labour demand based approach (see Table 6.3).
Table 6.9 B Class Employment Floorspace Required from Labour Supply Growth (2012 Based SNPP)
Floorspace (Sq.m)
Offices (B1a/B1b) 150,205
Manufacturing (B1c/B2) -33,785
Distribution (B8) 22,230
Total 138,650
Source: NLP analysis
Net Employment Space Requirements
6.42 Drawing together the results from each of the different approaches and growth scenarios, Table 6.10 summarises the net floorspace requirements up to 2031.
39 Source: EEFM baseline employment forecasts, 2013
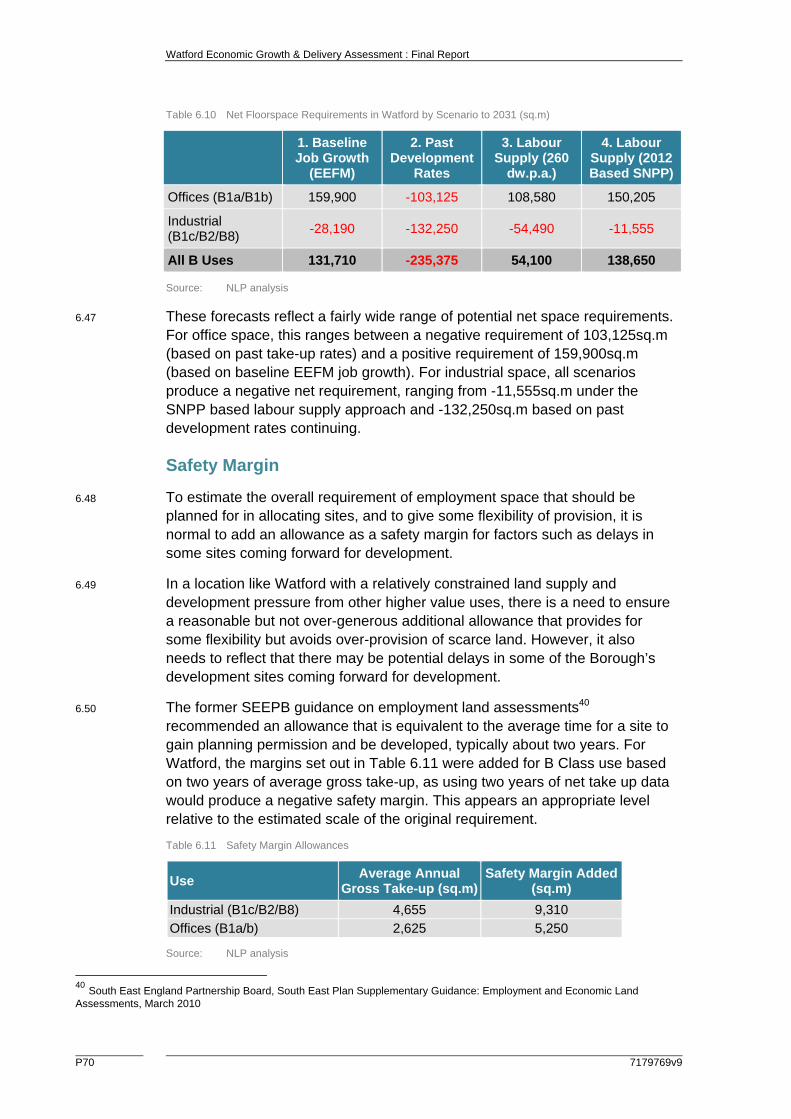
Watford Economic Growth & Delivery Assessment : Final Report
P70 7179769v9
Table 6.10 Net Floorspace Requirements in Watford by Scenario to 2031 (sq.m)
1. Baseline Job Growth
(EEFM)
2. Past Development
Rates
3. Labour Supply (260
dw.p.a.)
4. Labour Supply (2012 Based SNPP)
Offices (B1a/B1b) 159,900 -103,125 108,580 150,205
Industrial (B1c/B2/B8)
-28,190 -132,250 -54,490 -11,555
All B Uses 131,710 -235,375 54,100 138,650
Source: NLP analysis
6.47 These forecasts reflect a fairly wide range of potential net space requirements. For office space, this ranges between a negative requirement of 103,125sq.m (based on past take-up rates) and a positive requirement of 159,900sq.m (based on baseline EEFM job growth). For industrial space, all scenarios produce a negative net requirement, ranging from -11,555sq.m under the SNPP based labour supply approach and -132,250sq.m based on past development rates continuing.
Safety Margin
6.48 To estimate the overall requirement of employment space that should be planned for in allocating sites, and to give some flexibility of provision, it is normal to add an allowance as a safety margin for factors such as delays in some sites coming forward for development.
6.49 In a location like Watford with a relatively constrained land supply and development pressure from other higher value uses, there is a need to ensure a reasonable but not over-generous additional allowance that provides for some flexibility but avoids over-provision of scarce land. However, it also needs to reflect that there may be potential delays in some of the Borough’s development sites coming forward for development.
6.50 The former SEEPB guidance on employment land assessments40 recommended an allowance that is equivalent to the average time for a site to gain planning permission and be developed, typically about two years. For Watford, the margins set out in Table 6.11 were added for B Class use based on two years of average gross take-up, as using two years of net take up data would produce a negative safety margin. This appears an appropriate level relative to the estimated scale of the original requirement.
Table 6.11 Safety Margin Allowances
Use Average Annual
Gross Take-up (sq.m)Safety Margin Added
(sq.m)
Industrial (B1c/B2/B8) 4,655 9,310
Offices (B1a/b) 2,625 5,250
Source: NLP analysis
40 South East England Partnership Board, South East Plan Supplementary Guidance: Employment and Economic Land Assessments, March 2010

Watford Economic Growth & Delivery Assessment : Final Report
7179769v9 P71
Gross Employment Space Requirements
6.51 To convert the net requirement of employment space into a gross requirement (the amount of employment space or land to be allocated/planned for), an allowance is also typically made for some replacement of losses of existing employment space that may be developed for other, non B Class uses. This allowance ensures that sufficient space is re-provided to account for employment space that is anticipated to be lost in future and provides some protection against continued erosion of employment space in the Borough.
6.52 Judgements were made on the suitability and degree of the allowance for future losses which it would be appropriate to apply here based on analysis of supply-side deliverability factors and current trends in the market. Not all losses need to be replaced as some will reflect restructuring in the local economy, for example as less manufacturing space is needed in future. Consideration has been given to a number of factors and property market dynamics, as described in turn below.
6.53 In the past, the majority of employment space lost in Watford has occurred outside of the Borough’s main employment areas, across a large number of smaller, historical sites that don’t have any specific policy status or protection for employment uses. It is important to allow for some replacement of this space, particularly as the loss of these sites will displace local employment and firms, and against the backdrop of increasing pressure from higher value uses such as residential.
6.54 Monitoring data also suggests that a reasonable share of these employment space losses related to large ‘one off’ (re)developments for example as older industrial sites become surplus to occupier requirements and are redeveloped for other uses (for example the former Sun Chemicals site in Cow Lane). The inclusion of such developments can skew the general, ambient trend of losses and has in part driven the high annual average level of losses in recent years in Watford. It is likely that the scale of these industrial one-off losses declines in the future, particularly as the Borough has few such sites remaining and at risk of redevelopment. Conversely, it is considered more likely that large one-off losses of office space continue in future (for example as existing stock becomes increasingly out-dated and surplus to modern occupier requirements), albeit outside of the main Clarendon/Station Road area which is currently subject to an Article 4 Direction preventing change of use permitted development (from offices to residential).
6.55 This analysis also indicates that more than half of B class losses over the past nine years related to the change of use from one B class to another, which in net terms has not lead to a loss of land across the Borough. It is therefore not necessary to make an allowance to replace this element of employment space losses.
6.56 As a consequence of this analysis, it has been assumed that 50% of office losses will be replaced each year, equating to 84,360sq.m by 2031 (or 3,375sq.m per annum). It has been assumed that 25% of industrial losses

Watford Economic Growth & Delivery Assessment : Final Report
P72 7179769v9
recorded over the last nine years will be replaced each year, equating to 62,180sq.m to 2031 (or 2,490sq.m per annum).
6.57 The resultant gross floorspace requirements incorporating these allowances are set out in Table 6.12 and Figure 6.2.
Table 6.12 Gross Floorspace Requirements in Watford by Scenario to 2031 (sq.m)
1. Baseline Job Growth
(EEFM)
2. Past Development
Rates
3. Labour Supply (260
dw.p.a.)
4. Labour Supply (2012 Based SNPP)
Offices (B1a/B1b) 249,510 -13,515 198,190 239,815
Industrial (B1c/B2/B8)
43,300 -60,760 17,000 59,935
All B Uses 292,810 -74,275 215,190 299,750
Source: NLP analysis * totals rounded
Figure 6.2 Gross Floorspace Requirements by Scenario (sq.m)
Source: NLP analysis
6.62 The range of floorspace requirements for industrial development land is relatively wide, between -60,760sq.m and 59,935sq.m to 2031 depending on the approach used. Compared with the stock of industrial space in Watford in 2006 41 (i.e. the base year of the plan period), this range would be equivalent to between a reduction in stock of 14% and an increase in stock of 14% to 2031.
6.63 For office floorspace, the range is even wider, between -13,515sq.m and 249,510sq.m to 2031. Compared with the stock of office space in Watford in
41 Based on industrial stock of 443,000sq.m as recorded by the VOA for 2006
249,5
10
43,3
00
-13,5
15
-60,7
60
198,1
90
17,0
00
239,8
15
59,9
35
-100,000
-50,000
0
50,000
100,000
150,000
200,000
250,000
300,000
Off
ice
Indu
stria
l
Off
ice
Indu
stria
l
Off
ice
Indu
stria
l
Off
ice
Indu
stria
l
1. Job Growth(Baseline)
2. Past Take-Up 3. Labour Supply (260dw.p.a.)
4. Labour Supply (2012SNPP)
Gro
ss
Floo
rspa
ce R
equi
rem
ents
(sq
.m)
Scenario
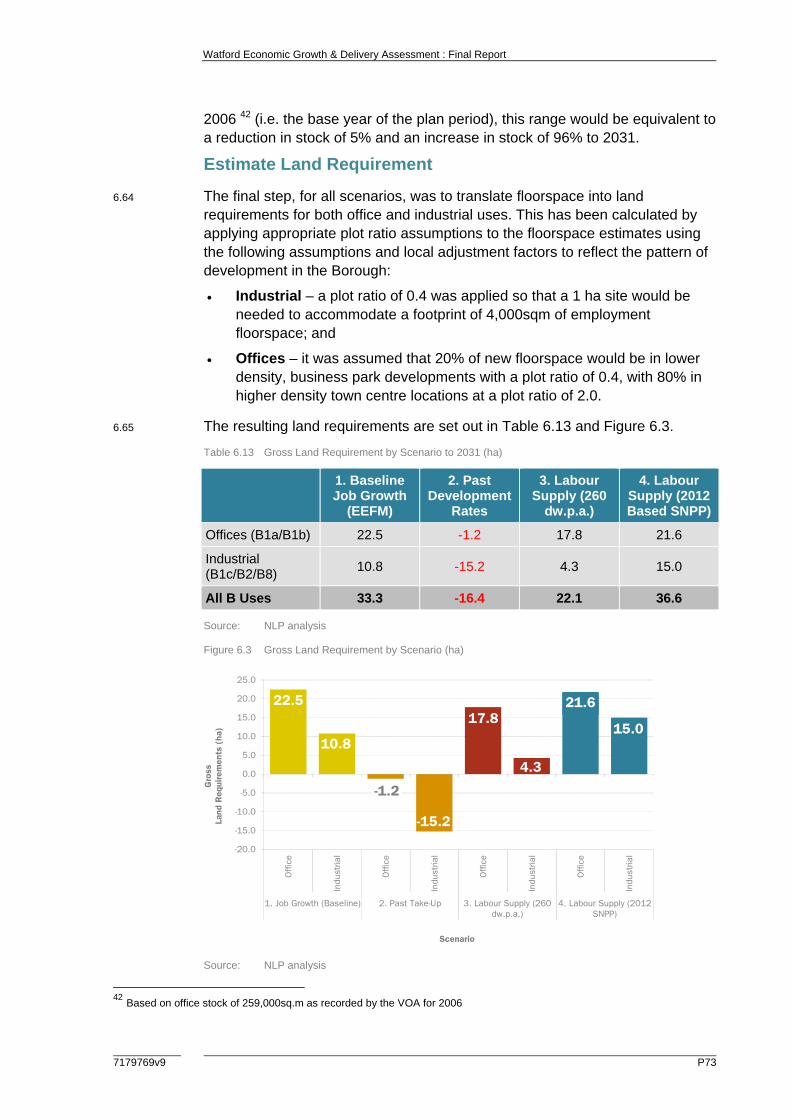
Watford Economic Growth & Delivery Assessment : Final Report
7179769v9 P73
2006 42 (i.e. the base year of the plan period), this range would be equivalent to a reduction in stock of 5% and an increase in stock of 96% to 2031.
Estimate Land Requirement
6.64 The final step, for all scenarios, was to translate floorspace into land requirements for both office and industrial uses. This has been calculated by applying appropriate plot ratio assumptions to the floorspace estimates using the following assumptions and local adjustment factors to reflect the pattern of development in the Borough:
Industrial – a plot ratio of 0.4 was applied so that a 1 ha site would be needed to accommodate a footprint of 4,000sqm of employment floorspace; and
Offices – it was assumed that 20% of new floorspace would be in lower density, business park developments with a plot ratio of 0.4, with 80% in higher density town centre locations at a plot ratio of 2.0.
6.65 The resulting land requirements are set out in Table 6.13 and Figure 6.3.
Table 6.13 Gross Land Requirement by Scenario to 2031 (ha)
1. Baseline Job Growth
(EEFM)
2. Past Development
Rates
3. Labour Supply (260
dw.p.a.)
4. Labour Supply (2012 Based SNPP)
Offices (B1a/B1b) 22.5 -1.2 17.8 21.6
Industrial (B1c/B2/B8)
10.8 -15.2 4.3 15.0
All B Uses 33.3 -16.4 22.1 36.6
Source: NLP analysis
Figure 6.3 Gross Land Requirement by Scenario (ha)
Source: NLP analysis
42 Based on office stock of 259,000sq.m as recorded by the VOA for 2006
22.5
10.8
-1.2
-15.2
17.8
4.3
15.0
-20.0
-15.0
-10.0
-5.0
0.0
5.0
10.0
15.0
20.0
25.0
Off
ice
Indu
stria
l
Off
ice
Indu
stria
l
Off
ice
Indu
stria
l
Off
ice
Indu
stria
l
1. Job Growth (Baseline) 2. Past Take-Up 3. Labour Supply (260dw.p.a.)
4. Labour Supply (2012SNPP)
Gro
ss
Land
Req
uire
men
ts (
ha)
Scenario
21.6
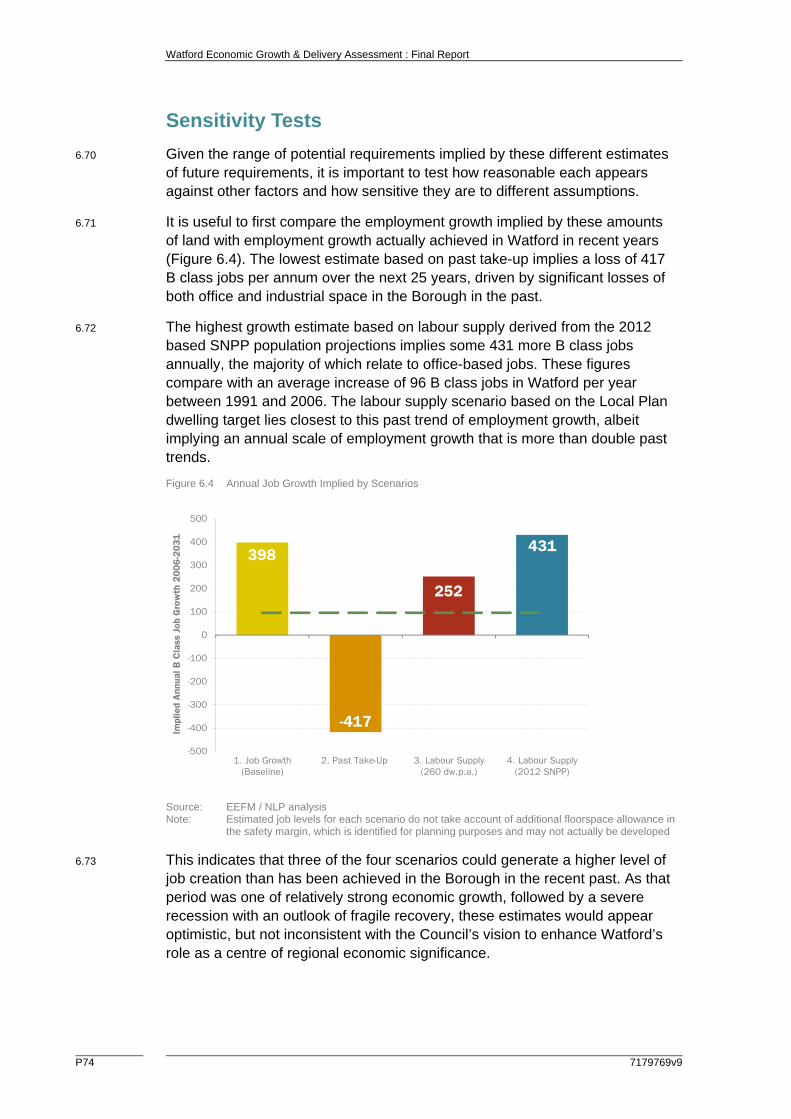
Watford Economic Growth & Delivery Assessment : Final Report
P74 7179769v9
Sensitivity Tests
6.70 Given the range of potential requirements implied by these different estimates of future requirements, it is important to test how reasonable each appears against other factors and how sensitive they are to different assumptions.
6.71 It is useful to first compare the employment growth implied by these amounts of land with employment growth actually achieved in Watford in recent years (Figure 6.4). The lowest estimate based on past take-up implies a loss of 417 B class jobs per annum over the next 25 years, driven by significant losses of both office and industrial space in the Borough in the past.
6.72 The highest growth estimate based on labour supply derived from the 2012 based SNPP population projections implies some 431 more B class jobs annually, the majority of which relate to office-based jobs. These figures compare with an average increase of 96 B class jobs in Watford per year between 1991 and 2006. The labour supply scenario based on the Local Plan dwelling target lies closest to this past trend of employment growth, albeit implying an annual scale of employment growth that is more than double past trends.
Figure 6.4 Annual Job Growth Implied by Scenarios
Source: EEFM / NLP analysis Note: Estimated job levels for each scenario do not take account of additional floorspace allowance in
the safety margin, which is identified for planning purposes and may not actually be developed
6.73 This indicates that three of the four scenarios could generate a higher level of job creation than has been achieved in the Borough in the recent past. As that period was one of relatively strong economic growth, followed by a severe recession with an outlook of fragile recovery, these estimates would appear optimistic, but not inconsistent with the Council’s vision to enhance Watford’s role as a centre of regional economic significance.
398
-417
252
431
-500
-400
-300
-200
-100
0
100
200
300
400
500
1. Job Growth(Baseline)
2. Past Take-Up 3. Labour Supply(260 dw.p.a.)
4. Labour Supply(2012 SNPP)
Impl
ied
Ann
ual B
Cla
ss J
ob G
row
th 2
006
-203
1
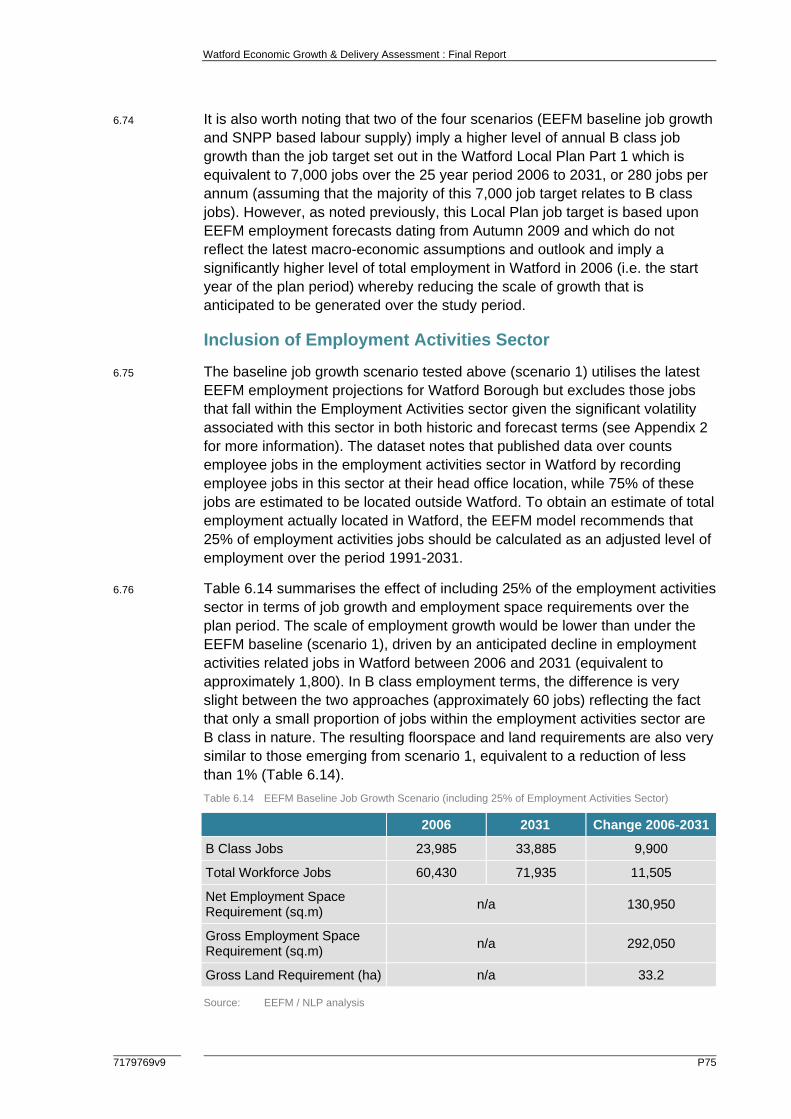
Watford Economic Growth & Delivery Assessment : Final Report
7179769v9 P75
6.74 It is also worth noting that two of the four scenarios (EEFM baseline job growth and SNPP based labour supply) imply a higher level of annual B class job growth than the job target set out in the Watford Local Plan Part 1 which is equivalent to 7,000 jobs over the 25 year period 2006 to 2031, or 280 jobs per annum (assuming that the majority of this 7,000 job target relates to B class jobs). However, as noted previously, this Local Plan job target is based upon EEFM employment forecasts dating from Autumn 2009 and which do not reflect the latest macro-economic assumptions and outlook and imply a significantly higher level of total employment in Watford in 2006 (i.e. the start year of the plan period) whereby reducing the scale of growth that is anticipated to be generated over the study period.
Inclusion of Employment Activities Sector
6.75 The baseline job growth scenario tested above (scenario 1) utilises the latest EEFM employment projections for Watford Borough but excludes those jobs that fall within the Employment Activities sector given the significant volatility associated with this sector in both historic and forecast terms (see Appendix 2 for more information). The dataset notes that published data over counts employee jobs in the employment activities sector in Watford by recording employee jobs in this sector at their head office location, while 75% of these jobs are estimated to be located outside Watford. To obtain an estimate of total employment actually located in Watford, the EEFM model recommends that 25% of employment activities jobs should be calculated as an adjusted level of employment over the period 1991-2031.
6.76 Table 6.14 summarises the effect of including 25% of the employment activities sector in terms of job growth and employment space requirements over the plan period. The scale of employment growth would be lower than under the EEFM baseline (scenario 1), driven by an anticipated decline in employment activities related jobs in Watford between 2006 and 2031 (equivalent to approximately 1,800). In B class employment terms, the difference is very slight between the two approaches (approximately 60 jobs) reflecting the fact that only a small proportion of jobs within the employment activities sector are B class in nature. The resulting floorspace and land requirements are also very similar to those emerging from scenario 1, equivalent to a reduction of less than 1% (Table 6.14).
Table 6.14 EEFM Baseline Job Growth Scenario (including 25% of Employment Activities Sector)
2006 2031 Change 2006-2031
B Class Jobs 23,985 33,885 9,900
Total Workforce Jobs 60,430 71,935 11,505
Net Employment Space Requirement (sq.m)
n/a 130,950
Gross Employment Space Requirement (sq.m)
n/a 292,050
Gross Land Requirement (ha) n/a 33.2
Source: EEFM / NLP analysis

Watford Economic Growth & Delivery Assessment : Final Report
P76 7179769v9
Major Development Projects
6.79 As detailed in Section 5.0, a number of major development projects are anticipated to come forward within Watford over the plan period to 2031 and deliver a range of jobs across the commercial, retail, health, education and hospitality sectors. In total, this is estimated to equate to just under 14,300 jobs in gross terms, or 8,385 jobs in net terms (i.e. after allowing for the displacement of existing employment within the Borough).
6.80 Some of these developments have been identified as ‘step-change’ projects for the local economy with regards to the nature and scale of employment growth that they are expected to deliver, and are therefore unlikely to be fully reflected within the baseline trajectory of growth for the Borough as set out by the EEFM forecasts which instead reflect the Borough’s historic performance and existing sectoral composition relative to the wider East of England region.
6.81 It is therefore possible to consider the extent to which the jobs generated by the major development projects fall outside of the baseline EEFM scenario of future economic growth by considering the nature and scale of job growth associated with each scheme and how this aligns with the sector-by-sector growth implied by the EEFM projections.
6.82 It is estimated that together, the major development projects will deliver 3,730 net additional jobs over and above the level of job growth implied by the EEFM baseline forecasts across the local plan period 2006 to 2031, assuming that all of the projects come forward and are delivered within this timescale. A summary breakdown by sector is shown below in Table 6.15. Approximately 2,850 or 76% of these additional jobs would fall within B class sectors, specifically office based sectors. This is equivalent to an additional 149 total or 114 B class jobs per annum over the 25 year plan period, representing an uplift of nearly 30% over and above the level of B class employment growth implied by the EEFM baseline scenario (as shown in Figure 6.4)
Table 6.15 Employment Impacts of Major Development Projects over and above EEFM Baseline
Broad Sector
EEFM Baseline
Employment Growth
(2006-31)
Net Job Creation of
Major Development
Projects
Assumed % Uplift over and above EEFM
Baseline
Net Additional Employment from Major
Development Projects
Office 11,630 5,705 50% 2,850
Industrial -1,670 560 0% 0
Retail -355 1,150 47% 540
Health 2,940 370 0% 0
Education 525 30 0% 0
Hospitality 730 445 75% 335
Leisure 1,435 120 0% 0
Total 15,235 8,385 45% 3,730
Source: EEFM 2013 / NLP analysis
Watford Economic Growth & Delivery Assessment : Final Report
7179769v9 P77
6.83 Given that the major development projects already have a quantum of floorspace attributed to them, it is not necessary to model the additional employment space required to accommodate their associated jobs. An analysis of emerging supply of employment space in Watford (including as part of the major development projects) is summarised in Section 7.0.
Commuting
6.84 The two labour supply scenarios considered above assume that existing commuting relationships (i.e. as implied by the 2011 Census) are maintained over the plan period between Watford Borough and other authorities. Given that Watford is a net importer of labour (i.e. the Borough imports more workers than it exports), these scenarios therefore allow for some in-commuting to the Borough as part of the growth in labour supply.
6.85 The resulting requirement could be reduced if it were assumed that the scale of in-commuting reduces over the plan period (i.e. that Watford imports fewer workers from other areas), and that Watford’s role as a regional employment centre declines. If an approach was pursued that solely planned for indigenous labour force growth (i.e. amongst the Borough’s resident workforce but not allowing for any in-commuters), this would reduce the scale of annual B class job growth to 157 B class jobs per annum (under scenario 3) to 250 B class jobs (under scenario 4).
6.86 By purely capturing the indigenous growth potential associated with Watford’s economically active population, this approach risks under providing for the additional potential associated with non-residents such as inward investors and in-commuters and would be inconsistent with the Local Plan vision to enhance Watford’s role as a centre of regional economic significance.
Loss Replacement
6.87 Another assumption which could make a significant difference to the forecasts of future requirements includes the allowance for replacement of future losses over the plan period. With no allowance for future losses, the lowest estimate of future industrial space needs (past take-up based scenario) would result in a more significant negative requirement of -141,560sq.m. It would also result in a negative requirement for the remaining three scenarios (all of which are otherwise positive). Removing the allowance for future office losses would also result in a very low negative requirement under the past take-up based approach of -97,875sq.m.
6.88 As noted earlier, losses of employment space have been significant in recent years, particularly outside of the Borough’s main employment areas on non-allocated sites that lack policy protection for B class uses. There is a risk that this space is permanently lost (and occupiers potentially displaced) from the Borough’s portfolio if planning policy fails to re-provide it elsewhere in Watford.
6.89 For example, if past rates of B class losses (covering the nine years 2004-2013) were to continue unchanged in future, it is possible to estimate that the
Watford Economic Growth & Delivery Assessment : Final Report
P78 7179769v9
Borough’s stock of office space outside of these main employment areas would be eroded away within just over eight years43 or just over 32 years across the Borough as a whole.44 Similarly, it is possible to estimate that the Borough’s stock of industrial space outside of the main employment areas could be eroded away within 13 years45 should the past scale of industrial losses continue, or just under 40 years across the Borough as a whole.46
Conclusions
6.90 In interpreting the outputs of this section, regard should be had to PPG guidance which states that Local Authorities should develop an idea of future economic needs based on a range of data and forecasts of quantitative and qualitative need. In this respect, planning for employment growth should avoid relying upon using single sources of data or projections which tend to rely upon a number of different variables which are inevitably subject to change.
6.91 It is also important to recognise that there are inevitable uncertainties and limitations associated with modelling assumptions under any of the future growth scenarios considered. For example, there are some inherent limitations to the use of local level economic forecasts, particularly in the context of significant recent changes in the economy. For example, economic forecasts are regularly updated and the resulting employment outputs will change over the plan period.
6.92 Four different scenarios of future employment space requirements have been considered, based on a number of approaches which reflect economic growth, past development trends and potential housing supply factors. The majority of these reflect assumptions of higher future economic growth in Watford than the Borough has achieved in the recent past. Two of the four scenarios also imply a higher level of annual B class job growth than the job target set out in the Watford Local Plan Part 1 (i.e. 7,000 jobs over the 25 year period 2006 to 2031) although this job target is derived from 2009 based EEFM employment forecasts which do not reflect the latest macro-economic assumptions and outlook and imply a significantly higher level of total employment in Watford in 2006 (i.e. the start year of the plan period) whereby reducing the scale of growth that is anticipated to be generated over the study period.
6.93 The overall gross space requirements related to these different scenarios range from -74,275sq.m to 299,750sq.m of all types of employment space to 2031, implying in broad terms a need for between -16.4ha and 36.6ha of employment land. The majority of this spatial requirement relates to office (B1a/b) uses.
43 Assuming annual average loss of 6,750sq.m of office space and total current stock of 55,360sq.m office space outside of main employment areas 44 Assuming annual average loss of 6,750sq.m of office space and total current stock of 218,170sq.m office space across the whole of the Borough 45 Based on an annual average loss of 9,950sq.m of industrial space and total current stock of 123,730sq.m industrial space outside of main employment areas 46 Based on an annual average loss of 9,950sq.m of industrial space and total current stock of 380,750sq.m industrial space across the whole of the Borough

Watford Economic Growth & Delivery Assessment : Final Report
7179769v9 P79
6.94 Given an uncertain economic outlook, it is difficult to select the most likely option from these alternative growth pictures and all four scenarios have been tested against the Borough’s supply position (Section 7.0). The scenario based on past take-up rates continuing (scenario 2) provides a less robust basis for understanding objectively assessed need arising from economic growth as past take-up rates are likely to have been unduly constrained by past losses of space and supply-side factors. Adopting such an approach effectively represents an acceptance that the Borough will continue to underperform economically and fail to achieve its full economic potential by planning for negligible new development of business space. This approach would therefore fail to meet the NPPF requirement to plan positively for growth.
6.95 In contrast, the two higher growth scenarios (as implied by the SNPP labour supply and EEFM job growth approaches) are based on the most up-to-date demographic and macroeconomic assumptions and therefore provide the most objective assessment of needs.
6.96 Recognising the Borough’s spatial constraints, the draw of central London and other established employment locations, and development pressures on employment land in the Borough, but also within the context of the NPPF requirement to plan positively for growth, the Council should plan to accommodate at least the Local Plan based labour supply based requirement (scenario 3), to ensure that the Borough’s indigenous growth potential (i.e. arising from its resident workforce) is not constrained by lack of spatial capacity in future.

Watford Economic Growth & Delivery Assessment : Final Report
P80 7179769v9
7.0 Demand/Supply Balance
7.1 This section draws together the forecasts of future employment land needs in Section 6.0 and the estimates of land available on the area’s existing and allocated employment sites in Section 3.0 to identify any need for more provision of employment space, or surpluses of it, in both quantitative and qualitative terms.
Quantitative Balance
7.2 The previous section identified a need for between -74,275sq.m and 299,750sq. of employment space up to 2031, including a modest safety margin largely to allow for delays in sites coming forward for development. The land requirements associated with these amounts of employment floorspace were estimated at between-16.4ha and 36.6ha, clearly reflecting a wide variation in the level of growth that could be supported by Watford’s economy over the plan period.
Pipeline Supply
7.3 As detailed in Section 3.0, the pipeline supply of employment space in the Borough comprises outstanding planning permissions (that have yet to be implemented at March 2013) and the Borough’s major development projects which are expected to come forward for B class development (either in part or in whole) over the plan period. In gross terms, this supply is estimated at just under 81,000sq.m of B class space, the majority of which relates to the Borough’s major development projects.
7.4 Given that some of these developments represent ‘step-change’ projects in terms of the nature and scale of employment growth that they are expected to deliver, they are expected to deliver approximately 3,730 net additional jobs over and above the level of job growth implied by the EEFM baseline forecasts for Watford across the local plan period 2006 to 2031 (see Table 6.15 for more details).The floorspace that has been identified through the major development projects to accommodate these net additional jobs is therefore not genuinely available to meet the ambient level of growth implied by the scenarios explored in Section 6.0 and has therefore been excluded from the pipeline supply of employment space for the purposes of this analysis.
7.5 The resulting emerging supply totals 34,165sq.m of B class space as summarised in Table 7.1 and is equivalent to just under five years of past gross B class take-up in Watford.
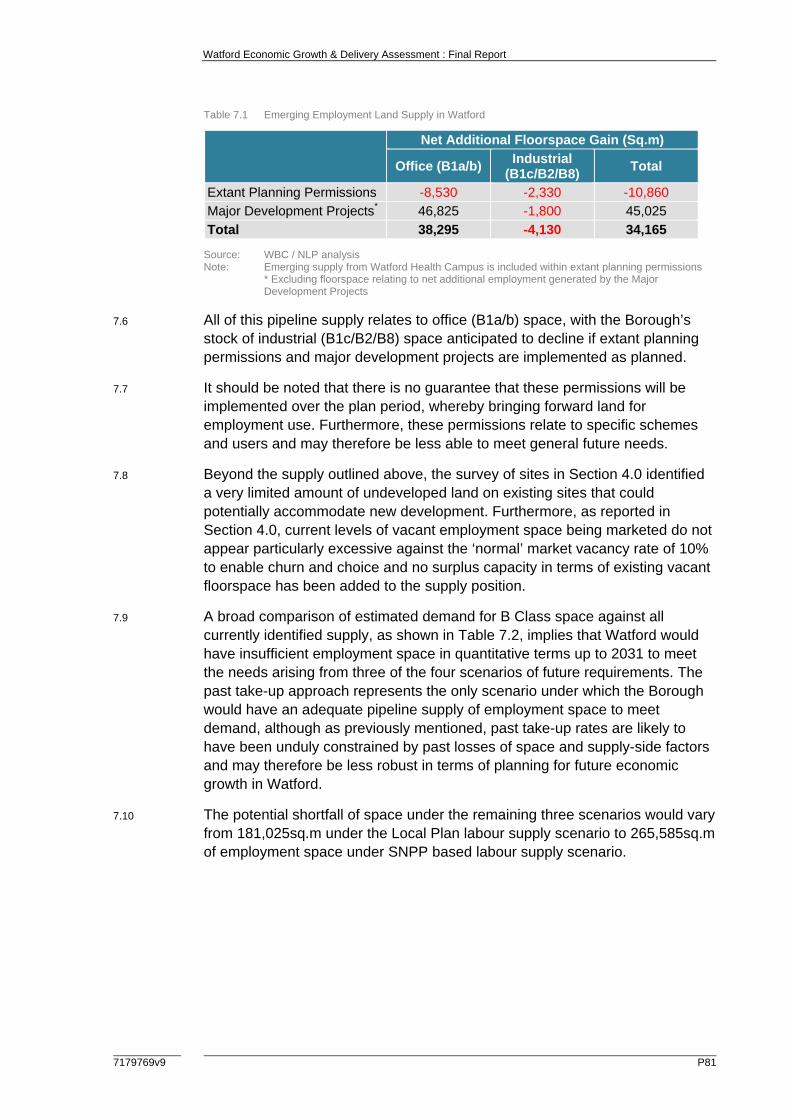
Watford Economic Growth & Delivery Assessment : Final Report
7179769v9 P81
Table 7.1 Emerging Employment Land Supply in Watford
Net Additional Floorspace Gain (Sq.m)
Office (B1a/b) Industrial
(B1c/B2/B8) Total
Extant Planning Permissions -8,530 -2,330 -10,860
Major Development Projects* 46,825 -1,800 45,025
Total 38,295 -4,130 34,165
Source: WBC / NLP analysis Note: Emerging supply from Watford Health Campus is included within extant planning permissions * Excluding floorspace relating to net additional employment generated by the Major
Development Projects
7.6 All of this pipeline supply relates to office (B1a/b) space, with the Borough’s stock of industrial (B1c/B2/B8) space anticipated to decline if extant planning permissions and major development projects are implemented as planned.
7.7 It should be noted that there is no guarantee that these permissions will be implemented over the plan period, whereby bringing forward land for employment use. Furthermore, these permissions relate to specific schemes and users and may therefore be less able to meet general future needs.
7.8 Beyond the supply outlined above, the survey of sites in Section 4.0 identified a very limited amount of undeveloped land on existing sites that could potentially accommodate new development. Furthermore, as reported in Section 4.0, current levels of vacant employment space being marketed do not appear particularly excessive against the ‘normal’ market vacancy rate of 10% to enable churn and choice and no surplus capacity in terms of existing vacant floorspace has been added to the supply position.
7.9 A broad comparison of estimated demand for B Class space against all currently identified supply, as shown in Table 7.2, implies that Watford would have insufficient employment space in quantitative terms up to 2031 to meet the needs arising from three of the four scenarios of future requirements. The past take-up approach represents the only scenario under which the Borough would have an adequate pipeline supply of employment space to meet demand, although as previously mentioned, past take-up rates are likely to have been unduly constrained by past losses of space and supply-side factors and may therefore be less robust in terms of planning for future economic growth in Watford.
7.10 The potential shortfall of space under the remaining three scenarios would vary from 181,025sq.m under the Local Plan labour supply scenario to 265,585sq.m of employment space under SNPP based labour supply scenario.

Watford Economic Growth & Delivery Assessment : Final Report
P82 7179769v9
Table 7.2 Demand/Supply of B Class Employment Space in Watford (to 2031)
1. Baseline Job Growth
(EEFM)
2. Past Development
Rates
3. Labour Supply (260
dw.p.a.)
4. Labour Supply (2012 Based SNPP)
Requirement for B Class Space (sq.m)
292,810 -74,275 215,190 299,750
Available Employment Space (sq.m)
34,165
Surplus (+)/Shortfall (-) (sq.m)
-258,645 +108,440 -181,025 -265,585
Needs of Different Employment Uses
7.15 Ensuring an adequate choice of types of sites is also important to meet the needs of different employment sectors and the aims for diversity of employment opportunities at different skill levels. Potential supply of employment space for both industrial and office uses was therefore compared with estimated requirements for these uses.
7.16 Table 7.3 and Figure 7.1 compare the demand and supply situations for industrial and offices uses separately. This indicates that there would be insufficient supply available, in purely quantitative terms, to meet both industrial and office needs arising under three of the four demand estimates. The only instances where there would be enough supply available to meet identified needs would be under the past take-up scenario, which as discussed in the previous section represents a ‘low growth’ trajectory for Watford’s economy over the plan period.
7.17 For industrial space, the shortfall extends to -64,065sq.m under the SNPP based labour supply approach, and is even greater for office space at -211,215sq.m to 2031 (under the EEFM baseline scenario). This predicted shortfall assumes that all outstanding planning permissions (at March 2013) come forward in full for employment development over the plan period. Any deviation from this assumption could potentially increase the existing deficit of employment space.

Watford Economic Growth & Delivery Assessment : Final Report
7179769v9 P83
Table 7.3 Demand/Supply for office and industrial space to 2031 (sq.m)
1. Baseline Job Growth
(EEFM)
2. Past Development
Rates
3. Labour Supply (260
dw.p.a.)
4. Labour Supply (2012 Based SNPP)
Industrial
Industrial space requirement
43,300 -60,760 17,000 59,935
Potential supply of industrial space
-4,130
Surplus(+)/Shortfall(-) -47,430 +56,630 -21,130 -64,065
Offices
Office space requirement
249,510 -13,515 198,190 239,815
Potential supply of office space
38,295
Surplus(+)/Shortfall(-) -211,215 +51,810 -159,895 -201,520
Figure 7.1 Forecast surplus of office and industrial space to 2031 by scenario
Source: NLP analysis
7.22 On paper, this suggests that the identified pipeline supply as it stands provides for insufficient industrial and office space to meet the Borough’s employment development needs to 2031 in purely quantitative terms. However, there are factors which mean this issue requires further consideration, set out below.
Qualitative Factors
7.23 Even where no quantitative shortfall of space is identified, in some circumstances additional land may be needed for qualitative reasons, for example to:
improve the choice of provision for occupiers;
-250,000
-200,000
-150,000
-100,000
-50,000
0
50,000
100,000
Off
ice
Indu
stria
l
Off
ice
Indu
stria
l
Off
ice
Indu
stria
l
Off
ice
Indu
stria
l
1. Job Growth (Baseline) 2. Past Take-Up 3. Labour Supply (260 dw.p.a.) 4. Labour Supply (2012 SNPP)
Sur
plus
(+) /
shor
tfal
l (-)
(Sq.
m)
Scenario
-211
,215
56,6
30
51,8
10
-159,8
95
-21,1
30
-47,4
30
-201,5
20
-64,0
65
Watford Economic Growth & Delivery Assessment : Final Report
P84 7179769v9
meet gaps in the supply of particular types of premises;
improve or modernise the quality of current provision and so help attract more occupiers; or
provide a better spatial distribution of employment sites to meet the needs of different settlements.
7.24 Qualitative needs are considered for each broad property type/area individually.
Offices
7.25 Although Watford’s office market has struggled in recent years as a result of the dotcom bust, recession and strong competition from competing nearby locations, it has improved more recently as occupier demand has risen. However, completions of new office space have been minimal over the last few years reflecting continued market uncertainty and gap between achievable and viable rental values. It is possible that in the foreseeable future tight supply will push values to the level where new office development can occur if sufficient land can be made available to accommodate such growth.
Industrial
7.26 By contrast, the industrial market in Watford has remained buoyant in recent years partly reflecting its strong strategic location. Market feedback points to an acute shortage of available land to accommodate industrial occupier requirements and there is evidence that a lack of supply has already constrained industrial activity in the Borough through limited take-up of property.
7.27 This lack of new industrial space puts Watford at a distinct disadvantage to nearby competitors such as Hemel Hempstead where buildings are continually being churned (demolished and rebuilt), and coming forward to accommodate a range of industrial firms. A relatively low industrial vacancy rate (currently c. 7.5%) prevents the churn, intensification and upgrading of existing sites that would be expected to take place within a normal market environment (i.e. one that faces fewer land constraints).
7.28 The overwhelming view amongst local agents is that a continued lack of industrial supply will severely impede Watford’s future economic growth potential, in a sector that has proved more resilient during the recession. Local commercial agents consider there to be a need in Watford for at least one new industrial site to accommodate growth of indigenous firms and enable the churn and re-configuration of existing sites to better meet the needs/demands of firms.
Conclusions
7.29 Based on an analysis of employment space in the development pipeline, Watford has insufficient employment floorspace in quantitative terms to meet
Watford Economic Growth & Delivery Assessment : Final Report
7179769v9 P85
future needs for office and industrial uses up to 2031 under the majority of future growth scenarios considered. The starting point for planning policy therefore is that, to varying degrees, additional space will need to be identified if business needs are to be met within Watford over the plan period. From a purely quantitative perspective, the existing shortfall of employment space ranges from181,025sq.m to 265,585sq.m depending upon the scenario (accepting that the lowest growth scenario based on past take-up rates continuing presents a less robust basis for planning for future economic growth in Watford).
7.30 It should be noted that the range of employment space requirements presented here relate to the 25 year plan period 2006 to 2031; an analysis of monitoring data indicates that the Borough has been losing B class space in net terms each year between 2006 and 2014 (i.e. the point in time at which this study has been undertaken) and has therefore failed to deliver the additional employment space required to accommodate the anticipated growth in labour demand and supply over the first few years of the plan period. This places increased pressure on the remaining 17 years to deliver this additional employment space.
7.31 From a more qualitative perspective, market feedback suggests that a continued lack of both industrial and office supply will severely impede Watford’s future economic growth potential, and that additional employment space is needed to accommodate growth of indigenous firms and enable the churn and re-configuration of existing sites to better meet the needs/demands of firms.
Watford Economic Growth & Delivery Assessment : Final Report
P86 7179769v9
8.0 Conclusions and Policy Implications
8.1 This section draws together overall conclusions and considers potential policy approaches in relation to employment space for the Local Plan Part 2, Economic Development Strategy as well as other measures which may be required to support Watford’s economic growth objectives.
Overview of Watford
8.2 Watford has a relatively successful economy reflecting its role as a major sub-regional centre. Nevertheless, recent economic performance has been uneven, with the Borough recording average employment growth (including some periods of decline), strong working-age population growth, relatively high levels of business start-up and self-employment but below average productivity levels which may in part reflect a mismatch within the local economy between lower skilled jobs available, and a more highly qualified resident workforce, many of whom commute out of the Borough to higher paid employment elsewhere.
8.3 The Borough is identified by the LEP as a key location for growth in Hertfordshire and is recognised as having significant potential to capture commercial and residential growth over the plan period. The construction of the Croxley Rail Link (CRL) provides a key catalyst, identified in the Hertfordshire Strategic Economic Plan (2014) as the principal infrastructure project for the sub-region, which will enable larger-scale developments to come forward at both a faster rate and higher value.
8.4 Watford’s employment space is dominated by industrial uses although commercial office stock is also relatively significant at just over 200,000sq.m. Both office and industrial space has gradually been eroded in recent years, driven by significant losses of B class space and increasing pressure from other, higher value uses.
8.5 Watford is a key driver of Hertfordshire’s commercial property market with a critical mass of occupiers ranging from civil engineering to retail, large employers through to a thriving SME community. The Borough’s industrial market has been relatively resilient to the recession and demand for industrial premises in Watford is now generally strong, and locations that are close to Junction 5 of the M1 are particularly sought after for distribution purposes. By contrast, the Borough’s office market has experienced a more turbulent time in the last few years, following the dotcom crash, recent recession and strong competition from nearby locations such as St Albans. Nevertheless, the office market has picked up in recent years as occupier demand and take-up of space has risen.
8.6 The Borough’s employment potential remains constrained by a number of factors. There is an acute shortage of available employment land and market feedback indicates that it requires more industrial space to accommodate indigenous growth and enable the necessary churn and upgrading/

Watford Economic Growth & Delivery Assessment : Final Report
7179769v9 P87
intensification of existing sites. In addition, there is currently a significant issue in terms of the viability of bringing forward office schemes in Watford, though it is possible that in the foreseeable future tight supply will push values to the level where this can occur.
Progress against Local Plan Job Target
8.7 The Watford Local Plan Part 1 identifies a target to provide at least 7,000 additional jobs in the Borough between 2006 and 2031 in order to maintain Watford’s role as a regional centre. It is understood that this figure is based upon employment growth forecasts and scenarios discussed in the Council’s Employment Topic Paper 2010 which included reference to the Autumn 2009 and Autumn 2010 EEFM baseline employment forecasts for the Borough with an allowance for a higher rate of office and health related job growth over the plan period to 2031. The majority of this job growth target related to B class (i.e. office and industrial) uses.
8.8 In order to establish how much progress has been made to date against this job target, the latest EEFM employment forecasts for Watford have been obtained as part of the EGDA from the Spring 2013 release. These forecasts imply a scale of job growth in the Borough for the period 2006 to 2031 that is nearly twice as high has the Autumn 2009 based forecasts which were used to inform the Local Plan Part 1 job target (Figure 8.1). This divergence is likely to reflect the different macro-economic outlook that prevailed at the time that the EEFM was prepared, with the latest forecasts driven by a considerably more optimistic outlook.
Figure 8.1 Local Plan Job Growth Target Compared with 2013 EEFM Employment Forecasts
Source: EEFM / WBC / NLP analysis Note: Figures exclude the EEFM employment activities sector
53,210
66,500
58,920
65,920
50,000
52,000
54,000
56,000
58,000
60,000
62,000
64,000
66,000
68,000
To
tal W
ork
forc
e J
ob
s
EEFM Spring 2013
Local Plan Target (2010 EEFM)
+3,590
2014

Watford Economic Growth & Delivery Assessment : Final Report
P88 7179769v9
8.9 Latest 2013 based EEFM data suggests that total workforce jobs in Watford have increased by 3,590 between 2006 and 2014, equivalent to 27% of the total 13,290 workforce jobs that are forecast to 2031. This level of growth is also equivalent to just over half of the Local Plan job target of 7,000 between 2006 and 2031, although this target was derived from an earlier EEFM data release that generated a more modest scale of employment growth over the plan period when compared with the latest data.
8.10 It should be noted that the baseline employment position for 2006 (i.e. the start year of the plan period) has changed between the two EEFM datasets, with the latest 2013-based EEFM projections implying that the starting point for the purposes of monitoring job growth is lower (at 53,210 workforce jobs in 2006) than suggested by the 2009 based EEFM data (58,920 workforce jobs in 2006) excluding the employment activities sector in both cases. This underlines the difficulty in comparing datasets over time
8.11 Nevertheless, both sets of EEFM employment projections (2009 and 2013) point to a similar level of workforce jobs in Watford in 2031 (circa 66,000) and a general alignment in workforce jobs by around 2020 (Figure 8.1). The main divergence occurs early on in the plan period, reflecting a greater degree of uncertainty associated with employment forecasts over the short to medium term. It is therefore recommended that the Council adopt the EEFM (excluding employment activities) as a consistent dataset against which to monitor progress against its job target over the Local Plan period, recognising that fluctuations will occur in overall recorded employment within the Borough as and when new datasets are released which may lead to revisions to the historic series.
Functional Economic Market Area
8.12 Watford’s functional economic market area (FEMA) is characterised by a range of economic, property and labour market factors and is driven by its geographical location within the wider Hertfordshire sub region but also its close proximity to Greater London. These inter-relationships have been explored in detail in earlier sections, but can be summarised as follows.
8.13 Strong commuting flows in and out of the Borough represent a key factor influencing the Borough’s FEMA, with nearby authorities of Three Rivers, Hertsmere, St Albans and Dacorum representing the origin and destination of the majority of these flows, alongside Greater London (particularly in terms of out-commuting). Reflecting its role as a regional centre of employment, the Borough remains a net importer of labour, although latest Census 2011 commuting data indicates that Watford’s self-containment rate (i.e. the proportion of residents also working within the Borough) has declined by approximately 12% over the 10 years since the 2001 Census, driven by a greater proportion of out-commuting. This may in part, be a reflection of working-age population growth out-pacing job growth in recent years (as shown previously in Figure 2.5) although these trends are projected to reverse
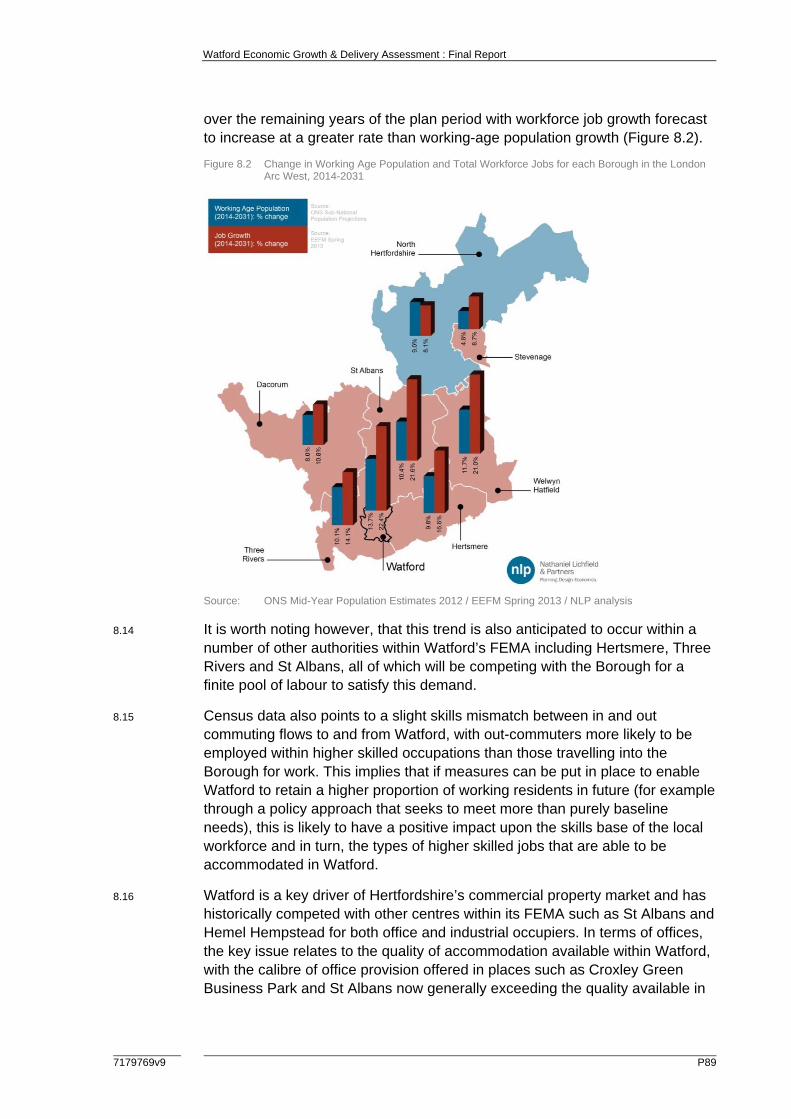
Watford Economic Growth & Delivery Assessment : Final Report
7179769v9 P89
over the remaining years of the plan period with workforce job growth forecast to increase at a greater rate than working-age population growth (Figure 8.2).
Figure 8.2 Change in Working Age Population and Total Workforce Jobs for each Borough in the London Arc West, 2014-2031
Source: ONS Mid-Year Population Estimates 2012 / EEFM Spring 2013 / NLP analysis
8.14 It is worth noting however, that this trend is also anticipated to occur within a number of other authorities within Watford’s FEMA including Hertsmere, Three Rivers and St Albans, all of which will be competing with the Borough for a finite pool of labour to satisfy this demand.
8.15 Census data also points to a slight skills mismatch between in and out commuting flows to and from Watford, with out-commuters more likely to be employed within higher skilled occupations than those travelling into the Borough for work. This implies that if measures can be put in place to enable Watford to retain a higher proportion of working residents in future (for example through a policy approach that seeks to meet more than purely baseline needs), this is likely to have a positive impact upon the skills base of the local workforce and in turn, the types of higher skilled jobs that are able to be accommodated in Watford.
8.16 Watford is a key driver of Hertfordshire’s commercial property market and has historically competed with other centres within its FEMA such as St Albans and Hemel Hempstead for both office and industrial occupiers. In terms of offices, the key issue relates to the quality of accommodation available within Watford, with the calibre of office provision offered in places such as Croxley Green Business Park and St Albans now generally exceeding the quality available in
Watford Economic Growth & Delivery Assessment : Final Report
P90 7179769v9
Clarendon Road. Many of Watford’s neighbouring authorities have fewer land constraints and consequently more land available for employment development, leaving the Borough largely unable to compete for larger scale enquiries.
8.17 In light of the identified significant shortfall of employment land required to meet economic growth needs over the plan period, it is likely that some of Watford’s business needs could be accommodated outside of its administrative boundary but within its broad FEMA. Ideally these needs would be met by locations close or near to Watford including established employment areas near to the Borough boundary such as Croxley Green and Leavesden Business Parks, although neighbouring authorities would need to consider the extent to which this could impact the ability to meet their own business and job growth needs.
8.18 In this context, it will be important for any future studies to consider how the economic and business needs for Watford and other adjoining authorities should be accommodated across the wider sub-region in a complementary way, whilst recognising that any business requirements that are unable to be met in Watford would not necessarily locate in the wider FEMA area but could also seek locations beyond the sub-region.
8.19 Watford is also recognised as a key sub-regional centre for growth by the Hertfordshire LEP which has prioritised investment (including Growth Deal funding) in the Borough to deliver economic benefits through various regeneration and infrastructure schemes including the Croxley Rail Link and five Major Development Projects. This will be relevant to how Watford and its adjoining authorities consider how growth needs can best be accommodated. In addition, the Borough lies at the heart of the M1/M25 Growth Area which is acknowledged by the LEP as a hub for film and creative media industries, open innovation and environmental technologies.
Policy Implications
8.20 The economic scenarios considered in the previous sections indicate the broad scale and type of growth arising from different approaches to modelling the Borough’s future employment space needs. To varying degrees, they reflect both indigenous needs arising within the Borough as businesses establish and grow, and footloose demand which operates across the Borough’s boundaries from the wider sub-region. In the context of the NPPF and PPG, the Council’s policy approach should (particularly in the aftermath of a period of economic recession and the Government’s Plan for Growth) aim to at least fully meet Watford’s employment space needs so that the Borough’s economy is not unduly constrained, recognising that developments in adjoining areas that fall within Watford’s functional economic market area will also be a key influence.
8.21 The employment space requirements associated with the scenario based on past take-up continuing (-74,275sq.m to 2031) provide a less robust basis for planning for economic growth as past take-up rates are likely to have been

Watford Economic Growth & Delivery Assessment : Final Report
7179769v9 P91
unduly constrained by past losses of space and supply-side factors. Adopting such an approach would effectively represent an acceptance that the Borough will continue to underperform economically and fail to achieve its full economic potential by planning for a continued erosion of the stock of business space, mainly (but not exclusively) as a result of housing development. Such an approach would not comply with the requirements of the NPPF, and in the longer-term would undermine the overall sustainability and vitality of the Borough. The Council should plan to accommodate at least the Local Plan labour supply based requirement (215,190sq.m to 2031), to ensure that the Borough’s indigenous growth potential (i.e. arising from its resident workforce) is not constrained by lack of spatial capacity.
8.22 However, to ensure a flexible and responsive policy framework, it will be necessary not just to focus on meeting forecast quantitative requirements (which will fluctuate over time), but to think about the opportunities and risks that flow from particular policies. That might concern how trends in losses of space over time can be managed, how delivery can be prioritised in some locations or for some types of employment uses, or how scope can be created for meeting as yet undefined inward investment opportunities, but also not protecting legacy employment sites for which there is genuinely no longer a productive employment use. Planning for employment will need to be balanced against pressures from other land uses, as well as other Local Plan objectives such as planned housing growth. B-class employment space also competes with non B-class uses, some of which may also generate local economic benefits or have identified needs that the NPPF indicates should be supported.
8.23 This requires choices in the Local Plan about which sites to protect or allocate for employment development, or which to consider for mixed use development (either in whole or part). That judgement must ultimately take account of:
a the local benefits of B-class sectors and the need to maintain a diversified and resilient economy that is open to growth and new economic opportunities as they arise (as envisaged by the NPPF);
b the economic and other outcomes (e.g. labour market) if some sectors become displaced or are otherwise constrained from expanding within the Borough, and potential strategies to retain existing businesses;
c the need to encourage growth of high quality jobs within the Borough to help address the disparity between resident employee earnings (higher) and workplace earnings (lower);
d the trade-off between seeking more intensive use of sites and thereby yielding higher net job creation over time, and identified business needs (as specified in the NPPF) which may for some activities or sectors imply a less efficient use of land in order to function effectively; and
e maintaining a delivery trajectory for employment space with short, medium and longer-term opportunities over the life of the Local Plan.
8.24 Through the forthcoming site allocations work, the Local Plan Part 2 should seek to plan for a choice of sites and locations to meet the needs of particular
Watford Economic Growth & Delivery Assessment : Final Report
P92 7179769v9
sectors and occupier needs. However, because growth in the Borough will be constrained by a lack of capacity in the form of new employment sites, business growth will need to be accommodated within the Borough’s existing employment sites and premises which, like many parts of the wider sub-region, are under pressure from residential development. However once employment sites are lost to residential uses it can be difficult to find effective substitution without careful planning. It is therefore imperative that the Council ensures they have sufficient stock in prime market locations to accommodate future employment growth. Some further commentary on the approach and potential options for providing for the different B-class uses are considered below.
Office Uses
8.25 Watford’s office market is focused around Clarendon Road which comprises a mixture of relatively new high quality offices and older secondary space, alongside a number of serviced office providers including Regus and i2Office. There are also smaller office clusters in other locations such as the Imperial Way/Colonial Way employment area, Watford Junction and Watford Business Park.
8.26 Whilst occupier demand has recently increased, very limited levels of new office development have occurred over the last two decades. Although office vacancy has been falling and rents marginally increasing, current rental values still lag behind the level required for new development to be viable in the Borough.
8.27 The Borough continues to attract some demand from larger office occupiers seeking corporate style office accommodation and this is typically serviced by provision at Clarendon Road and Station Road which benefits from excellent access to public transport as well as town centre services and facilities. Watford is also characterised by its complementary out-of-town campus style office accommodation at Watford Business Park, Croxley Green and Leavesden (the latter two locations fall outside of Watford’s administrative boundary) although these schemes tend to lack critical mass as office locations and are inevitably less well placed to compete with the town centre in terms of amenities and connections.
8.28 In terms of quantitative requirements, the analysis contained in section 6.0 identifies a significant positive requirement for office floorspace under three of the four scenarios considered, although the EEFM job growth scenario (249,510sq.m/ 22.5ha) and latest SNPP based labour supply (239,815sq.m/ 21.6ha) approaches are considered to represent the most up-to-date objectively assessed need for planning purposes, whilst it is recognised that the past take-up based approach is likely to be a significant under estimate.
8.29 A comparison with future supply of employment space identified by Council monitoring data indicates that Watford has insufficient office space to meet these needs to 2031 under those scenarios of future growth considered most appropriate to plan for. This existing deficit could worsen if the supply identified

Watford Economic Growth & Delivery Assessment : Final Report
7179769v9 P93
as available (most notably through the Borough’s Major Development Projects) does not come forward over the Plan period.
8.30 In terms of how these future office needs are accommodated and distributed, this should be informed by an assessment of what the market can deliver, the types of space required and locations of strongest demand. A key barrier in this regard has been the lack of delivery of high quality office space (even before the recession) which leads to a perception that the Borough is underperforming in commercial property market terms, and the market feedback was that the Borough could sustain significantly more office development activity. This has a significant long-term implication because lack of space may ultimately constrain the Borough’s ability to retain its businesses as they grow and expand. This lack of delivery may reflect a number of factors:
1 a surplus supply of dated office accommodation typically characterised by larger, inflexible floorplates and configuration which has had the effect of suppressing rental values;
2 development viability and pressure from higher value uses (e.g. residential) with market feedback indicating that currently achieved office rents (circa £20/sq.ft) fall short of rental values required to make new development viable (c.£25/sq.ft); and
3 historical concentration of office space within a small number of locations (i.e. Clarendon Road/Station Road) with limited internal competition within the Borough, meaning that a significant proportion of the Borough’s office stock is controlled by a small number of land owners/developers and therefore influenced by their aspirations/intentions.
8.31 Therefore, one of the key challenges the Council must seek to manage is how to ensure delivery of new space, particularly in central Watford, but also structuring supply in other parts of the Borough to respond to market opportunities. This is considered in more detail below.
Clarendon Road
8.32 As Watford’s prime office location, Clarendon Road has excellent access to public transport and town centre services and amenities but simultaneously has the lowest car parking standard ratios in the Borough. Market feedback suggests that these car parking standards are starting to have an impact on the appeal of the area to occupiers particularly as both Clarendon Road and Station Road can become congested at busy periods and as the trend towards lower car parking ratios hinder some of Clarendon Road’s older, less well specified office stock from coming forward for redevelopment.
8.33 The area also suffers from a market perception of high vacancy; whilst there are a number of properties currently being marketed as vacant, the scale of this vacancy is not excessive beyond normal market conditions where there is always an element of occupier churn and is particularly low for prime ‘Grade A’ space. There are however a number of buildings on Clarendon Road that
Watford Economic Growth & Delivery Assessment : Final Report
P94 7179769v9
appear underutilised (such as Gresham House, 53 Clarendon Road) or are no longer in office use (such as 36 Clarendon Road) and in some cases have been neglected. This trend has a negative effect on the perception of this employment area and risks undermining the role of Clarendon Road as Watford’s prime location for office uses in future.
8.34 Linked to this, increasing pressure to provide housing in the area has led the Council to introduce an Article 4 Direction to preserve the area’s office based employment use and it is recommended that this protection is continued in future, through its status as an employment area (Policy EMP1 in the Local Plan Part 1) and through forthcoming site allocations policies in the Local Plan Part 2. In light of the Council’s wider aspirations to regenerate the town centre to provide a balance of town centre facilities, infrastructure and employment uses, it may also be advisable for the Council to undertake further work to explore the impact that a greater critical mass of retail, leisure (including night time economy) and residential uses could have upon the role and perception of the town centre as a business location.
8.35 As the area does not accommodate any of the Borough’s pipeline supply of employment space, on paper there is currently no identified capacity for further development at Clarendon Road.
Other Locations
8.36 Office accommodation can also be found in clusters elsewhere in the Borough, some falling within designated employment areas and some outside. This is an important source of additional supply to ensure diversity and choice for a range of local business needs, particularly for those office occupiers who are not seeking a town centre location. Specific comments on other locations with office policy designations in the Local Plan Part 1 or that form part of the Borough’s Major Development Projects are set out below.
Colonial Way/Imperial Way
8.37 The site accommodates a mix of B class uses including a number of purpose built, high quality office buildings dating from the 1990s with corporate occupiers including JD Weatherspoon and Hilton Worldwide. Although the area benefits from ample off-street parking and good access to the strategic road network, it is characterised by encroachment from other non B uses such as gyms which undermines its status as a prime office area. The mixed nature of the site means that it is unlikely to develop a sufficient critical mass to be considered a strong office location in the future.
Watford Junction
8.38 Aside from the provision noted above at Colonial Way/Imperial Way, this area currently represents one of the Borough’s secondary office locations. However, proposals for major mixed-use regeneration of Watford Junction (which falls within SPA2) will provide over 46,000sq.m of office space within the area, which represents the majority of the Borough’s pipeline supply of employment
Watford Economic Growth & Delivery Assessment : Final Report
7179769v9 P95
space over the plan period. Whilst Watford Junction (in particular the area to the north of the station) represents a relatively untested location in office market terms, it provides the opportunity to extend the successful Clarendon Road cluster, particularly through the provision of some new office accommodation that is suitable for larger office occupiers.
Ascot Road
8.39 As one of the Borough’s major development projects, the site is subject to proposals for a new mixed-use development including over 40,000sq.m of new office floorspace. This scheme would benefit from the area’s good access to the strategic road network and proximity to the adjacent Watford Business Park and Croxley Green. New office provision in this location would also benefit from the forthcoming Croxley Rail Link, providing direct access to Watford town centre and beyond via Cassiobridge station.
8.40 This location is currently an untested proposition in market terms, but its proximity to the established Croxley Green Business Park and the opportunity to accommodate larger requirements (one of very few in the Borough) give confidence that the site can contribute to meeting future needs.
Business Parks
8.41 Watford Business Park, Croxley Green and Leavesden together comprise the Borough’s edge/out of town business parks and although the latter two fall outside the Borough’s administrative boundary, their proximity to Watford coupled with the nature of accommodation (of the scale and form that cannot reasonably be provided within the more built up areas of Watford) place them within the Borough’s functional economic market area. Watford Business Park is subject to major redevelopment and refurbishment as part of its designation within SPA6 and one of the Borough’s Major Development Projects which will enhance its role and competitiveness as an edge of town office location.
8.42 Croxley Green Business Park has recently benefited from an extensive rolling refurbishment the outcome of which is a high quality campus office environment. Leavesden Park (on the Borough’s North West boundary) also represents a good quality scheme but suffers from poor public transport links and low demand for its large floorplates. The latter in particular lacks critical mass as an office location and will be less able to compete for town centre occupiers given its less favourable public transport links and range of amenities. Leavesden may however have some potential to accommodate creative media sectors seeking a location close to the Warner Bros Studios nearby if its space could be reconfigured.
Industrial Uses
8.43 Watford’s industrial property market has remained buoyant in recent years partly reflecting its strong strategic location and long standing portfolio of established industrial sites and areas including Imperial Way/Colonial, Watford

Watford Economic Growth & Delivery Assessment : Final Report
P96 7179769v9
Business Park and the Greycaine Road/Odhams Industrial Estate. Whilst the majority of these sites are protected for employment use under Policy EMP1 of the Local Plan Part 1, there are a number of non-allocated sites that continue to play an important role in accommodating the Borough’s (generally smaller scale) industrial activity, but which are at greater risk from higher value uses such as residential because no policy protection is in place.
8.44 Market feedback noted that the industrial market in the Borough is particularly tight and has been for a number of years. Evidence suggests that that a lack of supply is starting to constrain industrial activity in the Borough through limited take-up of property and industrial enquiries being diverted to adjoining areas (such as Hemel Hempstead) where the available stock of space is greater. A relatively low industrial vacancy rate (currently c. 7.5%) prevents the churn, intensification and upgrading of existing sites that would be expected to take place within a normal market environment (i.e. one that faces fewer land constraints).
8.45 In terms of quantitative requirements, the main implication of the analysis contained in section 6.0 is that a modest positive requirement for industrial floorspace is identified under the majority of scenarios. The job growth (43,300sq.m/ 10.8ha) and SNPP based labour supply (59,935sq.m/ 15.0ha) approaches are considered the more accurate guide for planning purposes. The requirement is relatively modest; to provide some context, these requirements amount to between 10 – 14% of the total current stock of industrial and warehousing space in Watford recorded by the VOA, to be delivered over a 25-year period. In quantitative terms, it would appear that Watford has insufficient identified industrial land to meet future needs to 2031 under those scenarios that represent the most up-to-date objective assessment of business needs in this sector.
8.46 This positive requirement is very much supported by qualitative market feedback which indicates a general perception that Watford is “full up” for industrial activities, and that the limited spare capacity in the system may be resulting in adverse outcomes for occupiers (i.e. businesses) – for example, not being able to expand or relocate to meet business needs, or being ‘locked’ in premises that are no longer suitable as insufficient alternatives exist. It also provides no incentive or ability for site owners to manage their space effectively and improve the quality of the estates/premises.
Accommodating a Positive Requirement
8.47 Within the context of accommodating a positive floorspace requirement for both office and industrial uses over the plan period, a number of (not mutually exclusive) options emerge for consideration by the Council, potentially as part of site allocation policy development in the Local Plan Part 2. These options are presented together due to the fact that the issues are broadly similar across all B class uses (i.e. that a shortfall exists between the demand for and supply of employment space over the plan period).
Watford Economic Growth & Delivery Assessment : Final Report
7179769v9 P97
1) Major Development Projects
8.48 Given that the Borough’s Major Development Projects are intended to deliver a step-change in Watford’s local economy through the scale and nature of employment growth and regenerative value, there may be scope to increase the B Class floorspace capacity currently assumed across the projects in order to help to address the identified shortfall over the plan period. This could include more intensive development proposals at Watford Junction, Watford Health Campus and Ascot Road, although this will need to be offset against a potential reduction in the scope for accommodating other non B class uses such as retail and residential on these sites whilst consideration should be given to viability issues arising from a changed mix, particularly over the short to medium term.
8.49 Alongside this, there may also be scope to explore opportunities to deliver employment floorspace within other Major Development Projects that do not currently propose B class uses. This could include the town centre (SPA1) which currently focuses upon retail and leisure based enhancements and employment growth. The town centre currently accommodates a relatively large provision of office space although outside of Clarendon Road/Station Road this provision lacks critical mass and tends to be characterised by older, poorly specified stock that has limited market appeal. Nevertheless, there are some examples of high quality office developments such as Royalty House on King Street and the Local Plan Part 2 provides a key opportunity to develop and set out a clear economic strategy for town centre office provision, which actively encourages new office development as part of high quality, mixed use (re)development.
8.50 The demand/supply analysis presented in Section 7.0 assumes that not all of the floorspace expected to come forward as part of the Major Development Projects over the plan period will be available to meet needs arising from the scenarios of economic growth considered as part of this study, because these projects are intended to deliver a step-change in the scale of employment growth recorded in the Borough which would imply meeting growth over and above the baseline growth trajectory (i.e. the EEFM baseline job growth scenario). If the Council were to assume that the full quantum of floorspace associated with the Major Development Projects becomes available to meet the scenarios of growth considered by this study, this would reduce the shortfall of employment space in the Borough to 2031 (although not eliminate it completely) but it could also undermine the ability of the Borough to capture and accommodate the step-change in employment growth and activity that the Council is seeking.
2) Resist loss of employment space in future
8.51 The Borough has recorded significant losses of employment space over the past decade (as detailed in Section 3.0) to the extent that average annual net development rates have been negative across both office and industrial uses. This has also led to a decreasing supply of employment space in overall terms
Watford Economic Growth & Delivery Assessment : Final Report
P98 7179769v9
in Watford over the last decade or so. This has occurred despite the presence of Policy EMP 1 in the Local Plan Part 1 (and Policy E1 in the previous Watford District Plan 2000) which seeks to protect the Borough’s allocated employment areas for B class uses.
8.52 Council monitoring data indicates that while some of these losses were driven by a small number of large ‘one-off’ developments such as at the former Sun Chemicals site, the majority comprised of a large number of smaller developments that occurred across the Borough. Whilst in isolation these redevelopments may appear relatively insignificant, when combined their effect has been to erode the stock of industrial space by 5,290sq.m in net terms on average per year since at least 2004.
8.53 Within the context of the NPPF requirement that “planning policies should avoid the long term protection of sites allocated for employment use where there is no reasonable prospect of a site being used for that purpose” (para 22), the site assessment process undertaken as part of this study indicates that the Borough’s portfolio of employment sites are generally well performing and largely occupied by businesses. The analysis does not identify any evidence to suggest that the sites assessed have no reasonable prospect of being/continuing to be used for employment uses over the plan period. This should be reviewed on a regular basis to take account of any changing factors over the plan period.
8.54 In order to minimise future losses, the Council should consider adopting a stricter approach to determining planning proposals seeking change of use and/or loss of employment floorspace, by either resisting any net loss of B class floorspace or requesting a net gain on redevelopment sites. As a minimum, this policy should be applied to the Borough’s main employment areas to ensure that Watford retains its business base and sector strengths, particularly as nearby competing centres continue to take a pro-active approach to attracting investment and have greater land supply readily available for development.
8.55 Monitoring data also indicates that where B class space was lost to other non B class uses, the majority of this (84%) occurred outside of the Borough’s main employment areas (i.e. as defined by areas E1 to E7 in the Watford Local Plan Part 1) and by implication, across the Borough’s non allocated employment sites. In light of the significant shortfall of employment space to meet identified needs over the plan period, there is scope to consider extending the Local Plan Policy EMP 1 to some non-allocated sites which currently have no status or protection in the Local Plan, but which make some contribution to meeting employment needs. The site appraisal exercise undertaken as part of this study (presented in section 4.0) concludes that the majority of the non-allocated sites assessed were considered to be average performing sites with potential for a range of B use classes. However, it is unlikely that this policy approach alone would bridge the gap between demand and supply of employment space over the plan period to 2031.

Watford Economic Growth & Delivery Assessment : Final Report
7179769v9 P99
8.56 It is worth noting that the positive requirements for office and industrial space incorporate some allowance for replacement of ongoing losses of employment space to other uses48, whilst recognising the difficulty of continuing to replace losses due to the Borough’s physical constraints and lack of readily available land for development. Theoretically, a reduction in the requirement for space could be achieved by removing or reducing the allowance for replacing for windfall losses of employment space. However, such an approach would run counter to the well-established principle in employment land assessments. Moreover, such an accounting exercise would risk a diminution in the amount of industrial space available and lead to a further tightening in the market for space, potentially harming the Borough’s economic vitality.
3) Allocate new employment sites
8.57 The option of allocating additional sites for office and industrial development would increase the current choice of sites and enable the Borough to capture key economic opportunities such as expansion of firms both from within and outside of the Borough. Such an approach may also allow an opportunity for decanting of existing occupiers, and in turn, provide an opportunity for other sites within Watford to be rationalised and/or intensified in order to remain attractive/competitive to the market.
8.58 As a tightly constrained and under-bounded Borough, new development sites are limited. Any new site/allocation should seek to benefit from Watford’s strong transport links, but also be located close to established employment areas where possible to capitalise upon critical mass and cluster effects as well as existing amenities and facilities.
8.59 Based on the site assessments undertaken as part of this study, potential locations could include the Gas Holder site within SPA4 which has potential for a combination of warehousing, workshops and a small element of office space, possibly involving the restoration of Frogmore House, which is Grade II* listed. The BT Depot site to the south east of Watford Junction was assessed as a relatively good, well located employment site and could be suitable for B1 office uses.
8.60 Furthermore, Woodside Leisure Park could provide a suitable location for warehousing/distribution space or a small high quality business park due in part to its strong strategic links and road access. However, as the site is currently occupied by a multiplex cinema, bowling alley and restaurants, this represents a longer term opportunity should it ever become available for a more traditional form of employment use. Both of these sites scored reasonably well through the site appraisal exercise against a range of access, compatibility and market attractiveness factors.
8.61 The Council could re-visit this shortlist of potential new sites for employment allocation and use the forthcoming Local Plan Part 2 site allocations process to further appraise these sites (giving consideration to issues such as viability and
48 This reflects the approach advocated in the ODPM guidance and the former SEEPB Guidance (2010)
Watford Economic Growth & Delivery Assessment : Final Report
P100 7179769v9
ownership) to consider whether they may be suitable for employment development, either in whole or as part of a mixed use development.
4) Intensification of existing sites
8.62 The upgrading and refurbishment of existing employment areas, and where possible, redevelopment so that they can be used more efficiently provides a further option for accommodating future requirements. Better utilisation of the existing office and industrial stock could be achieved either through gradual redevelopment of individual plots, for example replacing a large older unit with development of modern smaller units for which there is good demand.
8.63 In this context, the provision of additional employment land supply (under the option described above) would facilitate movement of firms from existing sites and premises and thereby release redevelopment opportunities. To complement this, it may be appropriate to explore opportunities to de-risk planning issues for certain types of development, in a way that is appropriate to the site context and managing the range of B-class uses to be accommodated. This could include, for example, supplementary planning documents such as a design guide that sets out guidance to outline what the Council considers to represent good design in a particular employment area or site, or a development framework that seeks to guide the nature of development and manage conflicts between different use classes which may be present on a site.
8.64 However, barriers to redevelopment of (particularly industrial) premises in the Borough include generally high occupancy levels and low vacancy (making redevelopment opportunities rare), and potentially viability considerations in the current economic climate. From the site assessments, it appears that there may be limited opportunities for intensification beyond Watford Business Park where a Masterplan is already in place to encourage more effective and efficient use of the site (as part of one of the Borough’s Major Development Projects and SPA6).
8.65 It is clear from the site assessment process that some of the Borough’s main employment areas have seen encroachment from other non B class uses in recent years, including at Imperial Way/Colonial Way. The Council could consider defining a core business area within such employment areas where only B-class uses will be permitted, taking account of the current pattern of development, key frontages and where scope for improvements (e.g. public realm, linkages) have been identified. A more flexible approach could remain in place on other parts of the site where a wider range of uses are permitted subject to criteria so that the overall employment functioning of the site is not undermined. The Council will need to consider the implications this may have on meeting other development needs within the Borough.
5) Assume (and plan for) needs to be met elsewhere
8.66 A final option is to not specifically identify additional capacity for employment space, and by implication, assume that these needs are met on non-allocated

Watford Economic Growth & Delivery Assessment : Final Report
7179769v9 P101
sites or are displaced to adjoining local authority areas that fall within the Borough’s functional economic market area. Such an approach would need to be carefully investigated through duty to cooperate arrangements to ensure consistency with the Development Plans of adjoining authorities.
8.67 Beyond this, however, it would not appear to be an option that was compatible with sustainable development objectives, and would unduly risk harming economic activities which form an important part of any functioning economy. As noted previously, there are a number of key employment areas that fall just outside of the Borough’s administrative boundary (including Croxley Green Business Park and Leavesden Park) but are considered to sit within Watford’s functional economic area. An approach that relies upon such sites to accommodate the majority of the Borough’s future employment needs could also run the risk of failing to meet occupier demand which tends to be focused upon Watford’s town centre locations such as Clarendon Road that benefit from the Borough’s strong public transport connections.
Other Policy Issues
Constructing a delivery trajectory for employment sites
8.68 In light of the significant quantitative requirement for additional employment space in Watford over the plan period and the limited supply of employment space coming through the development pipeline, it is recommended that the Council identify a realistic delivery trajectory for employment sites (including both major development projects and commitments), particularly in the case of future office space where the shortfall of pipeline supply is particularly acute. However, it is also an issue for industrial sites, where a quantitative requirement for additional supply has been identified and there are limited immediate new development opportunities on existing protected sites.
8.69 Accordingly, the Council should evidence how its portfolio of major development projects and other development opportunities will support delivery of new space over the short, medium and long-term (structured broadly in five year periods). This accords with the approach set out in the former SEEPB guidance on employment land assessments which encouraged local authorities to demonstrate a five-year rolling supply of employment land. Where any gaps are identified, the Council will want to consider options for how this can be addressed (potentially as part of the Local Plan Part 2). Therefore, it is helpful for sites to be assessed on a consistent basis in order to determine at broadly what point in the Plan period they may become available, and how important any individual site is for meeting either office or industrial needs within any rolling five-year period.
8.70 In determining the likely timing and availability of land, this delivery trajectory should have regard to:
a the planning status of sites (extant planning permission, major development project etc);
Watford Economic Growth & Delivery Assessment : Final Report
P102 7179769v9
b development constraints/costs and known requirements for infrastructure;
c current developer/landowner aspirations; and
d market delivery and viability factors.
8.71 The assessment provides the opportunity to identify and map out the Local Plan’s ‘when’, ‘whom’ and ‘how’ employment space delivery actions for each site. In turn, it will also offer a basis to continually assess the potential role of a site in meeting employment land and other Local Plan objectives (and, inter alia, the policy benefits that would accrue if earlier delivery of the site was encouraged). The trajectory should be linked to the annual monitoring process and periodically updated to ensure the rolling supply of employment land during the Plan period.
Monitoring
8.72 Reflecting guidance set out in the PPG, it will be important to monitor future change in the demand and supply of employment space to identify changing patterns and inform any policy responses required. This is particularly significant given the scale of B class floorspace losses in Watford in recent years, despite Core Strategy policies in place to protect this space from other higher value uses. Specific items which it could be useful to monitor are identified below.
a levels of future demand for office/industrial space and which of the study’s estimates of future requirements this best relates to;
b how much of the currently identified supply of employment space commitments are likely to come forward and whether any new sites emerge;
c the extent and type of any losses of existing employment land to non B uses, particularly residential (part of the on-going monitoring of PNOs under PD rights) and in a more consistent format than existing monitoring arrangements (i.e. recorded in floorspace rather than land/hectares); and
d any on-going deficiencies in provision for specific types of employment premises e.g. small, low cost, business or industrial units.
Watford Economic Growth & Delivery Assessment : Final Report
7179769v9 P103
Appendix 1 Consultees/Workshop Attendees
Robin Vaughan - Kier
John Rockminster - Lambert Smith Hampton
Peter Brown - Brasier Freeth
Perry Holt - Perry Holt
Chris Smiddy - Smiddy & Co
Paul Felton - Stimpsons
Marcus Richardson - Greenhills
Jane Custance, WBC
Andrew Gibson, WBC
Cherie Norris, WBC
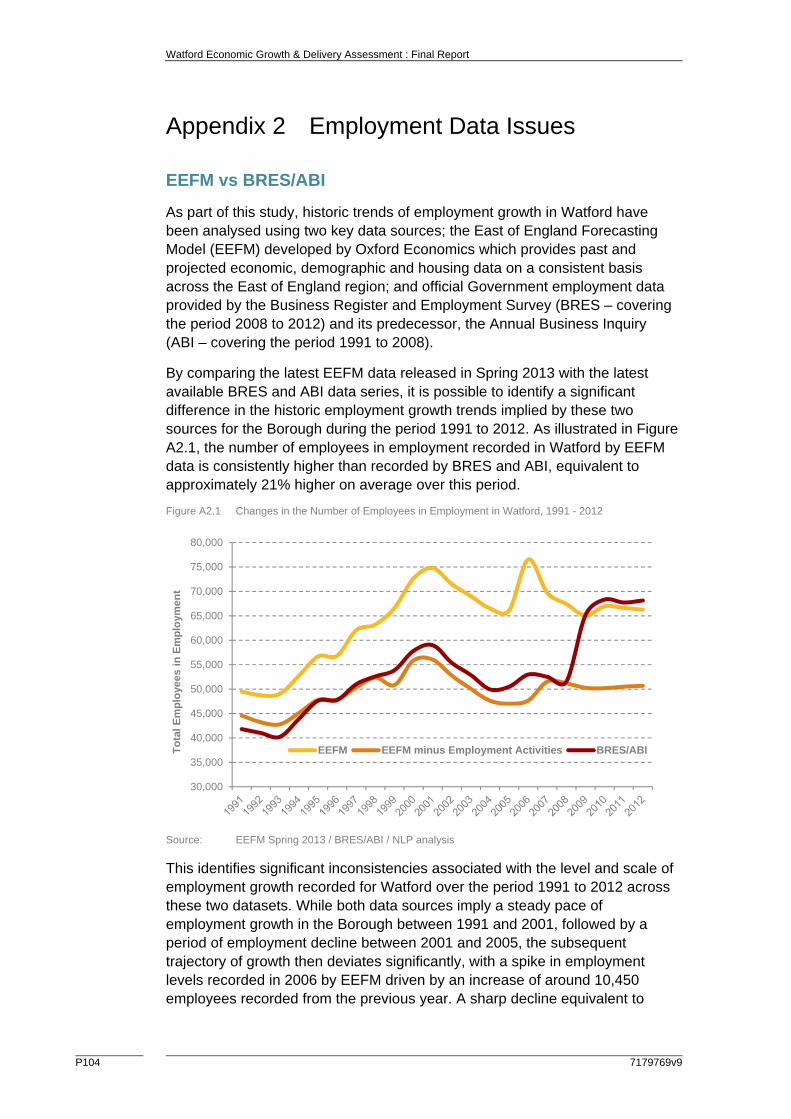
Watford Economic Growth & Delivery Assessment : Final Report
P104 7179769v9
Appendix 2 Employment Data Issues
EEFM vs BRES/ABI
As part of this study, historic trends of employment growth in Watford have been analysed using two key data sources; the East of England Forecasting Model (EEFM) developed by Oxford Economics which provides past and projected economic, demographic and housing data on a consistent basis across the East of England region; and official Government employment data provided by the Business Register and Employment Survey (BRES – covering the period 2008 to 2012) and its predecessor, the Annual Business Inquiry (ABI – covering the period 1991 to 2008).
By comparing the latest EEFM data released in Spring 2013 with the latest available BRES and ABI data series, it is possible to identify a significant difference in the historic employment growth trends implied by these two sources for the Borough during the period 1991 to 2012. As illustrated in Figure A2.1, the number of employees in employment recorded in Watford by EEFM data is consistently higher than recorded by BRES and ABI, equivalent to approximately 21% higher on average over this period.
Figure A2.1 Changes in the Number of Employees in Employment in Watford, 1991 - 2012
Source: EEFM Spring 2013 / BRES/ABI / NLP analysis
This identifies significant inconsistencies associated with the level and scale of employment growth recorded for Watford over the period 1991 to 2012 across these two datasets. While both data sources imply a steady pace of employment growth in the Borough between 1991 and 2001, followed by a period of employment decline between 2001 and 2005, the subsequent trajectory of growth then deviates significantly, with a spike in employment levels recorded in 2006 by EEFM driven by an increase of around 10,450 employees recorded from the previous year. A sharp decline equivalent to
30,000
35,000
40,000
45,000
50,000
55,000
60,000
65,000
70,000
75,000
80,000
To
tal
Em
plo
yees
in
Em
plo
ymen
t
EEFM EEFM minus Employment Activities BRES/ABI

Watford Economic Growth & Delivery Assessment : Final Report
7179769v9 P105
some 6,850 employees is then recorded by the following year. This anomaly can largely be explained by data volatility issues relating to the employment activities sector within Watford, discussed in more detail below.
By contrast, the BRES/ABI series records a significant uplift in employment between 2008 and 2009 equivalent to around 13,500 jobs or 26%. This discrepancy can largely be explained by a change in the ONS methodology for undertaking the ABI and BRES employer surveys. The introduction of BRES resulted in a discontinuity when comparing the estimates produced by BRES to those of its predecessor, the ABI, whereby BRES yields an estimate of employment in 2008 that is higher than obtained from ABI for the same year. This known discontinuity issue undermines the reliability of BRES and ABI employment data and its robustness as a tool for monitoring employment change in Watford going forward.
Employment Activities Sector
The 2013 EEFM published dataset notes an overcount in the number of employee jobs recorded in the employment activities sector in Watford reflected in both historical and forecast data. This is largely attributed to the presence of the National NHS Recruitment Centre on Clarendon Road which records employee jobs at this head office location, although the majority are actually based outside of Watford. In order to account for this anomaly, guidance in the EEFM dataset recommends discounting 75% of the jobs in this sector to provide an adjusted and more accurate estimate of employment in Watford. This adjustment factor is based on the significant disparity in the number of employees in employment activities reported by ABI and BRES in 2008, as well as the changes in methods used by these two employer surveys.
It should be noted that even after discounting 75% of these jobs from the Watford dataset, the employment activities sector still represents one of the largest employment sectors in Watford historically, while the data series to which this adjustment factor is applied to still remains highly volatile and inconsistent. Furthermore, the most significant spike in employment associated with the employment activities sector was recorded in 2006 (as shown in Figure D2.2) which coincides with the base year of the Watford Local Plan. This suggests that the baseline employment position in 2006 or starting point against which to monitor future job growth in the Borough has been inflated (as a result of data methodological issues) to a level which is unrepresentative of actual workplace jobs located within Watford.
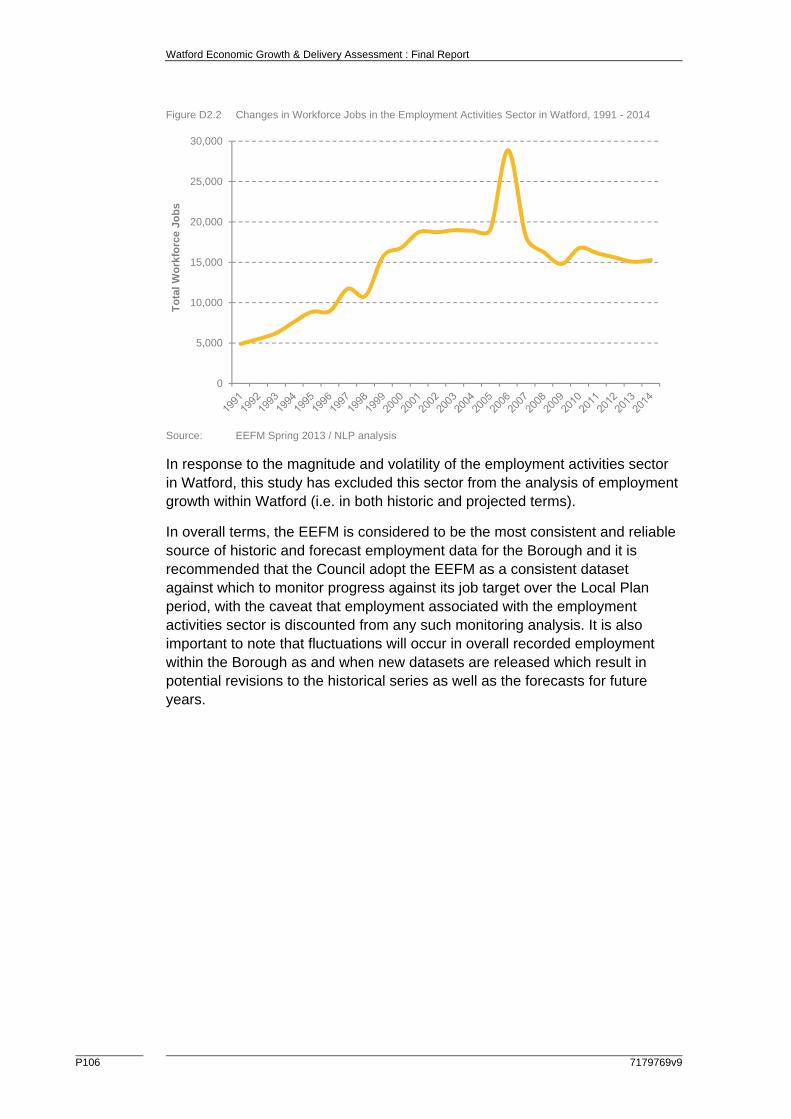
Watford Economic Growth & Delivery Assessment : Final Report
P106 7179769v9
Figure D2.2 Changes in Workforce Jobs in the Employment Activities Sector in Watford, 1991 - 2014
Source: EEFM Spring 2013 / NLP analysis
In response to the magnitude and volatility of the employment activities sector in Watford, this study has excluded this sector from the analysis of employment growth within Watford (i.e. in both historic and projected terms).
In overall terms, the EEFM is considered to be the most consistent and reliable source of historic and forecast employment data for the Borough and it is recommended that the Council adopt the EEFM as a consistent dataset against which to monitor progress against its job target over the Local Plan period, with the caveat that employment associated with the employment activities sector is discounted from any such monitoring analysis. It is also important to note that fluctuations will occur in overall recorded employment within the Borough as and when new datasets are released which result in potential revisions to the historical series as well as the forecasts for future years.
0
5,000
10,000
15,000
20,000
25,000
30,000
To
tal
Wo
rkfo
rce
Job
s

Watford Economic Growth & Delivery Assessment : Final Report
7179769v9 P107
Appendix 3 Site Plans

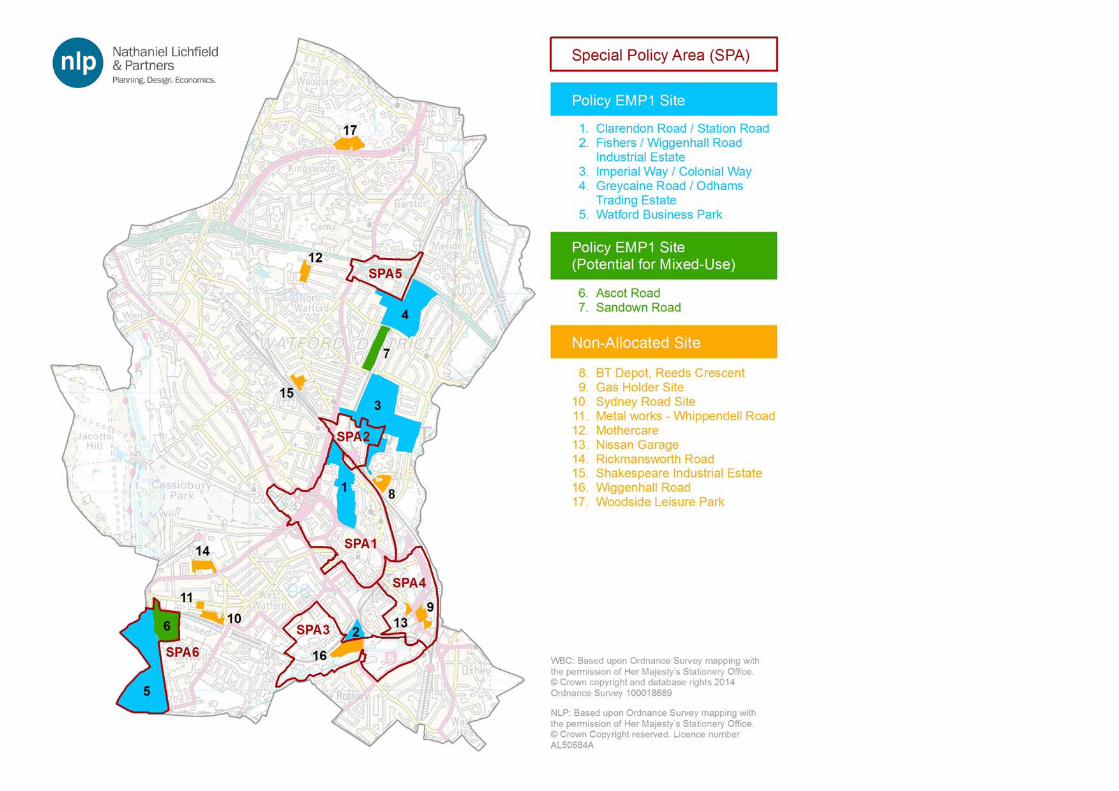

SPA1
SPA3
SPA4
SPA6
AscotRoad
WatfordBusinessPark
ClarendonRoad /Station Road
Fishers /WiggenhallRoadIndustrialEstate
WiggenhallRoad
GasHolderSite
Sydney Road Site
RickmansworthRoad
NissanGarage
Metal works- WhippendellRoad
WatfordLocal AuthorityContext
GIS Reference: S:\CL14036 - Economic Growth Study, Watford\CL14036 - Economic Growth Study, Watford - Employment Sites (01) - 27.06.2014.mxd
Economic Growth Study, Watford
Employment Sites
Watford Borough Council
27.06.2014-MARGIS14036/01-01
WBC: © Crown copyright and database rights 2014 Ordnance Survey 100018689
KeySpecial Policy Area (SPA)
Non-Allocated Site
Policy EMP1 Site
Policy EMP1 Site (Potential for Mixed-Use)

SPA1
SPA4
SPA2
RickmansworthRoad
BT Depot,ReedsCrescent
ShakespeareIndustrial Estate
ImperialWay /ColonialWay
ClarendonRoad/ StationRoad
SandownRoad
WatfordLocal AuthorityContext
GIS Reference: S:\CL14036 - Economic Growth Study, Watford\CL14036 - Economic Growth Study, Watford - Employment Sites (02) - 27.06.2014.mxd
Economic Growth Study, Watford
Employment Sites
Watford Borough Council
27.06.2014-MARGIS14036/01-02
WBC: © Crown copyright and database rights 2014 Ordnance Survey 100018689
KeySpecial Policy Area (SPA)
Non-Allocated Site
Policy EMP1 Site
Policy EMP1 Site (Potential for Mixed-Use)
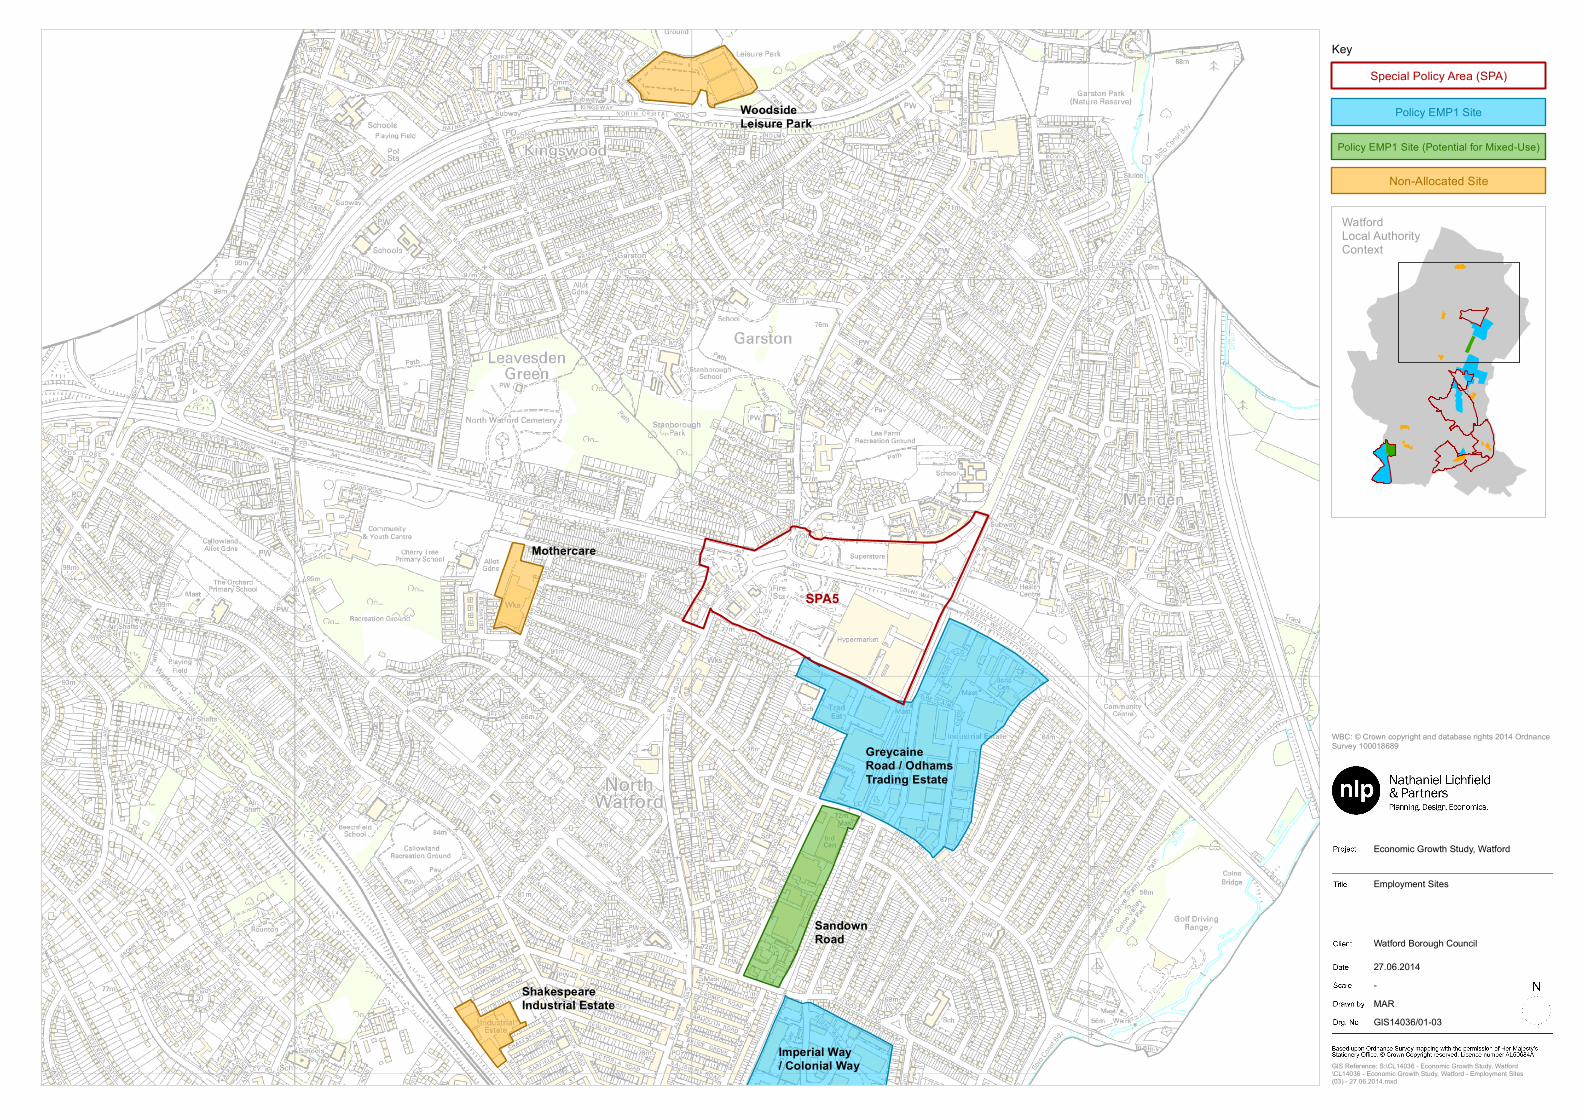
GreycaineRoad / OdhamsTrading Estate
Imperial Way/ Colonial Way
Mothercare
WoodsideLeisure Park
ShakespeareIndustrial Estate
SandownRoad
SPA5
KeySpecial Policy Area (SPA)
WatfordLocal AuthorityContext
GIS Reference: S:\CL14036 - Economic Growth Study, Watford\CL14036 - Economic Growth Study, Watford - Employment Sites (03) - 27.06.2014.mxd
Economic Growth Study, Watford
Employment Sites
Watford Borough Council
27.06.2014-MARGIS14036/01-03
WBC: © Crown copyright and database rights 2014 Ordnance Survey 100018689
Non-Allocated Site
Policy EMP1 Site
Policy EMP1 Site (Potential for Mixed-Use)
Watford Economic Growth & Delivery Assessment : Final Report
P108 7179769v9
Appendix 4 Site Assessment Criteria
The proposed criteria for assessing the quality/condition of allocated and other existing sites reflecting the particular circumstances of the local authority area are set out below. These criteria mainly relate to the inherent value of a site rather than current conditions on it, although such characteristics would also be noted. Additional criteria would apply to undeveloped allocated/development sites although ownership and availability information may not be possible to obtain in many cases and a judgement may need to be made on these.
Each site is given a score of between 1 and 5 against each criterion (1 = poor, 5 = very good). No individual weightings are attached to different criteria.
Scorings can reflect a combination of different factors applying to the same criteria and a balanced judgment has to be made on an appropriate overall score.
Strategic Road Access
5 = Very good: within 2 Km of strategic road junction/ via good unconstrained roads
1 = Poor: over 5 Km from strategic road junction/access, and/or through constrained/local roads, and/or through town centre or residential areas etc.
NB: Strategic road is typically defined as a motorway or ‘A class’ trunk road.
Local Accessibility
5 = Very good local access: via free moving good roads avoiding residential areas/difficult junctions; unconstrained vehicle access to the site with good visibility/lack of queuing; close access to range of town centre public transport services
1 = Poor: difficult/narrow road access, via residential roads, difficult site access junction, congested local roads; low level/limited range/infrequent public transport services nearby
Proximity to Urban Areas and Access to Labour and Services
5 = Very good: near centre of urban area with wide range of services nearby; proximity to sizeable residential areas providing local labour supply
1 = Poor: remote isolated site, no local services or residential areas nearby
Site characteristics and development constraints
5 = Very good: generally level site, regular shape, over 3 ha in size; low flood risk (Zone 1); no conservation or landscape constraints on scale of
Watford Economic Growth & Delivery Assessment : Final Report
7179769v9 P109
development; no adverse ground conditions or abnormal development costs; no other significant constraints on new development
1 = Poor: sloping/uneven site; under 0.5 ha, irregular/narrow shape, other severe constraints; within flood risk Zone 3; conservation or landscape constraints on scale of development; adverse ground conditions or abnormal development costs
Proximity to incompatible uses
5 = Within larger employment area/no incompatible surrounding land use
3-4 = B1 use adjoining residential/other sensitive uses
1 = B2/B8 adjoining residential/other sensitive uses
Market Attractiveness
5 = Very good: high profile/high quality appearance, managed site; good environment and quality of occupiers; under 10% vacant; viewed as attractive by agents/occupiers; recent investment/development activity, strong demand, units rarely available
1 = Poor: run-down unattractive appearance/location; attracts lower end users and over 25% vacant space/buildings; vacant units not marketed; no recent investment; units remain vacant for lengthy period
Sequential Status
Applies to existing/potential office sites only – identifies whether site is in town centre, edge of centre or out-of-centre location in NPPF terms
Barriers to Delivery
Identify any factors that would constrain development of the site for employment uses e.g. site occupied, need for infrastructure
Planning Factors
Identify any planning designations or policy constraints that could affect development of the site for employment uses

Watford Economic Growth & Delivery Assessment : Final Report
P110 7179769v9
Appendix 5 Site Assessments

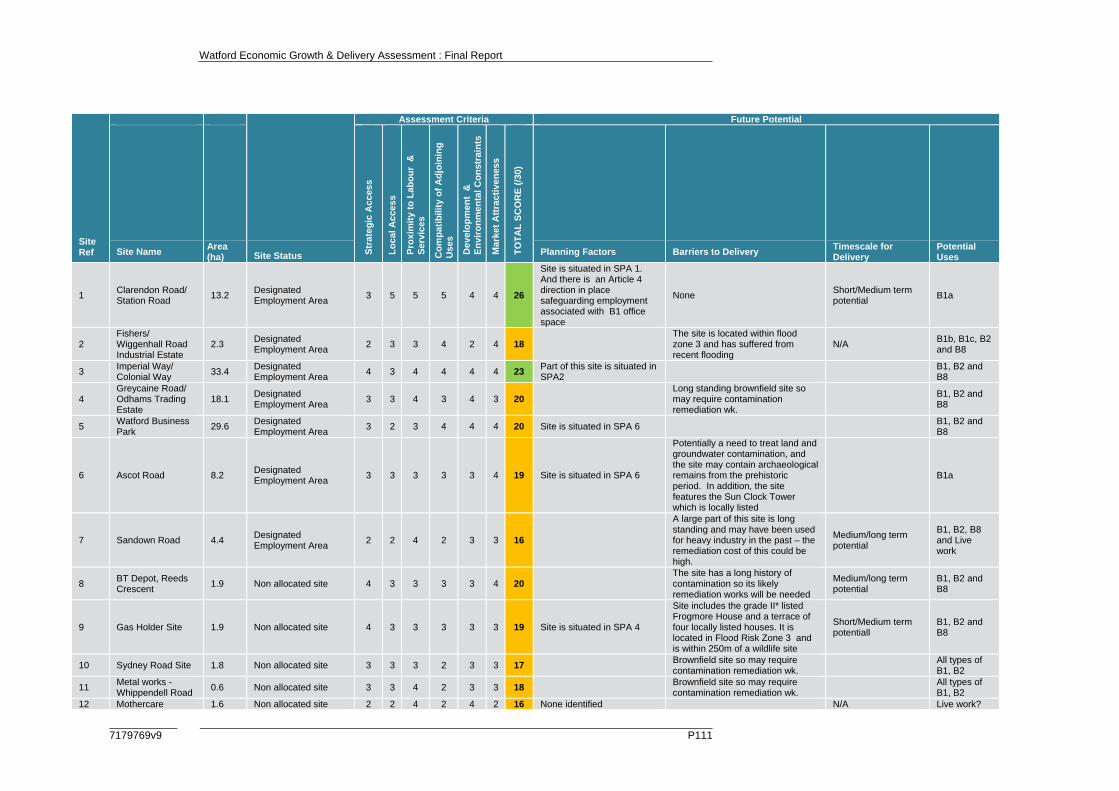
Watford Economic Growth & Delivery Assessment : Final Report
7179769v9 P111
Site Ref
Assessment Criteria Future Potential
Str
ateg
ic A
cces
s
Lo
cal A
cces
s
Pro
xim
ity
to L
abo
ur
&
Ser
vice
s
Co
mp
ati
bili
ty o
f A
djo
inin
g
Use
s
Dev
elo
pm
ent
&
En
viro
nm
enta
l Co
nst
rain
ts
Mar
ket
Att
ract
iven
ess
TO
TA
L S
CO
RE
(/3
0)
Site Name Area (ha) Site Status Planning Factors Barriers to Delivery
Timescale for Delivery
Potential Uses
1 Clarendon Road/ Station Road
13.2 Designated Employment Area
3 5 5 5 4 4 26
Site is situated in SPA 1. And there is an Article 4 direction in place safeguarding employment associated with B1 office space
None Short/Medium term potential
B1a
2 Fishers/ Wiggenhall Road Industrial Estate
2.3 Designated Employment Area
2 3 3 4 2 4 18 The site is located within flood zone 3 and has suffered from recent flooding
N/A B1b, B1c, B2 and B8
3 Imperial Way/ Colonial Way
33.4 Designated Employment Area
4 3 4 4 4 4 23 Part of this site is situated in SPA2
B1, B2 and B8
4 Greycaine Road/ Odhams Trading Estate
18.1 Designated Employment Area
3 3 4 3 4 3 20 Long standing brownfield site so may require contamination remediation wk.
B1, B2 and B8
5 Watford Business Park
29.6 Designated Employment Area
3 2 3 4 4 4 20 Site is situated in SPA 6 B1, B2 and B8
6 Ascot Road 8.2 Designated Employment Area
3 3 3 3 3 4 19 Site is situated in SPA 6
Potentially a need to treat land and groundwater contamination, and the site may contain archaeological remains from the prehistoric period. In addition, the site features the Sun Clock Tower which is locally listed
B1a
7 Sandown Road 4.4 Designated Employment Area
2 2 4 2 3 3 16
A large part of this site is long standing and may have been used for heavy industry in the past – the remediation cost of this could be high.
Medium/long term potential
B1, B2, B8 and Live work
8 BT Depot, Reeds Crescent
1.9 Non allocated site 4 3 3 3 3 4 20 The site has a long history of contamination so its likely remediation works will be needed
Medium/long term potential
B1, B2 and B8
9 Gas Holder Site 1.9 Non allocated site 4 3 3 3 3 3 19 Site is situated in SPA 4
Site includes the grade II* listed Frogmore House and a terrace of four locally listed houses. It is located in Flood Risk Zone 3 and is within 250m of a wildlife site
Short/Medium term potentiall
B1, B2 and B8
10 Sydney Road Site 1.8 Non allocated site 3 3 3 2 3 3 17 Brownfield site so may require contamination remediation wk.
All types of B1, B2
11 Metal works - Whippendell Road
0.6 Non allocated site 3 3 4 2 3 3 18 Brownfield site so may require contamination remediation wk.
All types of B1, B2
12 Mothercare 1.6 Non allocated site 2 2 4 2 4 2 16 None identified N/A Live work?
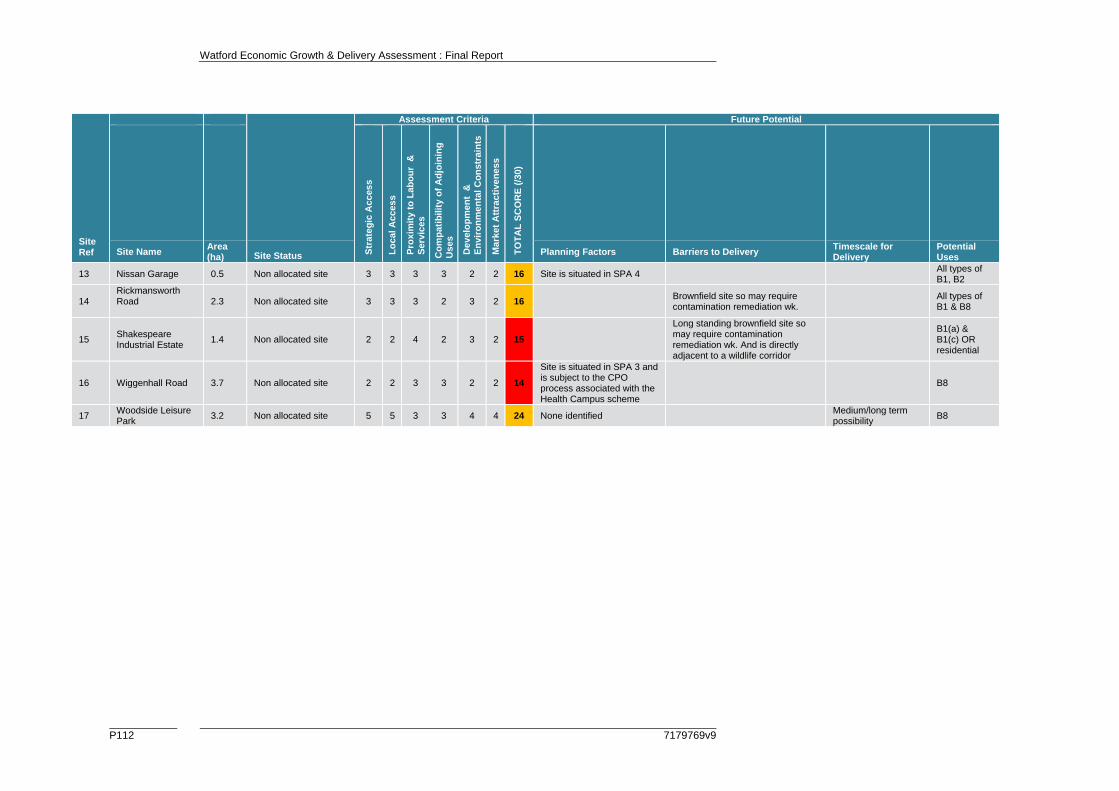
Watford Economic Growth & Delivery Assessment : Final Report
P112 7179769v9
Site Ref
Assessment Criteria Future Potential
Str
ateg
ic A
cces
s
Lo
cal A
cces
s
Pro
xim
ity
to L
abo
ur
&
Ser
vice
s
Co
mp
ati
bili
ty o
f A
djo
inin
g
Use
s
Dev
elo
pm
ent
&
En
viro
nm
enta
l Co
nst
rain
ts
Mar
ket
Att
ract
iven
ess
TO
TA
L S
CO
RE
(/3
0)
Site Name Area (ha) Site Status Planning Factors Barriers to Delivery
Timescale for Delivery
Potential Uses
13 Nissan Garage 0.5 Non allocated site 3 3 3 3 2 2 16 Site is situated in SPA 4 All types of B1, B2
14 Rickmansworth Road
2.3 Non allocated site 3 3 3 2 3 2 16 Brownfield site so may require contamination remediation wk.
All types of B1 & B8
15 Shakespeare Industrial Estate
1.4 Non allocated site 2 2 4 2 3 2 15
Long standing brownfield site so may require contamination remediation wk. And is directly adjacent to a wildlife corridor
B1(a) & B1(c) OR residential
16 Wiggenhall Road 3.7 Non allocated site 2 2 3 3 2 2 14
Site is situated in SPA 3 and is subject to the CPO process associated with the Health Campus scheme
B8
17 Woodside Leisure Park
3.2 Non allocated site 5 5 3 3 4 4 24 None identified Medium/long term possibility
B8

Watford Economic Growth & Delivery Assessment : Final Report
7179769v9 P113
Appendix 6 Definition of B Class Sectors
The method used for re-categorising the employment forecasts by sector into B-Class uses is summarised below.
Apportionment of B Class Sectors to Land Uses
Experian Sector Proportion of Jobs by Use Class
B1 office B2 industrial B8
warehousing Agriculture, Forestry & Fishing Non B-Class
Extraction & Mining Non B-Class
Food, Drink & Tobacco 0% 100% 0%
Textiles & Clothing 0% 100% 0%
Wood & Paper 0% 100% 0%
Printing and Recorded Media 0% 100% 0%
Fuel Refining 0% 100% 0%
Chemicals 0% 100% 0%
Pharmaceuticals 0% 100% 0%
Non-Metallic Products 0% 100% 0%
Metal Products 0% 100% 0%
Computer & Electronic Products 0% 100% 0%
Machinery & Equipment 0% 100% 0%
Transport Equipment 0% 100% 0%
Other Manufacturing 0% 100% 0%
Utilities 64%
Construction of Buildings Non B-Class
Civil Engineering Non B-Class
Specialised Construction Activities
0% 61% 0%
Wholesale 0% 16% 84%
Retail Non B-Class
Accommodation & Food Services Non B-Class
Land Transport, Storage & Post 0% 0% 40%
Air & Water Transport Non B-Class
Recreation Non B-Class
Media Activities 100% 0% 0%
Telecoms 100% 0% 0%
Computing & Information Services
100% 0% 0%
Finance 100% 0% 0%
Insurance & Pensions 100% 0% 0%
Real Estate 100% 0% 0%
Professional Services 100% 0% 0%
Administrative & Supportive Services
3% 0% 0%
Other Private Services Non B-Class
Public Administration & Defence 10% 0% 0%
Education Non B-Class
Health Non B-Class
Residential Care & Social Work Non B-Class
Source: EEFM / NLP analysis

Watford Economic Growth & Delivery Assessment : Final Report
P114 7179769v9
Appendix 7 EEFM Baseline Forecasts
EEFM Sector SIC 2007 Code
Workforce Jobs
2006 2031 Change 2006-2031
% Change 2006-2031
Agriculture 01-03 42 28 -14 -33.7
Mining and Quarrying 05-09 0 0 0 0.0
Food Manufacturing 10-12 68 82 14 20.1
General Manufacturing 13-18, 31-33
1,879 1,165 -714 -38.0
Chemicals 19-23 (excl 21)
804 402 -402 -50.0
Pharma 21 0 68 68 0.0
Metals 24-25 198 104 -94 -47.6
Transport 28-30 347 97 -250 -72.0
Electronics 26-27 400 264 -136 -34.0
Utilities 35-37 3 130 127 3690.0
Waste and remediation 38-39 93 120 28 29.7
Construction 41-43 4,853 3,571 -1,282 -26.4
Wholesale 45-46 4,334 4,146 -188 -4.3
Retail 47 9,303 8,948 -354 -3.8
Land Transport 49, 52-53 2,463 3,242 779 31.6
Water and air transport 50-51 4 3 0 -13.2
Hotels and restaurants 55-56 2,605 3,336 731 28.0
Publishing and broadcasting
58-60 911 1,145 234 25.7
Telecoms 61 475 557 82 17.2
Computer related activity 62-63 1,563 1,311 -252 -16.1
Finance 64-66 1,711 2,335 625 36.5
Real Estate 68 406 947 541 133.1
Professional services 69-75 (excl 72)
5,742 14,854 9,113 158.7
R+D 72 15 23 8 52.9
Business services 77-82 (excl 78)
2,472 3,803 1,332 53.9
Employment activities* 78 0 0 0 0.0
Public Administration incl land forces
84 1,728 1,211 -517 -29.9
Education 85 2,449 2,972 524 21.4
Health and care 86-88 4,560 7,500 2,940 64.5
Arts and entertainment 90-93 1,011 2,446 1,434 141.8
Other services 94-99 2,772 1,689 -1,083 -39.1
Total (rounded) 53,210 66,500 13,290 25.0
Source: EEFM 2013
*Excluding employment activities sector