wave and tidal power: projects and prospects - virginia …€¦ · wave and tidal power: projects...
TRANSCRIPT
Wave and Tidal Power:Wave and Tidal Power:Projects and ProspectsProjects and Prospects
by
George [email protected]
Virginia TechCenter for Energy and the Global Environment
Northeast CZM Partners WorkshopVirginia Beach, Virginia
07 October 2005

Presentation OutlinePresentation Outline
• Wave Energy Resource: A derived form of solar energy, inthat unequal solar heating of the earth’s surface generates wind,and wind blowing over water generates waves.
• Wave Energy Conversion Devices: Three categories:– Terminator (OWC = oscillating water column, overtopping reservoir)– Attenuator (Pelamis)– Point Absorber (Heaving buoy, submerged float)
• Tidal Energy Resource: Astronomically-governed and thus highly predictable and relatively insensitive to weather conditions.
• Tidal In-Stream Energy Conversion Devices: Submerged turbine on monopile foundation has made most progress.
• Electric Power Research Institute Projects: Multi-year, collaborative efforts leading from feasibility definition study to design, construction, and operation of 500 kW demonstration projects:
– Offshore Wave Energy Conversion (HI, WA, OR, SF, MA, ME)– Tidal In-Stream Energy Conversion (AK,WA, SF, MA, ME, NB, NS)– Hybrid Offshore Wind and Wave Energy Conversion (proposed)
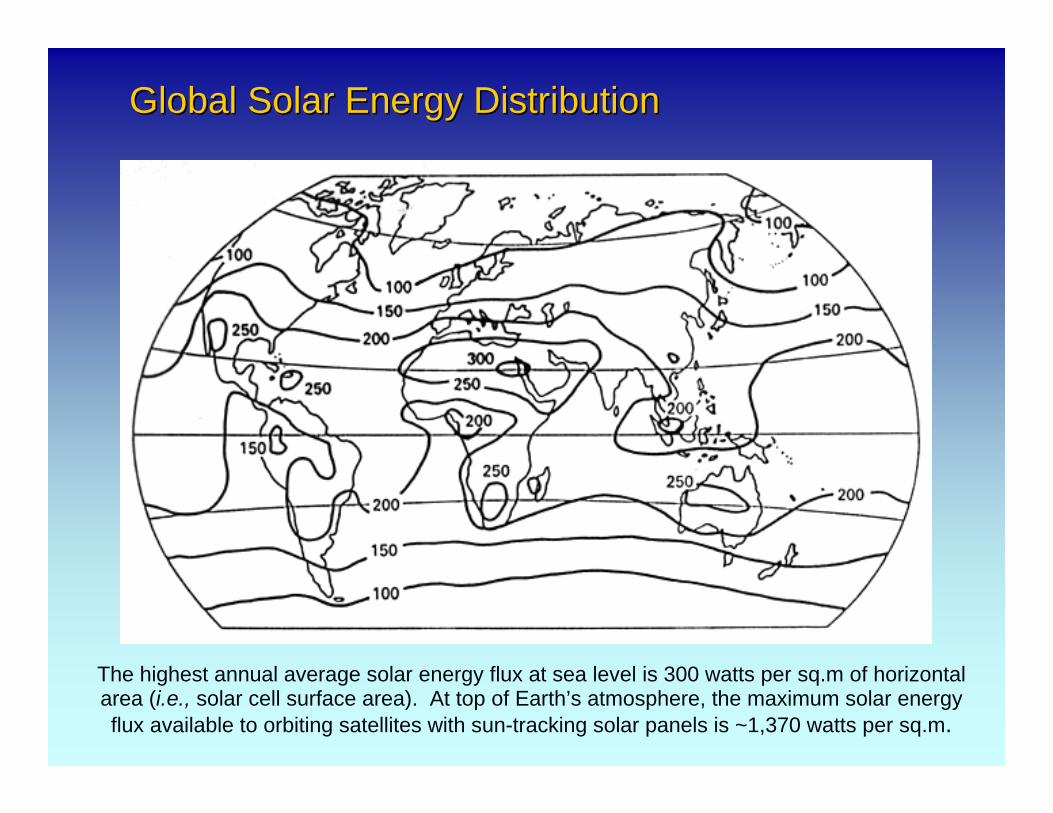
Global Solar Energy DistributionGlobal Solar Energy Distribution
The highest annual average solar energy flux at sea level is 300 watts per sq.m of horizontal area (i.e., solar cell surface area). At top of Earth’s atmosphere, the maximum solar energy flux available to orbiting satellites with sun-tracking solar panels is ~1,370 watts per sq.m.
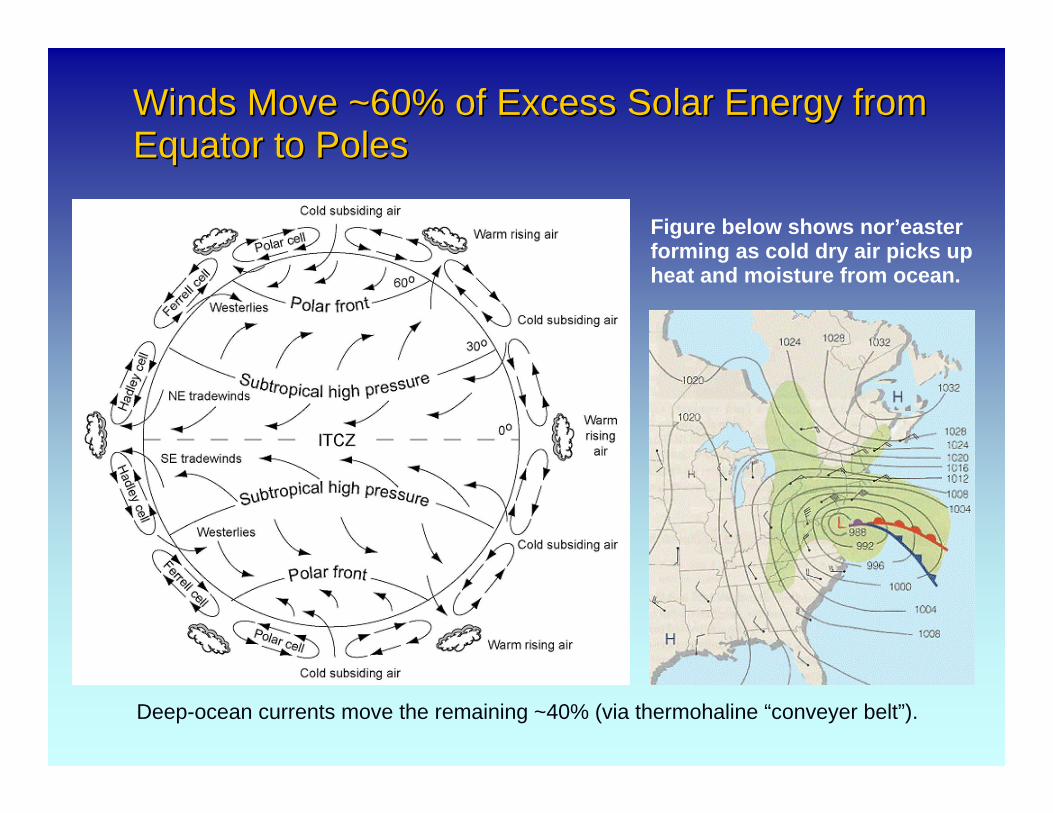
Winds Move ~60% of Excess Solar Energy from Winds Move ~60% of Excess Solar Energy from Equator to PolesEquator to Poles
Deep-ocean currents move the remaining ~40% (via thermohaline “conveyer belt”).
Figure below shows nor’easter forming as cold dry air picks up heat and moisture from ocean.

Global Wind Energy DistributionGlobal Wind Energy Distribution
The highest average wind energy flux at the top of the Planetary Boundary Layeris 5,000 watts (5 kilowatts) per sq.m of vertical area (i.e. turbine rotor swept area).

Wind Over Water Generates WavesWind Over Water Generates Waves
Ocean swell can travel thousands of kilometers in deep water with negligible loss of energy. Thus wave energy produced anywhere in an ocean basin ultimately arrives at its continental shelf margins, virtually undiminished until it reaches ~200 m depths.
Wave generating area may be bounded by coastlines or by extent of wind system

Calculation of Wave Energy Flux DensityCalculation of Wave Energy Flux Density

Wave Energy Flux in TypicalWave Energy Flux in TypicalU.S. MidU.S. Mid--Atlantic Sea StateAtlantic Sea State

Global Wave Energy Flux DistributionGlobal Wave Energy Flux Distribution
There are few exposed coastlines with annual average wave energy fluxes less than 5 kW/m.

OWC Terminator: Onshore LIMPETOWC Terminator: Onshore LIMPET
Wavegen LIMPET: Land-Installed Marine Powered Energy Transformer
500 kW demonstration project connected to utility
grid on Islay, Scotlandin November of 2000

OWC Terminator:OWC Terminator: EnergetechEnergetech’’s Nearshores Nearshore DeviceDevice
Mooring Lines
Port Kembla500 kW
Demonstration Project
Parabolic Wall
Capture Chamber
Power Module

Parabolic Wall Yields ~4x More EnergyParabolic Wall Yields ~4x More Energy

Overtopping Terminator: Wave DragonOvertopping Terminator: Wave Dragon
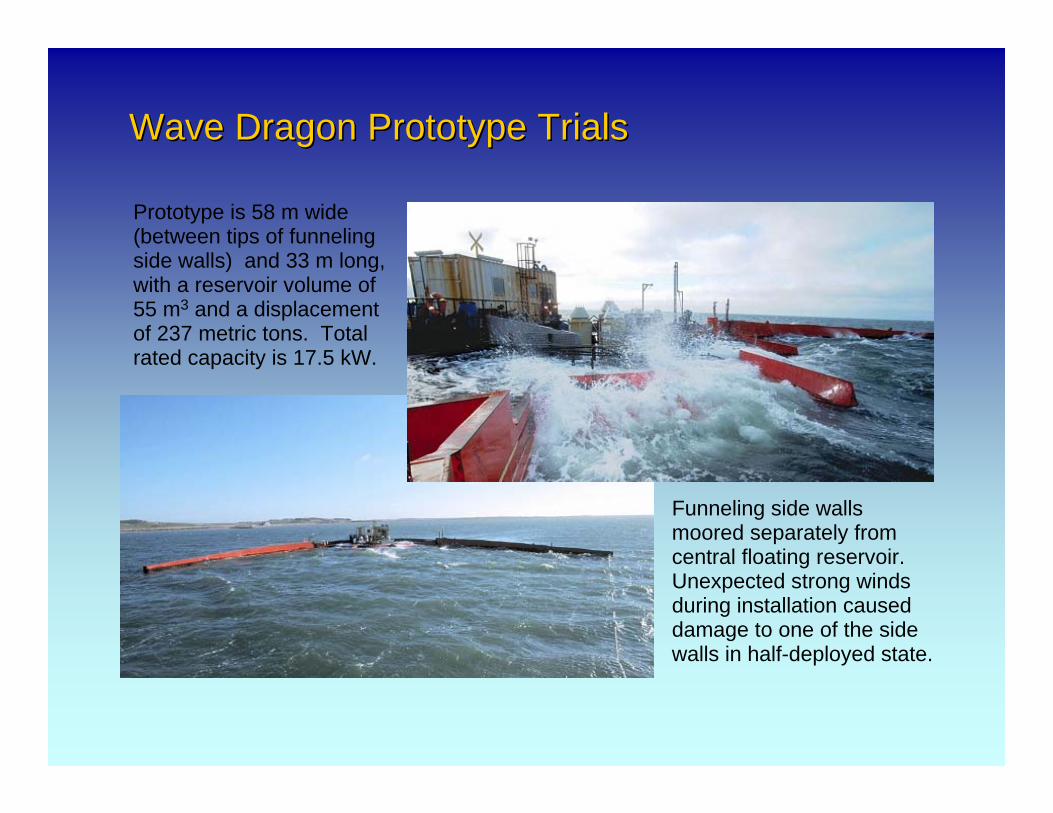
Wave Dragon Prototype TrialsWave Dragon Prototype Trials
Funneling side walls moored separately from central floating reservoir. Unexpected strong winds during installation caused damage to one of the side walls in half-deployed state.
Prototype is 58 m wide (between tips of funnelingside walls) and 33 m long, with a reservoir volume of 55 m3 and a displacement of 237 metric tons. Total rated capacity is 17.5 kW.

Floating Attenuator:Floating Attenuator: PelamisPelamis
Power module contains two hydraulic cylinders that are stroked by relative pitch and yaw between adjacent segments
relative PITCH
relative YAW
Bow mooring and power cable
TOP VIEW
SIDE VIEW

750 kW 750 kW PelamisPelamis Demonstration ProjectDemonstration Project
3.5 m dia x 150 m long
Pelamis 750 kW prototype installed in August of 2004 in 50 m water depth, 2 km offshore the European Marine Energy Centre, Orkney, UK

Point Absorber: Archimedes Wave SwingPoint Absorber: Archimedes Wave Swing
High Tide Level
Low Tide Level
Upper, air-filled floater heaves up and down in response to waves passing overhead.
Permanent magnets fixed to floater (suspended from overhead) move relative to stator coil on anchor base.
2 MW prototype deployedMay 2004 off northern Portugal

Lunar Tidal Period is 24 HoursLunar Tidal Period is 24 Hours+ 50 Minutes+ 50 Minutes
Although it appears that the tidal bulge moves around the earth, the earth actually rotates beneath the lunar tidal bulge.
While the earth completes one daily rotation, the moon progresses slightly in its27.3-day orbit around the earth. As a result, the earth must rotate an additional 50 minutes before any given location“catches up” with the lunar bulge.
MOON’S ORBIT
North PoleEarth rotates counter-clockwise

EarthEarth--MoonMoon--Sun Tidal ForcesSun Tidal Forces
The solar tidal bulge is only 46% as high as the lunar tidal bulge. While the lunar bulge migrates around the Earth once every 27 days; the solar bulge migrates around the Earth once every 365 days. As the lunar bulge moves into and out of phase with solar bulge, this gives rise to spring and neap tides.

Predicting Tides and Tidal CurrentsPredicting Tides and Tidal Currents
A minimum site-specific measured record length of 369 days is needed in order to capture all significant tide forcing components, the most important eight of which are shown above. In the absence of strong onshore or offshore winds, tide predictions based on harmonic analysis of measured sea level records are generally accurateto within 3 cm in terms of water level and 5 minutes in terms of tidal stage.

Estimating Tidal InEstimating Tidal In--Stream Energy ResourcesStream Energy Resources
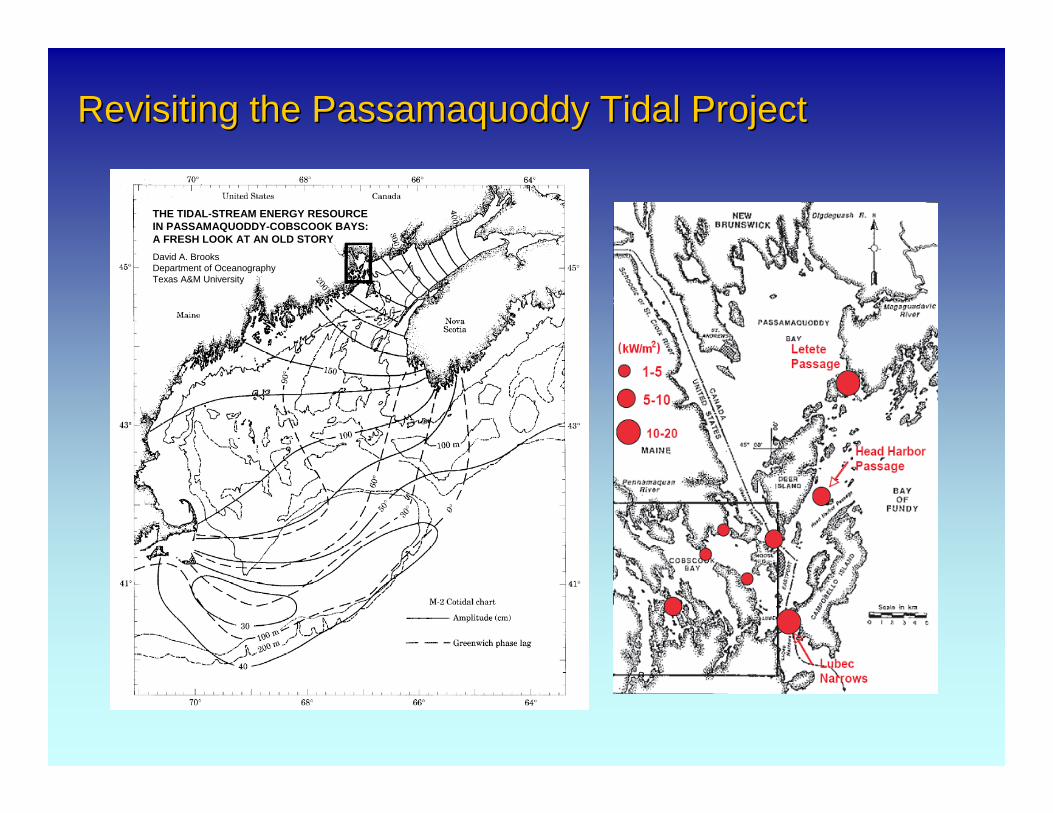
Revisiting the Passamaquoddy Tidal ProjectRevisiting the Passamaquoddy Tidal Project
THE TIDAL-STREAM ENERGY RESOURCEIN PASSAMAQUODDY-COBSCOOK BAYS:A FRESH LOOK AT AN OLD STORYDavid A. BrooksDepartment of OceanographyTexas A&M University

UKUK--Based Marine Current TurbinesBased Marine Current Turbines
Marine Current Turbines300 kW SeaFlow(fully operationalsince May 2003)
Marine Current Turbines1.2 MW SeaGen
(single unit to be installed 2006)

Tidal Stream Energy Devices in North AmericaTidal Stream Energy Devices in North America
Verdant Powerhorizontal-axis,
(six-turbine, 200 kW test project to be installed in
East River, NY)
GCK vertical-axis turbine (barge test on Merrimack River, MA)
UEK horizontal-axis, shrouded turbine
(tests by Ontario Hydro)

Renewable Energy ComparisonsRenewable Energy Comparisons
CenturiesDaysHoursMinutesPredictability
Diurnal and semi-diurnal (advancing
~50 min./day)
Sea (local winds) and swell (from distant storms)
Atmospheric fronts and
storms (local winds only)
Day-night; clouds, haze, and humidity
Intermittency
3-5 kW/m2
(Bay of Fundy)
1-2 kW/m2
(other US sites)
20-25 kW/m(US West Coast)
5-15 kW/m(US East Coast)
400-600 watts/m2
(US Great Plains)
200-300 watts/m2
(southern & western US)
Annual Average Power Density
Gravity of moon & sun
Wind blowing over water
Uneven solar heatingSunSource
Pre-CommercialPre-CommercialCommercialEarly Commercial
Development Status
Tidal Current WaveWindSolar PV

EPRI North American Ocean Energy ProjectsEPRI North American Ocean Energy Projects
Phase 1Project Definition
Study
Phase 1.5Pre-
Implementation Planning
Phase 2Design,
Permitting, & Financing
Phase 3Construction
Phase 4Operation & Evaluation
Offshore Wave Energy Conversion (OWEC)
2004 2005
Completed In-progress Future
2006 2007 2008
Tidal In-Stream Energy Conversion (TISEC)
2005 2006 2007 2009 2010
Phase 1Project Definition
Study
Phase 1.5Pre-
Implementation Planning
Phase 2Design,
Permitting, & Financing
Phase 3Construction
Phase 4Operation & Evaluation

Offshore Wave Energy ResourcesOffshore Wave Energy Resourcesin U.S. Exclusive Economic Zonein U.S. Exclusive Economic Zone
ME NH MA RI NY NJ120 TWh/yrWA OROR CA
440 TWh/yrSouthern AK1,280 TWh/yr
Northern HI390 TWh/yr
Total annual flux into all regions with avg. wave power density >10 kW/m is 2,230 TWh/year

Major North AmericanMajor North AmericanTidal InTidal In--Stream Energy ResourcesStream Energy Resources
Cape Cod Canal
Bay of Fundy
Puget Sound
Cook Inlet
San Francisco
Bay
Vancouver Island Strait of Georgia
Alexander Archipelago
Passamaquoddy Bay
Aleutian Islands Straits and
Passes

EPRI North American Tidal InEPRI North American Tidal In--Stream Energy Stream Energy Conversion Feasibility Demonstration ProjectConversion Feasibility Demonstration Project
$3-5 M
5 - 7 Yrs Total
50% DOE50% EPRI
$100-250K
Additional cost due to RD&D needs
1-2 YearsPhase IV -Evaluation
Private owneror collaborative
$100-250K
Plant O&M costs 1-2 YearsPhase IV -Operation
Private owneror collaborative
$1,500-
2,700K
1,500 MWh per year Plant (500 kW at 40% capacity factor)
12 - 18 Months
Phase III -Construction
Private owneror collaborative
$500-1,000
K
System Design, permitting and financing - 1 Site – Device
12-18 Months
Phase II –System Design
Maine Massachusetts New BrunswickNova ScotiaDOEEPRISan FranciscoAlaskaWashington
$350KSite survey & characterization;Technology / device survey;Feasibility-level system design, performance analysis, life-cycle cost estimate and economic assessment;Environmental, regulatory and permitting issues
1 YearApril
2005 to March 2006
Phase I –Project FeasibilityDefinition Study
Funding CostKey ActivitiesDurationPhaseObjective
To demonstrate the feasibilityof tidal in-stream power to provide efficient, reliable, environmentally friendlyand cost-effective electrical energy and to create a push towards the development ofa sustainable commercial market for this technology.

EPRI North American Hybrid Offshore WindEPRI North American Hybrid Offshore Windand Wave Energy Demonstration Proposaland Wave Energy Demonstration Proposal
Off Virginia, 3-mile limit of state jurisdiction roughly corresponds to 10 m water depth contour. In deeper waters “over the horizon,” mean annual wind power is 400-500 watts/m2 of rotor
swept area at 70 m hub height, and mean annual wave power is 4-5 kW/m of wave crest width.
Advantages:• Not visible from shore• Shared foundation and
submarine cable costs• Greater wind and wave
power densities• Greater continuity of output
-- yesterday’s winds are today’s waves
Wavegen3.5 MW hybrid
1.5 MW wind turbine
2 MW OWC