wave energy resource assessment in the … energy resource assessment in the mediterranean sea on...
TRANSCRIPT

lable at ScienceDirect
Energy 94 (2016) 50e63
Contents lists avai
Energy
journal homepage: www.elsevier .com/locate/energy
Wave energy resource assessment in the Mediterranean Sea on thebasis of a 35-year hindcast
G. Besio a, *, L. Mentaschi a, b, A. Mazzino a, b, c
a DICCA e Dipartimento di Ingegneria Civile, Chimica e Ambientale, Via Montallegro, 1, 16145, Genova, Universit�a degli Studi di Genova, Italyb INFN, Istituto Nazionale di Fisica Nucleare, Sezione di Genova, Via Dodecaneso 33, 16146, Genova, Italyc CINFAI, Consorzio Interuniversitario Nazionale per la Fisica delle Atmosfere e delle Idrosfere, Sezione di Genova, Via Montallegro 1, 16145, Genova, Italy
a r t i c l e i n f o
Article history:Received 29 June 2015Received in revised form22 September 2015Accepted 14 October 2015Available online xxx
Keywords:Wave energyResource assessmentMediterranean SeaWave hindcastWavewatchIII®
* Corresponding author.E-mail address: [email protected] (G. Besio)
http://dx.doi.org/10.1016/j.energy.2015.10.0440360-5442/© 2015 Elsevier Ltd. All rights reserved.
a b s t r a c t
A state-of-the-art, in terms of spatio-temporal resolution (about 10 km and on a hourly basis) andtemporal span (35 years), wave hindcast is exploited to update existing assessments of wave energypotential in the Mediterranean Sea. The hindcast, covering the period 1979e2013, has been obtainedusing WavewatchIII with calibrated source-term parameters recently proposed by L. Mentaschi et al.(2015) [1]. The main advantage of such a calibration is that it takes into account the peculiarity of theMediterranean basin with respect to other calibrations carried out in the oceans. The high resolutionallowed to perform a detailed analysis of wave energy potential characteristics providing information onseasonal and longer term variability necessary for reliable and optimal design of wave energy conversiondevices. As a result, the identification of areas where the mean wave power reaches values of the order of10 kW/m clearly emerge. However, these regions are not necessarily optimal in relation to the efficiencyof energy extraction, due to possible relevant time variation of the energy availability. The high temporalresolution allows to address issues related to the time variability of the available resource and thus toprovide a complete set of statistical information to carry out optimal design of WEC (wave energyconverter).
© 2015 Elsevier Ltd. All rights reserved.
1. Introduction
In the last decades the exploitation of renewable natural re-sources, such as wind, solar and geothermal, has significantlyincreased for the sake of energy production. Major attention hasbeen payed to the ocean resources, focusing on the energy har-vesting from tidal currents and ocean surface waves.
The conversion of wave energy to common grid has beenanalyzed in the scientific community following two basic ap-proaches. The first one is dedicated to the development, design andexperimentation of devices capable of converting wave energy intoelectrical power [e.g. [2]]. The second line of research is focused onwave energy assessment along the coast of the different continents,in order to provide detailed figures of the available energy potentialand its characteristics to the developers of WEC devices for anoptimal design.
.
Even if the idea of energy conversion fromwind waves arises atthe beginning of the nineteenth century, a boosting of the researchand technology development started in the early seventies due to adramatic increase of the price of oil products [2]. Wave energypotential has hence been assessed both from field measurementthrough buoy stations [3] and from numerical model.
A first attempt to assess the wave energy potential along Eu-ropean coasts has been carried out by Ref. [4] on the basis of coarsenumerical simulations employed to compile an European WaveEnergy Atlas. Hence the employment of wave hindcast has beenwidely used to assess oceans wave energy potential on global scales[i.e [5e8]].
The availability of extended wave data obtained through nu-merical simulations opened the possibility to develop a detailedwave energy assessment giving an insight about waver poweravailability on regional and local scales in order to provide refinedand accurate estimates of wave energy flux characteristics forWECs(wave energy converter) design. Different authors developedanalysis on the European Atlantic coasts, for example for France[9,10] or over different regions of continental Spain and its islands[11e16], and for Portuguese coasts and islands [17,18]. Assessments
G. Besio et al. / Energy 94 (2016) 50e63 51
have been developed for the Northern Atlantic Sea, where evensome full scale devices have been tested [19e22]. The analysis hasbeen performed also in different worldwide spread locations[3,23e31].
Generally a major attention has always been payed to higherenergy areas such as Pacific, Atlantic and Indian oceans. Despite thistendency, different authors in the last years begun to performwaveenergy assessment in less energetic basins which neverthelesscould provide interesting information for the harvesting of waveenergy. In particular, only recently [32e34], carried out evaluationsof Black Sea wave energy potential on the basis of different wavehindcast while [35] gave some insights about wave energy distri-bution in the Baltic Sea.
The Mediterranean Sea represents, in terms of wave energypower availability, an intermediate level between the open oceansand the enclosed small-fetch basins such as the Black Sea or theBaltic Sea. Hence, wave energy exploitation seems to be promisingeven if the net quantities are not as significant as in the open ocean.Different authors performed wave potential evaluations on thebasis of medium-short term wave datasets obtained through nu-merical simulations or field observations for restricted areas[36e40] and for the whole basin [41].
The present study follows the line opened by Ref. [41] con-cerning the use of hindcast for the assessment of wave powerdistribution in the Mediterranean Sea and it is an extension ingreater detail of the previous work. Indeed resolution of the at-mospheric forcing has been increased from 1/4� used by Ref. [41] to1/10� in the present work. Furthermore the range of the numericalsimulation has been extended from 10 to 35 years (from 01/01/1979to 31/12/2013) and the time step for the recording of wave char-acteristics is equal to 1 h instead of three. Spatial resolution of thewave model is the same of the atmospheric model and is about10 km in both longitude and latitude. The spatial resolution isimportant in order to resolve and properly describe the wavecharacteristics on a local scale, but it is not the most importantaspect for an assessment on the basin scale, on the contrary a hightemporal resolution is strictly necessary to provide detailed infor-mation on the variability of the wave energy resource in differentparts of the Mediterranean basin. The feasibility of wave energyharvesting projects resides in the correct design of the deviceswhich should be planned towork at the maximum efficiency tunedon the local wave climate. This condition is reached if the temporalvariability of the available wave energy potential and its distribu-tion over wave height, peak period and mean direction is known:the optimum design should indeed take into account variations ofthe resources and not be based on the sole mean value. Variabilityof the energy resource is indeed expected to be significant thusappreciably reducing the efficiency of a device designed to workunder average conditions [22,42e44].
The present manuscript is organized as follows: in section 2 thebasic methods of wave energy resource assessment are presentedtogether with the description of the numerical models employedfor the wave hindcast. Section 3 presents the results on both thebasin scale and on some locations which are promising for energyharvesting projects. Finally, some remarks and conclusions aredrawn in section 4.
2. Methods
The assessment of wave energy potential in the Mediterraneanbasin has been carried out on the basis of a hindcast of sea waveconditions for 35 years, from 01/01/1979 till 31/12/2013. Theanalysis thus presents a long temporal span, giving insights on longtrend variations and reliable seasonal behavior.
2.1. Atmospheric model
Thewavemodel is forced by the 10-mwind fields obtained fromthe non-hydrostatic model WRF-ARW (weather research andforecasting e advanced research WRF) version 3.3.1 [45]. In thepresent study a Lambert conformal grid covering the whole Med-iterranean Sea with a resolution of about 10 km has been used(Fig. 1).
Topography, land use and land-water mask dataset have beeninterpolated from the 20-resolution USGS (U.S. geological survey)data sets. Initial and boundary conditions for atmospheric sim-ulations were provided from the CFSR (climate forecast systemreanalysis) database [46]. Use of CFSR reanalysis data for wavemodeling provides reliable results, even if sometimes the simu-lation of extreme wave conditions is not properly performed[47e51]. For the whole extent of the hindcast, series of 24-hr-long simulations were performed. The analysis (i.e. atmosphericinitial conditions) have been updated every 24 h, while condi-tions on the boundaries of the computational grid were imposedevery 3 h. Even if the imposition of boundary and initial condi-tions can lead to some discontinuities in the numerical simula-tions, these unbalances are however absorbed quite quickly(because they affect the sole small scales) with characteristictimes of the order of the smallest resolved time-scale which is ofthe order of few time-steps (few minutes). For further details ofthe set-up and validation of the meteorological model readerscan refer to [52].
2.2. Wave model
The generation and propagation of sea waves have beenmodeled using the wave model WavewatchIII®, version 3.14 [53]. A336 � 180 regular grid (finite differences) covers the whole Medi-terranean Sea with a resolution of 0:1273 � 0:09 degrees, cor-responding to about 10 km at the latitude of 45+N (cfr. Fig. 2).
Source terms of growth-dissipation introduced by Ref. [54] havebeen expoited. These source term are based on [55] for the growthpart, and improve the representation of wave dissipation mergingthe results of recent studies [e.g. [56, 57]] and introducing a newterm for the dissipation of long swell, deduced on the basis of theobservations of satellite altimeters [58]. During the elaboration ofthe hindcast the reference parameterizationwas calibrated in orderto reduce a slight tendency to overestimation of moderate seas [1].Spectral resolution is characterized by 24 bins in direction and 25frequencies ranging from 0.06 to 0.7 Hz with a step factor of 1.1.Wave model has been forced with the wind fields provided by theatmospheric model described in section 2.1 with an hourly timestep. The time step chosen for spatial propagation in the wavemodel is of 100s for the fastest spectral component, which gua-rantees a Courant number close to zero for spatial propagation. Thespectral propagation time step was chosen in 900s, which issatisfactory for simulations where slopes are averaged over 10 kmwide cells. The main time step, i.e. the time step relative to theapplication of the source terms, has been set to half an hour, whichis in the order of magnitude of the crossing time of the cell by thefastest spectral components. This is a satisfactory time step,considering that the wind data have a time step of 1 h, and thatWWIII has a limiter which automatically reduces the main timestep for strong variations. The output has been recorded hourly inall points of the computation grid for integrated quantities (i.e.significant wave height Hs, mean period Tm andmean direction qm).The validation of the 35-years wave hindcast has been carried outthrough extensive comparison of simulated quantities and wavebuoy data [cfr. [1,59]].

Fig. 1. Integration domain for the meteorological model WRF.
G. Besio et al. / Energy 94 (2016) 50e6352
2.3. Wave energy resource
The availablewave power per unit length (energy flux per unit ofthe wave crest length, P), measured in kilowatt (kW) per meter, canbe evaluated using the spectral output of the wave model through
P ¼ rgZ2p
0
Z∞
0
Sðf ; qÞcgðf ;hÞdf dq ½kW=m� (1)
Fig. 2. Integration domain for the
where Sðf ; qÞ is the directional wave energy spectrum, f is the fre-quency, q is the direction of propagation of the spectral component,r is the water density, g the gravitational acceleration, cg is thegroup velocity and h is the water depth. Taking into account theintegrated parameters evaluated from the calculated spectrum (theintegral is performed numerically over the spectral bins for fre-quencies, 25, and directions, 24), an approximation of eq. (1) can beeasily derived in the form
wave model WavewatchIII®.

G. Besio et al. / Energy 94 (2016) 50e63 53
P ¼ 116
rgH2m0cg ½kW=m� (2)
where Hm0 is the spectral wave height evaluated from the waveenergy spectrum Hm0 ¼ 4
ffiffiffiffiffiffiffim0
p� �, the spectral period
Tm�1;0 ¼ m�1=m0 has been used to calculate the wave length whichis needed to evaluate the group velocity cg. In Hm0 and Tm�1;0 m�1and m0 represent respectively the spectral moments of order �1and 0 of the wave spectrum computed using the relationship
mi ¼Z2p
0
Z∞
0
Sðf ; qÞf idf dq: (3)
In the literature concerning wave energy resource assessmentand wave energy harvesting the spectral period Tm�1;0 is known asthe energy period Te [e.g. [4, 5]].
Because the analysis has been carried out mainly in deep waterconditions (h=L>0:5, where L is the wavelength) the followingapproximate relationship holds
P ¼ rg2
64pH2m0Te ½kW=m� : (4)
The total annual energy flux per unit width, measured in kWh=mor MWh=m, potentially produced during a defined temporal inter-val DT ¼ P
idti, can be expressed as
Etot ¼Xi
Pidti ½kWh=m�: (5)
where dti is the temporal sampling interval (1 h in the presentstudy). Relationships (4) and (5) are commonly used in literaturefor wave energy resource assessment even if the deep water con-dition is not strictly complied (for the four locations analyzed themaximum period could be taken equal to 14 s corresponding todeep water limit equal to almost 150 m).
Fig. 3. Mean energy flux per unit crest
3. Results
Wave energy resource assessment has been carried out in thewholeMediterranean basin and a detailed analysis has been carriedout for four selected sites, where the amount of available waveenergy is interesting for possible exploitation. We considered twosites along the Italian coast (Alghero and Mazara del Vallo) whoselocation coincide with those of the RON (Rete OndametricaNazionale) and represent the most promising location for energyconversion along the Italian coast, and two locations on the coast ofNorthern Africa where the average value of wave energy flux issignificant: one in front of the Algerian coast (Annaba) and a secondone in front of the Libyan coast (Bengazi, cfr. Fig. 3, Table 2).
3.1. Assessment on the basin scale
As already shown by Refs. [41], themeanwave energy flux in theMediterranean Sea takes values in between few kW=m in the lessenergetic areas (Alboran Sea, Adriatic Sea, Aegean Sea) and above10 kW=m in the Central Mediterranean, on the West of Sardinia.Some areas, such as the Eastern Mediterranean, can be classified as“intermediately energetic” presenting values of the available en-ergy flux between 6 and 9 kW=m (Fig. 3).
One of the main issues concerning the exploitation of waveenergy resource is the temporal variability of the resource. Thevalues of the mean energy flux (per unit crest) reported in Fig. 3represent a rough indicator of the amount of energy which couldbe exploited theoretically. Indeed the average does not provideinformation on the distribution of energy over the temporal spananalyzed. In order to gather more insights on the temporal vari-ability of the wave energy resource, in Fig. 4 the mean energy fluxper unit crest is reported for different seasons (Winter, Spring,Summer and Autumn).
The main contribution to the annual mean energy is developedmainly during the DecembereFebruary period, i.e. the Winterseason, when the average energy flux can reach up to 23 kW=m inthe Western Mediterranean, while during the other seasons theamount of available energy is significantly smaller. During Spring
[kW=m] for the 1979e2013 period.

Table 1Meanwave power characteristics (Mean yearly energy flux P, Mean yearly energy Ey,temporal variability COV, Seasonality variability index SV , Monthly variability indexMV , for the four analyzed locations.
Site P [kW/m] Ey [MW h/m] COV SV MV
AL 9.49 83.19 0.18 1.20 1.38MV 5.58 48.87 0.16 1.35 1.46AN 9.10 79.73 0.16 1.50 1.68BE 5.97 52.37 0.19 1.79 1.81
Table 2Selected site location for the energy assessment analysis. Lon. stands for Longitude,Lat. for Latitude and Dep. for Depth.
Location Lon. Lat. Dep. [M]
Alghero (AL) 7.950 40.450 ~350Mazara del Vallo (MV) 12.660 37.380 ~195Annaba (AN) 7.675 37.250 ~2435Bengazi (BE) 19.830 32.390 ~500
G. Besio et al. / Energy 94 (2016) 50e6354
(MarcheMay) and Autumn (SeptembereNovember) the pattern ofthe energy flux is similar to the winter one, with maxima locatedwest of Sardinia (about 15 kW=m) and less energetic zones in theeastern Mediterranean (about 7 kW=m). Wave energy availabilitythus has a clear seasonal dependence that can be reasonably tracedback to the well known seasonality of wind climatology in the Gulfof Lion [60].
Seasonal and temporal variability of the wave energy resource isan important matter which should be taken into account in theplanning of future exploitation of this resource: it would be muchmore convenient to develop a project in an area with lower yearlyaverage value of energy flux but with aweak variation overmonths,rather than in a location with a very high mean value but withstrong fluctuation around it. This in order to maximize the effi-ciency and the performances of the harvesting devices. Differentvariability indicators have been introduced by Ref. [5] to capture
Fig. 4. Seasonal mean energy flux per unit crest [kW=m] for the 1979e2013 period. Winter:
the amount of variations of the resource on different time refer-ences. A straightforward measure is represented by the coefficientof variation COV which is calculated dividing the standard devia-tion of the energy flux series by its average value
COV ¼ sP
mP(6)
where sP denotes the standard deviation, and mP is the mean valueof the time series. Absence of variability is found if COV ¼ 0 whilevariability grows if COV increases: for COV ¼ 1, indeed, the stan-dard deviation equals the average. Fig. 5 shows the COV evaluatedfor the whole time series on a yearly basis (i.e. sP has been evalu-ated employing the single year average value and the mean overthe whole period, i.e. Fig. 3 values), identifying the southern coastsof Italy, the eastern coast of Libya and the northern area of theEastern Mediterranean as the areas most affected by inter-annualvariability. The latter area (i.e. the Aegean Sea and the southernTurkish coast) presents a significant value of the inter-annualvariability coefficient COV mainly due to the very low meanvalues rather than because of actual strong fluctuations of P.
In order to have more detailed figures about variability of theresources [5] introduced the monthly and the seasonal variabilityindexes (MV and SV , respectively) defined as the differences of themost energetic month/season and the less energetic month/seasondivided by the yearly average value (evaluated over the wholedataset, i.e. Fig. 3 values):
MV ¼ PMmax� PMmin
Pyear(7)
SV ¼ PSmax� PSmin
Pyear: (8)
Figs. 6 and 7 report the values of MV and SV , evaluated over thewhole hindcast. From the results it is possible to observe that, asalready stated above, the rate of variation on amonthly basis results
DeceJaneFeb; Spring: MareApreMay; Summer: Jun-Jul-Aug; Autumn: SepeOcteNov.

Fig. 5. Coefficient of variation COV on yearly basis for the 1979e2013 period.
G. Besio et al. / Energy 94 (2016) 50e63 55
to be more significant than the seasonal one, i.e. the variations fromonemonth to another one are stronger than those occurring amongseasons. In particular the Central Mediterranean results to be quitevariable on a monthly basis while on a seasonal basis the mostvariable areas are located North of the Libyan coast and in theNortheEast Mediterranean basin. Results suggest thus that theamount of energy that could be exploited tends to float on an intra-annual basis. Hence, the optimal design of WEC devices still re-mains a challenging task. On the other hand, the results on seasonalbasis should be used carefully for project planning because they donot show a significant variability and hence tend to give a picture ofa more stable and constant resource.
3.2. Assessment on location scale
Once the characterization of the wave power resources has beenaddressed on the basin scale identifying which areas are the mostpromising for a possible resource exploitation, attention has beenfocused on a detailed analysis of wave power availability on foursites located in the most energetic areas identified thanks to theresults presented in section 3.1. For all the four chosen locations the
Fig. 6. Monthly variability MV
mainwave energy flux characteristics are presented in similar plotscorresponding to:
a) the wave power rose;b) distribution of wave power as a function of significant wave
height Hs and energy period Te;c) persistence of the wave power in hours;d) CDF (cumulative distribution function) of the wave energy
flux;e) yearly meanwave power and its trend evaluated through a 5
years moving mean for the whole time window;f) seasonal mean wave power;g) seasonal mean level during the whole period;h) wave power characteristics on a monthly basis;i) overall monthly trends along the whole period.
These information should represent in detail the wave energyresources characteristics and its fluctuations on an intra- and inter-annual basis and should provide a significant insight for a reliableresource assessment to be used for the planning and the design ofwave energy harvesting projects. A brief summary of the value of
for the 1979e2013 period.

Fig. 7. Seasonal variability SV for the 1979e2013 period.
G. Besio et al. / Energy 94 (2016) 50e6356
the mean wave power P, the mean yearly energy Ey and the coef-ficient of temporal variation (COV , MV and SV) is reported inTable 1. Results are then illustrated in Figs. 8e11 for Alghero,Mazara del Vallo, Annaba and Bengazi respectively.
The first two sites correspond to two measurement buoysbelonging to the Italian buoys network (RON e Rete OndametricaNazionale) on the Western coast of Sardinia (Alghero) and on theWestern coast of Sicily (Mazara del Vallo). The other two sites arelocated on the North-African coast, one in the Western Mediter-ranean (Annaba) and the other in the Eastern Mediterranean(Bengazi). Alghero and Annaba lay on themost energetic area of theMediterranean basin, i.e. the Western one, while Mazara is slightlyperipheral with respect to this zone and Bengazi falls in the CentralMediterranean basin. While Alghero and Annaba should result inhigher values of available energy, Mazara and Bengazi shouldrepresent a good example of intermediate wave energy potentialthat could still be exploitable.
As stated before, Alghero and Mazara del Vallo represent thetwo most promising sites for energy potential in Italian waters.Basically the western part of Sardinia is the most promising area forenergy exploitation and values obtained for Alghero site confirmthese ideas. In particular, even if the average annual value is notcomparable with oceanic ones, it is one of the highest in theMediterranean Sea, being greater than 9 kW=m. Furthermore theenergy is concentrated on the NortheWest sector, coming mainlyfrom 300� N: the information about the spread of wave energy indirection rose is critical for the choice and installation of the har-vesting devices. The distribution of the energy as a function of thesignificant wave height and the mean period (panel b, Fig. 8) it isnecessary in order to estimate the energy converter efficiency onthe basis of the power matrices provided by the WEC manufac-turers. Maximum efficiency can be reached in the MediterraneanSea through a downscaling of the devices which have been devel-oped for the Atlantic Ocean wave climate [43]. On the other hand,the information onwave energy persistence (panel c and d, Fig. 8) isneeded in order to evaluate the most common conditions andhence to plan the optimal functioning interval for which the de-vices should be designed for. These information allow one toidentify the percentage of sea states (i.e. wave power) that happen
to be below a critical level, giving insights of the reliability ofoperating limits [19,20].
The availability of 35 years wave data allows us to perform someanalysis on the inter- and intra-annual variation of the energyresource. In particular panel e) of Fig. 8 gives an insight of thefluctuations of the mean energy flux through the years, revealingthat from the 80's up to 2010 the mean wave power first slightlydecreased until the mid 90's, while it begun to increase again since2006 (see red line in panel e) (in web version), Fig. 8). Even if 35years do not represent a valid basis for a climatological study, itallows to identify a weak trend of increase of the mean yearly en-ergy potential [22]. The marked seasonal character depicted inpanel f) presents trends similar to those observed for the meanannual values on an inter-annual basis. The stronger fluctuationoccur generally during the winter season, while summer presents amuch more constant level of mean energy. (cfr. Fig. 8, panel g).Intra-annual variations are better appreciated if we analyze themean monthly estimates. Panel h) shows the variability on amonthly basis over the whole time window (average value, 25%e75% percentiles and ± 2.7s outliers; red points represent valuesfalling outside the outliers boundaries), revealing how there arestrong deviation from a month to another, especially if we considerwinter and summer seasons (as already depicted in panels f and g).Moreover panel h) shows the distribution of the wave powervalues, giving a clue of the excursion rate between the extremesand the mean value, suggesting that in some periods it could bepossible to find different extreme events which can represent ahazard for the structural integrity of the devices. Indeed safestructural design of WECs and their mooring system has to beperformed on the basis of an extreme values analysis, bearing inmind that during extreme events the devices should not be oper-ational [5,19,20,39]. Finally, in panel i) the overall variability of themean wave energy flux over the months and over the years isdepicted, showing a stronger variability over the years for theautumn and winter months (SeptembereFebruary); furthermore amarked intra-annual variability with respect to the months isrevealed.
The same observations and behavior presented for the Algherolocation can be recast for the other three sites, where a strongly

Fig. 8. Wave energy assessment for Alghero (AL) location.
G. Besio et al. / Energy 94 (2016) 50e63 57
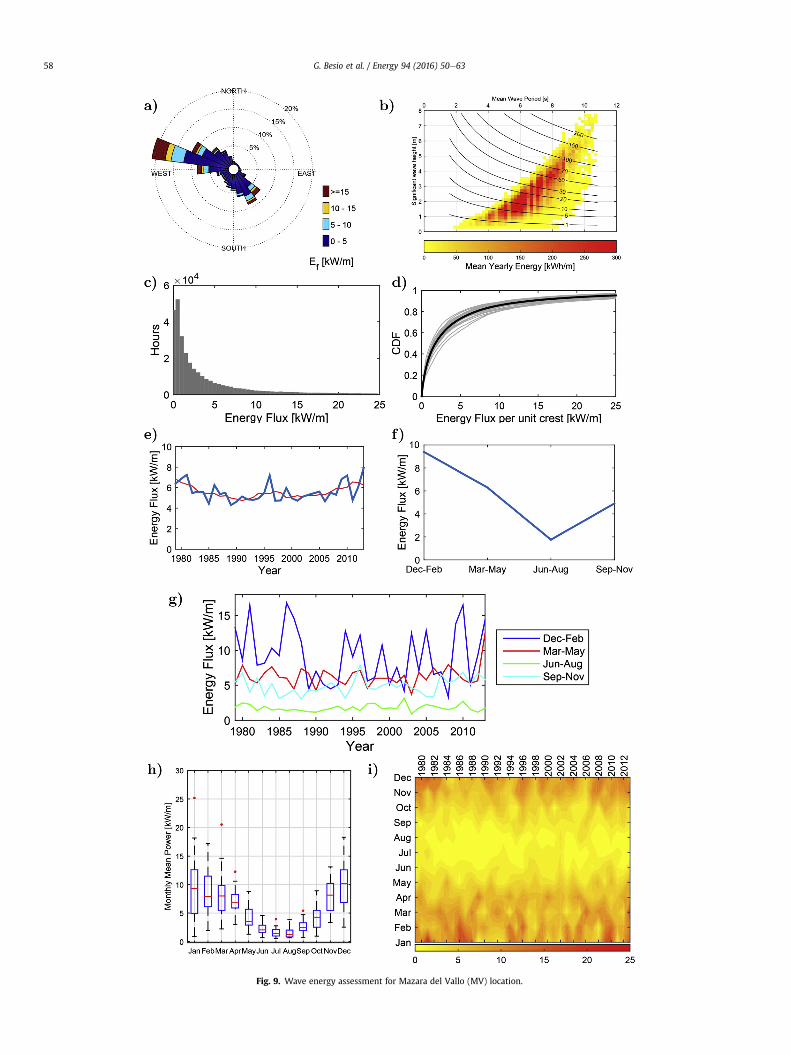
Fig. 9. Wave energy assessment for Mazara del Vallo (MV) location.
G. Besio et al. / Energy 94 (2016) 50e6358

Fig. 10. Wave energy assessment for Annaba (AN) location.
G. Besio et al. / Energy 94 (2016) 50e63 59

Fig. 11. Wave energy assessment for Bengazi (BE) location.
G. Besio et al. / Energy 94 (2016) 50e6360

G. Besio et al. / Energy 94 (2016) 50e63 61
marked seasonal and monthly behavior is found. The only dif-ferences are in the values of the energy which are similar to theAnnaba site, while are significantly smaller in Mazara del Valloand Bengazi sites, in agreement with the results presented byRef. [41]. Concerning the directional distribution of the wavepower, it is interesting to note that while for Alghero the waveenergy is concentrated just in a narrow direction sector, for theother three locations the energy is spread on a wider range. Inparticular, Mazara del Vallo, due to its position halfway betweenthe Western and the Eastern Mediterranean basin, presents twoopposite primary direction (W-NW and SE), while for bothAnnaba and Bengazi the energy power is spread on a 150� angleoriented mainly in the northern direction. Long term trends andseasonality present the same behavior depicted for Algherolocation, i.e. strong intra-annual variability and moderate inter-annual variability.
3.3. The role of high/low resolution grid
The estimates provided in the present manuscript have beenimplemented employing a high resolution either in space (0.1� inlongitude and latitude) and in time (wind forcing and output every1 hr). In order to appreciate the effect of the resolution on the
a)
b)
c)
Fig. 12. Comparison among different resolution numerical sim
results for the wave numerical model we simulated a storm eventfor Alghero buoywith a different time step for the wind forcing anda looser grid resolution in space. For the sake of brevity andclearness we will here present only one test case representative ofthe results obtained for all the locations analyzed. In particular weanalyzed the storm occurred between 17th and 22nd of February2010 employing a wind forcing with a spatial resolution of 0.5� anda temporal resolution of 6 h. Results of the comparison among thetwo different numerical simulations and the observed buoy dataare reported in Fig. 12 for significant wave height Hs, mean periodTm and wave energy flux P.
As it could be observed from the results a looser resolution inspace and in time of the wind forcing and a low resolution for thewave numerical model can lead to a significant underestimation ofthe values of the significant wave height and of the mean period,leading to an important error in the wave energy flux evaluation.Furthermore an output of wave characteristics every 3 or evenevery 6 h results in a rather coarse description of wave energy fluxfluctuation on a small time scale, which is crucial for the evaluationof the persistency of the resource and for the estimate of extremeevents for the design of the wave energy converters. More detailsabout the effect of models resolution on the reliability of the resultscan be found in Ref. [1].
ulations and observed buoy data. Alghero, February 2010.

Table 3Energy flux per unit width [kWh=m] integrated over the storm occurred in February2010 for buoy observations and different numerical simulations.
Location Buoy Coarse resolution Fine resolution
Energy [kWh=m] ~12 490 ~5280 ~10 490
G. Besio et al. / Energy 94 (2016) 50e6362
In Table 3 the value of the available wave energy integrated overthe storm is presented for the buoy data and the numerical simu-lation. Coarse grid can lead up to 50% underestimation of the waveenergy resource.
4. Conclusions
Wave energy resource distribution in the Mediterranean basinhas been assessed on the basis of numerical simulations for a periodof 35 years (1979e2013) with an hourly resolution in time and aresolution in space of about 10 km in longitude and latitude. Thehindcast developed by Ref. [1] has been used to develop a detailedassessment of the wave energy resource on the basin scale (thewhole Mediterranean Sea) and on a local scale. Significant infor-mation on the variability and persistence of wave energy flux havebeen analyzed thanks to the high temporal resolution. The principaloutcomes of the present work can be summarized as follows:
� Themost energetic area in theMediterranean Sea is theWesternbasin in between the Balearic Islands, Sardinia and Corsica andthe Northern coast of Algeria with a yearly available mean wavepower of about 10kW=m along the coast;
� central and Eastern Mediterranean present moderate wave en-ergy potential with mean figures around 6� 7kW=m;
� as already observed in previous studies, the mean value of wavepower over the entire dataset (35 years) is a rough indicator ofwave energy potential not taking into account inter- and intra-annual variability and directional distribution of the wave en-ergy resource [42,44];
� in all Mediterranean basin there is a strong variability onmonthly base, which results in relevant fluctuations on a sea-sonal base;
� long-term trends of wave power availability suggest that after aperiod of general decrease of the mean yearly wave power be-tween the 80's and the 90's, we are experiencing a slightly in-crease in the last eight years of the temporal series(2005e2013). It would be interesting to extend the temporalseries up to nowadays in order to verify if this tendency isconfirmed or if it represents a minor fluctuation;
� long term analysis for seasonal energy content shows the sametype of trends observed for the annual values. Generally thestronger contributions, and indeed the main component of thetrends, are given by the winter values, while the summer onesare much less significant. Different levels of available energy forthe four seasons are reported, with differences up to almost15kW=m between the most energetic season and the less en-ergetic one;
� wave power distribution over the hours and the relative Cu-mulative Density Function should be employed in order toidentify good levels of available resource depending on theirpersistence during the year;
� the choice of grid resolution for both the atmospheric modeland the wave model is crucial to obtain reliable estimate of thewave energy resource.
Results presented in this study suggest that the temporal reso-lution of the wave dataset employed for the assessment of the
available energy is crucial in order to have a detailed character-ization of the resource trends and variations over different timeintervals. It is quite clear indeed that the primary discriminatingfactor for the development of a wave energy project is basically theintrinsic variability of the available resource: it could bemuchmoreproblematic to develop a project in a highly energy environmentcharacterized by a strong temporal variability rather than in anenvironment characterized by a medium energy content butshowing a moderate inter- and intra-annual variability. Further-more the results of the present analysis could be used as boundaryconditions to perform detailed analysis for specific location alongany stretch of the Mediterranean coast in order to analyze thevariation and behavior of the wave energy flux due to the inter-action of the sea waves with the bottom bathymetry and thecoastline morphology.
Acknowledgments
Authors would like to gratefully thank Federico Cassola for hissupport on the WRF model. This research has been founded byUniversit�a degli Studi di Genova through the Progetto di Ricerca diAteno 2013 and 2014. We also thank the financial support for thecomputational infrastructure from the Italian flagship project RIT-MARE. A.M. thanks the financial support from the PRIN 2012project n. D38C1300061000 funded by the Italian Ministry ofEducation.
References
[1] Mentaschi L, Besio G, Cassola F, Mazzino A. Performance evaluation ofWavewatchIII in the Mediterranean Sea. Ocean Model 2015;90:82e94.
[2] Cl�ement A, McCullen P, Falc~ao A, Fiorentino A, Gardner F, Hammarlund K, et al.Wave energy in Europe: current status and perspectives. Renew Sustain En-ergy Rev 2002;6(5):405e31.
[3] Defne Z, Haas KA, Fritz HM. Wave power potential along the Atlantic coast ofthe southeastern {USA}. Renew Energy 2009;34(10):2197e205.
[4] Pontes M. Assessing the European wave energy resource. J Offshore Mech ArctEng 1998;120(4):226e31.
[5] Cornett AM, et al. A global wave energy resource assessment. Proc ISOPE 2008.Doc ID ISOPE-I-08-370, 9 pages.
[6] Mork G, Barstow S, Kabuth A, Pontes MT. Assessing the global wave energypotential. In: ASME 2010 29th international conference on ocean, offshore andArctic engineering, American society of mechanical engineers; 2010.p. 447e54.
[7] Arinaga RA, Cheung KF. Atlas of global wave energy from 10 years of rean-alysis and hindcast data. Renew Energy 2012;39(1):49e64.
[8] Gunn K, Stock-Williams C. Quantifying the global wave power resource.Renew Energy 2012;44(0):296e304.
[9] Boudi�ere E, Maisondieu C, Ardhuin F, Accensi M, Pineau-Guillou L,Lepesqueur J. A suitable metocean hindcast database for the design of marineenergy converters. 2013.
[10] Guillou N, Chapalain G. Numerical modelling of nearshore wave energyresource in the sea of iroise. Renew Energy 2015;83:942e53.
[11] Iglesias G, Carballo R. Wave energy potential along the death coast (Spain).Energy 2009;34(11):1963e75.
[12] Iglesias G, Carballo R. Offshore and inshore wave energy assessment: Asturias(N spain). Energy 2010;35(5):1964e72.
[13] Iglesias G, Carballo R. Wave energy resource in the Estaca de Bares area(spain). Renew Energy 2010;35(7):1574e84. special section: {IST} nationalconference 2009.
[14] Iglesias G, Carballo R. Wave power for la isla bonita. Energy 2010;35(12):5013e21. the 3rd international conference on sustainable energy and envi-ronmental protection, {SEEP} 2009.
[15] Iglesias G, Carballo R. Wave resource in el hierroan island towards energy self-sufficiency. Renew Energy 2011;36(2):689e98.
[16] Veigas M, Iglesias G. Wave and offshore wind potential for the island oftenerife. Energy Convers Manag 2013;76(0):738e45.
[17] Rusu E, Soares CG. Wave energy pattern around the madeira islands. Energy2012;45(1):771e85. the 24th international conference on efficiency, cost,optimization, simulation and environmental impact of energy, {ECOS} 2011.
[18] Rusu L, Soares CG. Wave energy assessments in the azores islands. RenewEnergy 2012;45(0):183e96.
[19] Smith H, Haverson D, Smith GH. A wave energy resource assessment casestudy: review, analysis and lessons learnt,. Renew Energy 2013;60:510e21.

G. Besio et al. / Energy 94 (2016) 50e63 63
[20] van Nieuwkoop JC, Smith H, Smith GH, Johanning L. Wave resource assess-ment along the cornish coast (uk) from a 23-year hindcast dataset validatedagainst buoy measurements. Renew Energy 2013;58:1e14.
[21] Mackay EB, Bahaj AS, Challenor PG. Uncertainty in wave energy resourceassessment. Part 1 Hist Data Renew Energy 2010;35(8):1792e808.
[22] Mackay EB, Bahaj AS, Challenor PG. Uncertainty in wave energy resourceassessment. Part 2: variability and predictability. Renew Energy 2010;35(8):1809e19.
[23] Hughes MG, Heap AD. National-scale wave energy resource assessment forAustralia. Renew Energy 2010;35(8):1783e91.
[24] Kim G, Jeong WM, Lee KS, Jun K, Lee ME. Offshore and nearshore wave energyassessment around the korean peninsula. Energy 2011;36(3):1460e9.
[25] Lenee-Bluhm P, Paasch R, zkan Haller HT. Characterizing the wave energyresource of the {US} pacific northwest. Renew Energy 2011;36(8):2106e19.
[26] Stopa JE, Cheung KF, Chen Y-L. Assessment of wave energy resources inHawaii. Renew Energy 2011;36(2):554e67.
[27] Kim C-K, Toft JE, Papenfus M, Verutes G, Guerry AD, Ruckelshaus MH, et al.Catching the right wave: evaluating wave energy resources and potentialcompatibility with existing marine and coastal uses. PloS One 2012;7(11):e47598.
[28] Saket A, Etemad-Shahidi A. Wave energy potential along the northern coastsof the gulf of Oman, Iran. Renew Energy 2012;40(1):90e7.
[29] Chiu F-C, Huang W-Y, Tiao W-C. The spatial and temporal characteristics ofthe wave energy resources around taiwan,. Renew Energy 2013;52:218e21.
[30] Mirzaei A, Tangang F, Juneng L. Wave energy potential along the east coast ofpeninsular Malaysia. Energy 2014;68(0):722e34.
[31] L�opez M, Veigas M, Iglesias G. On the wave energy resource of Peru. EnergyConvers Manag 2015;90:34e40.
[32] Rusu E. Wave energy assessments in the black sea. J Mar Sci Technol2009;14(3):359e72.
[33] Akpınar A, K€omürcü M_I. Assessment of wave energy resource of the black seabased on 15-year numerical hindcast data. Appl Energy 2013;101:502e12.
[34] Aydoan B, Ayat B, Yksel Y. Black sea wave energy atlas from 13years hind-casted wave data. Renew Energy 2013;57(0):436e47.
[35] Soomere T, Eelsalu M. On the wave energy potential along the eastern Balticsea coast. Renew Energy 2014;71:221e33.
[36] Aoun N, Harajli H, Queffeulou P. Preliminary appraisal of wave power pros-pects in Lebanon. Renew Energy 2013;53:165e73.
[37] Ayat B. Wave power atlas of eastern Mediterranean and Aegean seas. Energy2013;54(0):251e62.
[38] Vicinanza D, Contestabile P, Ferrante V. Wave energy potential in the north-west of Sardinia (Italy). Renew Energy 2013;50(0):506e21.
[39] Zodiatis G, Galanis G, Nikolaidis A, Kalogeri C, Hayes D, Georgiou GC, et al.Wave energy potential in the Eastern Mediterranean Levantine Basin. an in-tegrated 10-year study. Renew Energy 2014;69(0):311e23.
[40] Monteforte M, Re CL, Ferreri G. Wave energy assessment in Sicily (Italy).Renew Energy 2015;78:276e87.
[41] Liberti L, Carillo A, Sannino G. Wave energy resource assessment in themediterranean, the Italian perspective. Renew Energy 2013;50(0):938e49.
[42] Portilla J, Sosa J, Cavaleri L. Wave energy resources: wave climate andexploitation. Renew Energy 2013;57:594e605.
[43] Bozzi S, Archetti R, Passoni G. Wave electricity production in Italian offshore: apreliminary investigation,. Renew Energy 2014;62:407e16.
[44] Carballo R, S�anchez M, Ramos V, Fraguela J, Iglesias G. Intra-annual waveresource characterization for energy exploitation: a new decision-aid tool,.Energy Convers Manag 2015;93:1e8.
[45] Skamarock W, Klemp J, Dudhia J, Gill D, Barker D, Wang W, et al. A descriptionof the advanced research wrf version 3. Technical note tn-468þstr. 113 pp,NCAR. 2008.
[46] Saha S, Moorthi S, Pan H-L, Wu X, Wang J, Nadiga S, et al. The NCEP climateforecast system reanalysis. Bull Am Meteorol Soc 2010;91(8):1015e57.
[47] Cavaleri L. Wave modeling e missing the peaks. J Phys Oceanogr 2009;39(11):2757e78.
[48] Cox AT, Cardone VJ, Swail VR. On the use of climate forecast system reanalysiswind forcing in ocean response modeling. In: Proceedings, 12th int. Workshopwave, hindcasting, forecasting, Hawaii, USA; 2011.
[49] Splinder D, Chawla A, Tolman HL. An initial look at the CFSR reanalysis windsfor wave modeling. Technical Note, MMAB Contribution No. 290, NCEP. 2011.
[50] Carvalho D, Rocha A, Gmez-Gesteira M. Ocean surface wind simulation forcedby different reanalyses: comparison with observed data along the IberianPeninsula coast. Ocean Model 2012;56(56):31e42.
[51] Chawla A, Spindler DM, Tolman HL. Validation of a thirty year wave hindcastusing the climate forecast system reanalysis winds. Ocean Model 2013;70:189e206.
[52] Cassola F, Ferrari F, Mazzino A. Numerical simulations of Mediterranean heavyprecipitation events with the WRF model: analysis of the sensitivity to res-olution and microphysics parameterization schemes. Atmos Res2015;164e165:210e25.
[53] Tolman HL. User manual and system documentation of WAVEWATCH IIIversion 3.14. Tech. rep., NOAA/NWS/NCEP/MMAB. 2009.
[54] Ardhuin F, Rogers E, Babanin AV, Filipot J, Magne R, Roland A, et al. Semi-empirical dissipation source functions for ocean waves. Part I: definition,calibration, and validation. J Phys Oceanogr 2010;40(9):1917e41.
[55] Bidlot J, Janssen P, Abdalla S. A revised formulation of ocean wave dissipationand its model impact. Tech. Rep. Memorandum 509, ECMWF, Reading, U.K.2007.
[56] Young IR, Babanin AV. Spectral distribution of energy dissipation of wind-generated waves due to dominant wave breaking. J Phys Oceanogr2006;36(3):376e94.
[57] Babanin AV, Chalikov D, Young I, Savelyev I. Numerical and laboratoryinvestigation of breaking of steep two-dimensional waves in deep water.J Fluid Mech 2010;644:433e63.
[58] Ardhuin F, Chapron B, Collard F. Observation of swell dissipation acrossoceans. Geophys Res Lett 2009;36:L06607.
[59] Mentaschi L, Besio G, Cassola F, Mazzino A. Problems in RMSE-based wavemodel validations. Ocean Model 2013;72:53e8.
[60] Lavagnini A, Sempreviva AM, Transerici C, Accadia C, Casaioli M, Mariani S,et al. Offshore wind climatology over the mediterranean basin. Wind Energy-Bognor Regis 2006;9(3):251e66.