wave overtopping at berm breakwaters in line with …€¦ · wave overtopping at berm breakwaters...
TRANSCRIPT

1
WAVE OVERTOPPING AT BERM BREAKWATERS IN LINE WITH EUROTOP
Sigurdur Sigurdarson1 and Jentsje W. van der Meer2
The paper presents the development of a new overtopping formula for berm breakwaters. Overtopping data from hydraulic model tests of berm breakwaters have been gathered and reanalysed in line with the procedure in the EurOtop Manual. The data shows a clear dependency on wave period or wave steepness, which is in contrast to the main conclusion of the CLASH project and the EurOtop Manual for conventional rubble mound breakwaters. The formula is roughly validated on prototype performance.
Keywords: berm breakwater; Icelandic-type; mass armoured; wave overtopping; overtopping simulator
INTRODUCTION The present paper is a part of cooperation between the present authors on berm breakwaters. The
first paper presented in this cooperative work was on the front slope stability of the Icelandic-type berm breakwater (Sigurdarson and van der Meer (2011)). This second paper covers the topic of wave overtopping. Together front slope stability and wave overtopping are the main aspects in the design of berm breakwaters.
A new classification of berm breakwaters is introduced that distinguishes between mass armoured berm breakwaters and the Icelandic-type berm breakwater.
CLASSIFICATION OF BERM BREAKWATERS In the cooperative work on berm breakwaters it has been necessary to modify and update the
PIANC (2003) classification and introduce a new classification of berm breakwaters. Firstly the classification distinguishes between different types of berm breakwaters, mass
armoured berm breakwaters, MA, with a homogeneous berm of mainly one stone class, and Icelandic-type berm breakwaters, IC, constructed with more rock classes, Fig. 1.
Figure 1. Mass armoured berm breakwater to the left, MA, and Icelandic-type berm breakwater to the right; IC. On both cross sections the expected reshaping is shown with a dotted line.
The behaviour of both types will be very different if relatively small rock is used for the mass armoured berm breakwater and very large rock for the Icelandic-type berm breakwater. The first one may fully reshape, where the second one may show static stability without significant reshaping. But it is also possible that similar rock classes are used and where both types may show partly reshaping. The type of breakwater does not always give similar behaviour and therefore this behaviour, the recession of the berm, is a part of the classification.
Secondly the classification takes into account the structural behaviour of berm breakwaters. Three degrees of reshaping are defined: Hardly reshaping HR Partly reshaping PR Fully reshaping FR
Both the two types of berm breakwaters and the different structural behaviour lead to a classification with four typical types of berm breakwaters: Hardly reshaping Icelandic-type berm breakwater HR-IC Partly reshaping Icelandic-type berm breakwater PR-IC Partly reshaping mass armoured berm breakwater PR-MA Fully reshaping berm breakwater (mass armoured) FR-MA
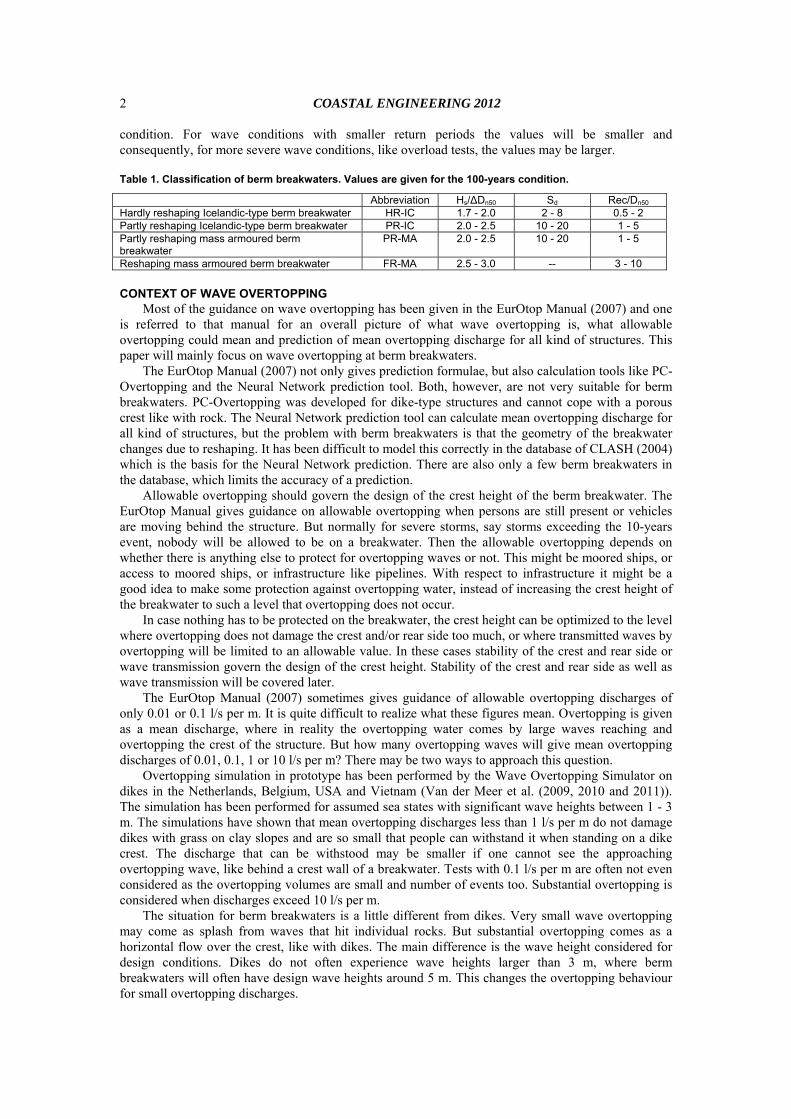
Table 1 shows the new classification for berm breakwaters, including indicative values for the stability number, Hs/ΔDn50, the damage and the recession. These values are given for a 100-years wave
1 IceBreak Consulting Engineers ehf, Smararima 46, Reykjavik, IS-112, Iceland, [email protected] 2 Van der Meer Consulting BV, P.O. Box 423, AK Heerenveen, 8440, The Netherlands, [email protected]
COASTAL ENGINEERING 2012 2
condition. For wave conditions with smaller return periods the values will be smaller and consequently, for more severe wave conditions, like overload tests, the values may be larger.
Table 1. Classification of berm breakwaters. Values are given for the 100-years condition.
Abbreviation Hs/∆Dn50 Sd Rec/Dn50 Hardly reshaping Icelandic-type berm breakwater HR-IC 1.7 - 2.0 2 - 8 0.5 - 2 Partly reshaping Icelandic-type berm breakwater PR-IC 2.0 - 2.5 10 - 20 1 - 5 Partly reshaping mass armoured berm breakwater
PR-MA 2.0 - 2.5 10 - 20 1 - 5
Reshaping mass armoured berm breakwater FR-MA 2.5 - 3.0 -- 3 - 10
CONTEXT OF WAVE OVERTOPPING Most of the guidance on wave overtopping has been given in the EurOtop Manual (2007) and one
is referred to that manual for an overall picture of what wave overtopping is, what allowable overtopping could mean and prediction of mean overtopping discharge for all kind of structures. This paper will mainly focus on wave overtopping at berm breakwaters.
The EurOtop Manual (2007) not only gives prediction formulae, but also calculation tools like PC-Overtopping and the Neural Network prediction tool. Both, however, are not very suitable for berm breakwaters. PC-Overtopping was developed for dike-type structures and cannot cope with a porous crest like with rock. The Neural Network prediction tool can calculate mean overtopping discharge for all kind of structures, but the problem with berm breakwaters is that the geometry of the breakwater changes due to reshaping. It has been difficult to model this correctly in the database of CLASH (2004) which is the basis for the Neural Network prediction. There are also only a few berm breakwaters in the database, which limits the accuracy of a prediction.
Allowable overtopping should govern the design of the crest height of the berm breakwater. The EurOtop Manual gives guidance on allowable overtopping when persons are still present or vehicles are moving behind the structure. But normally for severe storms, say storms exceeding the 10-years event, nobody will be allowed to be on a breakwater. Then the allowable overtopping depends on whether there is anything else to protect for overtopping waves or not. This might be moored ships, or access to moored ships, or infrastructure like pipelines. With respect to infrastructure it might be a good idea to make some protection against overtopping water, instead of increasing the crest height of the breakwater to such a level that overtopping does not occur.
In case nothing has to be protected on the breakwater, the crest height can be optimized to the level where overtopping does not damage the crest and/or rear side too much, or where transmitted waves by overtopping will be limited to an allowable value. In these cases stability of the crest and rear side or wave transmission govern the design of the crest height. Stability of the crest and rear side as well as wave transmission will be covered later.
The EurOtop Manual (2007) sometimes gives guidance of allowable overtopping discharges of only 0.01 or 0.1 l/s per m. It is quite difficult to realize what these figures mean. Overtopping is given as a mean discharge, where in reality the overtopping water comes by large waves reaching and overtopping the crest of the structure. But how many overtopping waves will give mean overtopping discharges of 0.01, 0.1, 1 or 10 l/s per m? There may be two ways to approach this question.
Overtopping simulation in prototype has been performed by the Wave Overtopping Simulator on dikes in the Netherlands, Belgium, USA and Vietnam (Van der Meer et al. (2009, 2010 and 2011)). The simulation has been performed for assumed sea states with significant wave heights between 1 - 3 m. The simulations have shown that mean overtopping discharges less than 1 l/s per m do not damage dikes with grass on clay slopes and are so small that people can withstand it when standing on a dike crest. The discharge that can be withstood may be smaller if one cannot see the approaching overtopping wave, like behind a crest wall of a breakwater. Tests with 0.1 l/s per m are often not even considered as the overtopping volumes are small and number of events too. Substantial overtopping is considered when discharges exceed 10 l/s per m.
The situation for berm breakwaters is a little different from dikes. Very small wave overtopping may come as splash from waves that hit individual rocks. But substantial overtopping comes as a horizontal flow over the crest, like with dikes. The main difference is the wave height considered for design conditions. Dikes do not often experience wave heights larger than 3 m, where berm breakwaters will often have design wave heights around 5 m. This changes the overtopping behaviour for small overtopping discharges.

COASTAL ENGINEERING 2012
3
Assume a design wave height for a berm breakwater around Hs = 5 m with a wave steepness of sop = 0.04 (giving Tp = 8.9 s) and a storm with a duration of six hours. For use of PC-Overtopping or the prediction formulae in the EurOtop Manual (2007) a slope of 1:2 has been used (more or less an average slope for a berm breakwater) and an influence factor for roughness of γf = 0.5. Calculations show the following: 0.1 l/s per m: no overtopping waves (splash only) 0.5 l/s per m: 5 waves overtopping, this is less than one wave per hour 1 l/s per m: 11 waves overtopping, about 2 waves per hour 5 l/s per m: 69 overtopping waves, which is 2.4% of the total incident number of waves 10 l/s per m: 139 waves, which is 4.8% of the total incident number of waves
Moreover, the prototype measurements of wave overtopping in CLASH (2004) have shown that scale effects on overtopping for rubble mound breakwaters are present if the mean discharge is less than 1 l/s per m. Above figures and the scale effects show that it is not realistic to have allowable overtopping limits for berm breakwaters under design conditions that are lower than about 0.5 l/s per m.
Lower discharges can be measured in a laboratory, but they have no physical meaning in prototype for the circumstances described above.
The EurOtop Manual (2007) gives overtopping formulae for smooth slopes like dikes, and for rubble mound structures with a straight slope. Both are considered here first as it will give the basis for describing wave overtopping for berm breakwaters.
For a sloping structure wave overtopping can be described by:
vfbmm
Cmb
mH
R
Hg
q
00,10,13
0
75.4exptan
067.0 (1)
with a maximum of:
fm
C
mH
R
Hg
q
03
0
6.2exp2.0 (2)
where: q = mean overtopping discharge per meter structure width [m3/s/m] g = acceleration due to gravity [m/s²] Hm0 = estimate of significant wave height from spectral analysis =
0m4 [m]
α = angle between overall structure slope and horizontal [°] ξm-1,0 = breaker parameter = 5.0
0,1/tan ms [-]
sm-1,0 = wave steepness with Lm-1,0, based on Tm-1,0: Hm0/Lm-1,0 = 2πHmo/(gT²m-1,0) [-] Tm-1,0 = average wave period defined by m-1/m0 [s]
mn = 2
1
f
f
nS(f)dff = nth moment of spectral density [m²/sn]
lower integration limit = f1 = min(1/3 fp, 0.05 full scale) upper integration limit = f2 = 3 fp mn,x = nth moment of x spectral density [m²/sn] x may be: i for incident spectrum r for reflected spectrum Rc = crest freeboard of structure [m] γb = influence factor for a berm [-] γf = influence factor for the permeability and roughness of or on the slope [-] γβ = influence factor for oblique wave attack [-] γv = influence factor for a vertical wall on the slope [-] The influence factors are described in detail in the EurOtop Manual. Dikes have often smooth
slopes and then Eq. 1 applies. If slopes become steeper, or the wave steepness lower, Eq. 2 may apply, which is the formula for so-called "non-breaking" or surging waves on the structure. As rubble mound breakwaters as well as berm breakwaters have steep slopes, only Eq. 2 will be considered here.

COASTAL ENGINEERING 2012 4
Actually, the dimensionless wave overtopping discharge q/(gHm03)0.5 is given as an exponential
function of the relative crest freeboard Rc/Hm0 and two influence factors, one for oblique wave attack and one for the influence of permeability or roughness of the slope. Exponential functions show a straight line on a log-linear graph and Fig. 2 shows some data points for dike-type structures, where the slope was impermeable. The correct influence factors were applied on the horizontal axis, which shifts the data points to the line for a smooth straight slope under non-breaking waves.
1.E-7
1.E-6
1.E-5
1.E-4
1.E-3
1.E-2
1.E-1
1.E+0
0.0 0.5 1.0 1.5 2.0 2.5 3.0 3.5
Wa
ve o
vert
op
pin
g q
/(g
Hm
03)0
.5
Relative crest height Rc/(Hm0 f b)
Smooth, straight, deep
Rough slopes
Oblique long-crested
Oblique short-crested
Shallow, bi-modal
Vertical wall at slope
Steep foreshore
Steep foreshore, bi-modal
Figure 2. Wave overtopping for dike-type slopes under non-breaking waves, Eq. 2.
The reliability of Eq. 2 is described by taking the coefficient 2.6 as a normally distributed stochastic parameter with a mean of 2.6 and a standard deviation of σ = 0.35. For probabilistic calculations Eq. 2 should be taken together with this stochastic coefficient. For predictions of measurements or comparison with measurements also Eq. 2 should be taken with, for instance, 5% upper and lower exceedance curves, as shown in Fig. 2.
For deterministic or semi-probabilistic calculations in design or safety assessment it is strongly recommended to increase the average discharge by about one standard deviation. Thus, Eq. 2 should then be used with a coefficient of 2.3 instead of 2.6.
Another way of showing the influence of roughness and permeability on wave overtopping is by using the relative freeboard Rc/Hm0 on the horizontal axis and plotting different lines for different influence factors γf. An influence factor in fact lowers the line for wave overtopping as shown in Fig. 3. This figure shows the line for γf = 1 for a smooth slope, similar to the line in Fig. 2, but it also shows lines for influence factors of γf= 0.3, 0.4, 0.5 and 0.6.
The data in Fig. 3 are from CLASH (2004), see Bruce et al. (2009), where different armour units, including rock, were used on a slope of 1:2 and where overtopping was measured. Also a smooth slope was tested, giving the data points on the highest line. Roughness and/or permeability as for rubble mound breakwaters reduce wave overtopping drastically if compared with a smooth slope. Most of the data points lay between the lines with influence factors γf between 0.3 and 0.6. In the EurOtop Manual a good estimate of this influence factor was made for each type of armour unit, reducing the total scatter in the figure significantly.

COASTAL ENGINEERING 2012
5
1.E-7
1.E-6
1.E-5
1.E-4
1.E-3
1.E-2
1.E-1
1.E+0
0.0 0.5 1.0 1.5 2.0 2.5 3.0 3.5
Wa
ve
ov
ert
op
pin
g q
/(g
Hm
03)0
.5
Relative crest height Rc/Hm0
smooth gf=1.0rough gf=0.6rough gf=0.5rough gf=0.4rough gf=0.3SmoothRockCube roughCube flatAnitferHaroTetrapodCube-1 layerAccropdeCorelocXbloc
Figure 3. Wave overtopping for armour units on a slope of 1:2, Eq. 2.
A berm breakwater is also a rubble mound breakwater with large roughness and permeability. But it has not a straight slope, like the data points in Fig.3, but a steep seaward slope with a berm and often a partly or fully reshaped berm. Nevertheless, it may be expected that overtopping data for berm breakwaters will give a similar graph as Fig. 3. The influence factor may then be a function of geometry of the berm breakwater or wave conditions. If this influence factor can be found and described in a sophisticated way, Eq. 2 can be used and will place berm breakwaters in a similar graph as all other coastal structures. The equation should be written in a slightly different way:
BBm
C
mH
R
Hg
q
03
0
6.2exp2.0 (3)
where γBB is the influence factor for a berm breakwater. In EurOtop (2007) the formula of Lykke Andersen (2006), has been described, which was
developed on a large systematic series of tests on berm breakwater profiles. This formula is quite complicated as it was based on multi-parameter fitting. In total he uses 17 parameters in his formula with 10 coefficients and 10 power coefficients. By such a complicated formula it is hardly possible to find the most significant physics based influences and to make a graph like Fig. 2 with the correct influence factor. The new classification of berm breakwaters distinguishes between three types of responses: hardly reshaping, partly reshaping and fully reshaping. It may be that these responses of berm breakwaters have different effects on wave overtopping.
AVAILABLE DATA SETS Data on overtopping at berm breakwaters were gathered and re-analysed in line with the procedure
in the EurOtop Manual (2007). Published data and data received from authors on request were used, but also project related data. These data could only be used in an anonymous way, like "Project x". Summary of all available data are given in Table 2.
The partly reshaping mass armoured breakwater in Project 1 had three specific tests with once a much longer berm and another with a high berm at the same level as the crest. They are given separately in Table 2. Project 5 had the berm level at the same level as the crest, but it was quite a low crest level, more according to a normal berm level. In Lykke Andersen (2006) one cross-section was tested, but rock gradings were combined to very wide gradings giving an Icelandic-type berm breakwater, a hybrid berm breakwater (a few gradings, in between an Icelandic-type of berm breakwater and a fully reshaping berm breakwater with only two rock classes) and a fully reshaping berm breakwater. Due to its wide grading the fully reshaping berm breakwater cross-section is completely outside a normal design range and will not be considered here. The first cross-section is considered as a partly reshaping Icelandic-type berm breakwater (PR IC) and the hybrid is considered

COASTAL ENGINEERING 2012 6
as a partly reshaping mass armoured berm breakwater (PR MA). Also here some tests were outside the realistic range with wave heights up to 11 m, where the design wave height was assumed to be around 7 m.
Table 2. Overall view of data used for overtopping analysis.
Case Type Hs/ ∆Dn50
Down slope cotαd
Upper slop e cotαu
Berm width B/Hs
Berm level db/Hs
Crest height Rc/Hs
Number of tests
q/(gHs3)0.5>10-5
Hardly reshaping Project 1 HR-IC 1.7 1.5 1.5 1.5 0.9 1.6 8
Lykke Andersen Armour 1
HR-MA 1.8 1.25 1.25 0-4 0.2-0.3 0.8-1.2 32
Partly reshaping Project 4 PR-IC 2.2 1.25 3.0 3.0 0.9 1.3 7
Lykke Andersen
(2008)
PR-IC 2.0 1.5/1.3 1.5 1.5 0.6 1.3/1.7 10
Project 1 PR-MA 2.3 1.1 1.5 2.6 0.9 1.4 2 Project 1 PR-MA 2.3 1.1 1.5 4.3 0.9 1.4 2 Project 1 PR-MA 2.3 1.1 1.5 2.7 1.6 1.4 1
Lykke Andersen Armour 2
PR-MA 2.5 1.25 1.25 2.5-4 0.35 0.8-1.5 27
Lykke Andersen
(2008)
PR-MA 2.2 1.5/1.3 1.5 1.5 0.6 1.3 5
Keilisnes PR-MA 2.1 1.3 2.25 2.9 0.3-0.4 1.65 15 Full reshaping
Project 4 FR-MA 2.8 1.25 3.0 2.5 0.9 1.5 7 Project 4 FR-MA 3.1 1.25 1.5 3.0 0.7 1.5 6 Project 5 FR-MA 3.5 1.33 1.33 2.3 0.6/1.0 0.6/1.0 4 Project 5 FR-MA 3.0 1.33 1.33 3.1 0.6/1.0 0.6/1.0 8
Lykke Andersen Armour 3
FR-MA 3.5 1.25 1.25 2.5-5 0.35 0.8-1.5 54
Dynamically stable (not considered) Lissev, et al.
(1996) FR-MA 4.5 1.25 1.5 3.0 0.4 1.3 0
Where: HR-IC Hardly reshaping Icelandic-type berm breakwater HR-MA Hardly reshaping mass armoured berm breakwater PR-IC Partly reshaping Icelandic-type berm breakwater PR-MA Partly reshaping mass armoured berm breakwater FR-MA Full reshaping mass armoured berm breakwater Hs Estimated 100-years design wave height
Wave overtopping has not been measured for many fully reshaping berm breakwaters. It is for this
reason that also some tests on armour 3 of Lykke Andersen (2006) have been considered, where recession results were not (actually most profiles are dynamically stable). The "design" stability number was Hs/ΔDn50 = 3.5. Overtopping for larger stability numbers was not considered. Also the tests of Lissev et al. (1996) were not considered as the stability number of Hs/ΔDn50 = 4.5 is far beyond the limit of statically stable.
Overtopping in a laboratory can be measured very accurately, but the meaning of very small overtopping is not always realistic. Overtopping rates lower than 1 l/s per m are affected by scale effects. Wave overtopping graphs are given in relative form, using q/(gHs
3)0.5 as dimensionless overtopping rate. It depends on the significant wave height what the actual overtopping rate will be if a certain threshold for the relative overtopping rate is taken. Assume a threshold of q/(gHs
3)0.5 = 10-5. Then the following actual overtopping rates can be calculated: Hs = 1 m q = 0.03 l/s per m Hs = 4 m q = 0.25 l/s per m Hs = 5 m q = 0.35 l/s per m Hs = 6 m q = 0.46 l/s per m

COASTAL ENGINEERING 2012
7
A value of q/(gHs3)0.5 < 10-5 will mostly give an overtopping rate less than 0.5 l/s per m. This is
already a threshold were scale effects play a role. For analysis of overtopping data the focus will therefore be on q/(gHs
3)0.5 > 10-5. For smaller values the scatter also increases. In the overtopping graphs the area below the given threshold will be shaded in a way that small overtopping data are still visible, but the focus is on larger overtopping rates rather than the very small ones.
Lykke Andersen (2006) performed almost 600 tests on wave overtopping, but many of them are far outside any practical design range. In order to compare the data with the other data from real projects, the data set has been reduced. For Armour 1, the hardly reshaping mass armoured berm breakwater, HR MA, 214 tests on overtopping were performed. On only 36 cross-sections the recession was measured and these are considered as closest to design conditions. All these tests had overtopping rates with q/(gHs
3)0.5 > 10-5. Four tests with a berm below swl were not taken which brings the total number of tests to 32. Armour 2 can be described as a partly reshaping mass armoured berm breakwater. In total 57 tests were performed with 27 tests with q/(gHs
3)0.5 > 10-5. Armour 3 consisted of fully reshaping mass armoured cross-sections (FR MA). Many of them had large berms or stability numbers beyond static stability. FR means fully reshaping where no or only a small part of the original berm has left. Tests where more than one significant wave height on berm width was left were not considered. This means roughly that B-Rec < 0.1 m. In total 323 tests were performed on Armour 3 structures, 115 of them had "too large berms" and 139 test had stability numbers Hs/ΔDn50 > 3.5. From the remaining tests 13 had overtopping rates q/(gHs
3)0.5 < 10-5, which brings the total number of tests considered for Armour 3 to 54.
The overtopping data in projects become then 75 tests, where for Lykke Andersen (2006) 113 tests remain.
DEVELOPMENT OF INFLUENCE FACTOR γBB Each data set was separately plotted in a graph with relative wave overtopping rate versus relative
crest freeboard. The data were compared with Equation 4.2 for steep slopes, with various values for the influence factor γf = 1.0 (smooth slope); 0.6; 0.5; 0.4 and 0.3. For berm breakwaters one could also read γf = γBB.
It is known that the wave period has influence on overtopping at berm breakwaters, this in contrast to steep smooth slopes and also to conventional breakwaters with a straight and steep slope. The reason may be the berm itself, which is very permeable and is most effective for dissipation of energy of short waves. For this reason each test on overtopping was classified into a wave steepness range, given by sop = 0.005 - 0.01; 0.01 - 0.02; 0.02 - 0.03; 0.03 - 0.04; 0.04 - 0.05 and 0.05 - 0.06. Here only two graphs are taken as an example, the data of Keilisnes and of Lykke Andersen (2006) on Armour 3.
Fig. 4 shows the overtopping data of Keilisnes, a partly reshaping Icelandic-type berm breakwater, Sigurdarson and Viggosson (1994). Although half of the data lies below the threshold, it is very clear that lower wave steepness (larger wave periods) give larger wave overtopping.
In Fig. 5 with the data of armour 3 of Lykke Andersen (2006) there is again a clear influence of the wave steepness. A large scatter is present for steepness sop = 0.03 - 0.04, where a large number of tests were performed with different berm widths, crest heights and crest widths. The structure was a fully reshaping mass armoured berm breakwater FR MA.

COASTAL ENGINEERING 2012 8
1.E‐07
1.E‐06
1.E‐05
1.E‐04
1.E‐03
1.E‐02
1.E‐01
1.E+00
0.0 0.5 1.0 1.5 2.0 2.5 3.0 3.5
Wave overtopping q/(gH
m03)0.5
Relative crest height Rc/Hm0
Smooth slopeRough gf=0.6Rough gf=0.5Rough gf=0.4Rough gf=0.3Keilisnes PR‐IC D sop=0.005‐0.01Keilisnes PR‐IC D sop=0.01‐0.02Keilisnes PR‐IC D sop=0.02‐0.03Keilisnes PR‐IC D sop=0.03‐0.04
Figure 4. Wave overtopping for Keilisnes, PR IC.
1.E‐07
1.E‐06
1.E‐05
1.E‐04
1.E‐03
1.E‐02
1.E‐01
1.E+00
0.0 0.5 1.0 1.5 2.0 2.5 3.0 3.5
Wave overtopping q/(gH
m03 )0.5
Relative crest height Rc/Hm0
Smooth slopeRough gf=0.6Rough gf=0.5Rough gf=0.4Rough gf=0.3LA 2006 Armour 3 sop=0.01‐0.02LA 2006 Armour 3 sop=0.02‐0.03LA 2006 Armour 3 sop=0.03‐0.04LA 2006 Armour 3 sop=0.04‐0.05
Figure 5. Wave overtopping for Lykke Andersen (2006), armour 3, FR MA.
Also other data sets show clearly or to a lesser extent an influence of the wave steepness. Only the data set of Project 5 shows no influence of the wave steepness at all and all data points seem to be on one line. This is the data set where the crest level was similar to the berm level. An explanation for this different behaviour has not been found.
The general conclusion of analysing the various graphs is that there is a clear influence of the wave steepness, although this may be still different for the different types of berm breakwaters: HR, PR and FR.
The next step of analysis was to determine for each data set and for each class of wave steepness a value or often a range of values for the influence factor γBB. These ranges of γBB are given in Fig. 6 and 7 as a function of the wave steepness. Fig. 6 combines the data sets for HR and PR, where Fig. 7 gives the ranges for the fully reshaping structures, FR. In both cases the trend is quite clear that the influence factor decreases with increasing steepness (giving decreasing overtopping). Note that the data in Fig. 6 and 6 show ranges and not actual data. A fitting line between the upper and lower boundary would always be quite good. The data of Project 5 show indeed no influence of the wave steepness, see Fig. 7, and give an opposite trend than the other two data sets.

COASTAL ENGINEERING 2012
9
0.0
0.1
0.2
0.3
0.4
0.5
0.6
0.7
0 0.01 0.02 0.03 0.04 0.05 0.06
Influence factor B
B
Wave steepness sop
Project 1 NR LA Armour 1 LA armour 2
P1 MA 15 m P1 MA 25 m P4 PR IC
LA PR IC LA PR MA Keilisnes
Figure 6. Influence factors γBB given as a range for each class of wave steepness. HR and PR.
0.0
0.1
0.2
0.3
0.4
0.5
0.6
0.7
0 0.01 0.02 0.03 0.04 0.05 0.06
Influence factor B
B
Wave steepness sop
P4 FR‐MA
P5 FR‐MA
Lykke Andersen Armour 3
Figure 7. Influence factors γBB given as a range for each class of wave steepness. FR.
It seems that the influence of wave steepness on wave overtopping for berm breakwaters can be given by a linear trend:
γBB = 0.53 - 4.5sop for HR and PR (4) γBB = 0.70 – 9.0sop for FR (5) Equation 5 is quite good for fully reshaping berm breakwaters in Fig. 7, except of course for
Project 5. This equation can be seen as the end result of analysis for this kind of structure. In Fig. 6, however, a number of ranges are completely outside the given trend line. Some of them are located higher (data sets Project 1 HR, Lykke Andersen PR IC) and others are clearly lower than the line (data sets Project 1 MA 25 m wide berm, Project 4 PR IC). A closer look to the data reveals that the berm width may have an effect: the data above the trend have in general small berms with B/Hs = 1.5, where the data below have wide berms up to B/Hs = 4.3.
The following step was to determine for each range of γBB's in Fig. 6 the difference with the trend line Eq. 4, given as ΔγBB. This difference is then plotted against the relative berm width B/Hs, as defined in Table 2, which means using the 100-years wave height as the wave height to classify the structure (or the 80% value of the maximum wave height in a series of research tests). It is not the wave height used in the test, as Fig. 6 gives ranges for different test conditions, where wave heights for individual wave heights have been lost. Fig. 8 gives the differences with the trend line Eq. 4 and also here ranges are given.
A trend line through the data ranges can be given by: ΔγBB = 0.15 - 0.05B/Hs for HR and PR (6)

COASTAL ENGINEERING 2012 10
Note that in Eq. 6 ΔγBB = 0 if B/Hs = 3, which means that such a berm width under design conditions can be described by Eq. 4 only. Smaller berm widths give a positive ΔγBB (more overtopping) and negative ΔγBB gives less overtopping for larger berm widths.
The final formula for γBB for HR and PR berm breakwaters can then be described by combination of Eq. 4 and 6:
γBB = 0.68 - 4.5sop - 0.05B/Hs for HR and PR (7)
‐0.10
‐0.05
0.00
0.05
0.10
0.15
0.20
0.25
0 1 2 3 4 5
Difference with BB
Berm width B/Hs
Figure 8. Difference with Equation 4, for HR and PR berm breakwaters, given as a function of relative berm width B/Hs. Note that Hs is the "design" wave height for the structure.
Equations 5 and 7 give the final formulae for the influence factor on γBB, separated in two classes of berm breakwaters: none and partly reshaping berm breakwaters and fully reshaping berm breakwaters. The first class is influenced by the wave steepness as well as the relative berm width under design conditions, the second is influenced only be wave steepness. There may be more influences, see Lykke Andersen (2006), but these are the most significant ones.
The influence factors given by Eq. 5 and 7 can be introduced in relative crest height as Rc/(Hs γBB) and again overtopping graphs can be made where scatter now should be reduced. Here the same examples of Keilisnes and Lykke Andersen (2006) Armour 3 are given in Figures 9 and 10. In both cases the data are nicely distributed around the line, although a part of the Lykke Andersen test data still show a significant scatter.
In general the graphs for all data sets show much less scatter by using γBB and are more or less grouped around the prediction line. The outlier remains of course Project 5.
1.E‐07
1.E‐06
1.E‐05
1.E‐04
1.E‐03
1.E‐02
1.E‐01
1.E+00
0.0 1.0 2.0 3.0 4.0 5.0 6.0
Wave overtopping q/(gH
m03)0.5
Relative crest height Rc/(Hm0 BB)
Smooth slope
Keilisnes PR‐IC D sop=0.005‐0.01
Keilisnes PR‐IC D sop=0.01‐0.02
Keilisnes PR‐IC D sop=0.02‐0.03
Keilisnes PR‐IC D sop=0.03‐0.04
Figure 9. Wave overtopping for Keilisnes, including γBB, PR IC.

COASTAL ENGINEERING 2012
11
1.E‐07
1.E‐06
1.E‐05
1.E‐04
1.E‐03
1.E‐02
1.E‐01
1.E+00
0.0 1.0 2.0 3.0 4.0 5.0 6.0
Wave overtopping q/(gH
m03)0.5
Relative crest height Rc/(Hm0 BB)
Smooth slope
LA 2006 Armour 3 sop=0.01‐0.02
LA 2006 Armour 3 sop=0.02‐0.03
LA 2006 Armour 3 sop=0.03‐0.04
LA 2006 Armour 3 sop=0.04‐0.05
Figure 10. Wave overtopping for Lykke Andersen (2006) armour 3, including γBB, FR MA.
Fig. 11 and 12 give then the final result with all data combined into these two graphs. The prediction line is given together with the 5% exceedance curves, using a standard deviation of σ = 0.35, which was the standard deviation for steep smooth and rough slopes on the coefficient 2.6 in overtopping formula Eq. 2. The fast majority of the data lies indeed between these two exceedance curves. Project 5 may be the main outlier with half of the data outside the confidence band.
It means that with the influence factors derived in this section the general overtopping formula for steep smooth and rough slopes can also represent overtopping of berm breakwaters with similar reliability. Summarizing, overtopping for berm breakwaters can be calculated by:
BBm
C
mH
R
Hg
q
03
0
6.2exp2.0 (3)
with: γBB = 0.68 - 4.5sop - 0.05B/Hs for HR and PR (7) γBB = 0.70 – 9.0sop for FR (5)
and B/Hs is given by the design wave height (for a 100-years return period).
1.E‐07
1.E‐06
1.E‐05
1.E‐04
1.E‐03
1.E‐02
1.E‐01
1.E+00
0.0 1.0 2.0 3.0 4.0 5.0 6.0
Wave overtopping q/(gH
m03 )
0.5
Relative crest height Rc/(Hm0 BB)
Smooth slope 90% Conf. band
Project 1 NR‐IC Project 4 PR‐IC
LA (2008) PR‐IC Project 1 PR‐MA
LA (2008) PR‐MA Keilisnes PR‐MA
LA Armour 1 NR‐MA LA Armour 2 PR‐MA
Figure 11. Wave overtopping for none and partly reshaping berm breakwaters.

COASTAL ENGINEERING 2012 12
1.E‐07
1.E‐06
1.E‐05
1.E‐04
1.E‐03
1.E‐02
1.E‐01
1.E+00
0.0 1.0 2.0 3.0 4.0 5.0 6.0
Wave overtopping q/(gH
m03)0.5
Relative crest height Rc/Hm0/BB
Smooth slope
90% Conf. band
Project 4 FR‐MA
Project 5 FR‐MA
LA Armour 3 FR‐MA
Figure 12. Wave overtopping for fully reshaping berm breakwaters.
For q/(gHs3)0.5 < 10-5 formulae 3, 5 and 7 may over-predict the actual wave overtopping. But scale
effects may bring the overtopping up again. Mostly a safe design is created if the formulae are also used for q/(gHs
3)0.5 < 10-5, but anyhow one should be careful in interpreting model test results for these low values.
LOCATION OF OVERTOPPING MEASUREMENTS The scatter still present in Fig 11 and 12 can be of various reasons. One of the possible reasons
can be the location of overtopping measurements. In much of the research wave overtopping is measured at the rear edge of the crest, where crest and rear slope meet. This is not always the case for overtopping measurements in projects where the aim is to measure the water that will cause trouble on the leeside quay or road. This includes both water directly overtopping the crest and as well as water penetrating through the crest.
The cross section in Fig. 13 shows the location of the overtopping tray in Lykke Andersen’s tests. The tray opens on the rear edge of the breakwater crest and only captures water going over the crest not water penetrating through the porous crest structure.
Figure 13. Location of overtopping measurements frequently used in model tests, from Lykke Andersen (2006).
The photo on the left side of Fig. 14 shows the location of an overtopping tray in Project 1. The overtopping tray opens at the rear side of the crest structure on top of an access road. It will therefore capture both overtopping going over the crest as well as penetrating through the crest structure. The cross sections on the right side of Fig. 14 show the location of overtopping trays in the Keilisnes project. The trays are located behind a low crest wall. As in project 1 the overtopping tray captures all water going over the crest and through the crest and over the crest wall.

COASTAL ENGINEERING 2012
13
Figure 14. Location of overtopping measurements in Project 1 and Keilisnes project.
The two photos in Fig. 15 show the overtopping at the Bakkafjordur berm breakwater during a storm in October 1995, Sigurdarson et al. (1998). The upper photo shows overtopping over the breakwater crest while the lower photo shows sea water flowing through the crest structure. Similar flow has been seen in hydraulic model tests.
Figure 15. Rear side of the Bakkafjordur breakwater during a storm in 25 October 1995, overtopping over the crest and through the crest.
VALIDATION OF THE OVERTOPPING FORMULA BY A REAL STORM The Husavik berm breakwater in NE Iceland was constructed in the years 2001 to 2002. It has
been designed as an Icelandic-type berm breakwater with high but rather narrow berm of large stones, Sigurdarson et al. (2006). On 25 October 2008 the breakwater was hit by a storm with offshore significant wave height exceeding 11 m with a peak period about 13.5 s. There was flooding in the harbour area and minor damages on rock revetments inside the port. According to a wave hindcast study the wave height reaching the breakwater was about Hs = 5.0 m corresponding to a stability number Hs/ΔDn50 of about 1.5. There were no damages on the breakwater itself, not a single stone displaced. Still the breakwater was heavily overtopped and gravel and small stones from an unpaved

COASTAL ENGINEERING 2012 14
area behind the crest was washed upon the paved quay area, see Fig. 16. The estimated overtopping rate with the proposed formula is about 1.6 to 2.2 l/s/m taking into account some uncertainty in the wave refraction analysis.
Figure 16. Husavik berm breakwater at the end of the 25 October 2008 storm. Gravel and small rock from unpaved area behind the crest washed upon the quay area.
There were no overtopping measurements during the storm and therefore no direct comparison with the proposed overtopping formula is possible. On the other hand it is possible to compare the prototype behaviour to model testing of a similar structure with measured overtopping rate. Fig. 17 from the model testing shows two photos for a stability number of about 1.4 for the left figure and about 1.6 for the right figure with measured overtopping rate of 0.6 and 2.4 l/s/m respectively. For the berm and crest structure no damages or displacement of armourstone were observed for these tests while gravel and small stones from the road behind the crest structure were washed out. It can be concluded that for similar structural behaviour there is good agreement between the calculated prototype overtopping rate and the measured overtopping rate in the physical model testing.
Figure 17. Model testing of an Icelandic-type berm breakwater similar to the Husavik berm breakwater, crest of blue stones to the right, unpaved road in the centre and rear side revetment on the left of both photos. The left and right photos are taken after wave conditions corresponding to stability numbers Hs/∆Dn50 1.4 and 1.6 respectively and with measured overtopping rate of 0.6 and 2.4 l/s/m respectively
CONCLUSIONS The EurOtop Manual presents an overtopping formula for rubble mound structures, which is
independent on wave period or wave steepness. For berm breakwaters the same manual presents the overtopping formula of Lykke Andersen, 2006, which is rather complicated to use. The formula on the other hand shows that wave period has significant influence on wave overtopping.
Data on overtopping at berm breakwaters has been gathered, partly from research and partly from projects, and reanalysed in line with the procedure in the EurOtop Manual. The data has a large variation in wave period or wave steepness and shows a clear dependency on those parameters. A new overtopping formula for berm breakwaters has been developed and roughly validated on prototype performance.
The proposed overtopping formula is based on available results from physical model tests of berm breakwaters. Based on overtopping data with a rather narrow range of wave steepness (only sop = 0.02 and 0.04, not smaller than 0.02) the European CLASH project and the EurOtop Overtopping Manual

COASTAL ENGINEERING 2012
15
both concluded that overtopping at conventional rubble mound structures was independent on wave period. Still some dependency was found and with reanalysing of that data it might be able to get better coherence between overtopping of conventional and berm breakwaters if also much smaller wave steepnessess for conventional breakwaters would be considered. The tendency found for berm breakwaters in this paper may also be present, maybe to a lesser extent, for conventional breakwaters with concrete units.
REFERENCES Bruce, T., J.W. van der Meer, L. Franco and J.M. Pearson. 2009. Overtopping performance of different
armour units for rubble mound breakwaters. Special Issue of Journal of Coastal Engineering, 56 (2009) 166-179.
EurOtop Manual. 2007. Overtopping Manual; Wave Overtopping of Sea Defences and Related Structures – Assessment Manual. UK: N.W.H. Allsop, T. Pullen, T. Bruce. NL: J.W. van der Meer. DE: H. Schüttrumpf, A. Kortenhaus. www.overtopping-manual.com.
Lissev, N. and A. Torum. 1996. Influence of the core configuration on the stability of berm breakwaters. Proceedings of ICCE 1996, ASCE, 1735-1747.
Lykke Andersen T. and H.F. Burcharth. 2010. A new formula for front slope recession of berm breakwaters. Coastal Engineering, Vol. 57, 359-374.
Lykke Andersen, T. 2006. Hydraulic Response of Rubble Mound Breakwaters. Scale Effects – Berm Breakwaters, Ph.D. Thesis, Department of Civil Engineering, Aalborg University, Denmark.
Sigurdarson, S. and J.W. van der Meer. 2011. Front Slope Stability of the Icelandic-type Berm Breakwater, Proceedings of Coastal Structures 2011, ASCE.
Sigurdarson, S., O.B. Smarason, G. Viggosson and S. Bjørdal. 2006. Wave height limits for the statically stable Icelandic-type Berm Breakwater. Proceedings of ICCE 2006, ASCE.
Sigurdarson, S., J. Juhl, P. Sloth, O.B. Smarason and G. Viggosson. 1998. Advances in Berm Breakwaters. Proceedings of Coastlines, Structures and Breakwaters Conference. London. ICE.
Sigurdarson, S. and G. Viggosson. 1994. Berm Breakwaters in Iceland, Practical Experiences. Proc. International Conference on Hydro-Technical Engineering for Port and Harbor Construction. Yokosuka, Japan.
Van der Meer, J.W., R. Schrijver, B. Hardeman, A. van Hoven, H. Verheij and G.J. Steendam. 2009. Guidance on erosion resistance of inner slopes of dikes from three years of testing with the Wave Overtopping Simulator. Proc. ICE, Coasts, Marine Structures and Breakwaters 2009, Edinburgh, UK.
Van der Meer, J.W., B. Hardeman, G.J. Steendam, H. Schttrumpf and H. Verheij. 2010. Flow depths and velocities at crest and inner slope of a dike, in theory and with the Wave Overtopping Simulator. ASCE, Proc. ICCE 2010, Shanghai.
Van der Meer, J.W., C. Thornton and S. Hughes. 2011. Design and operation of the US Wave Overtopping Simulator. ASCE, Proc. Coastal Structures 2011, Yokohama, Japan.