wavelength dispersive (wdxrf) and energy dispersive (edxrf) x- ray fluorescence non destructive...
TRANSCRIPT

Wavelength dispersive (WDXRF) and energy dispersive
(EDXRF) X- ray fluorescence
NON DESTRUCTIVE CHEMICAL ANALYSIS
Notes by:Dr Ivan Gržetić, professorUniversity of Belgrade – Faculty of Chemistry

XRF detection system
No mater how the secondary X-ray radiation (X-Ray fluorescence) is produced in XRF machines there are TWO WAYS to detect this radiation:◦Wavelength Dispersive System (WDS) and
◦Energy Dispersive System (EDS).

Wavelength Dispersive System (WDS)

PRINCIPLEA wavelength dispersive
detection system physically separates the X-Rays according to their wavelengths.
The x-rays are directed to a crystal, which diffracts (according to Bragg´s Law) the X-Rays in different directions according to their wavelengths (energies).

Bragg´s Law

Geometry of the spectrometer
SPOT SOURCE of X-RAYS
No need for collimators
Good forSEM-WDX
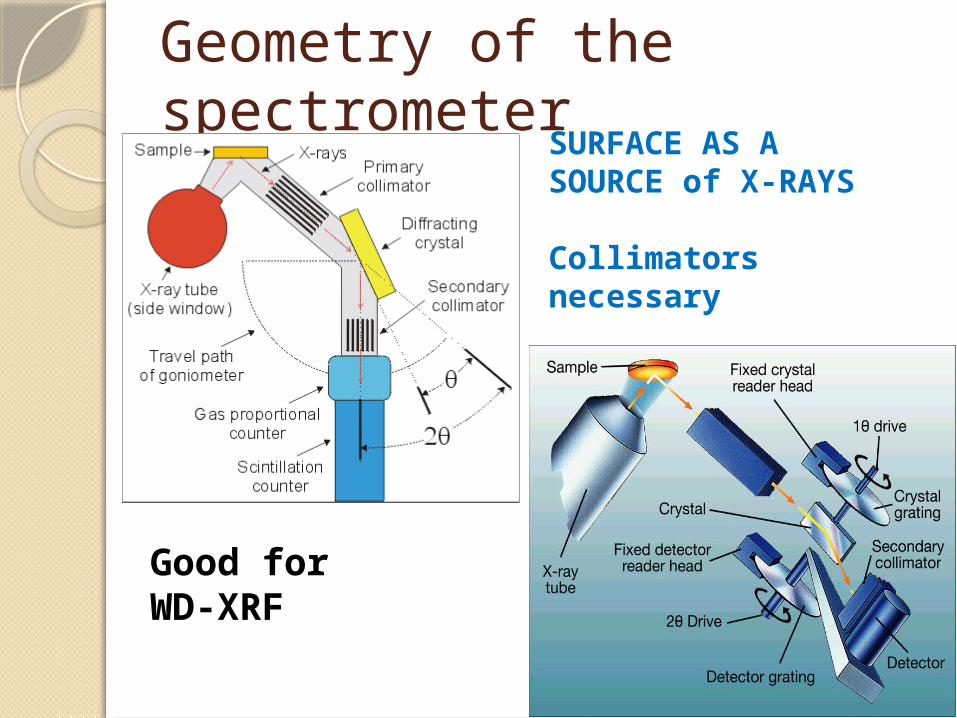
Geometry of the spectrometer
SURFACE AS A SOURCE of X-RAYS
Collimators necessary
Good forWD-XRF

Characteristics and Strengths WDS is used for non-destructive quantitative analyses of
spots as small as a few micrometers, at detection levels as low as a few 10s of ppm, and for elements from atomic number 5 (boron) and higher.
WDS works well in a variety of natural and synthetic solid materials, including minerals, glasses, tooth enamel, semi-conductors, ceramics, metals, etc.
The high spatial resolution of WDS not only allows quantitative analyses to be performed on small phases but also to detect chemical zoning on a small scale within a material (e.g. mineral).
When the electron beam is restored, the WD spectrometers can allow x-ray image maps of individual elements to be constructed.
When compared to EDS, WDS exhibits superior peak resolution of elements and sensitivity of trace elements.

Characteristics and Limitations Because WDS cannot determine elements below atomic
number 5 (boron), several geologically important elements cannot be measured with WDS (e.g., H, Li, and Be).
Despite the improved spectral resolution of elemental peaks, some peaks exhibit significant overlaps that result in analytical challenges (e.g., VKα and TiKβ).
WDS technique is slower then EDS technique, but WDS DL is much better then EDS DL.
WDS analyses are not able to distinguish among the valence states of elements (e.g. Fe2+ vs. Fe3+) such that this information must be obtained by other techniques (e.g. Mossbauer spectroscopy).
The multiple masses of an element (i.e. isotopes) cannot be determined by WDS, but rather are most commonly obtained with a mass spectrometer (see stable and radiogenic isotope techniques).

Detection limit for WDSThe range of detectable elements varies
according to instrument configuration and set up, but typically WDXRF covers all elements from beryllium (Be) to uranium (U).
Concentrations can range from 100% down to ppm and in some cases sub-ppm levels. Limits of detection depend upon the specific element and the sample matrix, but as a general rule, heavier elements will have better detection limits.

Energy Dispersive System (EDS)

PRINCIPLE EDS is an analytical technique used for the elemental analysis
or chemical characterization of a sample. The secondary x-rays (X-ray florescence) are directed to a
detector. A detector is used to convert X-ray energy into voltage signals; this information is sent to a pulse processor, which measures the energy of the signals and passes them onto an analyzer. The analyzer converts the analog into a digital signal which is proportional to the energy of the incoming pulse. Received pulses are actually amplified, converted into digital signals and then sorted by energy with help of multi-channel analyzer (energy is characteristic for each element) and frequency of appearance (characteristic for concentration) and sent to data display and analysis. The most common detector now is Si(Li) detector cooled to cryogenic temperatures with liquid nitrogen; however newer systems are often equipped with silicon drift detectors (SDD) with Peltier cooling systems.

EDS spectrometer
ED-XRF
SEM-EDX

Si(Li) detector with LN cooling
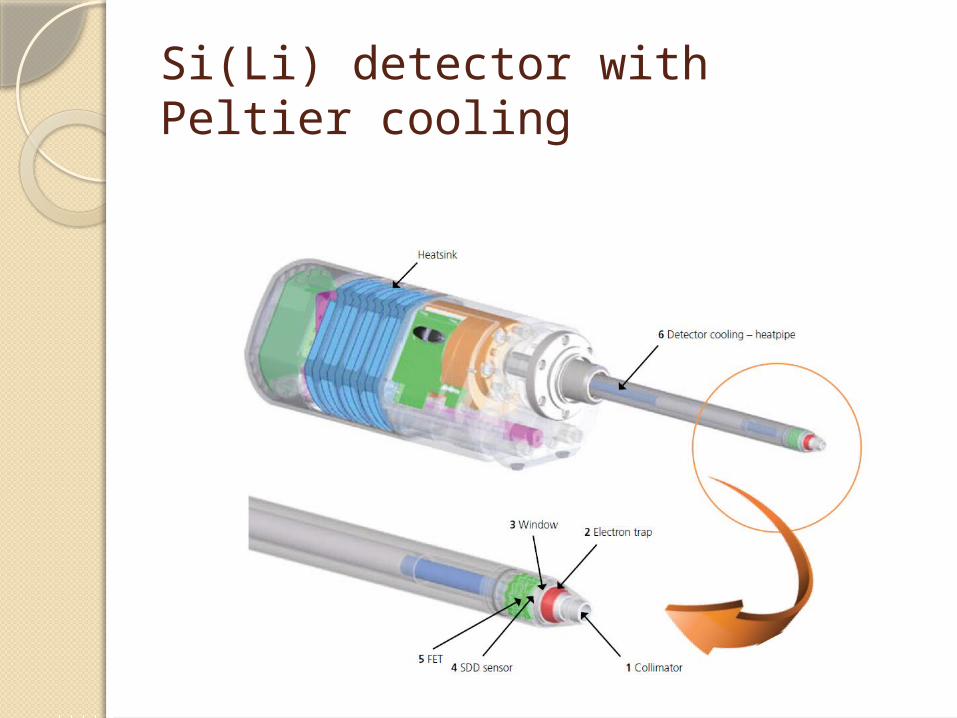
Si(Li) detector with Peltier cooling

Detection limit for EDXRFAnalysis of elements from Sodium
(Na) to Uranium (U).Concentration range from 100 %
down to the ppm-level (not valid for light elements). Limits of detection depend upon the specific element and the sample matrix, but as a general rule, heavier elements will have better detection limits.

HANDHELD XRFSpecifically designed for the rigorous demands of nondestructive elemental analysis in the field.

Detection limit for handheld EDXRF

μ-XRF with polycapillary focusing optics
Polycapillary focusing optics collect a large solid angle of X rays from an X-ray source and focus them to a spot as small as 10µm. The X-ray flux density obtained is a few orders of magnitude higher (100x-10000x) than that obtained with a conventional pinhole collimator. The main application of these optics is micro X-ray fluorescence (µXRF) analysis, which has been widely used for thin film and plating analysis, precious metal evaluation, alloy measurement, and monitoring of electric circuit board coatings.
Polycapillary optics are arrays of small hollow glass tubes (fibers). X rays are guided down these curved and tapered tubes by multiple reflections in a manner analogous to the way fiber optics guide light.
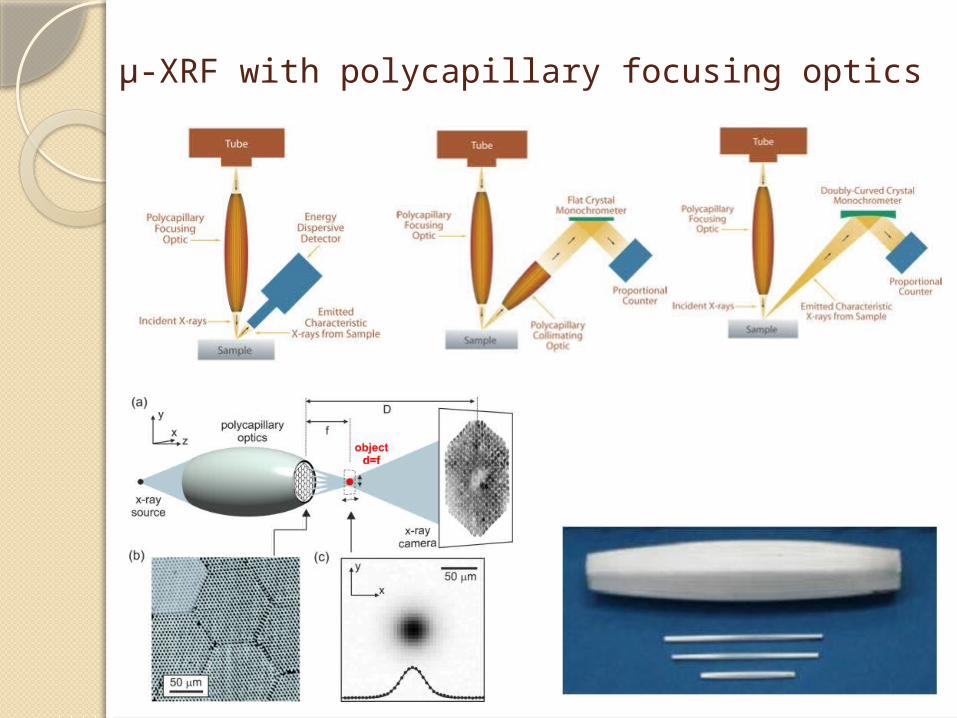
μ-XRF with polycapillary focusing optics

WDS vs EDS

Differences in WDS and EDS

Differences in WDS and EDS
WDS EDS
1. High spectral resolution (2-6 eV)
1. Low spectral resolution (130-155 eV)
2. Low collection efficiency (slower)
2. High collection efficiency (faster)
3. Higher P/B 3. Lower P/B
4. Highly sensitive to geometric effects
4. Low sensitivity to sample geometry
5. Few spectral artifacts 5. Several spectral artifacts
6. No LN required 6. LN required*
7. Moving mechanical parts 7. No moving mechanical parts**
8. Relatively high beam current typical
8. Lower beam current feasible
9. Great for majors and traces 9. Great for majors, poor for traces
10. Very expensive to purchase 11. Less expensive to purchase
* Some recent claims of LN-free new models
** Except for retractable models

WDS vs EDS spectrum

SEM-WDS vs WD-XRF SEM-WDS WD-XRFCorpuscular (electron) induced X-rays Wave (X-rays or γ-rays) induced X-raysNECESSARY for nonconductive samples surface coating with electro conductive thin film (carbon, gold…)
No coating necessary
Spot, line or surface analysis (scanning system)
Mainly surface analysis (spot in case of μ-XRF)
Small excitation energy 0,06 W !! (up to 2 μA beam current, up to 30 kV excitation potential)
High excitation energies up to 4 kW (up to 120 mA beam current, up to 80 kV excitation potential)
Excellent energy resolution Excellent energy resolutionAnalysis of surface layers (shallow penetration up to 2 μm)
Analysis of dipper layers – real bulk analysis (penetration up to 3mm)
Longer time for quali- and quanti-tative analysis
Longer time for quali- and quanti-tative analysis
Good detection limit Excellent detection limitAnalysis of elements from Beryllium (Be) to Uranium (U)
Analysis of elements from Beryllium (Be) to Uranium (U)
Concentration range from 100 % down to the ppm-level.
Concentration range from 100 % down to the sub-ppm-level.
Manual to semiautomatic procedures Possible full automatic procedures

SEM-EDS vs ED-XRF SEM-EDS ED-XRFCorpuscular (electron) induced X-rays Wave (X-rays or γ-rays) induced X-raysNECESSARY for nonconductive samples surface coating with electro conductive thin film (carbon, gold…)
No coating necessary
Spot, line or surface analysis (scanning system) Mainly surface analysis (spot in case of μ-XRF)Can work only with vacuum Vacuum not necessary but it can work with vacuum
Small excitation energy 0,06 W !! (up to 2 μA beam current, up to 30 kV excitation potential)
High excitation energies up to 4 kW (up to 120 mA beam current, up to 80 kV excitation potential)
Fair energy resolution Fair energy resolutionAnalysis of surface layers (shallow penetration up to 2 μm)
Analysis of dipper layers – real bulk analysis (penetration up to 3mm)
Short time for quali- and quanti-tative analysis Short time for quali- and quanti-tative analysisGood detection limit. Less optimal for light elements.
Good detection limit in vacuum. Less optimal for light elements.
Analysis of elements from Sodium (Na) to Uranium (U)
Analysis of elements from Sodium (Na) to Uranium (U)
Concentration range from 100 % down to the ppm-level (not valid for light elements).
Concentration range from 100 % down to the ppm-level (not valid for light elements).Concentration range from 100 % down to the 10 or 100 ppm-level with no vacuum.
Analysis of solid samples Analysis of solids and liquids Manual to semiautomatic procedures Possible full automatic procedures
HANDHELD instruments available

THE END