waves and tides in the canary current large marine...
TRANSCRIPT

36 Waves and tides in the Canary Current Large Marine Ecosystem
The report Oceanographic and biological features in the Canary Current Large Marine Ecosystem and its
separate parts are available on‐line at httpwwwunescoorgneweniocts115
The bibliography of the entire publication is listed in alphabetical order on pages 351‐379 The bibliography
cited in this particular article was extracted from the full bibliography and is listed in alphabetical order at
the end of this offprint in unnumbered pages
ABSTRACT
In recent decades and in parallel to the increase in the computational capabilities and improvements in
telecommunications a remarkable progress in the development of equipment for marine environment
monitoring has been carried out Many countries are implementing permanent measurement networks as
well as climate forecast and data management systems The information generated by these tools is
distributed to the whole society This article describes waves and tides regime and variability in the Canary
Current Large Marine Ecosystem (CCLME) The study is based on those sources of data with adequate and
relevant information (products) that allow a reasonable description of these two oceanographic variables
being Puertos del Estado equipment and numerical models the main source of information A review of
existing buoys tide gauges and numerical models available in the region was performed by contacting
different institutions from the affected countries as well as international organizations
Keywords Waves Tides Sea level Mean regime Extreme regime Canary Current Large Marine
Ecosystem Northwest Africa
For bibliographic purposes this article should be cited as
Goacutemez M Peacuterez‐Goacutemez B De Alfonso M Peacuterez S
and Ruiz M I 2015 Waves and tides in the Canary Current
Large Marine Ecosystem In Oceanographic and biological
features in the Canary Current Large Marine Ecosystem
Valdeacutes L and Deacuteniz‐Gonzaacutelez I (eds) IOC‐UNESCO Paris
IOC Technical Series No 115 pp 115‐131 URI
httphdlhandlenet18349182
The publication should be cited as follows
Valdeacutes L and Deacuteniz‐Gonzaacutelez I (eds) 2015
Oceanographic and biological features in the Canary
Current Large Marine Ecosystem IOC‐UNESCO Paris IOC
Technical Series No 115 383 pp URI
httphdlhandlenet18349135
(IOC2015TS115Rev36)
IOC TECHNICAL SERIES No 115 pp 115‐131 URI httphdlhandlenet18349182 2015
115
WAVES AND TIDES IN THE CANARY CURRENT LARGE MARINE
ECOSYSTEM
Marta GOacuteMEZ Begontildea PEacuteREZ‐GOacuteMEZ Marta DE ALFONSO Susana PEacuteREZ and Mordf Isabel RUIZ
Puertos del Estado Ministerio de Fomento Spain
361 INTRODUCTION
In recent decades and in parallel to the increase in the computational capabilities and improvements in
telecommunications a remarkable progress in the development of equipment for marine environment
monitoring has been carried out Many countries are implementing permanent measurement networks as
well as climate forecast and data management systems The information generated by these tools is
distributed to the whole society
In this context Puertos del Estado (hereinafter PdE) has developed permanent networks and forecast
models of marine physical variables giving coverage to all of the Spanish national territory and to the
routes of navigation starting or ending at Spanish ports
This article describes waves and tides regime and variability in the Canary Current Large Marine Ecosystem
region (CCLME) The study is based on those sources of data with adequate and relevant information
(products) that allow a reasonable description of these two oceanographic variables being PdE equipment
and numerical models the main source of information A review of existing buoys tide gauges and
numerical models available in the region was performed by contacting different institutions from the
affected countries as well as international organizations
362 WAVES DATA AND METHODOLOGY
3621 In situ data
In the CCLME region wave data from PdE wave buoys are available Figure 361 shows the position of the
existing buoys in the area of interest All of them belong to PdE networks Table 361 shows the location
mooring depth and the data availability for these stations
The three SeaWatch buoys belong to PdE Deep Water network (Aacutelvarez‐Fanjul et al 2002) They are
multipurpose buoys providing parameters of meteorology (wind speed and direction air temperature and
pressure) directional waves since 2003 and subsurface oceanography (currents sea temperature and
salinity) A Directional Waverider wave sensor is installed since 2003 Before this date the wave sensors
were scalar providing only height and period parameters
The Triaxys buoy is part of PdE coastal buoy network Due to its mooring location data provided by this
buoy are only representative of the closest surrounding area
The wave sensor takes samples during approximately 30 minutes every hour Those samples correspond to
vertical (heave) and horizontal displacements respect to the North and East axis
Goacutemez M Peacuterez‐Goacutemez B De Alfonso M Peacuterez S and Ruiz M I Waves and tides in the CCLME
116
Figure 361 Area of interest and sensors location The dark numbers correspond to the buoys listed in
Table 361 and the yellow numbers correspond to the tide gauges listed in Tables 362 and 363
98
7
11 12 10
13
14 15
5 6 1
2
3
4 17
18
19
20
16
IOC TECHNICAL SERIES No 115 pp 115‐131 URI httphdlhandlenet18349182 2015
117
Figure 362 Left picture Seawatch buoy from the Deep Water Network Right picture Triaxys buoy from
the Coastal Network
Table 361 Description of the PdE wave measurement stations (number of station corresponds to the
number shown on the map in Figure 361)
Station Latitude Longitude Mooring Depth Buoy Type Data availability
1 Golfo de Caacutediz 3648degN 0696degW 450 meters SeaWatch Since 1996
2 Tarifa 3600degN 0559degW 33 meters Triaxys Since 2008
3 Tenerife 2799degN 1658degW 710 meters SeaWatch Since 1997
4 Gran Canaria 2820degN 1580degW 780 meters SeaWatch Since 1996
Buoys have a processor on‐board that performs a spectral analysis using the three displacements time‐
series As a result the main spectral parameters are obtained and sent to PdE in real time These
parameters are significant wave height mean wave period peak wave period mean wave direction and
mean wave direction at the spectral peak (Alfonso et al 2005)
When buoy maintenance is performed raw displacement series are downloaded from the on‐board data
logger and then reprocessed at PdE applying an exhaustive quality control procedure and increasing the
number of computed parameters (from spectral and zero up crossing analysis)
3622 Wave models
PdE has carried out a wave hindcast for the Atlantic Ocean based on the numerical models WAM (WAMDI
Group 1988) and WAVEWATCH III (Tolman 1991) The boundaries of the area covered by the models
shown in Figure 363 are 67degNndash20degN 59degWndash8degE with a variable resolution that goes from 1deg in the open
waters to 5 in the Gulf of Cadiz and the Canary Islands
This hindcast provides information of all the wave parameters since 1958 to 2005 and it is daily updated
with the information provided by the analyzed time series of PdE wave forecast system (Goacutemez‐Lahoz and
Carretero‐Albiach 2005) The points shown in Table 363 have been selected to characterize the waves in
the area
Goacutemez M Peacuterez‐Goacutemez B De Alfonso M Peacuterez S and Ruiz M I Waves and tides in the CCLME
118
Figure 363 The Atlantic grid on the left on the right hand above the Gulf of Cadiz grid and on the right
hand bellow the Canary Islands grid
Table 362 Wave model selected points (number of station corresponds to the number shown on the map
in Figure 367)
Point Latitude Longitude
1 1040042 3550degN 1000degW
2 1030030 3250degN 1250degW
3 4032028 2958degN 1583degW
4 4010008 2792degN 1767degW
5 4030010 2808degN 1600degW
6 4044008 2792degN 1483degW
7 4066012 2825degN 1300degW
8 1036016 2900degN 1100degW
9 1040024 3100degN 1000degW
10 1044032 3300degN 0900degW
11 1050036 3400degN 0750degW
12 5040000 3525degN 0617degW
13 6048012 3595degN 0570degW
IOC TECHNICAL SERIES No 115 pp 115‐131 URI httphdlhandlenet18349182 2015
119
The wave hindcast (1958‐2005) was forced with ERA40 and ERA‐Interim re‐analysis The Wave Forecast
System forcing (2006 to present day) is provided by HIRLAM model run by the Spanish Meteorological
Agency (AEMET in its Spanish acronym)
Being 20degN the southern limit of PdE application the area of interest of this project is partially covered by
this system As a matter of fact the waves propagating from the south that affect the Canary Islands are
not reproduced in PdE wave data
On the other hand a wave forecast system was developed for the area of interest in the framework of the
Marinemet project that was carried out in collaboration between AEMET and PdE
(httpwwwafrimetorgmarinemet accessed on 15 January 2015) The information provided by this
system has not been used in this publication because although very interesting from the forecast point of
view it is not useful for wave climatic characterization
363 TIDES DATA AND METHODOLOGY
3631 In situ data
Tide gauges constitute the main and more precise source of tidal constants information along the coast
Most of the information concerning tides has been obtained from PdE tide gauges (REDMAR network) at
the Gulf of Caacutediz and the Canary Islands (Figure 361 Table 363) most of them upgraded to radar sensors
(Miros) since 2007 The radar sensors provide sea level measurements and local wind waves at the
harbours (Peacuterez‐Goacutemez et al 2013 Peacuterez‐Goacutemez et al 2014) and consist of an antenna located at the pier
well above the higher high water that provides sea level information related to harbour and national
datums by emitting radar pulses to the water surface (Figure 364 right)
The nominal sea level data sampling and latency nowadays is 1‐min at PdE these data are routinely quality
controlled in near‐real time processed and filtered to hourly values before computing the harmonic
analysis each calendar year by means of the Foreman analysis and prediction package (Foreman 1977)
This allows the study of the annual variability and trends of these harmonic constants (Woodworth 2010
Peacuterez‐Goacutemez 2014) The residual component (mainly meteorological in origin) is obtained after extracting
the astronomical tide to the hourly sea level observations
Additional information on tidal constants was required to other countries as well as other institutions such
as Global Sea Level Observing System (GLOSS) Harmonic constants from Nouakchott (Mauritania) were
provided by the Laboratory of Atmospheric Physics and Fluid Mechanics Cote drsquoIvoire The Spanish
Hydrographic Institute (hereafter IHM in its Spanish acronym) on the other hand provided harmonic
constants from Taacutenger and Ifni (Morocco) and Cape Bojador and Dakhla (Western Sahara) The operation
of these stations has been discontinuous in the past and the access to relevant products is not always
possible The Cape Bojador Ifni and Dakhla harmonic constants were obtained in the 40rsquos by IHM so their
value should be carefully considered here Finally tidal constants were also provided by the Instituto
Espantildeol de Oceanografiacutea (IEO) for Cadiz tide gauge (Gulf of Cadiz Spain)
Goacutemez M Peacuterez‐Goacutemez B De Alfonso M Peacuterez S and Ruiz M I Waves and tides in the CCLME
120
Table 363 Description of sea level (tide) measurement stations (number of station corresponds to the
number on the map in Figure 361)
Station Latitude Longitude Tide Gauge Type Data availability
5 Bonanza 36800degN 06333degW Miros (radar) Since 1992
6 Tarifa 36006degN 05630degW Miros (radar) Since 2009
7 El Hierro 27780degN 17900degW Miros (radar) Since 2004
8 La Gomera 28088degN 17108degW Miros (radar) Since 2006
9 La Palma 28678degN 17768degW Miros (radar) Since 2006
10 Tenerife 28483degN 16233degW Miros (radar) Since 1992
11 Granadilla 28090degN 16490degW Aanderaa (pressure) 2004‐2012
12 Las Palmas 28150degN 15330degW Miros (radar) Since 1992
13 Arinaga 27850degN 15400degW Aanderaa (pressure) 2004‐2012
14 Arrecife 28900degN 13530degW Miros (radar) Since 2008
15 Fuerteventura 28500degN 13850degW Miros (radar) Since 2004
16 Taacutenger 35783degN 05800degW May‐June 2005
17 Ifni 29550degN 10067degW March‐April 1949
18 C Bojador 26117degN 14500degW Sept‐Oct 1948
19 Dahkla 23633degN 16000degW Nov 1948‐Jan1949
20 Nouakchott 17984degN 16033degW 2007
3632 Tidal models
Another important sources of information are global and regional tidal models which allow a better spatial
characterization of the tide in open waters Their accuracy along the coast will depend on the spatial
resolution and the quality of the bathymetry A new regional tide atlas provided by Noveltis Legos and
CNES and based on the COMAPI tide model was used (Cancet et al 2010) with a resolution of 1rsquox1rsquo
Unfortunately this high resolution is up to now available only between 225degN and 37degN ie we lack
information south of Mauritania (Figure 364 left)
PdE provides operational sea level forecasts for a domain covering the whole Spanish coast the
Mediterranean and the Canary Islands up to 25degN by means of the Nivmar system This system was
established in 1998 based on the combination of the surge or meteorological forecast obtained with the
HAMSOM model and the tide forecast obtained at the harbours from the REDMAR network (Aacutelvarez‐Fanjul
et al 2001) Nowadays the system includes the tide forecast at the coast by means of the mentioned high
resolution regional tidal atlas for coastal and shelf seas developed by Noveltis Legos and CNES (COMAPI)
IOC TECHNICAL SERIES No 115 pp 115‐131 URI httphdlhandlenet18349182 2015
121
Figure 364 Left panel domain and bathymetry of the COMAPI tidal atlas extracted from the regional
product of the North‐East Atlantic for the Canary Current region (up to 225degN only) one of the sources of
data employed for tides description At right El Hierro (top) and La Palma (bottom) radar tide gauges from
the Spanish REDMAR network
The domain of the COMAPI tidal atlas for the North East Atlantic (NEA) is a little bit larger at this area than
the sea level hindcasts available at PdE (up to 225degN) so the analysis of the spatial variation of the main
components of the tide is based on this tidal atlas Its resolution (1rsquox1rsquo) improves significantly in relation to
the ones from previous global tidal models such as FES2004 GOT47 and TPX072 and to the Nivmar
system itself (10rsquox15rsquo) The COMAPI tidal atlas is based on new regional implementations of a
hydrodynamic finite element tide model (T‐UGOm) combined with altimetry and tide gauge data
assimilation it includes better information of the classical tidal waves near the coast and extension to some
of the non‐linear constituents A set of 37 harmonic constituents is available at each grid point
364 RESULTS AND DISCUSSION
3641 Mean and extreme wave climate
Wave roses of the 4 buoys are presented in Figures 365 and 366 while wave roses at 13 model points are
shown in Figure 367 These wave roses represent the percentage of data in each direction for different
significant wave height (Hs) intervals that are indicated by different blue tones
In the case of the buoys the Hs intervals are taken from 00 m to 25 m with a 05 m width with the last
color indicating waves over 25 m and in the case of the model points the intervals go from 02 m up to 5
m with an interval width of 1 m The last color indicates waves of more than 5 m
Goacutemez M Peacuterez‐Goacutemez B De Alfonso M Peacuterez S and Ruiz M I Waves and tides in the CCLME
122
Regarding the directional information sixteen directions have been considered that indicate the waves
incoming direction
These wave roses give a description of the mean wave climate in each area as they indicate the main
direction from which the waves come and the distribution of the significant wave height
It is important to distinguish between the wave roses that represent open deep water conditions from
those at coastal points that can be very much affected by the coast line This remark is especially
important at the Canary Islands where in general each location is affected by different islands
It can be said that the wave rose of Golfo de Caacutediz buoy (Figure 365) and of model points number 1 2 and
3 (Figure 367) represent open deep water conditions while the others represent coastal conditions
At open and deep water locations the most common wave height is between 1 m and 3 m being higher at
northern locations and decreasing as moving southwards
In regard with the wave direction the Gulf of Cadiz is dominated by waves coming from the west and the
main directions turn first to the north and finally to the north‐east as we move southwards being the
northeast the main direction at model point number 3 (Figure 367) at the north of Canary Islands
As it has been said the wave conditions at coastal points are very much affected by the coast line and some
of them only represent very local wave climate
This is the case of the Tarifa buoy (Figure 365) in which there is no presence of waves coming from the
west while in model point number 13 (Figure 367) that is very close to the buoy the west is the main
direction It is well known that the wave climate at the Strait of Gibraltar has two main components from
the west and the east respectively as it is shown in the wave rose of point number 13 but the buoy is
protected from this direction by the coast line
Model points from 8 to 12 (Figure 367) represent the wave climate along the Moroccan coast It can be
seen that the main direction is the north‐west being more northern or western depending on the coast
orientation The most frequent significant wave heights are between 1 m and 3 m being a little bit lower at
points 11 and 12 because they are a little bit protected by San Vicente Cape
Additionally at the Canary Islands the wave climate is represented by the wave roses of Gran Canaria and
Tenerife buoys (Figure 366) and model points from 4 to 7 (Figure 367) In general it can be seen that the
main direction is north‐northeast but analysing each single case it depends very much on the point
location related with the different islands The most common significant wave height is between 1 m and 2
m that is lower than in the locations at open deep water or at the Moroccan coast because of the
protection provided by the Islands
IOC TECHNICAL SERIES No 115 pp 115‐131 URI httphdlhandlenet18349182 2015
123
Figure 365 Wave roses from Golfo de Caacutediz (left) and Tarifa (right) buoys (yellow dots)
Figure 366 Wave roses from Tenerife (left) and Gran Canaria (right) buoys (yellow dots)
Goacutemez M Peacuterez‐Goacutemez B De Alfonso M Peacuterez S and Ruiz M I Waves and tides in the CCLME
124
1 2
3 4
5 6 7
8 9 10
11 12 13
Figure 367 Wave roses of 13 model points representing different locations of the area of interest
1
2
3
4 5 6 7
8
9
10
11
12
13
IOC TECHNICAL SERIES No 115 pp 115‐131 URI httphdlhandlenet18349182 2015
125
The most extreme significant wave height ever registered by the 4 buoys and obtained at the 13 model
points per season are shown in Tables 364 and 365
Unfortunately some of the buoys have not always been directional buoys and the extreme events have
occurred in dates in which they were not so there is not information about the direction In these cases
directional information from the nearest wave model point was used to draw conclusions
It can be seen that as expected the highest extreme storms appear during the winter season Autumn and
spring seasons are very similar while the lowest extreme storms appear in summer This is valid not only for
the significant wave height but also for the peak period
The Golfo de Caacutediz buoy is an exception because the highest significant wave height was registered in
spring However it can be considered a rare event because taking a more general look of this buoy data
most of the highest storms appear during the winter season as in the other locations
There is more difference between one location and the others in winter being the climate more severe in
the North than in the South In summer the extreme wave climate is very similar at all the locations
Regarding the directions it can be seen that almost all the extreme events come from the north‐west
being slightly more western in winter than in summer
All the seasonal differences are more evident at the northern locations than at the southern ones
Table 364 The highest significant wave height (Hs) ever registered by the 4 buoys per season (W winter
Sp spring S summer A autumn) The corresponding peak period (Tp) direction and date are also shown
Number of station corresponds to the number on the map in Figure 361
Buoy Season Max Hs (m)
Tp(s)
Direction (0‐N90‐E)
Date(GMT)
Buoy Season Max Hs(m)
Tp(s)
Direction (0‐N90‐E)
Date(GMT)
1 Golfo de Caacutediz
W 62 107 ‐‐ 19971218 02h 3Tenerife W 48 94 ‐‐ 19990108 03h
Sp 66 150 ‐‐ 20030413 23h Sp 36 91 230 20130303 22h
S 35 85 ‐‐ 19970605 12h S 27 6478
90 107
20090725 02h20130807 01h
A 36 85 ‐‐ 19990919 13h A 32 94 ‐‐ 19981009 14h
2 Tarifa W 36 105 107 20100128 01h 4 Gran Canaria
W 57 135 ‐‐ 19990112 09h
Sp 33 90 107 20110405 22h Sp 52 98 ‐‐ 20010313 21h
S 18 71 83 20130625 07h S 38 85 ‐‐ 20000610 13h
A 29 89 105 20121108 10h A 55 166 337 2014 1129 06h
The extreme events have lower significant heights at the buoy locations than at the model points because
as it has been said in the previous section the sensors are placed relatively close to the coast so they are
protected by it On the other hand the locations in which the extreme storms are the highest are in the
model points 1 2 9 10 and 11 that as it can be seen in Figure 367 are the less protected by the coast
Goacutemez M Peacuterez‐Goacutemez B De Alfonso M Peacuterez S and Ruiz M I Waves and tides in the CCLME
126
Table 365 The highest significant wave height (Hs) ever got at each of the 13 the model points per season
(W winter Sp spring S summer A autumn) The corresponding peak period (Tp) direction and date are
also shown (number of station corresponds to the number on the map in Figure 367)
Point Season Max Hs (m)
Tp (s)
Direction (0‐N90‐E)
Date(GMT)
Point Season Max Hs(m)
Tp(s)
Direction (0‐N90‐E)
Date(GMT)
1 W 102 175 307 19730117 12h 8 W 88 183 322 19820112 15h
Sp 78 123 77 19550331 21h Sp 64 178 310 19910307 12h
S 43 93 357 19790816 00h S 47 108 357 19660611 00h
A 72 161 296 19821108 03h A 65 181 332 19621107 06h
2 W 86 180 288 19660221 03h 9 W 104 183 309 19820112 12h
Sp 67 153 299 19890409 09h Sp 73 179 301 19910307 06h
S 41 148 356 20080819 15h S 47 91 358 20120612 20h
A 62 151 308 20141129 05h A 75 181 323 19621107 03h
3 W 66 134 308 19891229 00h 10 W 96 183 290 19660221 00h
Sp 58 138 285 20130305 12h Sp 74 178 297 19910307 06h
S 33 90 38 20120712 10h S 37 134 322 19610601 00h
A 70 136 314 20141129 00h A 80 117 268 19891119 18h
4 W 58 180 314 19660221 06h 11 W 97 182 283 19660221 06h
Sp 54 135 290 20130305 04h Sp 73 177 290 19910307 09h
S 41 83 29 20120715 05h S 37 132 309 19610601 00h
A 60 142 321 20141129 06h A 83 159 293 19841105 06h
5 W 49 110 29 20140124 10h 12 W 81 172 293 19730117 21h
Sp 46 85 230 20130303 23h Sp 50 145 275 19910307 15h
S 33 88 28 20120612 02h S 26 143 296 19850601 09h
A 46 145 343 20141129 10h A 48 115 258 19821107 15h
6 W 63 122 319 19720223 06h 13 W 62 109 272 20130119 18h
Sp 45 189 353 20140304 11h Sp 48 112 257 20130306 08h
S 33 89 17 20120712 10h S 25 65 83 20130625 11h
A 63 146 326 20141129 10h A 40 91 81 20081011 00h
7 W 56 118 10 19940117 18h
Sp 52 112 22 19940403 09h
S 37 95 10 20070622 21h
A 46 149 319 20141129 16h
3642 Tides regime
The relative importance of the tide and the meteorological component was estimated by computing the
standard deviation of the tidal elevations and the meteorological component for the REDMAR stations
during the year 2012 (Figure 368 left) Examples of the probability density functions or histograms of both
components are also displayed in Figure 368 (right)
IOC TECHNICAL SERIES No 115 pp 115‐131 URI httphdlhandlenet18349182 2015
127
Figure 368 Left Standard deviation (Stdv) of the tide and the meteorological or residual component for
REDMAR tide gauges in the region (year 2012) Right From the top to the bottom tide and surge
histograms for Tarifa (Gulf of Cadiz) Arrecife (Lanzarote Eastern Canary Islands) and La Palma (Western
Canary Islands) (hourly data year 2012)
The amplitudes and phases of the main semidiurnal (M2 S2) and diurnal (O1 K1) constituents were compiled
in Table 366 not only for the REDMAR stations but also for the ones provided by other organizations The
period of data used for the computation is included as well as the Form Factor F obtained from the ratio of
the amplitudes of these main constituents
)()(
)()(
22
11
SAMA
KAOAF
The value of F is usually employed for tides classification (Pugh 1987) diurnal semidiurnal or mixed
Finally the spatial variation of the main tidal constituents is shown from COMAPI model at Figures 369
and 3610
The Form Factor values in Table 366 well below 25 for all the stations indicate a clear dominant
semidiurnal tide (two highs and two lows per day) in the Canary Current region from the Gulf of Cadiz up to
Mauritania This reflects in the two peaks observed in the tide histograms of Figure 368 (right) the most
probable levels being close to the mean high waters and mean low waters respectively This is coherent on
the other hand with the larger amplitudes of the semidiurnal constituents (M2 and S2) in Table 366 with
respect to the diurnal ones at all the stations we could compile
Station Tide Stdv (cm) Res Stdv (cm)
Bonanza 7048 648
Tarifa 3346 615
Tenerife 5595 388
Granadilla (Tenerife) 4973 944
La Palma 5199 391
La Gomera 4681 370
El Hierro 4747 400
Las Palmas (G C) 5925 419
Arinaga (G C) 5389 485
Fuerteventura 6406 344
Arrecife (Lanz) 6648 351
Goacutemez M Peacuterez‐Goacutemez B De Alfonso M Peacuterez S and Ruiz M I Waves and tides in the CCLME
128
Table 366 Amplitude and phase of the main semidiurnal and diurnal tidal constituents form factor (F)
and period of data for its computation REDMAR stations are shown in bold Harmonic constants provided
by other institutions for those stations shaded in grey
Station M2 S2 O1 K1 F Years Amp
(cm) Phase Lag
(o) Amp(cm)
Phase Lag (o)
Amp (cm)
Phase Lag (o)
Amp(cm)
Phase Lag (o)
Gulf of Cadiz
Bonanza 8987 6374 3089 9033 612 32258 615 6030 0102 2010‐2012 Caacutediz 9967 6513 3593 9282 660 30763 676 5128 0081 2013 Tarifa 4173 4163 1566 6888 048 12849 263 1295 0054 2010‐2012 Taacutenger (Morocco) 6832 6536 1792 7111 446 33613 658 6018 0128 2005
Canary Islands
Tenerife 7063 2892 2718 5261 469 29284 625 4032 0112 2010‐2012 Granadilla (Tenerife) 6130 2596 2463 4731 474 29226 595 4072 0124 2003‐2011 La Palma 6516 3030 2551 5296 458 29365 578 4164 0114 2007‐2012 La Gomera 5794 2358 2335 4592 434 29005 558 3297 0122 2007‐2012 El Hierro 5946 2123 2426 4376 430 29067 613 3233 0125 2010‐2012 Las Palmas (G Canaria) 7527 2838 2897 5317 488 29345 619 4005 0106 2008‐2012 Arinaga (Gran Canaria) 6808 2818 2664 5060 476 29233 604 3724 0114 2003‐2011 Fuerteventura 8089 3233 3053 5621 518 29434 614 3853 0102 2010‐2012 Arrecife (Lanzarote) 8423 3482 3173 5835 522 29599 684 4210 0104 2008‐2012
West Africa coast Ifni (Morocco) 9138 3847 4078 7655 353 27855 437 2901 0060 1949 C Bojador (W Sah) 6155 1865 3340 3824 398 28355 302 1575 0070 1948 Dakhla (W Sah) 6855 1130 1981 3347 374 27909 769 3513 0130 1949 Nouakchott (Maur) 4271 2898 1737 3000 425 ‐ 628 1504 0178 2007
The surge or residual component is small in this area (Figure 8 left) with larger standard deviation
(between 6‐7 cm) at the Gulf of Cadiz (higher latitudes more prompt to suffer the effect of storms) and
lower values at the Canary Islands stations (between 3‐5 cm) The small magnitude of the surge component
is also related to the narrow shelf especially at the Canary Islands We lack information concerning this
component of sea level along the coast of Africa where it is expected to be larger than in the Canary
Islands due to the broader continental shelf and the southern part of the CCLME Bonanza and Tarifa in
the Gulf of Cadiz are the stations with larger and lower amplitude of the tide respectively due to the
variability of M2 and S2 close to the Strait of Gibraltar as can be seen also in Figure 369 from COMAPI
model Maximum tidal ranges are around 15 m at Tarifa 35 m at Bonanza 25 m at La Palma and 32 m at
Lanzarote The relative importance of meteorological sea level at each station obtained as
Res_StdvTide_Stdv (Table enclosed in Figure 368) varies between the 184 of the tide at Tarifa due to
its small tide amplitude and the 5 at Arrecife
In the Canary Islands there is a longitudinal variation of the tide amplitude becoming larger for the four
main constituents in Table 366 as we move eastwards and approach the continental slope (African coast)
this can also be observed from the spatial variation of their amplitude in Figures 369 and 3610 for the
whole region This longitudinal variation is most evident in fact for the diurnal constituents (K1 and O1)
IOC TECHNICAL SERIES No 115 pp 115‐131 URI httphdlhandlenet18349182 2015
129
Figure 369 Spatial variation of amplitude and phase of M2 S2 and M4 harmonic constituents from the
COMAPI tidal atlas in the area of interest (resolution 1rsquotimes1rsquo)
M2
Amplitude (m)
M2
Phase lag (deg)
S2
Phase lag (deg)
S2
Amplitude (m)
M4
Amplitude (m)
M4
Phase lag (deg)
Goacutemez M Peacuterez‐Goacutemez B De Alfonso M Peacuterez S and Ruiz M I Waves and tides in the CCLME
130
In these figures it is also evident the significant decrease of the tide as we approach the Strait of Gibraltar
with respect to the surrounding Atlantic waters The phase lag of the main semidiurnal constituents
however presents a latitudinal variation (Figure 369 right) due to the propagation of the tidal waves from
South to North as a Kelvin wave (with larger amplitude close to the continental shelf)
The higher frequency tidal constituents (such as M4 and M6) are usually related to shallow waters non‐
linear effects This is why they are not important in the Canary Islands either (amplitudes less than 1 cm)
and their magnitude becomes significant at the Gulf of Cadiz (up to 5 cm of M4 amplitude in Bonanza and
47 cm in Tarifa) It should be taken into account that Bonanza station is at the mouth of the Guadalquivir
river so shallow water effects are even more important here For the stations along the west coast of
Africa provided by IHM the amplitude of M4 reaches also relatively higher values (3‐35 cm) the quality of
these tidal constants is not clear but the spatial variation observed from COMAPI tidal atlas reveals also a
coherent increase of the amplitude of this harmonic towards the shelf (Figure 369 bottom)
For all the mentioned constituents an increase of the amplitude of the tide is observed at the Western
Sahara coast north of Dakhla (around 245degN) most important for S2 and K1 Larger tidal amplitudes in the
region according to Figures 369 and 3610 are found along the Morocco coast This is not totally
coherent however with results from tide gauge observations in Table 366 which reflect as already
mentioned the larger tidal amplitudes at Bonanza and Caacutediz
Evaluation of the trends of the main harmonic constants in Las Palmas and Tenerife stations (not shown
see Peacuterez‐Goacutemez 2014 for details) do not reveal an increase on the tidal amplitude since 1992 Although
the time series is short this in principle does not confirm the increase of tidal amplitudes observed in other
regions of the world (Ray 2006 2009 Woodworth 2010) On the contrary only M2 presents a significant
negative trend at Las Palmas (Peacuterez‐Goacutemez 2014)
Figure 3610 Spatial variation of the amplitude of the main diurnal constituents (O1 and K1) from the
COMAPI tidal atlas in the area of interest (resolution 1rsquotimes1rsquo)
O1
Amplitude (m)
K1
Amplitude (m)
IOC TECHNICAL SERIES No 115 pp 115‐131 URI httphdlhandlenet18349182 2015
131
365 CONCLUSIONS AND RECOMMENDATIONS
Waves
Several wave climates exist in the area of interest The Strait of Gibraltar Gulf of Cadiz Moroccan Coast
and Canary Islands wave climates are well described by PdE buoys and models Golfo de Caacutediz buoy (Figure
365) and model points number 1 2 and 3 (Figure 367) represent open deep water conditions while the
other model points and buoys represent local conditions affected by the coastline South of 20deg
unfortunately there is no source of information on waves available
The most common significant wave height is between 1 m and 3 m being higher at northern locations and
decreasing as moving southwards In regard with the wave direction the Gulf of Cadiz is dominated by
waves coming from the west and the main directions turn first to the north and finally to the north‐east as
moving southwards to the Canary Islands
The highest extreme storms appear during the winter season This is valid not only for the significant wave
height but for the peak period too The climate is more severe in the north than in the south and the
extreme events come from the North West The extreme events are lowest at the locations close to the
coast because they are protected by it
Tides
With respect to the tide its variability has been reviewed based on the available tidal constants from tide
gauges in the region and the regional tidal atlas based on COMAPI model The type of tide is mainly
semidiurnal for the whole area with tidal ranges between 15 m and 35 m and with local variations
basically coherent between observations and the model The meteorological component of sea level is
relatively small with respect to the tide although we lack information from the African coast
The analysis has been made only for the area north of 225degN covered by COMAPI model In order to
complete the study the domain of this model should be extended to cover the whole region including
Senegal and Cape Verde There is also a significant lack of tide gauge observations in most of the countries
what would be crucial for detailed information of local tide conditions in the region
Acknowledgements
We would like to thank Mr Angora Aman (Laboratory of Atmospheric Physics and Fluid Mechanics Cote
drsquoIvoire) and Mr Salvador Moreno (IHM) for providing tidal constants information of several stations in the
African coast and Dr Florent Lyard (LEGOS) for providing the output of the new high resolution tidal atlas
based on the COMAPI model
Goacutemez M Peacuterez‐Goacutemez B De Alfonso M Peacuterez S and Ruiz M I Waves and tides in the CCLME
BIBLIOGRAPHY
Alfonso M Lopez J D Alvarez E and Ruiz M I 2005 Real time buoy data quality control and exploitation The Fifth COPRI International Conference on ocean Wave Measurement and Analysis (WAVES) Coasts Oceans Ports and Rivers Institute American Society of Civil Engineers Madrid
Aacutelvarez‐Fanjul E Peacuterez‐Goacutemez B and Rodriacuteguez I 2001 Nivmar a storm surge forecasting system for Spanish waters Scientia Marina Vol 65 pp 203‐212
Aacutelvarez‐Fanjul E Alfonso M Ruiz M I Lopez J D and Rodriguez I 2002 Real Time Monitoring of Spanish coastal waters The Deep Water Network Proceedings of the Third International Conference on EuroGOOS Athens Greece
Cancet M Lux M Peacutenard C Lyard F Birol F Lemouroux J Bourgogne S and Bronner E 2010 COMAPI New regional tide atlases and high frequency dynamical atmospheric correction Ocean Surface Topography Science Team meeting Lisbon Portugal 2010
Foreman F G G 1977 Manual for tidal heights analysis and predictions Pacific Marine Science Report 77‐10 Institute of Ocean Sciences Patricia Bay Sidney BC 58 pp (2004 revision)
Goacutemez‐Lahoz M and Carretero‐Albiach J C 2005 Wave Forecasting at the Spanish Coasts Journal of Atmospheric and Ocean Science Vol 10 (4) pp 389‐405
Peacuterez‐Goacutemez B 2014 Design and implementation of an operational sea level monitoring and forecasting system for the Spanish coast PhD Thesis Cantabria University Santander Spain 242 pp
Peacuterez‐Goacutemez B Aacutelvarez‐Fanjul E Peacuterez S de Alfonso M and Vela J 2013 Use of tide gauge data in operational oceanography and sea level hazard warning systems Journal of Operational Oceanography Vol 6 (2) pp 1‐18 doi 1010801755876X201311020147
Peacuterez‐Goacutemez B Payo A Loacutepez D Woodworth P L and Aacutelvarez‐Fanjul E 2014 Overlapping sea level time series measured using different technologies an example from the REDMAR Spanish network Natural Hazards and Earth System Science Vol 14 (3) pp 589‐610 doi105194nhess‐14‐589‐2014
Pugh D T 1987 Tides Surges and Mean Sea‐Level John Wiley amp Sons Ltd 472 pp
Ray R 2006 Secular changes of the M2 tide in the Gulf of Maine Continental Shelf Research Vol 26 (3) pp 422‐427
Ray R 2009 Secular changes in the solar semidiurnal tide of the western North Atlantic Ocean Geophysical Research Letters Vol 36 L19601
Tolman H L 1991 A third‐generation model for wind waves on slowly varying unsteady and inhomogeneous depths and currents Journal of Physical Oceanography Vol 21 pp 782‐797
WAMDI Group et al 1988 The WAM model a third‐generation ocean wave prediction model Journal of Physical Oceanography Vol 18 pp 1775‐1810
Woodworth P L 2010 A survey of recent changes in the main components of the ocean tide Continental Shelf Research Vol 30 (5) pp 1680‐1691
- IOCTS115-PRESENTATION 36 OK dots - revised -h
- IOCTS115-ARTICLE 36 - h
- IOCTS115-BIBLIOGRAPHY 36 OK DOIs - h
-

IOC TECHNICAL SERIES No 115 pp 115‐131 URI httphdlhandlenet18349182 2015
115
WAVES AND TIDES IN THE CANARY CURRENT LARGE MARINE
ECOSYSTEM
Marta GOacuteMEZ Begontildea PEacuteREZ‐GOacuteMEZ Marta DE ALFONSO Susana PEacuteREZ and Mordf Isabel RUIZ
Puertos del Estado Ministerio de Fomento Spain
361 INTRODUCTION
In recent decades and in parallel to the increase in the computational capabilities and improvements in
telecommunications a remarkable progress in the development of equipment for marine environment
monitoring has been carried out Many countries are implementing permanent measurement networks as
well as climate forecast and data management systems The information generated by these tools is
distributed to the whole society
In this context Puertos del Estado (hereinafter PdE) has developed permanent networks and forecast
models of marine physical variables giving coverage to all of the Spanish national territory and to the
routes of navigation starting or ending at Spanish ports
This article describes waves and tides regime and variability in the Canary Current Large Marine Ecosystem
region (CCLME) The study is based on those sources of data with adequate and relevant information
(products) that allow a reasonable description of these two oceanographic variables being PdE equipment
and numerical models the main source of information A review of existing buoys tide gauges and
numerical models available in the region was performed by contacting different institutions from the
affected countries as well as international organizations
362 WAVES DATA AND METHODOLOGY
3621 In situ data
In the CCLME region wave data from PdE wave buoys are available Figure 361 shows the position of the
existing buoys in the area of interest All of them belong to PdE networks Table 361 shows the location
mooring depth and the data availability for these stations
The three SeaWatch buoys belong to PdE Deep Water network (Aacutelvarez‐Fanjul et al 2002) They are
multipurpose buoys providing parameters of meteorology (wind speed and direction air temperature and
pressure) directional waves since 2003 and subsurface oceanography (currents sea temperature and
salinity) A Directional Waverider wave sensor is installed since 2003 Before this date the wave sensors
were scalar providing only height and period parameters
The Triaxys buoy is part of PdE coastal buoy network Due to its mooring location data provided by this
buoy are only representative of the closest surrounding area
The wave sensor takes samples during approximately 30 minutes every hour Those samples correspond to
vertical (heave) and horizontal displacements respect to the North and East axis
Goacutemez M Peacuterez‐Goacutemez B De Alfonso M Peacuterez S and Ruiz M I Waves and tides in the CCLME
116
Figure 361 Area of interest and sensors location The dark numbers correspond to the buoys listed in
Table 361 and the yellow numbers correspond to the tide gauges listed in Tables 362 and 363
98
7
11 12 10
13
14 15
5 6 1
2
3
4 17
18
19
20
16
IOC TECHNICAL SERIES No 115 pp 115‐131 URI httphdlhandlenet18349182 2015
117
Figure 362 Left picture Seawatch buoy from the Deep Water Network Right picture Triaxys buoy from
the Coastal Network
Table 361 Description of the PdE wave measurement stations (number of station corresponds to the
number shown on the map in Figure 361)
Station Latitude Longitude Mooring Depth Buoy Type Data availability
1 Golfo de Caacutediz 3648degN 0696degW 450 meters SeaWatch Since 1996
2 Tarifa 3600degN 0559degW 33 meters Triaxys Since 2008
3 Tenerife 2799degN 1658degW 710 meters SeaWatch Since 1997
4 Gran Canaria 2820degN 1580degW 780 meters SeaWatch Since 1996
Buoys have a processor on‐board that performs a spectral analysis using the three displacements time‐
series As a result the main spectral parameters are obtained and sent to PdE in real time These
parameters are significant wave height mean wave period peak wave period mean wave direction and
mean wave direction at the spectral peak (Alfonso et al 2005)
When buoy maintenance is performed raw displacement series are downloaded from the on‐board data
logger and then reprocessed at PdE applying an exhaustive quality control procedure and increasing the
number of computed parameters (from spectral and zero up crossing analysis)
3622 Wave models
PdE has carried out a wave hindcast for the Atlantic Ocean based on the numerical models WAM (WAMDI
Group 1988) and WAVEWATCH III (Tolman 1991) The boundaries of the area covered by the models
shown in Figure 363 are 67degNndash20degN 59degWndash8degE with a variable resolution that goes from 1deg in the open
waters to 5 in the Gulf of Cadiz and the Canary Islands
This hindcast provides information of all the wave parameters since 1958 to 2005 and it is daily updated
with the information provided by the analyzed time series of PdE wave forecast system (Goacutemez‐Lahoz and
Carretero‐Albiach 2005) The points shown in Table 363 have been selected to characterize the waves in
the area
Goacutemez M Peacuterez‐Goacutemez B De Alfonso M Peacuterez S and Ruiz M I Waves and tides in the CCLME
118
Figure 363 The Atlantic grid on the left on the right hand above the Gulf of Cadiz grid and on the right
hand bellow the Canary Islands grid
Table 362 Wave model selected points (number of station corresponds to the number shown on the map
in Figure 367)
Point Latitude Longitude
1 1040042 3550degN 1000degW
2 1030030 3250degN 1250degW
3 4032028 2958degN 1583degW
4 4010008 2792degN 1767degW
5 4030010 2808degN 1600degW
6 4044008 2792degN 1483degW
7 4066012 2825degN 1300degW
8 1036016 2900degN 1100degW
9 1040024 3100degN 1000degW
10 1044032 3300degN 0900degW
11 1050036 3400degN 0750degW
12 5040000 3525degN 0617degW
13 6048012 3595degN 0570degW
IOC TECHNICAL SERIES No 115 pp 115‐131 URI httphdlhandlenet18349182 2015
119
The wave hindcast (1958‐2005) was forced with ERA40 and ERA‐Interim re‐analysis The Wave Forecast
System forcing (2006 to present day) is provided by HIRLAM model run by the Spanish Meteorological
Agency (AEMET in its Spanish acronym)
Being 20degN the southern limit of PdE application the area of interest of this project is partially covered by
this system As a matter of fact the waves propagating from the south that affect the Canary Islands are
not reproduced in PdE wave data
On the other hand a wave forecast system was developed for the area of interest in the framework of the
Marinemet project that was carried out in collaboration between AEMET and PdE
(httpwwwafrimetorgmarinemet accessed on 15 January 2015) The information provided by this
system has not been used in this publication because although very interesting from the forecast point of
view it is not useful for wave climatic characterization
363 TIDES DATA AND METHODOLOGY
3631 In situ data
Tide gauges constitute the main and more precise source of tidal constants information along the coast
Most of the information concerning tides has been obtained from PdE tide gauges (REDMAR network) at
the Gulf of Caacutediz and the Canary Islands (Figure 361 Table 363) most of them upgraded to radar sensors
(Miros) since 2007 The radar sensors provide sea level measurements and local wind waves at the
harbours (Peacuterez‐Goacutemez et al 2013 Peacuterez‐Goacutemez et al 2014) and consist of an antenna located at the pier
well above the higher high water that provides sea level information related to harbour and national
datums by emitting radar pulses to the water surface (Figure 364 right)
The nominal sea level data sampling and latency nowadays is 1‐min at PdE these data are routinely quality
controlled in near‐real time processed and filtered to hourly values before computing the harmonic
analysis each calendar year by means of the Foreman analysis and prediction package (Foreman 1977)
This allows the study of the annual variability and trends of these harmonic constants (Woodworth 2010
Peacuterez‐Goacutemez 2014) The residual component (mainly meteorological in origin) is obtained after extracting
the astronomical tide to the hourly sea level observations
Additional information on tidal constants was required to other countries as well as other institutions such
as Global Sea Level Observing System (GLOSS) Harmonic constants from Nouakchott (Mauritania) were
provided by the Laboratory of Atmospheric Physics and Fluid Mechanics Cote drsquoIvoire The Spanish
Hydrographic Institute (hereafter IHM in its Spanish acronym) on the other hand provided harmonic
constants from Taacutenger and Ifni (Morocco) and Cape Bojador and Dakhla (Western Sahara) The operation
of these stations has been discontinuous in the past and the access to relevant products is not always
possible The Cape Bojador Ifni and Dakhla harmonic constants were obtained in the 40rsquos by IHM so their
value should be carefully considered here Finally tidal constants were also provided by the Instituto
Espantildeol de Oceanografiacutea (IEO) for Cadiz tide gauge (Gulf of Cadiz Spain)
Goacutemez M Peacuterez‐Goacutemez B De Alfonso M Peacuterez S and Ruiz M I Waves and tides in the CCLME
120
Table 363 Description of sea level (tide) measurement stations (number of station corresponds to the
number on the map in Figure 361)
Station Latitude Longitude Tide Gauge Type Data availability
5 Bonanza 36800degN 06333degW Miros (radar) Since 1992
6 Tarifa 36006degN 05630degW Miros (radar) Since 2009
7 El Hierro 27780degN 17900degW Miros (radar) Since 2004
8 La Gomera 28088degN 17108degW Miros (radar) Since 2006
9 La Palma 28678degN 17768degW Miros (radar) Since 2006
10 Tenerife 28483degN 16233degW Miros (radar) Since 1992
11 Granadilla 28090degN 16490degW Aanderaa (pressure) 2004‐2012
12 Las Palmas 28150degN 15330degW Miros (radar) Since 1992
13 Arinaga 27850degN 15400degW Aanderaa (pressure) 2004‐2012
14 Arrecife 28900degN 13530degW Miros (radar) Since 2008
15 Fuerteventura 28500degN 13850degW Miros (radar) Since 2004
16 Taacutenger 35783degN 05800degW May‐June 2005
17 Ifni 29550degN 10067degW March‐April 1949
18 C Bojador 26117degN 14500degW Sept‐Oct 1948
19 Dahkla 23633degN 16000degW Nov 1948‐Jan1949
20 Nouakchott 17984degN 16033degW 2007
3632 Tidal models
Another important sources of information are global and regional tidal models which allow a better spatial
characterization of the tide in open waters Their accuracy along the coast will depend on the spatial
resolution and the quality of the bathymetry A new regional tide atlas provided by Noveltis Legos and
CNES and based on the COMAPI tide model was used (Cancet et al 2010) with a resolution of 1rsquox1rsquo
Unfortunately this high resolution is up to now available only between 225degN and 37degN ie we lack
information south of Mauritania (Figure 364 left)
PdE provides operational sea level forecasts for a domain covering the whole Spanish coast the
Mediterranean and the Canary Islands up to 25degN by means of the Nivmar system This system was
established in 1998 based on the combination of the surge or meteorological forecast obtained with the
HAMSOM model and the tide forecast obtained at the harbours from the REDMAR network (Aacutelvarez‐Fanjul
et al 2001) Nowadays the system includes the tide forecast at the coast by means of the mentioned high
resolution regional tidal atlas for coastal and shelf seas developed by Noveltis Legos and CNES (COMAPI)
IOC TECHNICAL SERIES No 115 pp 115‐131 URI httphdlhandlenet18349182 2015
121
Figure 364 Left panel domain and bathymetry of the COMAPI tidal atlas extracted from the regional
product of the North‐East Atlantic for the Canary Current region (up to 225degN only) one of the sources of
data employed for tides description At right El Hierro (top) and La Palma (bottom) radar tide gauges from
the Spanish REDMAR network
The domain of the COMAPI tidal atlas for the North East Atlantic (NEA) is a little bit larger at this area than
the sea level hindcasts available at PdE (up to 225degN) so the analysis of the spatial variation of the main
components of the tide is based on this tidal atlas Its resolution (1rsquox1rsquo) improves significantly in relation to
the ones from previous global tidal models such as FES2004 GOT47 and TPX072 and to the Nivmar
system itself (10rsquox15rsquo) The COMAPI tidal atlas is based on new regional implementations of a
hydrodynamic finite element tide model (T‐UGOm) combined with altimetry and tide gauge data
assimilation it includes better information of the classical tidal waves near the coast and extension to some
of the non‐linear constituents A set of 37 harmonic constituents is available at each grid point
364 RESULTS AND DISCUSSION
3641 Mean and extreme wave climate
Wave roses of the 4 buoys are presented in Figures 365 and 366 while wave roses at 13 model points are
shown in Figure 367 These wave roses represent the percentage of data in each direction for different
significant wave height (Hs) intervals that are indicated by different blue tones
In the case of the buoys the Hs intervals are taken from 00 m to 25 m with a 05 m width with the last
color indicating waves over 25 m and in the case of the model points the intervals go from 02 m up to 5
m with an interval width of 1 m The last color indicates waves of more than 5 m
Goacutemez M Peacuterez‐Goacutemez B De Alfonso M Peacuterez S and Ruiz M I Waves and tides in the CCLME
122
Regarding the directional information sixteen directions have been considered that indicate the waves
incoming direction
These wave roses give a description of the mean wave climate in each area as they indicate the main
direction from which the waves come and the distribution of the significant wave height
It is important to distinguish between the wave roses that represent open deep water conditions from
those at coastal points that can be very much affected by the coast line This remark is especially
important at the Canary Islands where in general each location is affected by different islands
It can be said that the wave rose of Golfo de Caacutediz buoy (Figure 365) and of model points number 1 2 and
3 (Figure 367) represent open deep water conditions while the others represent coastal conditions
At open and deep water locations the most common wave height is between 1 m and 3 m being higher at
northern locations and decreasing as moving southwards
In regard with the wave direction the Gulf of Cadiz is dominated by waves coming from the west and the
main directions turn first to the north and finally to the north‐east as we move southwards being the
northeast the main direction at model point number 3 (Figure 367) at the north of Canary Islands
As it has been said the wave conditions at coastal points are very much affected by the coast line and some
of them only represent very local wave climate
This is the case of the Tarifa buoy (Figure 365) in which there is no presence of waves coming from the
west while in model point number 13 (Figure 367) that is very close to the buoy the west is the main
direction It is well known that the wave climate at the Strait of Gibraltar has two main components from
the west and the east respectively as it is shown in the wave rose of point number 13 but the buoy is
protected from this direction by the coast line
Model points from 8 to 12 (Figure 367) represent the wave climate along the Moroccan coast It can be
seen that the main direction is the north‐west being more northern or western depending on the coast
orientation The most frequent significant wave heights are between 1 m and 3 m being a little bit lower at
points 11 and 12 because they are a little bit protected by San Vicente Cape
Additionally at the Canary Islands the wave climate is represented by the wave roses of Gran Canaria and
Tenerife buoys (Figure 366) and model points from 4 to 7 (Figure 367) In general it can be seen that the
main direction is north‐northeast but analysing each single case it depends very much on the point
location related with the different islands The most common significant wave height is between 1 m and 2
m that is lower than in the locations at open deep water or at the Moroccan coast because of the
protection provided by the Islands
IOC TECHNICAL SERIES No 115 pp 115‐131 URI httphdlhandlenet18349182 2015
123
Figure 365 Wave roses from Golfo de Caacutediz (left) and Tarifa (right) buoys (yellow dots)
Figure 366 Wave roses from Tenerife (left) and Gran Canaria (right) buoys (yellow dots)
Goacutemez M Peacuterez‐Goacutemez B De Alfonso M Peacuterez S and Ruiz M I Waves and tides in the CCLME
124
1 2
3 4
5 6 7
8 9 10
11 12 13
Figure 367 Wave roses of 13 model points representing different locations of the area of interest
1
2
3
4 5 6 7
8
9
10
11
12
13
IOC TECHNICAL SERIES No 115 pp 115‐131 URI httphdlhandlenet18349182 2015
125
The most extreme significant wave height ever registered by the 4 buoys and obtained at the 13 model
points per season are shown in Tables 364 and 365
Unfortunately some of the buoys have not always been directional buoys and the extreme events have
occurred in dates in which they were not so there is not information about the direction In these cases
directional information from the nearest wave model point was used to draw conclusions
It can be seen that as expected the highest extreme storms appear during the winter season Autumn and
spring seasons are very similar while the lowest extreme storms appear in summer This is valid not only for
the significant wave height but also for the peak period
The Golfo de Caacutediz buoy is an exception because the highest significant wave height was registered in
spring However it can be considered a rare event because taking a more general look of this buoy data
most of the highest storms appear during the winter season as in the other locations
There is more difference between one location and the others in winter being the climate more severe in
the North than in the South In summer the extreme wave climate is very similar at all the locations
Regarding the directions it can be seen that almost all the extreme events come from the north‐west
being slightly more western in winter than in summer
All the seasonal differences are more evident at the northern locations than at the southern ones
Table 364 The highest significant wave height (Hs) ever registered by the 4 buoys per season (W winter
Sp spring S summer A autumn) The corresponding peak period (Tp) direction and date are also shown
Number of station corresponds to the number on the map in Figure 361
Buoy Season Max Hs (m)
Tp(s)
Direction (0‐N90‐E)
Date(GMT)
Buoy Season Max Hs(m)
Tp(s)
Direction (0‐N90‐E)
Date(GMT)
1 Golfo de Caacutediz
W 62 107 ‐‐ 19971218 02h 3Tenerife W 48 94 ‐‐ 19990108 03h
Sp 66 150 ‐‐ 20030413 23h Sp 36 91 230 20130303 22h
S 35 85 ‐‐ 19970605 12h S 27 6478
90 107
20090725 02h20130807 01h
A 36 85 ‐‐ 19990919 13h A 32 94 ‐‐ 19981009 14h
2 Tarifa W 36 105 107 20100128 01h 4 Gran Canaria
W 57 135 ‐‐ 19990112 09h
Sp 33 90 107 20110405 22h Sp 52 98 ‐‐ 20010313 21h
S 18 71 83 20130625 07h S 38 85 ‐‐ 20000610 13h
A 29 89 105 20121108 10h A 55 166 337 2014 1129 06h
The extreme events have lower significant heights at the buoy locations than at the model points because
as it has been said in the previous section the sensors are placed relatively close to the coast so they are
protected by it On the other hand the locations in which the extreme storms are the highest are in the
model points 1 2 9 10 and 11 that as it can be seen in Figure 367 are the less protected by the coast
Goacutemez M Peacuterez‐Goacutemez B De Alfonso M Peacuterez S and Ruiz M I Waves and tides in the CCLME
126
Table 365 The highest significant wave height (Hs) ever got at each of the 13 the model points per season
(W winter Sp spring S summer A autumn) The corresponding peak period (Tp) direction and date are
also shown (number of station corresponds to the number on the map in Figure 367)
Point Season Max Hs (m)
Tp (s)
Direction (0‐N90‐E)
Date(GMT)
Point Season Max Hs(m)
Tp(s)
Direction (0‐N90‐E)
Date(GMT)
1 W 102 175 307 19730117 12h 8 W 88 183 322 19820112 15h
Sp 78 123 77 19550331 21h Sp 64 178 310 19910307 12h
S 43 93 357 19790816 00h S 47 108 357 19660611 00h
A 72 161 296 19821108 03h A 65 181 332 19621107 06h
2 W 86 180 288 19660221 03h 9 W 104 183 309 19820112 12h
Sp 67 153 299 19890409 09h Sp 73 179 301 19910307 06h
S 41 148 356 20080819 15h S 47 91 358 20120612 20h
A 62 151 308 20141129 05h A 75 181 323 19621107 03h
3 W 66 134 308 19891229 00h 10 W 96 183 290 19660221 00h
Sp 58 138 285 20130305 12h Sp 74 178 297 19910307 06h
S 33 90 38 20120712 10h S 37 134 322 19610601 00h
A 70 136 314 20141129 00h A 80 117 268 19891119 18h
4 W 58 180 314 19660221 06h 11 W 97 182 283 19660221 06h
Sp 54 135 290 20130305 04h Sp 73 177 290 19910307 09h
S 41 83 29 20120715 05h S 37 132 309 19610601 00h
A 60 142 321 20141129 06h A 83 159 293 19841105 06h
5 W 49 110 29 20140124 10h 12 W 81 172 293 19730117 21h
Sp 46 85 230 20130303 23h Sp 50 145 275 19910307 15h
S 33 88 28 20120612 02h S 26 143 296 19850601 09h
A 46 145 343 20141129 10h A 48 115 258 19821107 15h
6 W 63 122 319 19720223 06h 13 W 62 109 272 20130119 18h
Sp 45 189 353 20140304 11h Sp 48 112 257 20130306 08h
S 33 89 17 20120712 10h S 25 65 83 20130625 11h
A 63 146 326 20141129 10h A 40 91 81 20081011 00h
7 W 56 118 10 19940117 18h
Sp 52 112 22 19940403 09h
S 37 95 10 20070622 21h
A 46 149 319 20141129 16h
3642 Tides regime
The relative importance of the tide and the meteorological component was estimated by computing the
standard deviation of the tidal elevations and the meteorological component for the REDMAR stations
during the year 2012 (Figure 368 left) Examples of the probability density functions or histograms of both
components are also displayed in Figure 368 (right)
IOC TECHNICAL SERIES No 115 pp 115‐131 URI httphdlhandlenet18349182 2015
127
Figure 368 Left Standard deviation (Stdv) of the tide and the meteorological or residual component for
REDMAR tide gauges in the region (year 2012) Right From the top to the bottom tide and surge
histograms for Tarifa (Gulf of Cadiz) Arrecife (Lanzarote Eastern Canary Islands) and La Palma (Western
Canary Islands) (hourly data year 2012)
The amplitudes and phases of the main semidiurnal (M2 S2) and diurnal (O1 K1) constituents were compiled
in Table 366 not only for the REDMAR stations but also for the ones provided by other organizations The
period of data used for the computation is included as well as the Form Factor F obtained from the ratio of
the amplitudes of these main constituents
)()(
)()(
22
11
SAMA
KAOAF
The value of F is usually employed for tides classification (Pugh 1987) diurnal semidiurnal or mixed
Finally the spatial variation of the main tidal constituents is shown from COMAPI model at Figures 369
and 3610
The Form Factor values in Table 366 well below 25 for all the stations indicate a clear dominant
semidiurnal tide (two highs and two lows per day) in the Canary Current region from the Gulf of Cadiz up to
Mauritania This reflects in the two peaks observed in the tide histograms of Figure 368 (right) the most
probable levels being close to the mean high waters and mean low waters respectively This is coherent on
the other hand with the larger amplitudes of the semidiurnal constituents (M2 and S2) in Table 366 with
respect to the diurnal ones at all the stations we could compile
Station Tide Stdv (cm) Res Stdv (cm)
Bonanza 7048 648
Tarifa 3346 615
Tenerife 5595 388
Granadilla (Tenerife) 4973 944
La Palma 5199 391
La Gomera 4681 370
El Hierro 4747 400
Las Palmas (G C) 5925 419
Arinaga (G C) 5389 485
Fuerteventura 6406 344
Arrecife (Lanz) 6648 351
Goacutemez M Peacuterez‐Goacutemez B De Alfonso M Peacuterez S and Ruiz M I Waves and tides in the CCLME
128
Table 366 Amplitude and phase of the main semidiurnal and diurnal tidal constituents form factor (F)
and period of data for its computation REDMAR stations are shown in bold Harmonic constants provided
by other institutions for those stations shaded in grey
Station M2 S2 O1 K1 F Years Amp
(cm) Phase Lag
(o) Amp(cm)
Phase Lag (o)
Amp (cm)
Phase Lag (o)
Amp(cm)
Phase Lag (o)
Gulf of Cadiz
Bonanza 8987 6374 3089 9033 612 32258 615 6030 0102 2010‐2012 Caacutediz 9967 6513 3593 9282 660 30763 676 5128 0081 2013 Tarifa 4173 4163 1566 6888 048 12849 263 1295 0054 2010‐2012 Taacutenger (Morocco) 6832 6536 1792 7111 446 33613 658 6018 0128 2005
Canary Islands
Tenerife 7063 2892 2718 5261 469 29284 625 4032 0112 2010‐2012 Granadilla (Tenerife) 6130 2596 2463 4731 474 29226 595 4072 0124 2003‐2011 La Palma 6516 3030 2551 5296 458 29365 578 4164 0114 2007‐2012 La Gomera 5794 2358 2335 4592 434 29005 558 3297 0122 2007‐2012 El Hierro 5946 2123 2426 4376 430 29067 613 3233 0125 2010‐2012 Las Palmas (G Canaria) 7527 2838 2897 5317 488 29345 619 4005 0106 2008‐2012 Arinaga (Gran Canaria) 6808 2818 2664 5060 476 29233 604 3724 0114 2003‐2011 Fuerteventura 8089 3233 3053 5621 518 29434 614 3853 0102 2010‐2012 Arrecife (Lanzarote) 8423 3482 3173 5835 522 29599 684 4210 0104 2008‐2012
West Africa coast Ifni (Morocco) 9138 3847 4078 7655 353 27855 437 2901 0060 1949 C Bojador (W Sah) 6155 1865 3340 3824 398 28355 302 1575 0070 1948 Dakhla (W Sah) 6855 1130 1981 3347 374 27909 769 3513 0130 1949 Nouakchott (Maur) 4271 2898 1737 3000 425 ‐ 628 1504 0178 2007
The surge or residual component is small in this area (Figure 8 left) with larger standard deviation
(between 6‐7 cm) at the Gulf of Cadiz (higher latitudes more prompt to suffer the effect of storms) and
lower values at the Canary Islands stations (between 3‐5 cm) The small magnitude of the surge component
is also related to the narrow shelf especially at the Canary Islands We lack information concerning this
component of sea level along the coast of Africa where it is expected to be larger than in the Canary
Islands due to the broader continental shelf and the southern part of the CCLME Bonanza and Tarifa in
the Gulf of Cadiz are the stations with larger and lower amplitude of the tide respectively due to the
variability of M2 and S2 close to the Strait of Gibraltar as can be seen also in Figure 369 from COMAPI
model Maximum tidal ranges are around 15 m at Tarifa 35 m at Bonanza 25 m at La Palma and 32 m at
Lanzarote The relative importance of meteorological sea level at each station obtained as
Res_StdvTide_Stdv (Table enclosed in Figure 368) varies between the 184 of the tide at Tarifa due to
its small tide amplitude and the 5 at Arrecife
In the Canary Islands there is a longitudinal variation of the tide amplitude becoming larger for the four
main constituents in Table 366 as we move eastwards and approach the continental slope (African coast)
this can also be observed from the spatial variation of their amplitude in Figures 369 and 3610 for the
whole region This longitudinal variation is most evident in fact for the diurnal constituents (K1 and O1)
IOC TECHNICAL SERIES No 115 pp 115‐131 URI httphdlhandlenet18349182 2015
129
Figure 369 Spatial variation of amplitude and phase of M2 S2 and M4 harmonic constituents from the
COMAPI tidal atlas in the area of interest (resolution 1rsquotimes1rsquo)
M2
Amplitude (m)
M2
Phase lag (deg)
S2
Phase lag (deg)
S2
Amplitude (m)
M4
Amplitude (m)
M4
Phase lag (deg)
Goacutemez M Peacuterez‐Goacutemez B De Alfonso M Peacuterez S and Ruiz M I Waves and tides in the CCLME
130
In these figures it is also evident the significant decrease of the tide as we approach the Strait of Gibraltar
with respect to the surrounding Atlantic waters The phase lag of the main semidiurnal constituents
however presents a latitudinal variation (Figure 369 right) due to the propagation of the tidal waves from
South to North as a Kelvin wave (with larger amplitude close to the continental shelf)
The higher frequency tidal constituents (such as M4 and M6) are usually related to shallow waters non‐
linear effects This is why they are not important in the Canary Islands either (amplitudes less than 1 cm)
and their magnitude becomes significant at the Gulf of Cadiz (up to 5 cm of M4 amplitude in Bonanza and
47 cm in Tarifa) It should be taken into account that Bonanza station is at the mouth of the Guadalquivir
river so shallow water effects are even more important here For the stations along the west coast of
Africa provided by IHM the amplitude of M4 reaches also relatively higher values (3‐35 cm) the quality of
these tidal constants is not clear but the spatial variation observed from COMAPI tidal atlas reveals also a
coherent increase of the amplitude of this harmonic towards the shelf (Figure 369 bottom)
For all the mentioned constituents an increase of the amplitude of the tide is observed at the Western
Sahara coast north of Dakhla (around 245degN) most important for S2 and K1 Larger tidal amplitudes in the
region according to Figures 369 and 3610 are found along the Morocco coast This is not totally
coherent however with results from tide gauge observations in Table 366 which reflect as already
mentioned the larger tidal amplitudes at Bonanza and Caacutediz
Evaluation of the trends of the main harmonic constants in Las Palmas and Tenerife stations (not shown
see Peacuterez‐Goacutemez 2014 for details) do not reveal an increase on the tidal amplitude since 1992 Although
the time series is short this in principle does not confirm the increase of tidal amplitudes observed in other
regions of the world (Ray 2006 2009 Woodworth 2010) On the contrary only M2 presents a significant
negative trend at Las Palmas (Peacuterez‐Goacutemez 2014)
Figure 3610 Spatial variation of the amplitude of the main diurnal constituents (O1 and K1) from the
COMAPI tidal atlas in the area of interest (resolution 1rsquotimes1rsquo)
O1
Amplitude (m)
K1
Amplitude (m)
IOC TECHNICAL SERIES No 115 pp 115‐131 URI httphdlhandlenet18349182 2015
131
365 CONCLUSIONS AND RECOMMENDATIONS
Waves
Several wave climates exist in the area of interest The Strait of Gibraltar Gulf of Cadiz Moroccan Coast
and Canary Islands wave climates are well described by PdE buoys and models Golfo de Caacutediz buoy (Figure
365) and model points number 1 2 and 3 (Figure 367) represent open deep water conditions while the
other model points and buoys represent local conditions affected by the coastline South of 20deg
unfortunately there is no source of information on waves available
The most common significant wave height is between 1 m and 3 m being higher at northern locations and
decreasing as moving southwards In regard with the wave direction the Gulf of Cadiz is dominated by
waves coming from the west and the main directions turn first to the north and finally to the north‐east as
moving southwards to the Canary Islands
The highest extreme storms appear during the winter season This is valid not only for the significant wave
height but for the peak period too The climate is more severe in the north than in the south and the
extreme events come from the North West The extreme events are lowest at the locations close to the
coast because they are protected by it
Tides
With respect to the tide its variability has been reviewed based on the available tidal constants from tide
gauges in the region and the regional tidal atlas based on COMAPI model The type of tide is mainly
semidiurnal for the whole area with tidal ranges between 15 m and 35 m and with local variations
basically coherent between observations and the model The meteorological component of sea level is
relatively small with respect to the tide although we lack information from the African coast
The analysis has been made only for the area north of 225degN covered by COMAPI model In order to
complete the study the domain of this model should be extended to cover the whole region including
Senegal and Cape Verde There is also a significant lack of tide gauge observations in most of the countries
what would be crucial for detailed information of local tide conditions in the region
Acknowledgements
We would like to thank Mr Angora Aman (Laboratory of Atmospheric Physics and Fluid Mechanics Cote
drsquoIvoire) and Mr Salvador Moreno (IHM) for providing tidal constants information of several stations in the
African coast and Dr Florent Lyard (LEGOS) for providing the output of the new high resolution tidal atlas
based on the COMAPI model
Goacutemez M Peacuterez‐Goacutemez B De Alfonso M Peacuterez S and Ruiz M I Waves and tides in the CCLME
BIBLIOGRAPHY
Alfonso M Lopez J D Alvarez E and Ruiz M I 2005 Real time buoy data quality control and exploitation The Fifth COPRI International Conference on ocean Wave Measurement and Analysis (WAVES) Coasts Oceans Ports and Rivers Institute American Society of Civil Engineers Madrid
Aacutelvarez‐Fanjul E Peacuterez‐Goacutemez B and Rodriacuteguez I 2001 Nivmar a storm surge forecasting system for Spanish waters Scientia Marina Vol 65 pp 203‐212
Aacutelvarez‐Fanjul E Alfonso M Ruiz M I Lopez J D and Rodriguez I 2002 Real Time Monitoring of Spanish coastal waters The Deep Water Network Proceedings of the Third International Conference on EuroGOOS Athens Greece
Cancet M Lux M Peacutenard C Lyard F Birol F Lemouroux J Bourgogne S and Bronner E 2010 COMAPI New regional tide atlases and high frequency dynamical atmospheric correction Ocean Surface Topography Science Team meeting Lisbon Portugal 2010
Foreman F G G 1977 Manual for tidal heights analysis and predictions Pacific Marine Science Report 77‐10 Institute of Ocean Sciences Patricia Bay Sidney BC 58 pp (2004 revision)
Goacutemez‐Lahoz M and Carretero‐Albiach J C 2005 Wave Forecasting at the Spanish Coasts Journal of Atmospheric and Ocean Science Vol 10 (4) pp 389‐405
Peacuterez‐Goacutemez B 2014 Design and implementation of an operational sea level monitoring and forecasting system for the Spanish coast PhD Thesis Cantabria University Santander Spain 242 pp
Peacuterez‐Goacutemez B Aacutelvarez‐Fanjul E Peacuterez S de Alfonso M and Vela J 2013 Use of tide gauge data in operational oceanography and sea level hazard warning systems Journal of Operational Oceanography Vol 6 (2) pp 1‐18 doi 1010801755876X201311020147
Peacuterez‐Goacutemez B Payo A Loacutepez D Woodworth P L and Aacutelvarez‐Fanjul E 2014 Overlapping sea level time series measured using different technologies an example from the REDMAR Spanish network Natural Hazards and Earth System Science Vol 14 (3) pp 589‐610 doi105194nhess‐14‐589‐2014
Pugh D T 1987 Tides Surges and Mean Sea‐Level John Wiley amp Sons Ltd 472 pp
Ray R 2006 Secular changes of the M2 tide in the Gulf of Maine Continental Shelf Research Vol 26 (3) pp 422‐427
Ray R 2009 Secular changes in the solar semidiurnal tide of the western North Atlantic Ocean Geophysical Research Letters Vol 36 L19601
Tolman H L 1991 A third‐generation model for wind waves on slowly varying unsteady and inhomogeneous depths and currents Journal of Physical Oceanography Vol 21 pp 782‐797
WAMDI Group et al 1988 The WAM model a third‐generation ocean wave prediction model Journal of Physical Oceanography Vol 18 pp 1775‐1810
Woodworth P L 2010 A survey of recent changes in the main components of the ocean tide Continental Shelf Research Vol 30 (5) pp 1680‐1691
- IOCTS115-PRESENTATION 36 OK dots - revised -h
- IOCTS115-ARTICLE 36 - h
- IOCTS115-BIBLIOGRAPHY 36 OK DOIs - h
-

Goacutemez M Peacuterez‐Goacutemez B De Alfonso M Peacuterez S and Ruiz M I Waves and tides in the CCLME
116
Figure 361 Area of interest and sensors location The dark numbers correspond to the buoys listed in
Table 361 and the yellow numbers correspond to the tide gauges listed in Tables 362 and 363
98
7
11 12 10
13
14 15
5 6 1
2
3
4 17
18
19
20
16
IOC TECHNICAL SERIES No 115 pp 115‐131 URI httphdlhandlenet18349182 2015
117
Figure 362 Left picture Seawatch buoy from the Deep Water Network Right picture Triaxys buoy from
the Coastal Network
Table 361 Description of the PdE wave measurement stations (number of station corresponds to the
number shown on the map in Figure 361)
Station Latitude Longitude Mooring Depth Buoy Type Data availability
1 Golfo de Caacutediz 3648degN 0696degW 450 meters SeaWatch Since 1996
2 Tarifa 3600degN 0559degW 33 meters Triaxys Since 2008
3 Tenerife 2799degN 1658degW 710 meters SeaWatch Since 1997
4 Gran Canaria 2820degN 1580degW 780 meters SeaWatch Since 1996
Buoys have a processor on‐board that performs a spectral analysis using the three displacements time‐
series As a result the main spectral parameters are obtained and sent to PdE in real time These
parameters are significant wave height mean wave period peak wave period mean wave direction and
mean wave direction at the spectral peak (Alfonso et al 2005)
When buoy maintenance is performed raw displacement series are downloaded from the on‐board data
logger and then reprocessed at PdE applying an exhaustive quality control procedure and increasing the
number of computed parameters (from spectral and zero up crossing analysis)
3622 Wave models
PdE has carried out a wave hindcast for the Atlantic Ocean based on the numerical models WAM (WAMDI
Group 1988) and WAVEWATCH III (Tolman 1991) The boundaries of the area covered by the models
shown in Figure 363 are 67degNndash20degN 59degWndash8degE with a variable resolution that goes from 1deg in the open
waters to 5 in the Gulf of Cadiz and the Canary Islands
This hindcast provides information of all the wave parameters since 1958 to 2005 and it is daily updated
with the information provided by the analyzed time series of PdE wave forecast system (Goacutemez‐Lahoz and
Carretero‐Albiach 2005) The points shown in Table 363 have been selected to characterize the waves in
the area
Goacutemez M Peacuterez‐Goacutemez B De Alfonso M Peacuterez S and Ruiz M I Waves and tides in the CCLME
118
Figure 363 The Atlantic grid on the left on the right hand above the Gulf of Cadiz grid and on the right
hand bellow the Canary Islands grid
Table 362 Wave model selected points (number of station corresponds to the number shown on the map
in Figure 367)
Point Latitude Longitude
1 1040042 3550degN 1000degW
2 1030030 3250degN 1250degW
3 4032028 2958degN 1583degW
4 4010008 2792degN 1767degW
5 4030010 2808degN 1600degW
6 4044008 2792degN 1483degW
7 4066012 2825degN 1300degW
8 1036016 2900degN 1100degW
9 1040024 3100degN 1000degW
10 1044032 3300degN 0900degW
11 1050036 3400degN 0750degW
12 5040000 3525degN 0617degW
13 6048012 3595degN 0570degW
IOC TECHNICAL SERIES No 115 pp 115‐131 URI httphdlhandlenet18349182 2015
119
The wave hindcast (1958‐2005) was forced with ERA40 and ERA‐Interim re‐analysis The Wave Forecast
System forcing (2006 to present day) is provided by HIRLAM model run by the Spanish Meteorological
Agency (AEMET in its Spanish acronym)
Being 20degN the southern limit of PdE application the area of interest of this project is partially covered by
this system As a matter of fact the waves propagating from the south that affect the Canary Islands are
not reproduced in PdE wave data
On the other hand a wave forecast system was developed for the area of interest in the framework of the
Marinemet project that was carried out in collaboration between AEMET and PdE
(httpwwwafrimetorgmarinemet accessed on 15 January 2015) The information provided by this
system has not been used in this publication because although very interesting from the forecast point of
view it is not useful for wave climatic characterization
363 TIDES DATA AND METHODOLOGY
3631 In situ data
Tide gauges constitute the main and more precise source of tidal constants information along the coast
Most of the information concerning tides has been obtained from PdE tide gauges (REDMAR network) at
the Gulf of Caacutediz and the Canary Islands (Figure 361 Table 363) most of them upgraded to radar sensors
(Miros) since 2007 The radar sensors provide sea level measurements and local wind waves at the
harbours (Peacuterez‐Goacutemez et al 2013 Peacuterez‐Goacutemez et al 2014) and consist of an antenna located at the pier
well above the higher high water that provides sea level information related to harbour and national
datums by emitting radar pulses to the water surface (Figure 364 right)
The nominal sea level data sampling and latency nowadays is 1‐min at PdE these data are routinely quality
controlled in near‐real time processed and filtered to hourly values before computing the harmonic
analysis each calendar year by means of the Foreman analysis and prediction package (Foreman 1977)
This allows the study of the annual variability and trends of these harmonic constants (Woodworth 2010
Peacuterez‐Goacutemez 2014) The residual component (mainly meteorological in origin) is obtained after extracting
the astronomical tide to the hourly sea level observations
Additional information on tidal constants was required to other countries as well as other institutions such
as Global Sea Level Observing System (GLOSS) Harmonic constants from Nouakchott (Mauritania) were
provided by the Laboratory of Atmospheric Physics and Fluid Mechanics Cote drsquoIvoire The Spanish
Hydrographic Institute (hereafter IHM in its Spanish acronym) on the other hand provided harmonic
constants from Taacutenger and Ifni (Morocco) and Cape Bojador and Dakhla (Western Sahara) The operation
of these stations has been discontinuous in the past and the access to relevant products is not always
possible The Cape Bojador Ifni and Dakhla harmonic constants were obtained in the 40rsquos by IHM so their
value should be carefully considered here Finally tidal constants were also provided by the Instituto
Espantildeol de Oceanografiacutea (IEO) for Cadiz tide gauge (Gulf of Cadiz Spain)
Goacutemez M Peacuterez‐Goacutemez B De Alfonso M Peacuterez S and Ruiz M I Waves and tides in the CCLME
120
Table 363 Description of sea level (tide) measurement stations (number of station corresponds to the
number on the map in Figure 361)
Station Latitude Longitude Tide Gauge Type Data availability
5 Bonanza 36800degN 06333degW Miros (radar) Since 1992
6 Tarifa 36006degN 05630degW Miros (radar) Since 2009
7 El Hierro 27780degN 17900degW Miros (radar) Since 2004
8 La Gomera 28088degN 17108degW Miros (radar) Since 2006
9 La Palma 28678degN 17768degW Miros (radar) Since 2006
10 Tenerife 28483degN 16233degW Miros (radar) Since 1992
11 Granadilla 28090degN 16490degW Aanderaa (pressure) 2004‐2012
12 Las Palmas 28150degN 15330degW Miros (radar) Since 1992
13 Arinaga 27850degN 15400degW Aanderaa (pressure) 2004‐2012
14 Arrecife 28900degN 13530degW Miros (radar) Since 2008
15 Fuerteventura 28500degN 13850degW Miros (radar) Since 2004
16 Taacutenger 35783degN 05800degW May‐June 2005
17 Ifni 29550degN 10067degW March‐April 1949
18 C Bojador 26117degN 14500degW Sept‐Oct 1948
19 Dahkla 23633degN 16000degW Nov 1948‐Jan1949
20 Nouakchott 17984degN 16033degW 2007
3632 Tidal models
Another important sources of information are global and regional tidal models which allow a better spatial
characterization of the tide in open waters Their accuracy along the coast will depend on the spatial
resolution and the quality of the bathymetry A new regional tide atlas provided by Noveltis Legos and
CNES and based on the COMAPI tide model was used (Cancet et al 2010) with a resolution of 1rsquox1rsquo
Unfortunately this high resolution is up to now available only between 225degN and 37degN ie we lack
information south of Mauritania (Figure 364 left)
PdE provides operational sea level forecasts for a domain covering the whole Spanish coast the
Mediterranean and the Canary Islands up to 25degN by means of the Nivmar system This system was
established in 1998 based on the combination of the surge or meteorological forecast obtained with the
HAMSOM model and the tide forecast obtained at the harbours from the REDMAR network (Aacutelvarez‐Fanjul
et al 2001) Nowadays the system includes the tide forecast at the coast by means of the mentioned high
resolution regional tidal atlas for coastal and shelf seas developed by Noveltis Legos and CNES (COMAPI)
IOC TECHNICAL SERIES No 115 pp 115‐131 URI httphdlhandlenet18349182 2015
121
Figure 364 Left panel domain and bathymetry of the COMAPI tidal atlas extracted from the regional
product of the North‐East Atlantic for the Canary Current region (up to 225degN only) one of the sources of
data employed for tides description At right El Hierro (top) and La Palma (bottom) radar tide gauges from
the Spanish REDMAR network
The domain of the COMAPI tidal atlas for the North East Atlantic (NEA) is a little bit larger at this area than
the sea level hindcasts available at PdE (up to 225degN) so the analysis of the spatial variation of the main
components of the tide is based on this tidal atlas Its resolution (1rsquox1rsquo) improves significantly in relation to
the ones from previous global tidal models such as FES2004 GOT47 and TPX072 and to the Nivmar
system itself (10rsquox15rsquo) The COMAPI tidal atlas is based on new regional implementations of a
hydrodynamic finite element tide model (T‐UGOm) combined with altimetry and tide gauge data
assimilation it includes better information of the classical tidal waves near the coast and extension to some
of the non‐linear constituents A set of 37 harmonic constituents is available at each grid point
364 RESULTS AND DISCUSSION
3641 Mean and extreme wave climate
Wave roses of the 4 buoys are presented in Figures 365 and 366 while wave roses at 13 model points are
shown in Figure 367 These wave roses represent the percentage of data in each direction for different
significant wave height (Hs) intervals that are indicated by different blue tones
In the case of the buoys the Hs intervals are taken from 00 m to 25 m with a 05 m width with the last
color indicating waves over 25 m and in the case of the model points the intervals go from 02 m up to 5
m with an interval width of 1 m The last color indicates waves of more than 5 m
Goacutemez M Peacuterez‐Goacutemez B De Alfonso M Peacuterez S and Ruiz M I Waves and tides in the CCLME
122
Regarding the directional information sixteen directions have been considered that indicate the waves
incoming direction
These wave roses give a description of the mean wave climate in each area as they indicate the main
direction from which the waves come and the distribution of the significant wave height
It is important to distinguish between the wave roses that represent open deep water conditions from
those at coastal points that can be very much affected by the coast line This remark is especially
important at the Canary Islands where in general each location is affected by different islands
It can be said that the wave rose of Golfo de Caacutediz buoy (Figure 365) and of model points number 1 2 and
3 (Figure 367) represent open deep water conditions while the others represent coastal conditions
At open and deep water locations the most common wave height is between 1 m and 3 m being higher at
northern locations and decreasing as moving southwards
In regard with the wave direction the Gulf of Cadiz is dominated by waves coming from the west and the
main directions turn first to the north and finally to the north‐east as we move southwards being the
northeast the main direction at model point number 3 (Figure 367) at the north of Canary Islands
As it has been said the wave conditions at coastal points are very much affected by the coast line and some
of them only represent very local wave climate
This is the case of the Tarifa buoy (Figure 365) in which there is no presence of waves coming from the
west while in model point number 13 (Figure 367) that is very close to the buoy the west is the main
direction It is well known that the wave climate at the Strait of Gibraltar has two main components from
the west and the east respectively as it is shown in the wave rose of point number 13 but the buoy is
protected from this direction by the coast line
Model points from 8 to 12 (Figure 367) represent the wave climate along the Moroccan coast It can be
seen that the main direction is the north‐west being more northern or western depending on the coast
orientation The most frequent significant wave heights are between 1 m and 3 m being a little bit lower at
points 11 and 12 because they are a little bit protected by San Vicente Cape
Additionally at the Canary Islands the wave climate is represented by the wave roses of Gran Canaria and
Tenerife buoys (Figure 366) and model points from 4 to 7 (Figure 367) In general it can be seen that the
main direction is north‐northeast but analysing each single case it depends very much on the point
location related with the different islands The most common significant wave height is between 1 m and 2
m that is lower than in the locations at open deep water or at the Moroccan coast because of the
protection provided by the Islands
IOC TECHNICAL SERIES No 115 pp 115‐131 URI httphdlhandlenet18349182 2015
123
Figure 365 Wave roses from Golfo de Caacutediz (left) and Tarifa (right) buoys (yellow dots)
Figure 366 Wave roses from Tenerife (left) and Gran Canaria (right) buoys (yellow dots)
Goacutemez M Peacuterez‐Goacutemez B De Alfonso M Peacuterez S and Ruiz M I Waves and tides in the CCLME
124
1 2
3 4
5 6 7
8 9 10
11 12 13
Figure 367 Wave roses of 13 model points representing different locations of the area of interest
1
2
3
4 5 6 7
8
9
10
11
12
13
IOC TECHNICAL SERIES No 115 pp 115‐131 URI httphdlhandlenet18349182 2015
125
The most extreme significant wave height ever registered by the 4 buoys and obtained at the 13 model
points per season are shown in Tables 364 and 365
Unfortunately some of the buoys have not always been directional buoys and the extreme events have
occurred in dates in which they were not so there is not information about the direction In these cases
directional information from the nearest wave model point was used to draw conclusions
It can be seen that as expected the highest extreme storms appear during the winter season Autumn and
spring seasons are very similar while the lowest extreme storms appear in summer This is valid not only for
the significant wave height but also for the peak period
The Golfo de Caacutediz buoy is an exception because the highest significant wave height was registered in
spring However it can be considered a rare event because taking a more general look of this buoy data
most of the highest storms appear during the winter season as in the other locations
There is more difference between one location and the others in winter being the climate more severe in
the North than in the South In summer the extreme wave climate is very similar at all the locations
Regarding the directions it can be seen that almost all the extreme events come from the north‐west
being slightly more western in winter than in summer
All the seasonal differences are more evident at the northern locations than at the southern ones
Table 364 The highest significant wave height (Hs) ever registered by the 4 buoys per season (W winter
Sp spring S summer A autumn) The corresponding peak period (Tp) direction and date are also shown
Number of station corresponds to the number on the map in Figure 361
Buoy Season Max Hs (m)
Tp(s)
Direction (0‐N90‐E)
Date(GMT)
Buoy Season Max Hs(m)
Tp(s)
Direction (0‐N90‐E)
Date(GMT)
1 Golfo de Caacutediz
W 62 107 ‐‐ 19971218 02h 3Tenerife W 48 94 ‐‐ 19990108 03h
Sp 66 150 ‐‐ 20030413 23h Sp 36 91 230 20130303 22h
S 35 85 ‐‐ 19970605 12h S 27 6478
90 107
20090725 02h20130807 01h
A 36 85 ‐‐ 19990919 13h A 32 94 ‐‐ 19981009 14h
2 Tarifa W 36 105 107 20100128 01h 4 Gran Canaria
W 57 135 ‐‐ 19990112 09h
Sp 33 90 107 20110405 22h Sp 52 98 ‐‐ 20010313 21h
S 18 71 83 20130625 07h S 38 85 ‐‐ 20000610 13h
A 29 89 105 20121108 10h A 55 166 337 2014 1129 06h
The extreme events have lower significant heights at the buoy locations than at the model points because
as it has been said in the previous section the sensors are placed relatively close to the coast so they are
protected by it On the other hand the locations in which the extreme storms are the highest are in the
model points 1 2 9 10 and 11 that as it can be seen in Figure 367 are the less protected by the coast
Goacutemez M Peacuterez‐Goacutemez B De Alfonso M Peacuterez S and Ruiz M I Waves and tides in the CCLME
126
Table 365 The highest significant wave height (Hs) ever got at each of the 13 the model points per season
(W winter Sp spring S summer A autumn) The corresponding peak period (Tp) direction and date are
also shown (number of station corresponds to the number on the map in Figure 367)
Point Season Max Hs (m)
Tp (s)
Direction (0‐N90‐E)
Date(GMT)
Point Season Max Hs(m)
Tp(s)
Direction (0‐N90‐E)
Date(GMT)
1 W 102 175 307 19730117 12h 8 W 88 183 322 19820112 15h
Sp 78 123 77 19550331 21h Sp 64 178 310 19910307 12h
S 43 93 357 19790816 00h S 47 108 357 19660611 00h
A 72 161 296 19821108 03h A 65 181 332 19621107 06h
2 W 86 180 288 19660221 03h 9 W 104 183 309 19820112 12h
Sp 67 153 299 19890409 09h Sp 73 179 301 19910307 06h
S 41 148 356 20080819 15h S 47 91 358 20120612 20h
A 62 151 308 20141129 05h A 75 181 323 19621107 03h
3 W 66 134 308 19891229 00h 10 W 96 183 290 19660221 00h
Sp 58 138 285 20130305 12h Sp 74 178 297 19910307 06h
S 33 90 38 20120712 10h S 37 134 322 19610601 00h
A 70 136 314 20141129 00h A 80 117 268 19891119 18h
4 W 58 180 314 19660221 06h 11 W 97 182 283 19660221 06h
Sp 54 135 290 20130305 04h Sp 73 177 290 19910307 09h
S 41 83 29 20120715 05h S 37 132 309 19610601 00h
A 60 142 321 20141129 06h A 83 159 293 19841105 06h
5 W 49 110 29 20140124 10h 12 W 81 172 293 19730117 21h
Sp 46 85 230 20130303 23h Sp 50 145 275 19910307 15h
S 33 88 28 20120612 02h S 26 143 296 19850601 09h
A 46 145 343 20141129 10h A 48 115 258 19821107 15h
6 W 63 122 319 19720223 06h 13 W 62 109 272 20130119 18h
Sp 45 189 353 20140304 11h Sp 48 112 257 20130306 08h
S 33 89 17 20120712 10h S 25 65 83 20130625 11h
A 63 146 326 20141129 10h A 40 91 81 20081011 00h
7 W 56 118 10 19940117 18h
Sp 52 112 22 19940403 09h
S 37 95 10 20070622 21h
A 46 149 319 20141129 16h
3642 Tides regime
The relative importance of the tide and the meteorological component was estimated by computing the
standard deviation of the tidal elevations and the meteorological component for the REDMAR stations
during the year 2012 (Figure 368 left) Examples of the probability density functions or histograms of both
components are also displayed in Figure 368 (right)
IOC TECHNICAL SERIES No 115 pp 115‐131 URI httphdlhandlenet18349182 2015
127
Figure 368 Left Standard deviation (Stdv) of the tide and the meteorological or residual component for
REDMAR tide gauges in the region (year 2012) Right From the top to the bottom tide and surge
histograms for Tarifa (Gulf of Cadiz) Arrecife (Lanzarote Eastern Canary Islands) and La Palma (Western
Canary Islands) (hourly data year 2012)
The amplitudes and phases of the main semidiurnal (M2 S2) and diurnal (O1 K1) constituents were compiled
in Table 366 not only for the REDMAR stations but also for the ones provided by other organizations The
period of data used for the computation is included as well as the Form Factor F obtained from the ratio of
the amplitudes of these main constituents
)()(
)()(
22
11
SAMA
KAOAF
The value of F is usually employed for tides classification (Pugh 1987) diurnal semidiurnal or mixed
Finally the spatial variation of the main tidal constituents is shown from COMAPI model at Figures 369
and 3610
The Form Factor values in Table 366 well below 25 for all the stations indicate a clear dominant
semidiurnal tide (two highs and two lows per day) in the Canary Current region from the Gulf of Cadiz up to
Mauritania This reflects in the two peaks observed in the tide histograms of Figure 368 (right) the most
probable levels being close to the mean high waters and mean low waters respectively This is coherent on
the other hand with the larger amplitudes of the semidiurnal constituents (M2 and S2) in Table 366 with
respect to the diurnal ones at all the stations we could compile
Station Tide Stdv (cm) Res Stdv (cm)
Bonanza 7048 648
Tarifa 3346 615
Tenerife 5595 388
Granadilla (Tenerife) 4973 944
La Palma 5199 391
La Gomera 4681 370
El Hierro 4747 400
Las Palmas (G C) 5925 419
Arinaga (G C) 5389 485
Fuerteventura 6406 344
Arrecife (Lanz) 6648 351
Goacutemez M Peacuterez‐Goacutemez B De Alfonso M Peacuterez S and Ruiz M I Waves and tides in the CCLME
128
Table 366 Amplitude and phase of the main semidiurnal and diurnal tidal constituents form factor (F)
and period of data for its computation REDMAR stations are shown in bold Harmonic constants provided
by other institutions for those stations shaded in grey
Station M2 S2 O1 K1 F Years Amp
(cm) Phase Lag
(o) Amp(cm)
Phase Lag (o)
Amp (cm)
Phase Lag (o)
Amp(cm)
Phase Lag (o)
Gulf of Cadiz
Bonanza 8987 6374 3089 9033 612 32258 615 6030 0102 2010‐2012 Caacutediz 9967 6513 3593 9282 660 30763 676 5128 0081 2013 Tarifa 4173 4163 1566 6888 048 12849 263 1295 0054 2010‐2012 Taacutenger (Morocco) 6832 6536 1792 7111 446 33613 658 6018 0128 2005
Canary Islands
Tenerife 7063 2892 2718 5261 469 29284 625 4032 0112 2010‐2012 Granadilla (Tenerife) 6130 2596 2463 4731 474 29226 595 4072 0124 2003‐2011 La Palma 6516 3030 2551 5296 458 29365 578 4164 0114 2007‐2012 La Gomera 5794 2358 2335 4592 434 29005 558 3297 0122 2007‐2012 El Hierro 5946 2123 2426 4376 430 29067 613 3233 0125 2010‐2012 Las Palmas (G Canaria) 7527 2838 2897 5317 488 29345 619 4005 0106 2008‐2012 Arinaga (Gran Canaria) 6808 2818 2664 5060 476 29233 604 3724 0114 2003‐2011 Fuerteventura 8089 3233 3053 5621 518 29434 614 3853 0102 2010‐2012 Arrecife (Lanzarote) 8423 3482 3173 5835 522 29599 684 4210 0104 2008‐2012
West Africa coast Ifni (Morocco) 9138 3847 4078 7655 353 27855 437 2901 0060 1949 C Bojador (W Sah) 6155 1865 3340 3824 398 28355 302 1575 0070 1948 Dakhla (W Sah) 6855 1130 1981 3347 374 27909 769 3513 0130 1949 Nouakchott (Maur) 4271 2898 1737 3000 425 ‐ 628 1504 0178 2007
The surge or residual component is small in this area (Figure 8 left) with larger standard deviation
(between 6‐7 cm) at the Gulf of Cadiz (higher latitudes more prompt to suffer the effect of storms) and
lower values at the Canary Islands stations (between 3‐5 cm) The small magnitude of the surge component
is also related to the narrow shelf especially at the Canary Islands We lack information concerning this
component of sea level along the coast of Africa where it is expected to be larger than in the Canary
Islands due to the broader continental shelf and the southern part of the CCLME Bonanza and Tarifa in
the Gulf of Cadiz are the stations with larger and lower amplitude of the tide respectively due to the
variability of M2 and S2 close to the Strait of Gibraltar as can be seen also in Figure 369 from COMAPI
model Maximum tidal ranges are around 15 m at Tarifa 35 m at Bonanza 25 m at La Palma and 32 m at
Lanzarote The relative importance of meteorological sea level at each station obtained as
Res_StdvTide_Stdv (Table enclosed in Figure 368) varies between the 184 of the tide at Tarifa due to
its small tide amplitude and the 5 at Arrecife
In the Canary Islands there is a longitudinal variation of the tide amplitude becoming larger for the four
main constituents in Table 366 as we move eastwards and approach the continental slope (African coast)
this can also be observed from the spatial variation of their amplitude in Figures 369 and 3610 for the
whole region This longitudinal variation is most evident in fact for the diurnal constituents (K1 and O1)
IOC TECHNICAL SERIES No 115 pp 115‐131 URI httphdlhandlenet18349182 2015
129
Figure 369 Spatial variation of amplitude and phase of M2 S2 and M4 harmonic constituents from the
COMAPI tidal atlas in the area of interest (resolution 1rsquotimes1rsquo)
M2
Amplitude (m)
M2
Phase lag (deg)
S2
Phase lag (deg)
S2
Amplitude (m)
M4
Amplitude (m)
M4
Phase lag (deg)
Goacutemez M Peacuterez‐Goacutemez B De Alfonso M Peacuterez S and Ruiz M I Waves and tides in the CCLME
130
In these figures it is also evident the significant decrease of the tide as we approach the Strait of Gibraltar
with respect to the surrounding Atlantic waters The phase lag of the main semidiurnal constituents
however presents a latitudinal variation (Figure 369 right) due to the propagation of the tidal waves from
South to North as a Kelvin wave (with larger amplitude close to the continental shelf)
The higher frequency tidal constituents (such as M4 and M6) are usually related to shallow waters non‐
linear effects This is why they are not important in the Canary Islands either (amplitudes less than 1 cm)
and their magnitude becomes significant at the Gulf of Cadiz (up to 5 cm of M4 amplitude in Bonanza and
47 cm in Tarifa) It should be taken into account that Bonanza station is at the mouth of the Guadalquivir
river so shallow water effects are even more important here For the stations along the west coast of
Africa provided by IHM the amplitude of M4 reaches also relatively higher values (3‐35 cm) the quality of
these tidal constants is not clear but the spatial variation observed from COMAPI tidal atlas reveals also a
coherent increase of the amplitude of this harmonic towards the shelf (Figure 369 bottom)
For all the mentioned constituents an increase of the amplitude of the tide is observed at the Western
Sahara coast north of Dakhla (around 245degN) most important for S2 and K1 Larger tidal amplitudes in the
region according to Figures 369 and 3610 are found along the Morocco coast This is not totally
coherent however with results from tide gauge observations in Table 366 which reflect as already
mentioned the larger tidal amplitudes at Bonanza and Caacutediz
Evaluation of the trends of the main harmonic constants in Las Palmas and Tenerife stations (not shown
see Peacuterez‐Goacutemez 2014 for details) do not reveal an increase on the tidal amplitude since 1992 Although
the time series is short this in principle does not confirm the increase of tidal amplitudes observed in other
regions of the world (Ray 2006 2009 Woodworth 2010) On the contrary only M2 presents a significant
negative trend at Las Palmas (Peacuterez‐Goacutemez 2014)
Figure 3610 Spatial variation of the amplitude of the main diurnal constituents (O1 and K1) from the
COMAPI tidal atlas in the area of interest (resolution 1rsquotimes1rsquo)
O1
Amplitude (m)
K1
Amplitude (m)
IOC TECHNICAL SERIES No 115 pp 115‐131 URI httphdlhandlenet18349182 2015
131
365 CONCLUSIONS AND RECOMMENDATIONS
Waves
Several wave climates exist in the area of interest The Strait of Gibraltar Gulf of Cadiz Moroccan Coast
and Canary Islands wave climates are well described by PdE buoys and models Golfo de Caacutediz buoy (Figure
365) and model points number 1 2 and 3 (Figure 367) represent open deep water conditions while the
other model points and buoys represent local conditions affected by the coastline South of 20deg
unfortunately there is no source of information on waves available
The most common significant wave height is between 1 m and 3 m being higher at northern locations and
decreasing as moving southwards In regard with the wave direction the Gulf of Cadiz is dominated by
waves coming from the west and the main directions turn first to the north and finally to the north‐east as
moving southwards to the Canary Islands
The highest extreme storms appear during the winter season This is valid not only for the significant wave
height but for the peak period too The climate is more severe in the north than in the south and the
extreme events come from the North West The extreme events are lowest at the locations close to the
coast because they are protected by it
Tides
With respect to the tide its variability has been reviewed based on the available tidal constants from tide
gauges in the region and the regional tidal atlas based on COMAPI model The type of tide is mainly
semidiurnal for the whole area with tidal ranges between 15 m and 35 m and with local variations
basically coherent between observations and the model The meteorological component of sea level is
relatively small with respect to the tide although we lack information from the African coast
The analysis has been made only for the area north of 225degN covered by COMAPI model In order to
complete the study the domain of this model should be extended to cover the whole region including
Senegal and Cape Verde There is also a significant lack of tide gauge observations in most of the countries
what would be crucial for detailed information of local tide conditions in the region
Acknowledgements
We would like to thank Mr Angora Aman (Laboratory of Atmospheric Physics and Fluid Mechanics Cote
drsquoIvoire) and Mr Salvador Moreno (IHM) for providing tidal constants information of several stations in the
African coast and Dr Florent Lyard (LEGOS) for providing the output of the new high resolution tidal atlas
based on the COMAPI model
Goacutemez M Peacuterez‐Goacutemez B De Alfonso M Peacuterez S and Ruiz M I Waves and tides in the CCLME
BIBLIOGRAPHY
Alfonso M Lopez J D Alvarez E and Ruiz M I 2005 Real time buoy data quality control and exploitation The Fifth COPRI International Conference on ocean Wave Measurement and Analysis (WAVES) Coasts Oceans Ports and Rivers Institute American Society of Civil Engineers Madrid
Aacutelvarez‐Fanjul E Peacuterez‐Goacutemez B and Rodriacuteguez I 2001 Nivmar a storm surge forecasting system for Spanish waters Scientia Marina Vol 65 pp 203‐212
Aacutelvarez‐Fanjul E Alfonso M Ruiz M I Lopez J D and Rodriguez I 2002 Real Time Monitoring of Spanish coastal waters The Deep Water Network Proceedings of the Third International Conference on EuroGOOS Athens Greece
Cancet M Lux M Peacutenard C Lyard F Birol F Lemouroux J Bourgogne S and Bronner E 2010 COMAPI New regional tide atlases and high frequency dynamical atmospheric correction Ocean Surface Topography Science Team meeting Lisbon Portugal 2010
Foreman F G G 1977 Manual for tidal heights analysis and predictions Pacific Marine Science Report 77‐10 Institute of Ocean Sciences Patricia Bay Sidney BC 58 pp (2004 revision)
Goacutemez‐Lahoz M and Carretero‐Albiach J C 2005 Wave Forecasting at the Spanish Coasts Journal of Atmospheric and Ocean Science Vol 10 (4) pp 389‐405
Peacuterez‐Goacutemez B 2014 Design and implementation of an operational sea level monitoring and forecasting system for the Spanish coast PhD Thesis Cantabria University Santander Spain 242 pp
Peacuterez‐Goacutemez B Aacutelvarez‐Fanjul E Peacuterez S de Alfonso M and Vela J 2013 Use of tide gauge data in operational oceanography and sea level hazard warning systems Journal of Operational Oceanography Vol 6 (2) pp 1‐18 doi 1010801755876X201311020147
Peacuterez‐Goacutemez B Payo A Loacutepez D Woodworth P L and Aacutelvarez‐Fanjul E 2014 Overlapping sea level time series measured using different technologies an example from the REDMAR Spanish network Natural Hazards and Earth System Science Vol 14 (3) pp 589‐610 doi105194nhess‐14‐589‐2014
Pugh D T 1987 Tides Surges and Mean Sea‐Level John Wiley amp Sons Ltd 472 pp
Ray R 2006 Secular changes of the M2 tide in the Gulf of Maine Continental Shelf Research Vol 26 (3) pp 422‐427
Ray R 2009 Secular changes in the solar semidiurnal tide of the western North Atlantic Ocean Geophysical Research Letters Vol 36 L19601
Tolman H L 1991 A third‐generation model for wind waves on slowly varying unsteady and inhomogeneous depths and currents Journal of Physical Oceanography Vol 21 pp 782‐797
WAMDI Group et al 1988 The WAM model a third‐generation ocean wave prediction model Journal of Physical Oceanography Vol 18 pp 1775‐1810
Woodworth P L 2010 A survey of recent changes in the main components of the ocean tide Continental Shelf Research Vol 30 (5) pp 1680‐1691
- IOCTS115-PRESENTATION 36 OK dots - revised -h
- IOCTS115-ARTICLE 36 - h
- IOCTS115-BIBLIOGRAPHY 36 OK DOIs - h
-

IOC TECHNICAL SERIES No 115 pp 115‐131 URI httphdlhandlenet18349182 2015
117
Figure 362 Left picture Seawatch buoy from the Deep Water Network Right picture Triaxys buoy from
the Coastal Network
Table 361 Description of the PdE wave measurement stations (number of station corresponds to the
number shown on the map in Figure 361)
Station Latitude Longitude Mooring Depth Buoy Type Data availability
1 Golfo de Caacutediz 3648degN 0696degW 450 meters SeaWatch Since 1996
2 Tarifa 3600degN 0559degW 33 meters Triaxys Since 2008
3 Tenerife 2799degN 1658degW 710 meters SeaWatch Since 1997
4 Gran Canaria 2820degN 1580degW 780 meters SeaWatch Since 1996
Buoys have a processor on‐board that performs a spectral analysis using the three displacements time‐
series As a result the main spectral parameters are obtained and sent to PdE in real time These
parameters are significant wave height mean wave period peak wave period mean wave direction and
mean wave direction at the spectral peak (Alfonso et al 2005)
When buoy maintenance is performed raw displacement series are downloaded from the on‐board data
logger and then reprocessed at PdE applying an exhaustive quality control procedure and increasing the
number of computed parameters (from spectral and zero up crossing analysis)
3622 Wave models
PdE has carried out a wave hindcast for the Atlantic Ocean based on the numerical models WAM (WAMDI
Group 1988) and WAVEWATCH III (Tolman 1991) The boundaries of the area covered by the models
shown in Figure 363 are 67degNndash20degN 59degWndash8degE with a variable resolution that goes from 1deg in the open
waters to 5 in the Gulf of Cadiz and the Canary Islands
This hindcast provides information of all the wave parameters since 1958 to 2005 and it is daily updated
with the information provided by the analyzed time series of PdE wave forecast system (Goacutemez‐Lahoz and
Carretero‐Albiach 2005) The points shown in Table 363 have been selected to characterize the waves in
the area
Goacutemez M Peacuterez‐Goacutemez B De Alfonso M Peacuterez S and Ruiz M I Waves and tides in the CCLME
118
Figure 363 The Atlantic grid on the left on the right hand above the Gulf of Cadiz grid and on the right
hand bellow the Canary Islands grid
Table 362 Wave model selected points (number of station corresponds to the number shown on the map
in Figure 367)
Point Latitude Longitude
1 1040042 3550degN 1000degW
2 1030030 3250degN 1250degW
3 4032028 2958degN 1583degW
4 4010008 2792degN 1767degW
5 4030010 2808degN 1600degW
6 4044008 2792degN 1483degW
7 4066012 2825degN 1300degW
8 1036016 2900degN 1100degW
9 1040024 3100degN 1000degW
10 1044032 3300degN 0900degW
11 1050036 3400degN 0750degW
12 5040000 3525degN 0617degW
13 6048012 3595degN 0570degW
IOC TECHNICAL SERIES No 115 pp 115‐131 URI httphdlhandlenet18349182 2015
119
The wave hindcast (1958‐2005) was forced with ERA40 and ERA‐Interim re‐analysis The Wave Forecast
System forcing (2006 to present day) is provided by HIRLAM model run by the Spanish Meteorological
Agency (AEMET in its Spanish acronym)
Being 20degN the southern limit of PdE application the area of interest of this project is partially covered by
this system As a matter of fact the waves propagating from the south that affect the Canary Islands are
not reproduced in PdE wave data
On the other hand a wave forecast system was developed for the area of interest in the framework of the
Marinemet project that was carried out in collaboration between AEMET and PdE
(httpwwwafrimetorgmarinemet accessed on 15 January 2015) The information provided by this
system has not been used in this publication because although very interesting from the forecast point of
view it is not useful for wave climatic characterization
363 TIDES DATA AND METHODOLOGY
3631 In situ data
Tide gauges constitute the main and more precise source of tidal constants information along the coast
Most of the information concerning tides has been obtained from PdE tide gauges (REDMAR network) at
the Gulf of Caacutediz and the Canary Islands (Figure 361 Table 363) most of them upgraded to radar sensors
(Miros) since 2007 The radar sensors provide sea level measurements and local wind waves at the
harbours (Peacuterez‐Goacutemez et al 2013 Peacuterez‐Goacutemez et al 2014) and consist of an antenna located at the pier
well above the higher high water that provides sea level information related to harbour and national
datums by emitting radar pulses to the water surface (Figure 364 right)
The nominal sea level data sampling and latency nowadays is 1‐min at PdE these data are routinely quality
controlled in near‐real time processed and filtered to hourly values before computing the harmonic
analysis each calendar year by means of the Foreman analysis and prediction package (Foreman 1977)
This allows the study of the annual variability and trends of these harmonic constants (Woodworth 2010
Peacuterez‐Goacutemez 2014) The residual component (mainly meteorological in origin) is obtained after extracting
the astronomical tide to the hourly sea level observations
Additional information on tidal constants was required to other countries as well as other institutions such
as Global Sea Level Observing System (GLOSS) Harmonic constants from Nouakchott (Mauritania) were
provided by the Laboratory of Atmospheric Physics and Fluid Mechanics Cote drsquoIvoire The Spanish
Hydrographic Institute (hereafter IHM in its Spanish acronym) on the other hand provided harmonic
constants from Taacutenger and Ifni (Morocco) and Cape Bojador and Dakhla (Western Sahara) The operation
of these stations has been discontinuous in the past and the access to relevant products is not always
possible The Cape Bojador Ifni and Dakhla harmonic constants were obtained in the 40rsquos by IHM so their
value should be carefully considered here Finally tidal constants were also provided by the Instituto
Espantildeol de Oceanografiacutea (IEO) for Cadiz tide gauge (Gulf of Cadiz Spain)
Goacutemez M Peacuterez‐Goacutemez B De Alfonso M Peacuterez S and Ruiz M I Waves and tides in the CCLME
120
Table 363 Description of sea level (tide) measurement stations (number of station corresponds to the
number on the map in Figure 361)
Station Latitude Longitude Tide Gauge Type Data availability
5 Bonanza 36800degN 06333degW Miros (radar) Since 1992
6 Tarifa 36006degN 05630degW Miros (radar) Since 2009
7 El Hierro 27780degN 17900degW Miros (radar) Since 2004
8 La Gomera 28088degN 17108degW Miros (radar) Since 2006
9 La Palma 28678degN 17768degW Miros (radar) Since 2006
10 Tenerife 28483degN 16233degW Miros (radar) Since 1992
11 Granadilla 28090degN 16490degW Aanderaa (pressure) 2004‐2012
12 Las Palmas 28150degN 15330degW Miros (radar) Since 1992
13 Arinaga 27850degN 15400degW Aanderaa (pressure) 2004‐2012
14 Arrecife 28900degN 13530degW Miros (radar) Since 2008
15 Fuerteventura 28500degN 13850degW Miros (radar) Since 2004
16 Taacutenger 35783degN 05800degW May‐June 2005
17 Ifni 29550degN 10067degW March‐April 1949
18 C Bojador 26117degN 14500degW Sept‐Oct 1948
19 Dahkla 23633degN 16000degW Nov 1948‐Jan1949
20 Nouakchott 17984degN 16033degW 2007
3632 Tidal models
Another important sources of information are global and regional tidal models which allow a better spatial
characterization of the tide in open waters Their accuracy along the coast will depend on the spatial
resolution and the quality of the bathymetry A new regional tide atlas provided by Noveltis Legos and
CNES and based on the COMAPI tide model was used (Cancet et al 2010) with a resolution of 1rsquox1rsquo
Unfortunately this high resolution is up to now available only between 225degN and 37degN ie we lack
information south of Mauritania (Figure 364 left)
PdE provides operational sea level forecasts for a domain covering the whole Spanish coast the
Mediterranean and the Canary Islands up to 25degN by means of the Nivmar system This system was
established in 1998 based on the combination of the surge or meteorological forecast obtained with the
HAMSOM model and the tide forecast obtained at the harbours from the REDMAR network (Aacutelvarez‐Fanjul
et al 2001) Nowadays the system includes the tide forecast at the coast by means of the mentioned high
resolution regional tidal atlas for coastal and shelf seas developed by Noveltis Legos and CNES (COMAPI)
IOC TECHNICAL SERIES No 115 pp 115‐131 URI httphdlhandlenet18349182 2015
121
Figure 364 Left panel domain and bathymetry of the COMAPI tidal atlas extracted from the regional
product of the North‐East Atlantic for the Canary Current region (up to 225degN only) one of the sources of
data employed for tides description At right El Hierro (top) and La Palma (bottom) radar tide gauges from
the Spanish REDMAR network
The domain of the COMAPI tidal atlas for the North East Atlantic (NEA) is a little bit larger at this area than
the sea level hindcasts available at PdE (up to 225degN) so the analysis of the spatial variation of the main
components of the tide is based on this tidal atlas Its resolution (1rsquox1rsquo) improves significantly in relation to
the ones from previous global tidal models such as FES2004 GOT47 and TPX072 and to the Nivmar
system itself (10rsquox15rsquo) The COMAPI tidal atlas is based on new regional implementations of a
hydrodynamic finite element tide model (T‐UGOm) combined with altimetry and tide gauge data
assimilation it includes better information of the classical tidal waves near the coast and extension to some
of the non‐linear constituents A set of 37 harmonic constituents is available at each grid point
364 RESULTS AND DISCUSSION
3641 Mean and extreme wave climate
Wave roses of the 4 buoys are presented in Figures 365 and 366 while wave roses at 13 model points are
shown in Figure 367 These wave roses represent the percentage of data in each direction for different
significant wave height (Hs) intervals that are indicated by different blue tones
In the case of the buoys the Hs intervals are taken from 00 m to 25 m with a 05 m width with the last
color indicating waves over 25 m and in the case of the model points the intervals go from 02 m up to 5
m with an interval width of 1 m The last color indicates waves of more than 5 m
Goacutemez M Peacuterez‐Goacutemez B De Alfonso M Peacuterez S and Ruiz M I Waves and tides in the CCLME
122
Regarding the directional information sixteen directions have been considered that indicate the waves
incoming direction
These wave roses give a description of the mean wave climate in each area as they indicate the main
direction from which the waves come and the distribution of the significant wave height
It is important to distinguish between the wave roses that represent open deep water conditions from
those at coastal points that can be very much affected by the coast line This remark is especially
important at the Canary Islands where in general each location is affected by different islands
It can be said that the wave rose of Golfo de Caacutediz buoy (Figure 365) and of model points number 1 2 and
3 (Figure 367) represent open deep water conditions while the others represent coastal conditions
At open and deep water locations the most common wave height is between 1 m and 3 m being higher at
northern locations and decreasing as moving southwards
In regard with the wave direction the Gulf of Cadiz is dominated by waves coming from the west and the
main directions turn first to the north and finally to the north‐east as we move southwards being the
northeast the main direction at model point number 3 (Figure 367) at the north of Canary Islands
As it has been said the wave conditions at coastal points are very much affected by the coast line and some
of them only represent very local wave climate
This is the case of the Tarifa buoy (Figure 365) in which there is no presence of waves coming from the
west while in model point number 13 (Figure 367) that is very close to the buoy the west is the main
direction It is well known that the wave climate at the Strait of Gibraltar has two main components from
the west and the east respectively as it is shown in the wave rose of point number 13 but the buoy is
protected from this direction by the coast line
Model points from 8 to 12 (Figure 367) represent the wave climate along the Moroccan coast It can be
seen that the main direction is the north‐west being more northern or western depending on the coast
orientation The most frequent significant wave heights are between 1 m and 3 m being a little bit lower at
points 11 and 12 because they are a little bit protected by San Vicente Cape
Additionally at the Canary Islands the wave climate is represented by the wave roses of Gran Canaria and
Tenerife buoys (Figure 366) and model points from 4 to 7 (Figure 367) In general it can be seen that the
main direction is north‐northeast but analysing each single case it depends very much on the point
location related with the different islands The most common significant wave height is between 1 m and 2
m that is lower than in the locations at open deep water or at the Moroccan coast because of the
protection provided by the Islands
IOC TECHNICAL SERIES No 115 pp 115‐131 URI httphdlhandlenet18349182 2015
123
Figure 365 Wave roses from Golfo de Caacutediz (left) and Tarifa (right) buoys (yellow dots)
Figure 366 Wave roses from Tenerife (left) and Gran Canaria (right) buoys (yellow dots)
Goacutemez M Peacuterez‐Goacutemez B De Alfonso M Peacuterez S and Ruiz M I Waves and tides in the CCLME
124
1 2
3 4
5 6 7
8 9 10
11 12 13
Figure 367 Wave roses of 13 model points representing different locations of the area of interest
1
2
3
4 5 6 7
8
9
10
11
12
13
IOC TECHNICAL SERIES No 115 pp 115‐131 URI httphdlhandlenet18349182 2015
125
The most extreme significant wave height ever registered by the 4 buoys and obtained at the 13 model
points per season are shown in Tables 364 and 365
Unfortunately some of the buoys have not always been directional buoys and the extreme events have
occurred in dates in which they were not so there is not information about the direction In these cases
directional information from the nearest wave model point was used to draw conclusions
It can be seen that as expected the highest extreme storms appear during the winter season Autumn and
spring seasons are very similar while the lowest extreme storms appear in summer This is valid not only for
the significant wave height but also for the peak period
The Golfo de Caacutediz buoy is an exception because the highest significant wave height was registered in
spring However it can be considered a rare event because taking a more general look of this buoy data
most of the highest storms appear during the winter season as in the other locations
There is more difference between one location and the others in winter being the climate more severe in
the North than in the South In summer the extreme wave climate is very similar at all the locations
Regarding the directions it can be seen that almost all the extreme events come from the north‐west
being slightly more western in winter than in summer
All the seasonal differences are more evident at the northern locations than at the southern ones
Table 364 The highest significant wave height (Hs) ever registered by the 4 buoys per season (W winter
Sp spring S summer A autumn) The corresponding peak period (Tp) direction and date are also shown
Number of station corresponds to the number on the map in Figure 361
Buoy Season Max Hs (m)
Tp(s)
Direction (0‐N90‐E)
Date(GMT)
Buoy Season Max Hs(m)
Tp(s)
Direction (0‐N90‐E)
Date(GMT)
1 Golfo de Caacutediz
W 62 107 ‐‐ 19971218 02h 3Tenerife W 48 94 ‐‐ 19990108 03h
Sp 66 150 ‐‐ 20030413 23h Sp 36 91 230 20130303 22h
S 35 85 ‐‐ 19970605 12h S 27 6478
90 107
20090725 02h20130807 01h
A 36 85 ‐‐ 19990919 13h A 32 94 ‐‐ 19981009 14h
2 Tarifa W 36 105 107 20100128 01h 4 Gran Canaria
W 57 135 ‐‐ 19990112 09h
Sp 33 90 107 20110405 22h Sp 52 98 ‐‐ 20010313 21h
S 18 71 83 20130625 07h S 38 85 ‐‐ 20000610 13h
A 29 89 105 20121108 10h A 55 166 337 2014 1129 06h
The extreme events have lower significant heights at the buoy locations than at the model points because
as it has been said in the previous section the sensors are placed relatively close to the coast so they are
protected by it On the other hand the locations in which the extreme storms are the highest are in the
model points 1 2 9 10 and 11 that as it can be seen in Figure 367 are the less protected by the coast
Goacutemez M Peacuterez‐Goacutemez B De Alfonso M Peacuterez S and Ruiz M I Waves and tides in the CCLME
126
Table 365 The highest significant wave height (Hs) ever got at each of the 13 the model points per season
(W winter Sp spring S summer A autumn) The corresponding peak period (Tp) direction and date are
also shown (number of station corresponds to the number on the map in Figure 367)
Point Season Max Hs (m)
Tp (s)
Direction (0‐N90‐E)
Date(GMT)
Point Season Max Hs(m)
Tp(s)
Direction (0‐N90‐E)
Date(GMT)
1 W 102 175 307 19730117 12h 8 W 88 183 322 19820112 15h
Sp 78 123 77 19550331 21h Sp 64 178 310 19910307 12h
S 43 93 357 19790816 00h S 47 108 357 19660611 00h
A 72 161 296 19821108 03h A 65 181 332 19621107 06h
2 W 86 180 288 19660221 03h 9 W 104 183 309 19820112 12h
Sp 67 153 299 19890409 09h Sp 73 179 301 19910307 06h
S 41 148 356 20080819 15h S 47 91 358 20120612 20h
A 62 151 308 20141129 05h A 75 181 323 19621107 03h
3 W 66 134 308 19891229 00h 10 W 96 183 290 19660221 00h
Sp 58 138 285 20130305 12h Sp 74 178 297 19910307 06h
S 33 90 38 20120712 10h S 37 134 322 19610601 00h
A 70 136 314 20141129 00h A 80 117 268 19891119 18h
4 W 58 180 314 19660221 06h 11 W 97 182 283 19660221 06h
Sp 54 135 290 20130305 04h Sp 73 177 290 19910307 09h
S 41 83 29 20120715 05h S 37 132 309 19610601 00h
A 60 142 321 20141129 06h A 83 159 293 19841105 06h
5 W 49 110 29 20140124 10h 12 W 81 172 293 19730117 21h
Sp 46 85 230 20130303 23h Sp 50 145 275 19910307 15h
S 33 88 28 20120612 02h S 26 143 296 19850601 09h
A 46 145 343 20141129 10h A 48 115 258 19821107 15h
6 W 63 122 319 19720223 06h 13 W 62 109 272 20130119 18h
Sp 45 189 353 20140304 11h Sp 48 112 257 20130306 08h
S 33 89 17 20120712 10h S 25 65 83 20130625 11h
A 63 146 326 20141129 10h A 40 91 81 20081011 00h
7 W 56 118 10 19940117 18h
Sp 52 112 22 19940403 09h
S 37 95 10 20070622 21h
A 46 149 319 20141129 16h
3642 Tides regime
The relative importance of the tide and the meteorological component was estimated by computing the
standard deviation of the tidal elevations and the meteorological component for the REDMAR stations
during the year 2012 (Figure 368 left) Examples of the probability density functions or histograms of both
components are also displayed in Figure 368 (right)
IOC TECHNICAL SERIES No 115 pp 115‐131 URI httphdlhandlenet18349182 2015
127
Figure 368 Left Standard deviation (Stdv) of the tide and the meteorological or residual component for
REDMAR tide gauges in the region (year 2012) Right From the top to the bottom tide and surge
histograms for Tarifa (Gulf of Cadiz) Arrecife (Lanzarote Eastern Canary Islands) and La Palma (Western
Canary Islands) (hourly data year 2012)
The amplitudes and phases of the main semidiurnal (M2 S2) and diurnal (O1 K1) constituents were compiled
in Table 366 not only for the REDMAR stations but also for the ones provided by other organizations The
period of data used for the computation is included as well as the Form Factor F obtained from the ratio of
the amplitudes of these main constituents
)()(
)()(
22
11
SAMA
KAOAF
The value of F is usually employed for tides classification (Pugh 1987) diurnal semidiurnal or mixed
Finally the spatial variation of the main tidal constituents is shown from COMAPI model at Figures 369
and 3610
The Form Factor values in Table 366 well below 25 for all the stations indicate a clear dominant
semidiurnal tide (two highs and two lows per day) in the Canary Current region from the Gulf of Cadiz up to
Mauritania This reflects in the two peaks observed in the tide histograms of Figure 368 (right) the most
probable levels being close to the mean high waters and mean low waters respectively This is coherent on
the other hand with the larger amplitudes of the semidiurnal constituents (M2 and S2) in Table 366 with
respect to the diurnal ones at all the stations we could compile
Station Tide Stdv (cm) Res Stdv (cm)
Bonanza 7048 648
Tarifa 3346 615
Tenerife 5595 388
Granadilla (Tenerife) 4973 944
La Palma 5199 391
La Gomera 4681 370
El Hierro 4747 400
Las Palmas (G C) 5925 419
Arinaga (G C) 5389 485
Fuerteventura 6406 344
Arrecife (Lanz) 6648 351
Goacutemez M Peacuterez‐Goacutemez B De Alfonso M Peacuterez S and Ruiz M I Waves and tides in the CCLME
128
Table 366 Amplitude and phase of the main semidiurnal and diurnal tidal constituents form factor (F)
and period of data for its computation REDMAR stations are shown in bold Harmonic constants provided
by other institutions for those stations shaded in grey
Station M2 S2 O1 K1 F Years Amp
(cm) Phase Lag
(o) Amp(cm)
Phase Lag (o)
Amp (cm)
Phase Lag (o)
Amp(cm)
Phase Lag (o)
Gulf of Cadiz
Bonanza 8987 6374 3089 9033 612 32258 615 6030 0102 2010‐2012 Caacutediz 9967 6513 3593 9282 660 30763 676 5128 0081 2013 Tarifa 4173 4163 1566 6888 048 12849 263 1295 0054 2010‐2012 Taacutenger (Morocco) 6832 6536 1792 7111 446 33613 658 6018 0128 2005
Canary Islands
Tenerife 7063 2892 2718 5261 469 29284 625 4032 0112 2010‐2012 Granadilla (Tenerife) 6130 2596 2463 4731 474 29226 595 4072 0124 2003‐2011 La Palma 6516 3030 2551 5296 458 29365 578 4164 0114 2007‐2012 La Gomera 5794 2358 2335 4592 434 29005 558 3297 0122 2007‐2012 El Hierro 5946 2123 2426 4376 430 29067 613 3233 0125 2010‐2012 Las Palmas (G Canaria) 7527 2838 2897 5317 488 29345 619 4005 0106 2008‐2012 Arinaga (Gran Canaria) 6808 2818 2664 5060 476 29233 604 3724 0114 2003‐2011 Fuerteventura 8089 3233 3053 5621 518 29434 614 3853 0102 2010‐2012 Arrecife (Lanzarote) 8423 3482 3173 5835 522 29599 684 4210 0104 2008‐2012
West Africa coast Ifni (Morocco) 9138 3847 4078 7655 353 27855 437 2901 0060 1949 C Bojador (W Sah) 6155 1865 3340 3824 398 28355 302 1575 0070 1948 Dakhla (W Sah) 6855 1130 1981 3347 374 27909 769 3513 0130 1949 Nouakchott (Maur) 4271 2898 1737 3000 425 ‐ 628 1504 0178 2007
The surge or residual component is small in this area (Figure 8 left) with larger standard deviation
(between 6‐7 cm) at the Gulf of Cadiz (higher latitudes more prompt to suffer the effect of storms) and
lower values at the Canary Islands stations (between 3‐5 cm) The small magnitude of the surge component
is also related to the narrow shelf especially at the Canary Islands We lack information concerning this
component of sea level along the coast of Africa where it is expected to be larger than in the Canary
Islands due to the broader continental shelf and the southern part of the CCLME Bonanza and Tarifa in
the Gulf of Cadiz are the stations with larger and lower amplitude of the tide respectively due to the
variability of M2 and S2 close to the Strait of Gibraltar as can be seen also in Figure 369 from COMAPI
model Maximum tidal ranges are around 15 m at Tarifa 35 m at Bonanza 25 m at La Palma and 32 m at
Lanzarote The relative importance of meteorological sea level at each station obtained as
Res_StdvTide_Stdv (Table enclosed in Figure 368) varies between the 184 of the tide at Tarifa due to
its small tide amplitude and the 5 at Arrecife
In the Canary Islands there is a longitudinal variation of the tide amplitude becoming larger for the four
main constituents in Table 366 as we move eastwards and approach the continental slope (African coast)
this can also be observed from the spatial variation of their amplitude in Figures 369 and 3610 for the
whole region This longitudinal variation is most evident in fact for the diurnal constituents (K1 and O1)
IOC TECHNICAL SERIES No 115 pp 115‐131 URI httphdlhandlenet18349182 2015
129
Figure 369 Spatial variation of amplitude and phase of M2 S2 and M4 harmonic constituents from the
COMAPI tidal atlas in the area of interest (resolution 1rsquotimes1rsquo)
M2
Amplitude (m)
M2
Phase lag (deg)
S2
Phase lag (deg)
S2
Amplitude (m)
M4
Amplitude (m)
M4
Phase lag (deg)
Goacutemez M Peacuterez‐Goacutemez B De Alfonso M Peacuterez S and Ruiz M I Waves and tides in the CCLME
130
In these figures it is also evident the significant decrease of the tide as we approach the Strait of Gibraltar
with respect to the surrounding Atlantic waters The phase lag of the main semidiurnal constituents
however presents a latitudinal variation (Figure 369 right) due to the propagation of the tidal waves from
South to North as a Kelvin wave (with larger amplitude close to the continental shelf)
The higher frequency tidal constituents (such as M4 and M6) are usually related to shallow waters non‐
linear effects This is why they are not important in the Canary Islands either (amplitudes less than 1 cm)
and their magnitude becomes significant at the Gulf of Cadiz (up to 5 cm of M4 amplitude in Bonanza and
47 cm in Tarifa) It should be taken into account that Bonanza station is at the mouth of the Guadalquivir
river so shallow water effects are even more important here For the stations along the west coast of
Africa provided by IHM the amplitude of M4 reaches also relatively higher values (3‐35 cm) the quality of
these tidal constants is not clear but the spatial variation observed from COMAPI tidal atlas reveals also a
coherent increase of the amplitude of this harmonic towards the shelf (Figure 369 bottom)
For all the mentioned constituents an increase of the amplitude of the tide is observed at the Western
Sahara coast north of Dakhla (around 245degN) most important for S2 and K1 Larger tidal amplitudes in the
region according to Figures 369 and 3610 are found along the Morocco coast This is not totally
coherent however with results from tide gauge observations in Table 366 which reflect as already
mentioned the larger tidal amplitudes at Bonanza and Caacutediz
Evaluation of the trends of the main harmonic constants in Las Palmas and Tenerife stations (not shown
see Peacuterez‐Goacutemez 2014 for details) do not reveal an increase on the tidal amplitude since 1992 Although
the time series is short this in principle does not confirm the increase of tidal amplitudes observed in other
regions of the world (Ray 2006 2009 Woodworth 2010) On the contrary only M2 presents a significant
negative trend at Las Palmas (Peacuterez‐Goacutemez 2014)
Figure 3610 Spatial variation of the amplitude of the main diurnal constituents (O1 and K1) from the
COMAPI tidal atlas in the area of interest (resolution 1rsquotimes1rsquo)
O1
Amplitude (m)
K1
Amplitude (m)
IOC TECHNICAL SERIES No 115 pp 115‐131 URI httphdlhandlenet18349182 2015
131
365 CONCLUSIONS AND RECOMMENDATIONS
Waves
Several wave climates exist in the area of interest The Strait of Gibraltar Gulf of Cadiz Moroccan Coast
and Canary Islands wave climates are well described by PdE buoys and models Golfo de Caacutediz buoy (Figure
365) and model points number 1 2 and 3 (Figure 367) represent open deep water conditions while the
other model points and buoys represent local conditions affected by the coastline South of 20deg
unfortunately there is no source of information on waves available
The most common significant wave height is between 1 m and 3 m being higher at northern locations and
decreasing as moving southwards In regard with the wave direction the Gulf of Cadiz is dominated by
waves coming from the west and the main directions turn first to the north and finally to the north‐east as
moving southwards to the Canary Islands
The highest extreme storms appear during the winter season This is valid not only for the significant wave
height but for the peak period too The climate is more severe in the north than in the south and the
extreme events come from the North West The extreme events are lowest at the locations close to the
coast because they are protected by it
Tides
With respect to the tide its variability has been reviewed based on the available tidal constants from tide
gauges in the region and the regional tidal atlas based on COMAPI model The type of tide is mainly
semidiurnal for the whole area with tidal ranges between 15 m and 35 m and with local variations
basically coherent between observations and the model The meteorological component of sea level is
relatively small with respect to the tide although we lack information from the African coast
The analysis has been made only for the area north of 225degN covered by COMAPI model In order to
complete the study the domain of this model should be extended to cover the whole region including
Senegal and Cape Verde There is also a significant lack of tide gauge observations in most of the countries
what would be crucial for detailed information of local tide conditions in the region
Acknowledgements
We would like to thank Mr Angora Aman (Laboratory of Atmospheric Physics and Fluid Mechanics Cote
drsquoIvoire) and Mr Salvador Moreno (IHM) for providing tidal constants information of several stations in the
African coast and Dr Florent Lyard (LEGOS) for providing the output of the new high resolution tidal atlas
based on the COMAPI model
Goacutemez M Peacuterez‐Goacutemez B De Alfonso M Peacuterez S and Ruiz M I Waves and tides in the CCLME
BIBLIOGRAPHY
Alfonso M Lopez J D Alvarez E and Ruiz M I 2005 Real time buoy data quality control and exploitation The Fifth COPRI International Conference on ocean Wave Measurement and Analysis (WAVES) Coasts Oceans Ports and Rivers Institute American Society of Civil Engineers Madrid
Aacutelvarez‐Fanjul E Peacuterez‐Goacutemez B and Rodriacuteguez I 2001 Nivmar a storm surge forecasting system for Spanish waters Scientia Marina Vol 65 pp 203‐212
Aacutelvarez‐Fanjul E Alfonso M Ruiz M I Lopez J D and Rodriguez I 2002 Real Time Monitoring of Spanish coastal waters The Deep Water Network Proceedings of the Third International Conference on EuroGOOS Athens Greece
Cancet M Lux M Peacutenard C Lyard F Birol F Lemouroux J Bourgogne S and Bronner E 2010 COMAPI New regional tide atlases and high frequency dynamical atmospheric correction Ocean Surface Topography Science Team meeting Lisbon Portugal 2010
Foreman F G G 1977 Manual for tidal heights analysis and predictions Pacific Marine Science Report 77‐10 Institute of Ocean Sciences Patricia Bay Sidney BC 58 pp (2004 revision)
Goacutemez‐Lahoz M and Carretero‐Albiach J C 2005 Wave Forecasting at the Spanish Coasts Journal of Atmospheric and Ocean Science Vol 10 (4) pp 389‐405
Peacuterez‐Goacutemez B 2014 Design and implementation of an operational sea level monitoring and forecasting system for the Spanish coast PhD Thesis Cantabria University Santander Spain 242 pp
Peacuterez‐Goacutemez B Aacutelvarez‐Fanjul E Peacuterez S de Alfonso M and Vela J 2013 Use of tide gauge data in operational oceanography and sea level hazard warning systems Journal of Operational Oceanography Vol 6 (2) pp 1‐18 doi 1010801755876X201311020147
Peacuterez‐Goacutemez B Payo A Loacutepez D Woodworth P L and Aacutelvarez‐Fanjul E 2014 Overlapping sea level time series measured using different technologies an example from the REDMAR Spanish network Natural Hazards and Earth System Science Vol 14 (3) pp 589‐610 doi105194nhess‐14‐589‐2014
Pugh D T 1987 Tides Surges and Mean Sea‐Level John Wiley amp Sons Ltd 472 pp
Ray R 2006 Secular changes of the M2 tide in the Gulf of Maine Continental Shelf Research Vol 26 (3) pp 422‐427
Ray R 2009 Secular changes in the solar semidiurnal tide of the western North Atlantic Ocean Geophysical Research Letters Vol 36 L19601
Tolman H L 1991 A third‐generation model for wind waves on slowly varying unsteady and inhomogeneous depths and currents Journal of Physical Oceanography Vol 21 pp 782‐797
WAMDI Group et al 1988 The WAM model a third‐generation ocean wave prediction model Journal of Physical Oceanography Vol 18 pp 1775‐1810
Woodworth P L 2010 A survey of recent changes in the main components of the ocean tide Continental Shelf Research Vol 30 (5) pp 1680‐1691
- IOCTS115-PRESENTATION 36 OK dots - revised -h
- IOCTS115-ARTICLE 36 - h
- IOCTS115-BIBLIOGRAPHY 36 OK DOIs - h
-

Goacutemez M Peacuterez‐Goacutemez B De Alfonso M Peacuterez S and Ruiz M I Waves and tides in the CCLME
118
Figure 363 The Atlantic grid on the left on the right hand above the Gulf of Cadiz grid and on the right
hand bellow the Canary Islands grid
Table 362 Wave model selected points (number of station corresponds to the number shown on the map
in Figure 367)
Point Latitude Longitude
1 1040042 3550degN 1000degW
2 1030030 3250degN 1250degW
3 4032028 2958degN 1583degW
4 4010008 2792degN 1767degW
5 4030010 2808degN 1600degW
6 4044008 2792degN 1483degW
7 4066012 2825degN 1300degW
8 1036016 2900degN 1100degW
9 1040024 3100degN 1000degW
10 1044032 3300degN 0900degW
11 1050036 3400degN 0750degW
12 5040000 3525degN 0617degW
13 6048012 3595degN 0570degW
IOC TECHNICAL SERIES No 115 pp 115‐131 URI httphdlhandlenet18349182 2015
119
The wave hindcast (1958‐2005) was forced with ERA40 and ERA‐Interim re‐analysis The Wave Forecast
System forcing (2006 to present day) is provided by HIRLAM model run by the Spanish Meteorological
Agency (AEMET in its Spanish acronym)
Being 20degN the southern limit of PdE application the area of interest of this project is partially covered by
this system As a matter of fact the waves propagating from the south that affect the Canary Islands are
not reproduced in PdE wave data
On the other hand a wave forecast system was developed for the area of interest in the framework of the
Marinemet project that was carried out in collaboration between AEMET and PdE
(httpwwwafrimetorgmarinemet accessed on 15 January 2015) The information provided by this
system has not been used in this publication because although very interesting from the forecast point of
view it is not useful for wave climatic characterization
363 TIDES DATA AND METHODOLOGY
3631 In situ data
Tide gauges constitute the main and more precise source of tidal constants information along the coast
Most of the information concerning tides has been obtained from PdE tide gauges (REDMAR network) at
the Gulf of Caacutediz and the Canary Islands (Figure 361 Table 363) most of them upgraded to radar sensors
(Miros) since 2007 The radar sensors provide sea level measurements and local wind waves at the
harbours (Peacuterez‐Goacutemez et al 2013 Peacuterez‐Goacutemez et al 2014) and consist of an antenna located at the pier
well above the higher high water that provides sea level information related to harbour and national
datums by emitting radar pulses to the water surface (Figure 364 right)
The nominal sea level data sampling and latency nowadays is 1‐min at PdE these data are routinely quality
controlled in near‐real time processed and filtered to hourly values before computing the harmonic
analysis each calendar year by means of the Foreman analysis and prediction package (Foreman 1977)
This allows the study of the annual variability and trends of these harmonic constants (Woodworth 2010
Peacuterez‐Goacutemez 2014) The residual component (mainly meteorological in origin) is obtained after extracting
the astronomical tide to the hourly sea level observations
Additional information on tidal constants was required to other countries as well as other institutions such
as Global Sea Level Observing System (GLOSS) Harmonic constants from Nouakchott (Mauritania) were
provided by the Laboratory of Atmospheric Physics and Fluid Mechanics Cote drsquoIvoire The Spanish
Hydrographic Institute (hereafter IHM in its Spanish acronym) on the other hand provided harmonic
constants from Taacutenger and Ifni (Morocco) and Cape Bojador and Dakhla (Western Sahara) The operation
of these stations has been discontinuous in the past and the access to relevant products is not always
possible The Cape Bojador Ifni and Dakhla harmonic constants were obtained in the 40rsquos by IHM so their
value should be carefully considered here Finally tidal constants were also provided by the Instituto
Espantildeol de Oceanografiacutea (IEO) for Cadiz tide gauge (Gulf of Cadiz Spain)
Goacutemez M Peacuterez‐Goacutemez B De Alfonso M Peacuterez S and Ruiz M I Waves and tides in the CCLME
120
Table 363 Description of sea level (tide) measurement stations (number of station corresponds to the
number on the map in Figure 361)
Station Latitude Longitude Tide Gauge Type Data availability
5 Bonanza 36800degN 06333degW Miros (radar) Since 1992
6 Tarifa 36006degN 05630degW Miros (radar) Since 2009
7 El Hierro 27780degN 17900degW Miros (radar) Since 2004
8 La Gomera 28088degN 17108degW Miros (radar) Since 2006
9 La Palma 28678degN 17768degW Miros (radar) Since 2006
10 Tenerife 28483degN 16233degW Miros (radar) Since 1992
11 Granadilla 28090degN 16490degW Aanderaa (pressure) 2004‐2012
12 Las Palmas 28150degN 15330degW Miros (radar) Since 1992
13 Arinaga 27850degN 15400degW Aanderaa (pressure) 2004‐2012
14 Arrecife 28900degN 13530degW Miros (radar) Since 2008
15 Fuerteventura 28500degN 13850degW Miros (radar) Since 2004
16 Taacutenger 35783degN 05800degW May‐June 2005
17 Ifni 29550degN 10067degW March‐April 1949
18 C Bojador 26117degN 14500degW Sept‐Oct 1948
19 Dahkla 23633degN 16000degW Nov 1948‐Jan1949
20 Nouakchott 17984degN 16033degW 2007
3632 Tidal models
Another important sources of information are global and regional tidal models which allow a better spatial
characterization of the tide in open waters Their accuracy along the coast will depend on the spatial
resolution and the quality of the bathymetry A new regional tide atlas provided by Noveltis Legos and
CNES and based on the COMAPI tide model was used (Cancet et al 2010) with a resolution of 1rsquox1rsquo
Unfortunately this high resolution is up to now available only between 225degN and 37degN ie we lack
information south of Mauritania (Figure 364 left)
PdE provides operational sea level forecasts for a domain covering the whole Spanish coast the
Mediterranean and the Canary Islands up to 25degN by means of the Nivmar system This system was
established in 1998 based on the combination of the surge or meteorological forecast obtained with the
HAMSOM model and the tide forecast obtained at the harbours from the REDMAR network (Aacutelvarez‐Fanjul
et al 2001) Nowadays the system includes the tide forecast at the coast by means of the mentioned high
resolution regional tidal atlas for coastal and shelf seas developed by Noveltis Legos and CNES (COMAPI)
IOC TECHNICAL SERIES No 115 pp 115‐131 URI httphdlhandlenet18349182 2015
121
Figure 364 Left panel domain and bathymetry of the COMAPI tidal atlas extracted from the regional
product of the North‐East Atlantic for the Canary Current region (up to 225degN only) one of the sources of
data employed for tides description At right El Hierro (top) and La Palma (bottom) radar tide gauges from
the Spanish REDMAR network
The domain of the COMAPI tidal atlas for the North East Atlantic (NEA) is a little bit larger at this area than
the sea level hindcasts available at PdE (up to 225degN) so the analysis of the spatial variation of the main
components of the tide is based on this tidal atlas Its resolution (1rsquox1rsquo) improves significantly in relation to
the ones from previous global tidal models such as FES2004 GOT47 and TPX072 and to the Nivmar
system itself (10rsquox15rsquo) The COMAPI tidal atlas is based on new regional implementations of a
hydrodynamic finite element tide model (T‐UGOm) combined with altimetry and tide gauge data
assimilation it includes better information of the classical tidal waves near the coast and extension to some
of the non‐linear constituents A set of 37 harmonic constituents is available at each grid point
364 RESULTS AND DISCUSSION
3641 Mean and extreme wave climate
Wave roses of the 4 buoys are presented in Figures 365 and 366 while wave roses at 13 model points are
shown in Figure 367 These wave roses represent the percentage of data in each direction for different
significant wave height (Hs) intervals that are indicated by different blue tones
In the case of the buoys the Hs intervals are taken from 00 m to 25 m with a 05 m width with the last
color indicating waves over 25 m and in the case of the model points the intervals go from 02 m up to 5
m with an interval width of 1 m The last color indicates waves of more than 5 m
Goacutemez M Peacuterez‐Goacutemez B De Alfonso M Peacuterez S and Ruiz M I Waves and tides in the CCLME
122
Regarding the directional information sixteen directions have been considered that indicate the waves
incoming direction
These wave roses give a description of the mean wave climate in each area as they indicate the main
direction from which the waves come and the distribution of the significant wave height
It is important to distinguish between the wave roses that represent open deep water conditions from
those at coastal points that can be very much affected by the coast line This remark is especially
important at the Canary Islands where in general each location is affected by different islands
It can be said that the wave rose of Golfo de Caacutediz buoy (Figure 365) and of model points number 1 2 and
3 (Figure 367) represent open deep water conditions while the others represent coastal conditions
At open and deep water locations the most common wave height is between 1 m and 3 m being higher at
northern locations and decreasing as moving southwards
In regard with the wave direction the Gulf of Cadiz is dominated by waves coming from the west and the
main directions turn first to the north and finally to the north‐east as we move southwards being the
northeast the main direction at model point number 3 (Figure 367) at the north of Canary Islands
As it has been said the wave conditions at coastal points are very much affected by the coast line and some
of them only represent very local wave climate
This is the case of the Tarifa buoy (Figure 365) in which there is no presence of waves coming from the
west while in model point number 13 (Figure 367) that is very close to the buoy the west is the main
direction It is well known that the wave climate at the Strait of Gibraltar has two main components from
the west and the east respectively as it is shown in the wave rose of point number 13 but the buoy is
protected from this direction by the coast line
Model points from 8 to 12 (Figure 367) represent the wave climate along the Moroccan coast It can be
seen that the main direction is the north‐west being more northern or western depending on the coast
orientation The most frequent significant wave heights are between 1 m and 3 m being a little bit lower at
points 11 and 12 because they are a little bit protected by San Vicente Cape
Additionally at the Canary Islands the wave climate is represented by the wave roses of Gran Canaria and
Tenerife buoys (Figure 366) and model points from 4 to 7 (Figure 367) In general it can be seen that the
main direction is north‐northeast but analysing each single case it depends very much on the point
location related with the different islands The most common significant wave height is between 1 m and 2
m that is lower than in the locations at open deep water or at the Moroccan coast because of the
protection provided by the Islands
IOC TECHNICAL SERIES No 115 pp 115‐131 URI httphdlhandlenet18349182 2015
123
Figure 365 Wave roses from Golfo de Caacutediz (left) and Tarifa (right) buoys (yellow dots)
Figure 366 Wave roses from Tenerife (left) and Gran Canaria (right) buoys (yellow dots)
Goacutemez M Peacuterez‐Goacutemez B De Alfonso M Peacuterez S and Ruiz M I Waves and tides in the CCLME
124
1 2
3 4
5 6 7
8 9 10
11 12 13
Figure 367 Wave roses of 13 model points representing different locations of the area of interest
1
2
3
4 5 6 7
8
9
10
11
12
13
IOC TECHNICAL SERIES No 115 pp 115‐131 URI httphdlhandlenet18349182 2015
125
The most extreme significant wave height ever registered by the 4 buoys and obtained at the 13 model
points per season are shown in Tables 364 and 365
Unfortunately some of the buoys have not always been directional buoys and the extreme events have
occurred in dates in which they were not so there is not information about the direction In these cases
directional information from the nearest wave model point was used to draw conclusions
It can be seen that as expected the highest extreme storms appear during the winter season Autumn and
spring seasons are very similar while the lowest extreme storms appear in summer This is valid not only for
the significant wave height but also for the peak period
The Golfo de Caacutediz buoy is an exception because the highest significant wave height was registered in
spring However it can be considered a rare event because taking a more general look of this buoy data
most of the highest storms appear during the winter season as in the other locations
There is more difference between one location and the others in winter being the climate more severe in
the North than in the South In summer the extreme wave climate is very similar at all the locations
Regarding the directions it can be seen that almost all the extreme events come from the north‐west
being slightly more western in winter than in summer
All the seasonal differences are more evident at the northern locations than at the southern ones
Table 364 The highest significant wave height (Hs) ever registered by the 4 buoys per season (W winter
Sp spring S summer A autumn) The corresponding peak period (Tp) direction and date are also shown
Number of station corresponds to the number on the map in Figure 361
Buoy Season Max Hs (m)
Tp(s)
Direction (0‐N90‐E)
Date(GMT)
Buoy Season Max Hs(m)
Tp(s)
Direction (0‐N90‐E)
Date(GMT)
1 Golfo de Caacutediz
W 62 107 ‐‐ 19971218 02h 3Tenerife W 48 94 ‐‐ 19990108 03h
Sp 66 150 ‐‐ 20030413 23h Sp 36 91 230 20130303 22h
S 35 85 ‐‐ 19970605 12h S 27 6478
90 107
20090725 02h20130807 01h
A 36 85 ‐‐ 19990919 13h A 32 94 ‐‐ 19981009 14h
2 Tarifa W 36 105 107 20100128 01h 4 Gran Canaria
W 57 135 ‐‐ 19990112 09h
Sp 33 90 107 20110405 22h Sp 52 98 ‐‐ 20010313 21h
S 18 71 83 20130625 07h S 38 85 ‐‐ 20000610 13h
A 29 89 105 20121108 10h A 55 166 337 2014 1129 06h
The extreme events have lower significant heights at the buoy locations than at the model points because
as it has been said in the previous section the sensors are placed relatively close to the coast so they are
protected by it On the other hand the locations in which the extreme storms are the highest are in the
model points 1 2 9 10 and 11 that as it can be seen in Figure 367 are the less protected by the coast
Goacutemez M Peacuterez‐Goacutemez B De Alfonso M Peacuterez S and Ruiz M I Waves and tides in the CCLME
126
Table 365 The highest significant wave height (Hs) ever got at each of the 13 the model points per season
(W winter Sp spring S summer A autumn) The corresponding peak period (Tp) direction and date are
also shown (number of station corresponds to the number on the map in Figure 367)
Point Season Max Hs (m)
Tp (s)
Direction (0‐N90‐E)
Date(GMT)
Point Season Max Hs(m)
Tp(s)
Direction (0‐N90‐E)
Date(GMT)
1 W 102 175 307 19730117 12h 8 W 88 183 322 19820112 15h
Sp 78 123 77 19550331 21h Sp 64 178 310 19910307 12h
S 43 93 357 19790816 00h S 47 108 357 19660611 00h
A 72 161 296 19821108 03h A 65 181 332 19621107 06h
2 W 86 180 288 19660221 03h 9 W 104 183 309 19820112 12h
Sp 67 153 299 19890409 09h Sp 73 179 301 19910307 06h
S 41 148 356 20080819 15h S 47 91 358 20120612 20h
A 62 151 308 20141129 05h A 75 181 323 19621107 03h
3 W 66 134 308 19891229 00h 10 W 96 183 290 19660221 00h
Sp 58 138 285 20130305 12h Sp 74 178 297 19910307 06h
S 33 90 38 20120712 10h S 37 134 322 19610601 00h
A 70 136 314 20141129 00h A 80 117 268 19891119 18h
4 W 58 180 314 19660221 06h 11 W 97 182 283 19660221 06h
Sp 54 135 290 20130305 04h Sp 73 177 290 19910307 09h
S 41 83 29 20120715 05h S 37 132 309 19610601 00h
A 60 142 321 20141129 06h A 83 159 293 19841105 06h
5 W 49 110 29 20140124 10h 12 W 81 172 293 19730117 21h
Sp 46 85 230 20130303 23h Sp 50 145 275 19910307 15h
S 33 88 28 20120612 02h S 26 143 296 19850601 09h
A 46 145 343 20141129 10h A 48 115 258 19821107 15h
6 W 63 122 319 19720223 06h 13 W 62 109 272 20130119 18h
Sp 45 189 353 20140304 11h Sp 48 112 257 20130306 08h
S 33 89 17 20120712 10h S 25 65 83 20130625 11h
A 63 146 326 20141129 10h A 40 91 81 20081011 00h
7 W 56 118 10 19940117 18h
Sp 52 112 22 19940403 09h
S 37 95 10 20070622 21h
A 46 149 319 20141129 16h
3642 Tides regime
The relative importance of the tide and the meteorological component was estimated by computing the
standard deviation of the tidal elevations and the meteorological component for the REDMAR stations
during the year 2012 (Figure 368 left) Examples of the probability density functions or histograms of both
components are also displayed in Figure 368 (right)
IOC TECHNICAL SERIES No 115 pp 115‐131 URI httphdlhandlenet18349182 2015
127
Figure 368 Left Standard deviation (Stdv) of the tide and the meteorological or residual component for
REDMAR tide gauges in the region (year 2012) Right From the top to the bottom tide and surge
histograms for Tarifa (Gulf of Cadiz) Arrecife (Lanzarote Eastern Canary Islands) and La Palma (Western
Canary Islands) (hourly data year 2012)
The amplitudes and phases of the main semidiurnal (M2 S2) and diurnal (O1 K1) constituents were compiled
in Table 366 not only for the REDMAR stations but also for the ones provided by other organizations The
period of data used for the computation is included as well as the Form Factor F obtained from the ratio of
the amplitudes of these main constituents
)()(
)()(
22
11
SAMA
KAOAF
The value of F is usually employed for tides classification (Pugh 1987) diurnal semidiurnal or mixed
Finally the spatial variation of the main tidal constituents is shown from COMAPI model at Figures 369
and 3610
The Form Factor values in Table 366 well below 25 for all the stations indicate a clear dominant
semidiurnal tide (two highs and two lows per day) in the Canary Current region from the Gulf of Cadiz up to
Mauritania This reflects in the two peaks observed in the tide histograms of Figure 368 (right) the most
probable levels being close to the mean high waters and mean low waters respectively This is coherent on
the other hand with the larger amplitudes of the semidiurnal constituents (M2 and S2) in Table 366 with
respect to the diurnal ones at all the stations we could compile
Station Tide Stdv (cm) Res Stdv (cm)
Bonanza 7048 648
Tarifa 3346 615
Tenerife 5595 388
Granadilla (Tenerife) 4973 944
La Palma 5199 391
La Gomera 4681 370
El Hierro 4747 400
Las Palmas (G C) 5925 419
Arinaga (G C) 5389 485
Fuerteventura 6406 344
Arrecife (Lanz) 6648 351
Goacutemez M Peacuterez‐Goacutemez B De Alfonso M Peacuterez S and Ruiz M I Waves and tides in the CCLME
128
Table 366 Amplitude and phase of the main semidiurnal and diurnal tidal constituents form factor (F)
and period of data for its computation REDMAR stations are shown in bold Harmonic constants provided
by other institutions for those stations shaded in grey
Station M2 S2 O1 K1 F Years Amp
(cm) Phase Lag
(o) Amp(cm)
Phase Lag (o)
Amp (cm)
Phase Lag (o)
Amp(cm)
Phase Lag (o)
Gulf of Cadiz
Bonanza 8987 6374 3089 9033 612 32258 615 6030 0102 2010‐2012 Caacutediz 9967 6513 3593 9282 660 30763 676 5128 0081 2013 Tarifa 4173 4163 1566 6888 048 12849 263 1295 0054 2010‐2012 Taacutenger (Morocco) 6832 6536 1792 7111 446 33613 658 6018 0128 2005
Canary Islands
Tenerife 7063 2892 2718 5261 469 29284 625 4032 0112 2010‐2012 Granadilla (Tenerife) 6130 2596 2463 4731 474 29226 595 4072 0124 2003‐2011 La Palma 6516 3030 2551 5296 458 29365 578 4164 0114 2007‐2012 La Gomera 5794 2358 2335 4592 434 29005 558 3297 0122 2007‐2012 El Hierro 5946 2123 2426 4376 430 29067 613 3233 0125 2010‐2012 Las Palmas (G Canaria) 7527 2838 2897 5317 488 29345 619 4005 0106 2008‐2012 Arinaga (Gran Canaria) 6808 2818 2664 5060 476 29233 604 3724 0114 2003‐2011 Fuerteventura 8089 3233 3053 5621 518 29434 614 3853 0102 2010‐2012 Arrecife (Lanzarote) 8423 3482 3173 5835 522 29599 684 4210 0104 2008‐2012
West Africa coast Ifni (Morocco) 9138 3847 4078 7655 353 27855 437 2901 0060 1949 C Bojador (W Sah) 6155 1865 3340 3824 398 28355 302 1575 0070 1948 Dakhla (W Sah) 6855 1130 1981 3347 374 27909 769 3513 0130 1949 Nouakchott (Maur) 4271 2898 1737 3000 425 ‐ 628 1504 0178 2007
The surge or residual component is small in this area (Figure 8 left) with larger standard deviation
(between 6‐7 cm) at the Gulf of Cadiz (higher latitudes more prompt to suffer the effect of storms) and
lower values at the Canary Islands stations (between 3‐5 cm) The small magnitude of the surge component
is also related to the narrow shelf especially at the Canary Islands We lack information concerning this
component of sea level along the coast of Africa where it is expected to be larger than in the Canary
Islands due to the broader continental shelf and the southern part of the CCLME Bonanza and Tarifa in
the Gulf of Cadiz are the stations with larger and lower amplitude of the tide respectively due to the
variability of M2 and S2 close to the Strait of Gibraltar as can be seen also in Figure 369 from COMAPI
model Maximum tidal ranges are around 15 m at Tarifa 35 m at Bonanza 25 m at La Palma and 32 m at
Lanzarote The relative importance of meteorological sea level at each station obtained as
Res_StdvTide_Stdv (Table enclosed in Figure 368) varies between the 184 of the tide at Tarifa due to
its small tide amplitude and the 5 at Arrecife
In the Canary Islands there is a longitudinal variation of the tide amplitude becoming larger for the four
main constituents in Table 366 as we move eastwards and approach the continental slope (African coast)
this can also be observed from the spatial variation of their amplitude in Figures 369 and 3610 for the
whole region This longitudinal variation is most evident in fact for the diurnal constituents (K1 and O1)
IOC TECHNICAL SERIES No 115 pp 115‐131 URI httphdlhandlenet18349182 2015
129
Figure 369 Spatial variation of amplitude and phase of M2 S2 and M4 harmonic constituents from the
COMAPI tidal atlas in the area of interest (resolution 1rsquotimes1rsquo)
M2
Amplitude (m)
M2
Phase lag (deg)
S2
Phase lag (deg)
S2
Amplitude (m)
M4
Amplitude (m)
M4
Phase lag (deg)
Goacutemez M Peacuterez‐Goacutemez B De Alfonso M Peacuterez S and Ruiz M I Waves and tides in the CCLME
130
In these figures it is also evident the significant decrease of the tide as we approach the Strait of Gibraltar
with respect to the surrounding Atlantic waters The phase lag of the main semidiurnal constituents
however presents a latitudinal variation (Figure 369 right) due to the propagation of the tidal waves from
South to North as a Kelvin wave (with larger amplitude close to the continental shelf)
The higher frequency tidal constituents (such as M4 and M6) are usually related to shallow waters non‐
linear effects This is why they are not important in the Canary Islands either (amplitudes less than 1 cm)
and their magnitude becomes significant at the Gulf of Cadiz (up to 5 cm of M4 amplitude in Bonanza and
47 cm in Tarifa) It should be taken into account that Bonanza station is at the mouth of the Guadalquivir
river so shallow water effects are even more important here For the stations along the west coast of
Africa provided by IHM the amplitude of M4 reaches also relatively higher values (3‐35 cm) the quality of
these tidal constants is not clear but the spatial variation observed from COMAPI tidal atlas reveals also a
coherent increase of the amplitude of this harmonic towards the shelf (Figure 369 bottom)
For all the mentioned constituents an increase of the amplitude of the tide is observed at the Western
Sahara coast north of Dakhla (around 245degN) most important for S2 and K1 Larger tidal amplitudes in the
region according to Figures 369 and 3610 are found along the Morocco coast This is not totally
coherent however with results from tide gauge observations in Table 366 which reflect as already
mentioned the larger tidal amplitudes at Bonanza and Caacutediz
Evaluation of the trends of the main harmonic constants in Las Palmas and Tenerife stations (not shown
see Peacuterez‐Goacutemez 2014 for details) do not reveal an increase on the tidal amplitude since 1992 Although
the time series is short this in principle does not confirm the increase of tidal amplitudes observed in other
regions of the world (Ray 2006 2009 Woodworth 2010) On the contrary only M2 presents a significant
negative trend at Las Palmas (Peacuterez‐Goacutemez 2014)
Figure 3610 Spatial variation of the amplitude of the main diurnal constituents (O1 and K1) from the
COMAPI tidal atlas in the area of interest (resolution 1rsquotimes1rsquo)
O1
Amplitude (m)
K1
Amplitude (m)
IOC TECHNICAL SERIES No 115 pp 115‐131 URI httphdlhandlenet18349182 2015
131
365 CONCLUSIONS AND RECOMMENDATIONS
Waves
Several wave climates exist in the area of interest The Strait of Gibraltar Gulf of Cadiz Moroccan Coast
and Canary Islands wave climates are well described by PdE buoys and models Golfo de Caacutediz buoy (Figure
365) and model points number 1 2 and 3 (Figure 367) represent open deep water conditions while the
other model points and buoys represent local conditions affected by the coastline South of 20deg
unfortunately there is no source of information on waves available
The most common significant wave height is between 1 m and 3 m being higher at northern locations and
decreasing as moving southwards In regard with the wave direction the Gulf of Cadiz is dominated by
waves coming from the west and the main directions turn first to the north and finally to the north‐east as
moving southwards to the Canary Islands
The highest extreme storms appear during the winter season This is valid not only for the significant wave
height but for the peak period too The climate is more severe in the north than in the south and the
extreme events come from the North West The extreme events are lowest at the locations close to the
coast because they are protected by it
Tides
With respect to the tide its variability has been reviewed based on the available tidal constants from tide
gauges in the region and the regional tidal atlas based on COMAPI model The type of tide is mainly
semidiurnal for the whole area with tidal ranges between 15 m and 35 m and with local variations
basically coherent between observations and the model The meteorological component of sea level is
relatively small with respect to the tide although we lack information from the African coast
The analysis has been made only for the area north of 225degN covered by COMAPI model In order to
complete the study the domain of this model should be extended to cover the whole region including
Senegal and Cape Verde There is also a significant lack of tide gauge observations in most of the countries
what would be crucial for detailed information of local tide conditions in the region
Acknowledgements
We would like to thank Mr Angora Aman (Laboratory of Atmospheric Physics and Fluid Mechanics Cote
drsquoIvoire) and Mr Salvador Moreno (IHM) for providing tidal constants information of several stations in the
African coast and Dr Florent Lyard (LEGOS) for providing the output of the new high resolution tidal atlas
based on the COMAPI model
Goacutemez M Peacuterez‐Goacutemez B De Alfonso M Peacuterez S and Ruiz M I Waves and tides in the CCLME
BIBLIOGRAPHY
Alfonso M Lopez J D Alvarez E and Ruiz M I 2005 Real time buoy data quality control and exploitation The Fifth COPRI International Conference on ocean Wave Measurement and Analysis (WAVES) Coasts Oceans Ports and Rivers Institute American Society of Civil Engineers Madrid
Aacutelvarez‐Fanjul E Peacuterez‐Goacutemez B and Rodriacuteguez I 2001 Nivmar a storm surge forecasting system for Spanish waters Scientia Marina Vol 65 pp 203‐212
Aacutelvarez‐Fanjul E Alfonso M Ruiz M I Lopez J D and Rodriguez I 2002 Real Time Monitoring of Spanish coastal waters The Deep Water Network Proceedings of the Third International Conference on EuroGOOS Athens Greece
Cancet M Lux M Peacutenard C Lyard F Birol F Lemouroux J Bourgogne S and Bronner E 2010 COMAPI New regional tide atlases and high frequency dynamical atmospheric correction Ocean Surface Topography Science Team meeting Lisbon Portugal 2010
Foreman F G G 1977 Manual for tidal heights analysis and predictions Pacific Marine Science Report 77‐10 Institute of Ocean Sciences Patricia Bay Sidney BC 58 pp (2004 revision)
Goacutemez‐Lahoz M and Carretero‐Albiach J C 2005 Wave Forecasting at the Spanish Coasts Journal of Atmospheric and Ocean Science Vol 10 (4) pp 389‐405
Peacuterez‐Goacutemez B 2014 Design and implementation of an operational sea level monitoring and forecasting system for the Spanish coast PhD Thesis Cantabria University Santander Spain 242 pp
Peacuterez‐Goacutemez B Aacutelvarez‐Fanjul E Peacuterez S de Alfonso M and Vela J 2013 Use of tide gauge data in operational oceanography and sea level hazard warning systems Journal of Operational Oceanography Vol 6 (2) pp 1‐18 doi 1010801755876X201311020147
Peacuterez‐Goacutemez B Payo A Loacutepez D Woodworth P L and Aacutelvarez‐Fanjul E 2014 Overlapping sea level time series measured using different technologies an example from the REDMAR Spanish network Natural Hazards and Earth System Science Vol 14 (3) pp 589‐610 doi105194nhess‐14‐589‐2014
Pugh D T 1987 Tides Surges and Mean Sea‐Level John Wiley amp Sons Ltd 472 pp
Ray R 2006 Secular changes of the M2 tide in the Gulf of Maine Continental Shelf Research Vol 26 (3) pp 422‐427
Ray R 2009 Secular changes in the solar semidiurnal tide of the western North Atlantic Ocean Geophysical Research Letters Vol 36 L19601
Tolman H L 1991 A third‐generation model for wind waves on slowly varying unsteady and inhomogeneous depths and currents Journal of Physical Oceanography Vol 21 pp 782‐797
WAMDI Group et al 1988 The WAM model a third‐generation ocean wave prediction model Journal of Physical Oceanography Vol 18 pp 1775‐1810
Woodworth P L 2010 A survey of recent changes in the main components of the ocean tide Continental Shelf Research Vol 30 (5) pp 1680‐1691
- IOCTS115-PRESENTATION 36 OK dots - revised -h
- IOCTS115-ARTICLE 36 - h
- IOCTS115-BIBLIOGRAPHY 36 OK DOIs - h
-

IOC TECHNICAL SERIES No 115 pp 115‐131 URI httphdlhandlenet18349182 2015
119
The wave hindcast (1958‐2005) was forced with ERA40 and ERA‐Interim re‐analysis The Wave Forecast
System forcing (2006 to present day) is provided by HIRLAM model run by the Spanish Meteorological
Agency (AEMET in its Spanish acronym)
Being 20degN the southern limit of PdE application the area of interest of this project is partially covered by
this system As a matter of fact the waves propagating from the south that affect the Canary Islands are
not reproduced in PdE wave data
On the other hand a wave forecast system was developed for the area of interest in the framework of the
Marinemet project that was carried out in collaboration between AEMET and PdE
(httpwwwafrimetorgmarinemet accessed on 15 January 2015) The information provided by this
system has not been used in this publication because although very interesting from the forecast point of
view it is not useful for wave climatic characterization
363 TIDES DATA AND METHODOLOGY
3631 In situ data
Tide gauges constitute the main and more precise source of tidal constants information along the coast
Most of the information concerning tides has been obtained from PdE tide gauges (REDMAR network) at
the Gulf of Caacutediz and the Canary Islands (Figure 361 Table 363) most of them upgraded to radar sensors
(Miros) since 2007 The radar sensors provide sea level measurements and local wind waves at the
harbours (Peacuterez‐Goacutemez et al 2013 Peacuterez‐Goacutemez et al 2014) and consist of an antenna located at the pier
well above the higher high water that provides sea level information related to harbour and national
datums by emitting radar pulses to the water surface (Figure 364 right)
The nominal sea level data sampling and latency nowadays is 1‐min at PdE these data are routinely quality
controlled in near‐real time processed and filtered to hourly values before computing the harmonic
analysis each calendar year by means of the Foreman analysis and prediction package (Foreman 1977)
This allows the study of the annual variability and trends of these harmonic constants (Woodworth 2010
Peacuterez‐Goacutemez 2014) The residual component (mainly meteorological in origin) is obtained after extracting
the astronomical tide to the hourly sea level observations
Additional information on tidal constants was required to other countries as well as other institutions such
as Global Sea Level Observing System (GLOSS) Harmonic constants from Nouakchott (Mauritania) were
provided by the Laboratory of Atmospheric Physics and Fluid Mechanics Cote drsquoIvoire The Spanish
Hydrographic Institute (hereafter IHM in its Spanish acronym) on the other hand provided harmonic
constants from Taacutenger and Ifni (Morocco) and Cape Bojador and Dakhla (Western Sahara) The operation
of these stations has been discontinuous in the past and the access to relevant products is not always
possible The Cape Bojador Ifni and Dakhla harmonic constants were obtained in the 40rsquos by IHM so their
value should be carefully considered here Finally tidal constants were also provided by the Instituto
Espantildeol de Oceanografiacutea (IEO) for Cadiz tide gauge (Gulf of Cadiz Spain)
Goacutemez M Peacuterez‐Goacutemez B De Alfonso M Peacuterez S and Ruiz M I Waves and tides in the CCLME
120
Table 363 Description of sea level (tide) measurement stations (number of station corresponds to the
number on the map in Figure 361)
Station Latitude Longitude Tide Gauge Type Data availability
5 Bonanza 36800degN 06333degW Miros (radar) Since 1992
6 Tarifa 36006degN 05630degW Miros (radar) Since 2009
7 El Hierro 27780degN 17900degW Miros (radar) Since 2004
8 La Gomera 28088degN 17108degW Miros (radar) Since 2006
9 La Palma 28678degN 17768degW Miros (radar) Since 2006
10 Tenerife 28483degN 16233degW Miros (radar) Since 1992
11 Granadilla 28090degN 16490degW Aanderaa (pressure) 2004‐2012
12 Las Palmas 28150degN 15330degW Miros (radar) Since 1992
13 Arinaga 27850degN 15400degW Aanderaa (pressure) 2004‐2012
14 Arrecife 28900degN 13530degW Miros (radar) Since 2008
15 Fuerteventura 28500degN 13850degW Miros (radar) Since 2004
16 Taacutenger 35783degN 05800degW May‐June 2005
17 Ifni 29550degN 10067degW March‐April 1949
18 C Bojador 26117degN 14500degW Sept‐Oct 1948
19 Dahkla 23633degN 16000degW Nov 1948‐Jan1949
20 Nouakchott 17984degN 16033degW 2007
3632 Tidal models
Another important sources of information are global and regional tidal models which allow a better spatial
characterization of the tide in open waters Their accuracy along the coast will depend on the spatial
resolution and the quality of the bathymetry A new regional tide atlas provided by Noveltis Legos and
CNES and based on the COMAPI tide model was used (Cancet et al 2010) with a resolution of 1rsquox1rsquo
Unfortunately this high resolution is up to now available only between 225degN and 37degN ie we lack
information south of Mauritania (Figure 364 left)
PdE provides operational sea level forecasts for a domain covering the whole Spanish coast the
Mediterranean and the Canary Islands up to 25degN by means of the Nivmar system This system was
established in 1998 based on the combination of the surge or meteorological forecast obtained with the
HAMSOM model and the tide forecast obtained at the harbours from the REDMAR network (Aacutelvarez‐Fanjul
et al 2001) Nowadays the system includes the tide forecast at the coast by means of the mentioned high
resolution regional tidal atlas for coastal and shelf seas developed by Noveltis Legos and CNES (COMAPI)
IOC TECHNICAL SERIES No 115 pp 115‐131 URI httphdlhandlenet18349182 2015
121
Figure 364 Left panel domain and bathymetry of the COMAPI tidal atlas extracted from the regional
product of the North‐East Atlantic for the Canary Current region (up to 225degN only) one of the sources of
data employed for tides description At right El Hierro (top) and La Palma (bottom) radar tide gauges from
the Spanish REDMAR network
The domain of the COMAPI tidal atlas for the North East Atlantic (NEA) is a little bit larger at this area than
the sea level hindcasts available at PdE (up to 225degN) so the analysis of the spatial variation of the main
components of the tide is based on this tidal atlas Its resolution (1rsquox1rsquo) improves significantly in relation to
the ones from previous global tidal models such as FES2004 GOT47 and TPX072 and to the Nivmar
system itself (10rsquox15rsquo) The COMAPI tidal atlas is based on new regional implementations of a
hydrodynamic finite element tide model (T‐UGOm) combined with altimetry and tide gauge data
assimilation it includes better information of the classical tidal waves near the coast and extension to some
of the non‐linear constituents A set of 37 harmonic constituents is available at each grid point
364 RESULTS AND DISCUSSION
3641 Mean and extreme wave climate
Wave roses of the 4 buoys are presented in Figures 365 and 366 while wave roses at 13 model points are
shown in Figure 367 These wave roses represent the percentage of data in each direction for different
significant wave height (Hs) intervals that are indicated by different blue tones
In the case of the buoys the Hs intervals are taken from 00 m to 25 m with a 05 m width with the last
color indicating waves over 25 m and in the case of the model points the intervals go from 02 m up to 5
m with an interval width of 1 m The last color indicates waves of more than 5 m
Goacutemez M Peacuterez‐Goacutemez B De Alfonso M Peacuterez S and Ruiz M I Waves and tides in the CCLME
122
Regarding the directional information sixteen directions have been considered that indicate the waves
incoming direction
These wave roses give a description of the mean wave climate in each area as they indicate the main
direction from which the waves come and the distribution of the significant wave height
It is important to distinguish between the wave roses that represent open deep water conditions from
those at coastal points that can be very much affected by the coast line This remark is especially
important at the Canary Islands where in general each location is affected by different islands
It can be said that the wave rose of Golfo de Caacutediz buoy (Figure 365) and of model points number 1 2 and
3 (Figure 367) represent open deep water conditions while the others represent coastal conditions
At open and deep water locations the most common wave height is between 1 m and 3 m being higher at
northern locations and decreasing as moving southwards
In regard with the wave direction the Gulf of Cadiz is dominated by waves coming from the west and the
main directions turn first to the north and finally to the north‐east as we move southwards being the
northeast the main direction at model point number 3 (Figure 367) at the north of Canary Islands
As it has been said the wave conditions at coastal points are very much affected by the coast line and some
of them only represent very local wave climate
This is the case of the Tarifa buoy (Figure 365) in which there is no presence of waves coming from the
west while in model point number 13 (Figure 367) that is very close to the buoy the west is the main
direction It is well known that the wave climate at the Strait of Gibraltar has two main components from
the west and the east respectively as it is shown in the wave rose of point number 13 but the buoy is
protected from this direction by the coast line
Model points from 8 to 12 (Figure 367) represent the wave climate along the Moroccan coast It can be
seen that the main direction is the north‐west being more northern or western depending on the coast
orientation The most frequent significant wave heights are between 1 m and 3 m being a little bit lower at
points 11 and 12 because they are a little bit protected by San Vicente Cape
Additionally at the Canary Islands the wave climate is represented by the wave roses of Gran Canaria and
Tenerife buoys (Figure 366) and model points from 4 to 7 (Figure 367) In general it can be seen that the
main direction is north‐northeast but analysing each single case it depends very much on the point
location related with the different islands The most common significant wave height is between 1 m and 2
m that is lower than in the locations at open deep water or at the Moroccan coast because of the
protection provided by the Islands
IOC TECHNICAL SERIES No 115 pp 115‐131 URI httphdlhandlenet18349182 2015
123
Figure 365 Wave roses from Golfo de Caacutediz (left) and Tarifa (right) buoys (yellow dots)
Figure 366 Wave roses from Tenerife (left) and Gran Canaria (right) buoys (yellow dots)
Goacutemez M Peacuterez‐Goacutemez B De Alfonso M Peacuterez S and Ruiz M I Waves and tides in the CCLME
124
1 2
3 4
5 6 7
8 9 10
11 12 13
Figure 367 Wave roses of 13 model points representing different locations of the area of interest
1
2
3
4 5 6 7
8
9
10
11
12
13
IOC TECHNICAL SERIES No 115 pp 115‐131 URI httphdlhandlenet18349182 2015
125
The most extreme significant wave height ever registered by the 4 buoys and obtained at the 13 model
points per season are shown in Tables 364 and 365
Unfortunately some of the buoys have not always been directional buoys and the extreme events have
occurred in dates in which they were not so there is not information about the direction In these cases
directional information from the nearest wave model point was used to draw conclusions
It can be seen that as expected the highest extreme storms appear during the winter season Autumn and
spring seasons are very similar while the lowest extreme storms appear in summer This is valid not only for
the significant wave height but also for the peak period
The Golfo de Caacutediz buoy is an exception because the highest significant wave height was registered in
spring However it can be considered a rare event because taking a more general look of this buoy data
most of the highest storms appear during the winter season as in the other locations
There is more difference between one location and the others in winter being the climate more severe in
the North than in the South In summer the extreme wave climate is very similar at all the locations
Regarding the directions it can be seen that almost all the extreme events come from the north‐west
being slightly more western in winter than in summer
All the seasonal differences are more evident at the northern locations than at the southern ones
Table 364 The highest significant wave height (Hs) ever registered by the 4 buoys per season (W winter
Sp spring S summer A autumn) The corresponding peak period (Tp) direction and date are also shown
Number of station corresponds to the number on the map in Figure 361
Buoy Season Max Hs (m)
Tp(s)
Direction (0‐N90‐E)
Date(GMT)
Buoy Season Max Hs(m)
Tp(s)
Direction (0‐N90‐E)
Date(GMT)
1 Golfo de Caacutediz
W 62 107 ‐‐ 19971218 02h 3Tenerife W 48 94 ‐‐ 19990108 03h
Sp 66 150 ‐‐ 20030413 23h Sp 36 91 230 20130303 22h
S 35 85 ‐‐ 19970605 12h S 27 6478
90 107
20090725 02h20130807 01h
A 36 85 ‐‐ 19990919 13h A 32 94 ‐‐ 19981009 14h
2 Tarifa W 36 105 107 20100128 01h 4 Gran Canaria
W 57 135 ‐‐ 19990112 09h
Sp 33 90 107 20110405 22h Sp 52 98 ‐‐ 20010313 21h
S 18 71 83 20130625 07h S 38 85 ‐‐ 20000610 13h
A 29 89 105 20121108 10h A 55 166 337 2014 1129 06h
The extreme events have lower significant heights at the buoy locations than at the model points because
as it has been said in the previous section the sensors are placed relatively close to the coast so they are
protected by it On the other hand the locations in which the extreme storms are the highest are in the
model points 1 2 9 10 and 11 that as it can be seen in Figure 367 are the less protected by the coast
Goacutemez M Peacuterez‐Goacutemez B De Alfonso M Peacuterez S and Ruiz M I Waves and tides in the CCLME
126
Table 365 The highest significant wave height (Hs) ever got at each of the 13 the model points per season
(W winter Sp spring S summer A autumn) The corresponding peak period (Tp) direction and date are
also shown (number of station corresponds to the number on the map in Figure 367)
Point Season Max Hs (m)
Tp (s)
Direction (0‐N90‐E)
Date(GMT)
Point Season Max Hs(m)
Tp(s)
Direction (0‐N90‐E)
Date(GMT)
1 W 102 175 307 19730117 12h 8 W 88 183 322 19820112 15h
Sp 78 123 77 19550331 21h Sp 64 178 310 19910307 12h
S 43 93 357 19790816 00h S 47 108 357 19660611 00h
A 72 161 296 19821108 03h A 65 181 332 19621107 06h
2 W 86 180 288 19660221 03h 9 W 104 183 309 19820112 12h
Sp 67 153 299 19890409 09h Sp 73 179 301 19910307 06h
S 41 148 356 20080819 15h S 47 91 358 20120612 20h
A 62 151 308 20141129 05h A 75 181 323 19621107 03h
3 W 66 134 308 19891229 00h 10 W 96 183 290 19660221 00h
Sp 58 138 285 20130305 12h Sp 74 178 297 19910307 06h
S 33 90 38 20120712 10h S 37 134 322 19610601 00h
A 70 136 314 20141129 00h A 80 117 268 19891119 18h
4 W 58 180 314 19660221 06h 11 W 97 182 283 19660221 06h
Sp 54 135 290 20130305 04h Sp 73 177 290 19910307 09h
S 41 83 29 20120715 05h S 37 132 309 19610601 00h
A 60 142 321 20141129 06h A 83 159 293 19841105 06h
5 W 49 110 29 20140124 10h 12 W 81 172 293 19730117 21h
Sp 46 85 230 20130303 23h Sp 50 145 275 19910307 15h
S 33 88 28 20120612 02h S 26 143 296 19850601 09h
A 46 145 343 20141129 10h A 48 115 258 19821107 15h
6 W 63 122 319 19720223 06h 13 W 62 109 272 20130119 18h
Sp 45 189 353 20140304 11h Sp 48 112 257 20130306 08h
S 33 89 17 20120712 10h S 25 65 83 20130625 11h
A 63 146 326 20141129 10h A 40 91 81 20081011 00h
7 W 56 118 10 19940117 18h
Sp 52 112 22 19940403 09h
S 37 95 10 20070622 21h
A 46 149 319 20141129 16h
3642 Tides regime
The relative importance of the tide and the meteorological component was estimated by computing the
standard deviation of the tidal elevations and the meteorological component for the REDMAR stations
during the year 2012 (Figure 368 left) Examples of the probability density functions or histograms of both
components are also displayed in Figure 368 (right)
IOC TECHNICAL SERIES No 115 pp 115‐131 URI httphdlhandlenet18349182 2015
127
Figure 368 Left Standard deviation (Stdv) of the tide and the meteorological or residual component for
REDMAR tide gauges in the region (year 2012) Right From the top to the bottom tide and surge
histograms for Tarifa (Gulf of Cadiz) Arrecife (Lanzarote Eastern Canary Islands) and La Palma (Western
Canary Islands) (hourly data year 2012)
The amplitudes and phases of the main semidiurnal (M2 S2) and diurnal (O1 K1) constituents were compiled
in Table 366 not only for the REDMAR stations but also for the ones provided by other organizations The
period of data used for the computation is included as well as the Form Factor F obtained from the ratio of
the amplitudes of these main constituents
)()(
)()(
22
11
SAMA
KAOAF
The value of F is usually employed for tides classification (Pugh 1987) diurnal semidiurnal or mixed
Finally the spatial variation of the main tidal constituents is shown from COMAPI model at Figures 369
and 3610
The Form Factor values in Table 366 well below 25 for all the stations indicate a clear dominant
semidiurnal tide (two highs and two lows per day) in the Canary Current region from the Gulf of Cadiz up to
Mauritania This reflects in the two peaks observed in the tide histograms of Figure 368 (right) the most
probable levels being close to the mean high waters and mean low waters respectively This is coherent on
the other hand with the larger amplitudes of the semidiurnal constituents (M2 and S2) in Table 366 with
respect to the diurnal ones at all the stations we could compile
Station Tide Stdv (cm) Res Stdv (cm)
Bonanza 7048 648
Tarifa 3346 615
Tenerife 5595 388
Granadilla (Tenerife) 4973 944
La Palma 5199 391
La Gomera 4681 370
El Hierro 4747 400
Las Palmas (G C) 5925 419
Arinaga (G C) 5389 485
Fuerteventura 6406 344
Arrecife (Lanz) 6648 351
Goacutemez M Peacuterez‐Goacutemez B De Alfonso M Peacuterez S and Ruiz M I Waves and tides in the CCLME
128
Table 366 Amplitude and phase of the main semidiurnal and diurnal tidal constituents form factor (F)
and period of data for its computation REDMAR stations are shown in bold Harmonic constants provided
by other institutions for those stations shaded in grey
Station M2 S2 O1 K1 F Years Amp
(cm) Phase Lag
(o) Amp(cm)
Phase Lag (o)
Amp (cm)
Phase Lag (o)
Amp(cm)
Phase Lag (o)
Gulf of Cadiz
Bonanza 8987 6374 3089 9033 612 32258 615 6030 0102 2010‐2012 Caacutediz 9967 6513 3593 9282 660 30763 676 5128 0081 2013 Tarifa 4173 4163 1566 6888 048 12849 263 1295 0054 2010‐2012 Taacutenger (Morocco) 6832 6536 1792 7111 446 33613 658 6018 0128 2005
Canary Islands
Tenerife 7063 2892 2718 5261 469 29284 625 4032 0112 2010‐2012 Granadilla (Tenerife) 6130 2596 2463 4731 474 29226 595 4072 0124 2003‐2011 La Palma 6516 3030 2551 5296 458 29365 578 4164 0114 2007‐2012 La Gomera 5794 2358 2335 4592 434 29005 558 3297 0122 2007‐2012 El Hierro 5946 2123 2426 4376 430 29067 613 3233 0125 2010‐2012 Las Palmas (G Canaria) 7527 2838 2897 5317 488 29345 619 4005 0106 2008‐2012 Arinaga (Gran Canaria) 6808 2818 2664 5060 476 29233 604 3724 0114 2003‐2011 Fuerteventura 8089 3233 3053 5621 518 29434 614 3853 0102 2010‐2012 Arrecife (Lanzarote) 8423 3482 3173 5835 522 29599 684 4210 0104 2008‐2012
West Africa coast Ifni (Morocco) 9138 3847 4078 7655 353 27855 437 2901 0060 1949 C Bojador (W Sah) 6155 1865 3340 3824 398 28355 302 1575 0070 1948 Dakhla (W Sah) 6855 1130 1981 3347 374 27909 769 3513 0130 1949 Nouakchott (Maur) 4271 2898 1737 3000 425 ‐ 628 1504 0178 2007
The surge or residual component is small in this area (Figure 8 left) with larger standard deviation
(between 6‐7 cm) at the Gulf of Cadiz (higher latitudes more prompt to suffer the effect of storms) and
lower values at the Canary Islands stations (between 3‐5 cm) The small magnitude of the surge component
is also related to the narrow shelf especially at the Canary Islands We lack information concerning this
component of sea level along the coast of Africa where it is expected to be larger than in the Canary
Islands due to the broader continental shelf and the southern part of the CCLME Bonanza and Tarifa in
the Gulf of Cadiz are the stations with larger and lower amplitude of the tide respectively due to the
variability of M2 and S2 close to the Strait of Gibraltar as can be seen also in Figure 369 from COMAPI
model Maximum tidal ranges are around 15 m at Tarifa 35 m at Bonanza 25 m at La Palma and 32 m at
Lanzarote The relative importance of meteorological sea level at each station obtained as
Res_StdvTide_Stdv (Table enclosed in Figure 368) varies between the 184 of the tide at Tarifa due to
its small tide amplitude and the 5 at Arrecife
In the Canary Islands there is a longitudinal variation of the tide amplitude becoming larger for the four
main constituents in Table 366 as we move eastwards and approach the continental slope (African coast)
this can also be observed from the spatial variation of their amplitude in Figures 369 and 3610 for the
whole region This longitudinal variation is most evident in fact for the diurnal constituents (K1 and O1)
IOC TECHNICAL SERIES No 115 pp 115‐131 URI httphdlhandlenet18349182 2015
129
Figure 369 Spatial variation of amplitude and phase of M2 S2 and M4 harmonic constituents from the
COMAPI tidal atlas in the area of interest (resolution 1rsquotimes1rsquo)
M2
Amplitude (m)
M2
Phase lag (deg)
S2
Phase lag (deg)
S2
Amplitude (m)
M4
Amplitude (m)
M4
Phase lag (deg)
Goacutemez M Peacuterez‐Goacutemez B De Alfonso M Peacuterez S and Ruiz M I Waves and tides in the CCLME
130
In these figures it is also evident the significant decrease of the tide as we approach the Strait of Gibraltar
with respect to the surrounding Atlantic waters The phase lag of the main semidiurnal constituents
however presents a latitudinal variation (Figure 369 right) due to the propagation of the tidal waves from
South to North as a Kelvin wave (with larger amplitude close to the continental shelf)
The higher frequency tidal constituents (such as M4 and M6) are usually related to shallow waters non‐
linear effects This is why they are not important in the Canary Islands either (amplitudes less than 1 cm)
and their magnitude becomes significant at the Gulf of Cadiz (up to 5 cm of M4 amplitude in Bonanza and
47 cm in Tarifa) It should be taken into account that Bonanza station is at the mouth of the Guadalquivir
river so shallow water effects are even more important here For the stations along the west coast of
Africa provided by IHM the amplitude of M4 reaches also relatively higher values (3‐35 cm) the quality of
these tidal constants is not clear but the spatial variation observed from COMAPI tidal atlas reveals also a
coherent increase of the amplitude of this harmonic towards the shelf (Figure 369 bottom)
For all the mentioned constituents an increase of the amplitude of the tide is observed at the Western
Sahara coast north of Dakhla (around 245degN) most important for S2 and K1 Larger tidal amplitudes in the
region according to Figures 369 and 3610 are found along the Morocco coast This is not totally
coherent however with results from tide gauge observations in Table 366 which reflect as already
mentioned the larger tidal amplitudes at Bonanza and Caacutediz
Evaluation of the trends of the main harmonic constants in Las Palmas and Tenerife stations (not shown
see Peacuterez‐Goacutemez 2014 for details) do not reveal an increase on the tidal amplitude since 1992 Although
the time series is short this in principle does not confirm the increase of tidal amplitudes observed in other
regions of the world (Ray 2006 2009 Woodworth 2010) On the contrary only M2 presents a significant
negative trend at Las Palmas (Peacuterez‐Goacutemez 2014)
Figure 3610 Spatial variation of the amplitude of the main diurnal constituents (O1 and K1) from the
COMAPI tidal atlas in the area of interest (resolution 1rsquotimes1rsquo)
O1
Amplitude (m)
K1
Amplitude (m)
IOC TECHNICAL SERIES No 115 pp 115‐131 URI httphdlhandlenet18349182 2015
131
365 CONCLUSIONS AND RECOMMENDATIONS
Waves
Several wave climates exist in the area of interest The Strait of Gibraltar Gulf of Cadiz Moroccan Coast
and Canary Islands wave climates are well described by PdE buoys and models Golfo de Caacutediz buoy (Figure
365) and model points number 1 2 and 3 (Figure 367) represent open deep water conditions while the
other model points and buoys represent local conditions affected by the coastline South of 20deg
unfortunately there is no source of information on waves available
The most common significant wave height is between 1 m and 3 m being higher at northern locations and
decreasing as moving southwards In regard with the wave direction the Gulf of Cadiz is dominated by
waves coming from the west and the main directions turn first to the north and finally to the north‐east as
moving southwards to the Canary Islands
The highest extreme storms appear during the winter season This is valid not only for the significant wave
height but for the peak period too The climate is more severe in the north than in the south and the
extreme events come from the North West The extreme events are lowest at the locations close to the
coast because they are protected by it
Tides
With respect to the tide its variability has been reviewed based on the available tidal constants from tide
gauges in the region and the regional tidal atlas based on COMAPI model The type of tide is mainly
semidiurnal for the whole area with tidal ranges between 15 m and 35 m and with local variations
basically coherent between observations and the model The meteorological component of sea level is
relatively small with respect to the tide although we lack information from the African coast
The analysis has been made only for the area north of 225degN covered by COMAPI model In order to
complete the study the domain of this model should be extended to cover the whole region including
Senegal and Cape Verde There is also a significant lack of tide gauge observations in most of the countries
what would be crucial for detailed information of local tide conditions in the region
Acknowledgements
We would like to thank Mr Angora Aman (Laboratory of Atmospheric Physics and Fluid Mechanics Cote
drsquoIvoire) and Mr Salvador Moreno (IHM) for providing tidal constants information of several stations in the
African coast and Dr Florent Lyard (LEGOS) for providing the output of the new high resolution tidal atlas
based on the COMAPI model
Goacutemez M Peacuterez‐Goacutemez B De Alfonso M Peacuterez S and Ruiz M I Waves and tides in the CCLME
BIBLIOGRAPHY
Alfonso M Lopez J D Alvarez E and Ruiz M I 2005 Real time buoy data quality control and exploitation The Fifth COPRI International Conference on ocean Wave Measurement and Analysis (WAVES) Coasts Oceans Ports and Rivers Institute American Society of Civil Engineers Madrid
Aacutelvarez‐Fanjul E Peacuterez‐Goacutemez B and Rodriacuteguez I 2001 Nivmar a storm surge forecasting system for Spanish waters Scientia Marina Vol 65 pp 203‐212
Aacutelvarez‐Fanjul E Alfonso M Ruiz M I Lopez J D and Rodriguez I 2002 Real Time Monitoring of Spanish coastal waters The Deep Water Network Proceedings of the Third International Conference on EuroGOOS Athens Greece
Cancet M Lux M Peacutenard C Lyard F Birol F Lemouroux J Bourgogne S and Bronner E 2010 COMAPI New regional tide atlases and high frequency dynamical atmospheric correction Ocean Surface Topography Science Team meeting Lisbon Portugal 2010
Foreman F G G 1977 Manual for tidal heights analysis and predictions Pacific Marine Science Report 77‐10 Institute of Ocean Sciences Patricia Bay Sidney BC 58 pp (2004 revision)
Goacutemez‐Lahoz M and Carretero‐Albiach J C 2005 Wave Forecasting at the Spanish Coasts Journal of Atmospheric and Ocean Science Vol 10 (4) pp 389‐405
Peacuterez‐Goacutemez B 2014 Design and implementation of an operational sea level monitoring and forecasting system for the Spanish coast PhD Thesis Cantabria University Santander Spain 242 pp
Peacuterez‐Goacutemez B Aacutelvarez‐Fanjul E Peacuterez S de Alfonso M and Vela J 2013 Use of tide gauge data in operational oceanography and sea level hazard warning systems Journal of Operational Oceanography Vol 6 (2) pp 1‐18 doi 1010801755876X201311020147
Peacuterez‐Goacutemez B Payo A Loacutepez D Woodworth P L and Aacutelvarez‐Fanjul E 2014 Overlapping sea level time series measured using different technologies an example from the REDMAR Spanish network Natural Hazards and Earth System Science Vol 14 (3) pp 589‐610 doi105194nhess‐14‐589‐2014
Pugh D T 1987 Tides Surges and Mean Sea‐Level John Wiley amp Sons Ltd 472 pp
Ray R 2006 Secular changes of the M2 tide in the Gulf of Maine Continental Shelf Research Vol 26 (3) pp 422‐427
Ray R 2009 Secular changes in the solar semidiurnal tide of the western North Atlantic Ocean Geophysical Research Letters Vol 36 L19601
Tolman H L 1991 A third‐generation model for wind waves on slowly varying unsteady and inhomogeneous depths and currents Journal of Physical Oceanography Vol 21 pp 782‐797
WAMDI Group et al 1988 The WAM model a third‐generation ocean wave prediction model Journal of Physical Oceanography Vol 18 pp 1775‐1810
Woodworth P L 2010 A survey of recent changes in the main components of the ocean tide Continental Shelf Research Vol 30 (5) pp 1680‐1691
- IOCTS115-PRESENTATION 36 OK dots - revised -h
- IOCTS115-ARTICLE 36 - h
- IOCTS115-BIBLIOGRAPHY 36 OK DOIs - h
-

Goacutemez M Peacuterez‐Goacutemez B De Alfonso M Peacuterez S and Ruiz M I Waves and tides in the CCLME
120
Table 363 Description of sea level (tide) measurement stations (number of station corresponds to the
number on the map in Figure 361)
Station Latitude Longitude Tide Gauge Type Data availability
5 Bonanza 36800degN 06333degW Miros (radar) Since 1992
6 Tarifa 36006degN 05630degW Miros (radar) Since 2009
7 El Hierro 27780degN 17900degW Miros (radar) Since 2004
8 La Gomera 28088degN 17108degW Miros (radar) Since 2006
9 La Palma 28678degN 17768degW Miros (radar) Since 2006
10 Tenerife 28483degN 16233degW Miros (radar) Since 1992
11 Granadilla 28090degN 16490degW Aanderaa (pressure) 2004‐2012
12 Las Palmas 28150degN 15330degW Miros (radar) Since 1992
13 Arinaga 27850degN 15400degW Aanderaa (pressure) 2004‐2012
14 Arrecife 28900degN 13530degW Miros (radar) Since 2008
15 Fuerteventura 28500degN 13850degW Miros (radar) Since 2004
16 Taacutenger 35783degN 05800degW May‐June 2005
17 Ifni 29550degN 10067degW March‐April 1949
18 C Bojador 26117degN 14500degW Sept‐Oct 1948
19 Dahkla 23633degN 16000degW Nov 1948‐Jan1949
20 Nouakchott 17984degN 16033degW 2007
3632 Tidal models
Another important sources of information are global and regional tidal models which allow a better spatial
characterization of the tide in open waters Their accuracy along the coast will depend on the spatial
resolution and the quality of the bathymetry A new regional tide atlas provided by Noveltis Legos and
CNES and based on the COMAPI tide model was used (Cancet et al 2010) with a resolution of 1rsquox1rsquo
Unfortunately this high resolution is up to now available only between 225degN and 37degN ie we lack
information south of Mauritania (Figure 364 left)
PdE provides operational sea level forecasts for a domain covering the whole Spanish coast the
Mediterranean and the Canary Islands up to 25degN by means of the Nivmar system This system was
established in 1998 based on the combination of the surge or meteorological forecast obtained with the
HAMSOM model and the tide forecast obtained at the harbours from the REDMAR network (Aacutelvarez‐Fanjul
et al 2001) Nowadays the system includes the tide forecast at the coast by means of the mentioned high
resolution regional tidal atlas for coastal and shelf seas developed by Noveltis Legos and CNES (COMAPI)
IOC TECHNICAL SERIES No 115 pp 115‐131 URI httphdlhandlenet18349182 2015
121
Figure 364 Left panel domain and bathymetry of the COMAPI tidal atlas extracted from the regional
product of the North‐East Atlantic for the Canary Current region (up to 225degN only) one of the sources of
data employed for tides description At right El Hierro (top) and La Palma (bottom) radar tide gauges from
the Spanish REDMAR network
The domain of the COMAPI tidal atlas for the North East Atlantic (NEA) is a little bit larger at this area than
the sea level hindcasts available at PdE (up to 225degN) so the analysis of the spatial variation of the main
components of the tide is based on this tidal atlas Its resolution (1rsquox1rsquo) improves significantly in relation to
the ones from previous global tidal models such as FES2004 GOT47 and TPX072 and to the Nivmar
system itself (10rsquox15rsquo) The COMAPI tidal atlas is based on new regional implementations of a
hydrodynamic finite element tide model (T‐UGOm) combined with altimetry and tide gauge data
assimilation it includes better information of the classical tidal waves near the coast and extension to some
of the non‐linear constituents A set of 37 harmonic constituents is available at each grid point
364 RESULTS AND DISCUSSION
3641 Mean and extreme wave climate
Wave roses of the 4 buoys are presented in Figures 365 and 366 while wave roses at 13 model points are
shown in Figure 367 These wave roses represent the percentage of data in each direction for different
significant wave height (Hs) intervals that are indicated by different blue tones
In the case of the buoys the Hs intervals are taken from 00 m to 25 m with a 05 m width with the last
color indicating waves over 25 m and in the case of the model points the intervals go from 02 m up to 5
m with an interval width of 1 m The last color indicates waves of more than 5 m
Goacutemez M Peacuterez‐Goacutemez B De Alfonso M Peacuterez S and Ruiz M I Waves and tides in the CCLME
122
Regarding the directional information sixteen directions have been considered that indicate the waves
incoming direction
These wave roses give a description of the mean wave climate in each area as they indicate the main
direction from which the waves come and the distribution of the significant wave height
It is important to distinguish between the wave roses that represent open deep water conditions from
those at coastal points that can be very much affected by the coast line This remark is especially
important at the Canary Islands where in general each location is affected by different islands
It can be said that the wave rose of Golfo de Caacutediz buoy (Figure 365) and of model points number 1 2 and
3 (Figure 367) represent open deep water conditions while the others represent coastal conditions
At open and deep water locations the most common wave height is between 1 m and 3 m being higher at
northern locations and decreasing as moving southwards
In regard with the wave direction the Gulf of Cadiz is dominated by waves coming from the west and the
main directions turn first to the north and finally to the north‐east as we move southwards being the
northeast the main direction at model point number 3 (Figure 367) at the north of Canary Islands
As it has been said the wave conditions at coastal points are very much affected by the coast line and some
of them only represent very local wave climate
This is the case of the Tarifa buoy (Figure 365) in which there is no presence of waves coming from the
west while in model point number 13 (Figure 367) that is very close to the buoy the west is the main
direction It is well known that the wave climate at the Strait of Gibraltar has two main components from
the west and the east respectively as it is shown in the wave rose of point number 13 but the buoy is
protected from this direction by the coast line
Model points from 8 to 12 (Figure 367) represent the wave climate along the Moroccan coast It can be
seen that the main direction is the north‐west being more northern or western depending on the coast
orientation The most frequent significant wave heights are between 1 m and 3 m being a little bit lower at
points 11 and 12 because they are a little bit protected by San Vicente Cape
Additionally at the Canary Islands the wave climate is represented by the wave roses of Gran Canaria and
Tenerife buoys (Figure 366) and model points from 4 to 7 (Figure 367) In general it can be seen that the
main direction is north‐northeast but analysing each single case it depends very much on the point
location related with the different islands The most common significant wave height is between 1 m and 2
m that is lower than in the locations at open deep water or at the Moroccan coast because of the
protection provided by the Islands
IOC TECHNICAL SERIES No 115 pp 115‐131 URI httphdlhandlenet18349182 2015
123
Figure 365 Wave roses from Golfo de Caacutediz (left) and Tarifa (right) buoys (yellow dots)
Figure 366 Wave roses from Tenerife (left) and Gran Canaria (right) buoys (yellow dots)
Goacutemez M Peacuterez‐Goacutemez B De Alfonso M Peacuterez S and Ruiz M I Waves and tides in the CCLME
124
1 2
3 4
5 6 7
8 9 10
11 12 13
Figure 367 Wave roses of 13 model points representing different locations of the area of interest
1
2
3
4 5 6 7
8
9
10
11
12
13
IOC TECHNICAL SERIES No 115 pp 115‐131 URI httphdlhandlenet18349182 2015
125
The most extreme significant wave height ever registered by the 4 buoys and obtained at the 13 model
points per season are shown in Tables 364 and 365
Unfortunately some of the buoys have not always been directional buoys and the extreme events have
occurred in dates in which they were not so there is not information about the direction In these cases
directional information from the nearest wave model point was used to draw conclusions
It can be seen that as expected the highest extreme storms appear during the winter season Autumn and
spring seasons are very similar while the lowest extreme storms appear in summer This is valid not only for
the significant wave height but also for the peak period
The Golfo de Caacutediz buoy is an exception because the highest significant wave height was registered in
spring However it can be considered a rare event because taking a more general look of this buoy data
most of the highest storms appear during the winter season as in the other locations
There is more difference between one location and the others in winter being the climate more severe in
the North than in the South In summer the extreme wave climate is very similar at all the locations
Regarding the directions it can be seen that almost all the extreme events come from the north‐west
being slightly more western in winter than in summer
All the seasonal differences are more evident at the northern locations than at the southern ones
Table 364 The highest significant wave height (Hs) ever registered by the 4 buoys per season (W winter
Sp spring S summer A autumn) The corresponding peak period (Tp) direction and date are also shown
Number of station corresponds to the number on the map in Figure 361
Buoy Season Max Hs (m)
Tp(s)
Direction (0‐N90‐E)
Date(GMT)
Buoy Season Max Hs(m)
Tp(s)
Direction (0‐N90‐E)
Date(GMT)
1 Golfo de Caacutediz
W 62 107 ‐‐ 19971218 02h 3Tenerife W 48 94 ‐‐ 19990108 03h
Sp 66 150 ‐‐ 20030413 23h Sp 36 91 230 20130303 22h
S 35 85 ‐‐ 19970605 12h S 27 6478
90 107
20090725 02h20130807 01h
A 36 85 ‐‐ 19990919 13h A 32 94 ‐‐ 19981009 14h
2 Tarifa W 36 105 107 20100128 01h 4 Gran Canaria
W 57 135 ‐‐ 19990112 09h
Sp 33 90 107 20110405 22h Sp 52 98 ‐‐ 20010313 21h
S 18 71 83 20130625 07h S 38 85 ‐‐ 20000610 13h
A 29 89 105 20121108 10h A 55 166 337 2014 1129 06h
The extreme events have lower significant heights at the buoy locations than at the model points because
as it has been said in the previous section the sensors are placed relatively close to the coast so they are
protected by it On the other hand the locations in which the extreme storms are the highest are in the
model points 1 2 9 10 and 11 that as it can be seen in Figure 367 are the less protected by the coast
Goacutemez M Peacuterez‐Goacutemez B De Alfonso M Peacuterez S and Ruiz M I Waves and tides in the CCLME
126
Table 365 The highest significant wave height (Hs) ever got at each of the 13 the model points per season
(W winter Sp spring S summer A autumn) The corresponding peak period (Tp) direction and date are
also shown (number of station corresponds to the number on the map in Figure 367)
Point Season Max Hs (m)
Tp (s)
Direction (0‐N90‐E)
Date(GMT)
Point Season Max Hs(m)
Tp(s)
Direction (0‐N90‐E)
Date(GMT)
1 W 102 175 307 19730117 12h 8 W 88 183 322 19820112 15h
Sp 78 123 77 19550331 21h Sp 64 178 310 19910307 12h
S 43 93 357 19790816 00h S 47 108 357 19660611 00h
A 72 161 296 19821108 03h A 65 181 332 19621107 06h
2 W 86 180 288 19660221 03h 9 W 104 183 309 19820112 12h
Sp 67 153 299 19890409 09h Sp 73 179 301 19910307 06h
S 41 148 356 20080819 15h S 47 91 358 20120612 20h
A 62 151 308 20141129 05h A 75 181 323 19621107 03h
3 W 66 134 308 19891229 00h 10 W 96 183 290 19660221 00h
Sp 58 138 285 20130305 12h Sp 74 178 297 19910307 06h
S 33 90 38 20120712 10h S 37 134 322 19610601 00h
A 70 136 314 20141129 00h A 80 117 268 19891119 18h
4 W 58 180 314 19660221 06h 11 W 97 182 283 19660221 06h
Sp 54 135 290 20130305 04h Sp 73 177 290 19910307 09h
S 41 83 29 20120715 05h S 37 132 309 19610601 00h
A 60 142 321 20141129 06h A 83 159 293 19841105 06h
5 W 49 110 29 20140124 10h 12 W 81 172 293 19730117 21h
Sp 46 85 230 20130303 23h Sp 50 145 275 19910307 15h
S 33 88 28 20120612 02h S 26 143 296 19850601 09h
A 46 145 343 20141129 10h A 48 115 258 19821107 15h
6 W 63 122 319 19720223 06h 13 W 62 109 272 20130119 18h
Sp 45 189 353 20140304 11h Sp 48 112 257 20130306 08h
S 33 89 17 20120712 10h S 25 65 83 20130625 11h
A 63 146 326 20141129 10h A 40 91 81 20081011 00h
7 W 56 118 10 19940117 18h
Sp 52 112 22 19940403 09h
S 37 95 10 20070622 21h
A 46 149 319 20141129 16h
3642 Tides regime
The relative importance of the tide and the meteorological component was estimated by computing the
standard deviation of the tidal elevations and the meteorological component for the REDMAR stations
during the year 2012 (Figure 368 left) Examples of the probability density functions or histograms of both
components are also displayed in Figure 368 (right)
IOC TECHNICAL SERIES No 115 pp 115‐131 URI httphdlhandlenet18349182 2015
127
Figure 368 Left Standard deviation (Stdv) of the tide and the meteorological or residual component for
REDMAR tide gauges in the region (year 2012) Right From the top to the bottom tide and surge
histograms for Tarifa (Gulf of Cadiz) Arrecife (Lanzarote Eastern Canary Islands) and La Palma (Western
Canary Islands) (hourly data year 2012)
The amplitudes and phases of the main semidiurnal (M2 S2) and diurnal (O1 K1) constituents were compiled
in Table 366 not only for the REDMAR stations but also for the ones provided by other organizations The
period of data used for the computation is included as well as the Form Factor F obtained from the ratio of
the amplitudes of these main constituents
)()(
)()(
22
11
SAMA
KAOAF
The value of F is usually employed for tides classification (Pugh 1987) diurnal semidiurnal or mixed
Finally the spatial variation of the main tidal constituents is shown from COMAPI model at Figures 369
and 3610
The Form Factor values in Table 366 well below 25 for all the stations indicate a clear dominant
semidiurnal tide (two highs and two lows per day) in the Canary Current region from the Gulf of Cadiz up to
Mauritania This reflects in the two peaks observed in the tide histograms of Figure 368 (right) the most
probable levels being close to the mean high waters and mean low waters respectively This is coherent on
the other hand with the larger amplitudes of the semidiurnal constituents (M2 and S2) in Table 366 with
respect to the diurnal ones at all the stations we could compile
Station Tide Stdv (cm) Res Stdv (cm)
Bonanza 7048 648
Tarifa 3346 615
Tenerife 5595 388
Granadilla (Tenerife) 4973 944
La Palma 5199 391
La Gomera 4681 370
El Hierro 4747 400
Las Palmas (G C) 5925 419
Arinaga (G C) 5389 485
Fuerteventura 6406 344
Arrecife (Lanz) 6648 351
Goacutemez M Peacuterez‐Goacutemez B De Alfonso M Peacuterez S and Ruiz M I Waves and tides in the CCLME
128
Table 366 Amplitude and phase of the main semidiurnal and diurnal tidal constituents form factor (F)
and period of data for its computation REDMAR stations are shown in bold Harmonic constants provided
by other institutions for those stations shaded in grey
Station M2 S2 O1 K1 F Years Amp
(cm) Phase Lag
(o) Amp(cm)
Phase Lag (o)
Amp (cm)
Phase Lag (o)
Amp(cm)
Phase Lag (o)
Gulf of Cadiz
Bonanza 8987 6374 3089 9033 612 32258 615 6030 0102 2010‐2012 Caacutediz 9967 6513 3593 9282 660 30763 676 5128 0081 2013 Tarifa 4173 4163 1566 6888 048 12849 263 1295 0054 2010‐2012 Taacutenger (Morocco) 6832 6536 1792 7111 446 33613 658 6018 0128 2005
Canary Islands
Tenerife 7063 2892 2718 5261 469 29284 625 4032 0112 2010‐2012 Granadilla (Tenerife) 6130 2596 2463 4731 474 29226 595 4072 0124 2003‐2011 La Palma 6516 3030 2551 5296 458 29365 578 4164 0114 2007‐2012 La Gomera 5794 2358 2335 4592 434 29005 558 3297 0122 2007‐2012 El Hierro 5946 2123 2426 4376 430 29067 613 3233 0125 2010‐2012 Las Palmas (G Canaria) 7527 2838 2897 5317 488 29345 619 4005 0106 2008‐2012 Arinaga (Gran Canaria) 6808 2818 2664 5060 476 29233 604 3724 0114 2003‐2011 Fuerteventura 8089 3233 3053 5621 518 29434 614 3853 0102 2010‐2012 Arrecife (Lanzarote) 8423 3482 3173 5835 522 29599 684 4210 0104 2008‐2012
West Africa coast Ifni (Morocco) 9138 3847 4078 7655 353 27855 437 2901 0060 1949 C Bojador (W Sah) 6155 1865 3340 3824 398 28355 302 1575 0070 1948 Dakhla (W Sah) 6855 1130 1981 3347 374 27909 769 3513 0130 1949 Nouakchott (Maur) 4271 2898 1737 3000 425 ‐ 628 1504 0178 2007
The surge or residual component is small in this area (Figure 8 left) with larger standard deviation
(between 6‐7 cm) at the Gulf of Cadiz (higher latitudes more prompt to suffer the effect of storms) and
lower values at the Canary Islands stations (between 3‐5 cm) The small magnitude of the surge component
is also related to the narrow shelf especially at the Canary Islands We lack information concerning this
component of sea level along the coast of Africa where it is expected to be larger than in the Canary
Islands due to the broader continental shelf and the southern part of the CCLME Bonanza and Tarifa in
the Gulf of Cadiz are the stations with larger and lower amplitude of the tide respectively due to the
variability of M2 and S2 close to the Strait of Gibraltar as can be seen also in Figure 369 from COMAPI
model Maximum tidal ranges are around 15 m at Tarifa 35 m at Bonanza 25 m at La Palma and 32 m at
Lanzarote The relative importance of meteorological sea level at each station obtained as
Res_StdvTide_Stdv (Table enclosed in Figure 368) varies between the 184 of the tide at Tarifa due to
its small tide amplitude and the 5 at Arrecife
In the Canary Islands there is a longitudinal variation of the tide amplitude becoming larger for the four
main constituents in Table 366 as we move eastwards and approach the continental slope (African coast)
this can also be observed from the spatial variation of their amplitude in Figures 369 and 3610 for the
whole region This longitudinal variation is most evident in fact for the diurnal constituents (K1 and O1)
IOC TECHNICAL SERIES No 115 pp 115‐131 URI httphdlhandlenet18349182 2015
129
Figure 369 Spatial variation of amplitude and phase of M2 S2 and M4 harmonic constituents from the
COMAPI tidal atlas in the area of interest (resolution 1rsquotimes1rsquo)
M2
Amplitude (m)
M2
Phase lag (deg)
S2
Phase lag (deg)
S2
Amplitude (m)
M4
Amplitude (m)
M4
Phase lag (deg)
Goacutemez M Peacuterez‐Goacutemez B De Alfonso M Peacuterez S and Ruiz M I Waves and tides in the CCLME
130
In these figures it is also evident the significant decrease of the tide as we approach the Strait of Gibraltar
with respect to the surrounding Atlantic waters The phase lag of the main semidiurnal constituents
however presents a latitudinal variation (Figure 369 right) due to the propagation of the tidal waves from
South to North as a Kelvin wave (with larger amplitude close to the continental shelf)
The higher frequency tidal constituents (such as M4 and M6) are usually related to shallow waters non‐
linear effects This is why they are not important in the Canary Islands either (amplitudes less than 1 cm)
and their magnitude becomes significant at the Gulf of Cadiz (up to 5 cm of M4 amplitude in Bonanza and
47 cm in Tarifa) It should be taken into account that Bonanza station is at the mouth of the Guadalquivir
river so shallow water effects are even more important here For the stations along the west coast of
Africa provided by IHM the amplitude of M4 reaches also relatively higher values (3‐35 cm) the quality of
these tidal constants is not clear but the spatial variation observed from COMAPI tidal atlas reveals also a
coherent increase of the amplitude of this harmonic towards the shelf (Figure 369 bottom)
For all the mentioned constituents an increase of the amplitude of the tide is observed at the Western
Sahara coast north of Dakhla (around 245degN) most important for S2 and K1 Larger tidal amplitudes in the
region according to Figures 369 and 3610 are found along the Morocco coast This is not totally
coherent however with results from tide gauge observations in Table 366 which reflect as already
mentioned the larger tidal amplitudes at Bonanza and Caacutediz
Evaluation of the trends of the main harmonic constants in Las Palmas and Tenerife stations (not shown
see Peacuterez‐Goacutemez 2014 for details) do not reveal an increase on the tidal amplitude since 1992 Although
the time series is short this in principle does not confirm the increase of tidal amplitudes observed in other
regions of the world (Ray 2006 2009 Woodworth 2010) On the contrary only M2 presents a significant
negative trend at Las Palmas (Peacuterez‐Goacutemez 2014)
Figure 3610 Spatial variation of the amplitude of the main diurnal constituents (O1 and K1) from the
COMAPI tidal atlas in the area of interest (resolution 1rsquotimes1rsquo)
O1
Amplitude (m)
K1
Amplitude (m)
IOC TECHNICAL SERIES No 115 pp 115‐131 URI httphdlhandlenet18349182 2015
131
365 CONCLUSIONS AND RECOMMENDATIONS
Waves
Several wave climates exist in the area of interest The Strait of Gibraltar Gulf of Cadiz Moroccan Coast
and Canary Islands wave climates are well described by PdE buoys and models Golfo de Caacutediz buoy (Figure
365) and model points number 1 2 and 3 (Figure 367) represent open deep water conditions while the
other model points and buoys represent local conditions affected by the coastline South of 20deg
unfortunately there is no source of information on waves available
The most common significant wave height is between 1 m and 3 m being higher at northern locations and
decreasing as moving southwards In regard with the wave direction the Gulf of Cadiz is dominated by
waves coming from the west and the main directions turn first to the north and finally to the north‐east as
moving southwards to the Canary Islands
The highest extreme storms appear during the winter season This is valid not only for the significant wave
height but for the peak period too The climate is more severe in the north than in the south and the
extreme events come from the North West The extreme events are lowest at the locations close to the
coast because they are protected by it
Tides
With respect to the tide its variability has been reviewed based on the available tidal constants from tide
gauges in the region and the regional tidal atlas based on COMAPI model The type of tide is mainly
semidiurnal for the whole area with tidal ranges between 15 m and 35 m and with local variations
basically coherent between observations and the model The meteorological component of sea level is
relatively small with respect to the tide although we lack information from the African coast
The analysis has been made only for the area north of 225degN covered by COMAPI model In order to
complete the study the domain of this model should be extended to cover the whole region including
Senegal and Cape Verde There is also a significant lack of tide gauge observations in most of the countries
what would be crucial for detailed information of local tide conditions in the region
Acknowledgements
We would like to thank Mr Angora Aman (Laboratory of Atmospheric Physics and Fluid Mechanics Cote
drsquoIvoire) and Mr Salvador Moreno (IHM) for providing tidal constants information of several stations in the
African coast and Dr Florent Lyard (LEGOS) for providing the output of the new high resolution tidal atlas
based on the COMAPI model
Goacutemez M Peacuterez‐Goacutemez B De Alfonso M Peacuterez S and Ruiz M I Waves and tides in the CCLME
BIBLIOGRAPHY
Alfonso M Lopez J D Alvarez E and Ruiz M I 2005 Real time buoy data quality control and exploitation The Fifth COPRI International Conference on ocean Wave Measurement and Analysis (WAVES) Coasts Oceans Ports and Rivers Institute American Society of Civil Engineers Madrid
Aacutelvarez‐Fanjul E Peacuterez‐Goacutemez B and Rodriacuteguez I 2001 Nivmar a storm surge forecasting system for Spanish waters Scientia Marina Vol 65 pp 203‐212
Aacutelvarez‐Fanjul E Alfonso M Ruiz M I Lopez J D and Rodriguez I 2002 Real Time Monitoring of Spanish coastal waters The Deep Water Network Proceedings of the Third International Conference on EuroGOOS Athens Greece
Cancet M Lux M Peacutenard C Lyard F Birol F Lemouroux J Bourgogne S and Bronner E 2010 COMAPI New regional tide atlases and high frequency dynamical atmospheric correction Ocean Surface Topography Science Team meeting Lisbon Portugal 2010
Foreman F G G 1977 Manual for tidal heights analysis and predictions Pacific Marine Science Report 77‐10 Institute of Ocean Sciences Patricia Bay Sidney BC 58 pp (2004 revision)
Goacutemez‐Lahoz M and Carretero‐Albiach J C 2005 Wave Forecasting at the Spanish Coasts Journal of Atmospheric and Ocean Science Vol 10 (4) pp 389‐405
Peacuterez‐Goacutemez B 2014 Design and implementation of an operational sea level monitoring and forecasting system for the Spanish coast PhD Thesis Cantabria University Santander Spain 242 pp
Peacuterez‐Goacutemez B Aacutelvarez‐Fanjul E Peacuterez S de Alfonso M and Vela J 2013 Use of tide gauge data in operational oceanography and sea level hazard warning systems Journal of Operational Oceanography Vol 6 (2) pp 1‐18 doi 1010801755876X201311020147
Peacuterez‐Goacutemez B Payo A Loacutepez D Woodworth P L and Aacutelvarez‐Fanjul E 2014 Overlapping sea level time series measured using different technologies an example from the REDMAR Spanish network Natural Hazards and Earth System Science Vol 14 (3) pp 589‐610 doi105194nhess‐14‐589‐2014
Pugh D T 1987 Tides Surges and Mean Sea‐Level John Wiley amp Sons Ltd 472 pp
Ray R 2006 Secular changes of the M2 tide in the Gulf of Maine Continental Shelf Research Vol 26 (3) pp 422‐427
Ray R 2009 Secular changes in the solar semidiurnal tide of the western North Atlantic Ocean Geophysical Research Letters Vol 36 L19601
Tolman H L 1991 A third‐generation model for wind waves on slowly varying unsteady and inhomogeneous depths and currents Journal of Physical Oceanography Vol 21 pp 782‐797
WAMDI Group et al 1988 The WAM model a third‐generation ocean wave prediction model Journal of Physical Oceanography Vol 18 pp 1775‐1810
Woodworth P L 2010 A survey of recent changes in the main components of the ocean tide Continental Shelf Research Vol 30 (5) pp 1680‐1691
- IOCTS115-PRESENTATION 36 OK dots - revised -h
- IOCTS115-ARTICLE 36 - h
- IOCTS115-BIBLIOGRAPHY 36 OK DOIs - h
-
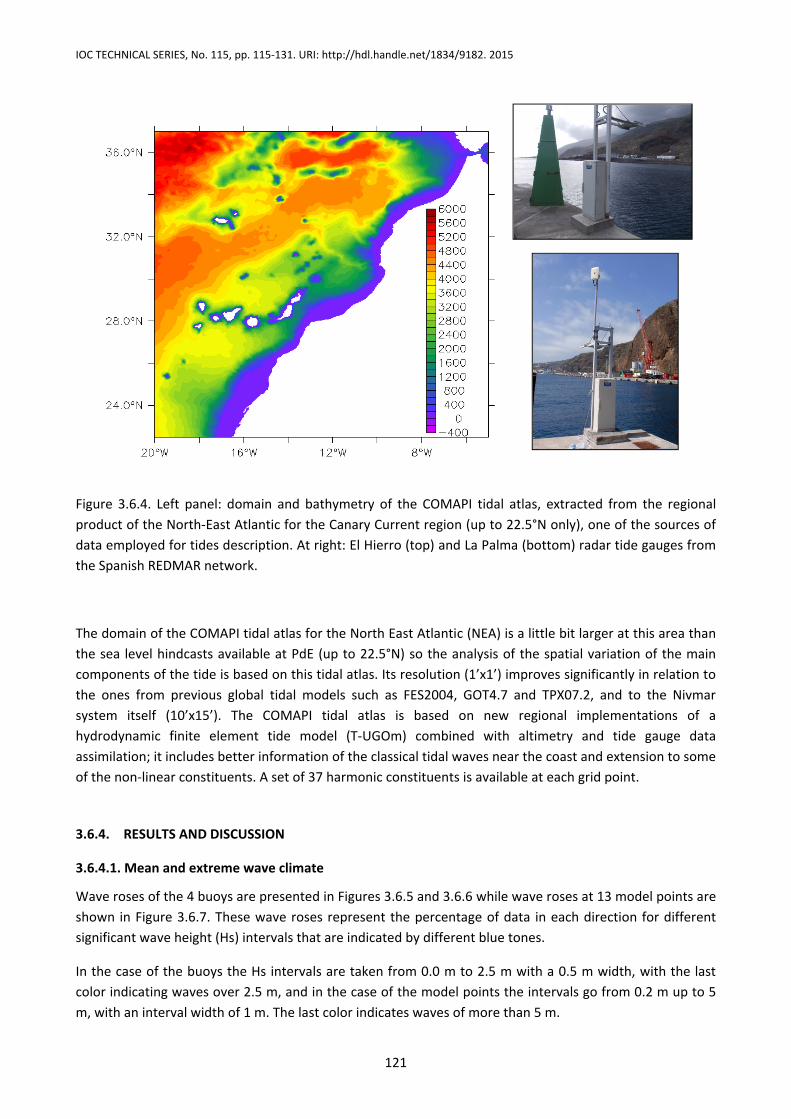
IOC TECHNICAL SERIES No 115 pp 115‐131 URI httphdlhandlenet18349182 2015
121
Figure 364 Left panel domain and bathymetry of the COMAPI tidal atlas extracted from the regional
product of the North‐East Atlantic for the Canary Current region (up to 225degN only) one of the sources of
data employed for tides description At right El Hierro (top) and La Palma (bottom) radar tide gauges from
the Spanish REDMAR network
The domain of the COMAPI tidal atlas for the North East Atlantic (NEA) is a little bit larger at this area than
the sea level hindcasts available at PdE (up to 225degN) so the analysis of the spatial variation of the main
components of the tide is based on this tidal atlas Its resolution (1rsquox1rsquo) improves significantly in relation to
the ones from previous global tidal models such as FES2004 GOT47 and TPX072 and to the Nivmar
system itself (10rsquox15rsquo) The COMAPI tidal atlas is based on new regional implementations of a
hydrodynamic finite element tide model (T‐UGOm) combined with altimetry and tide gauge data
assimilation it includes better information of the classical tidal waves near the coast and extension to some
of the non‐linear constituents A set of 37 harmonic constituents is available at each grid point
364 RESULTS AND DISCUSSION
3641 Mean and extreme wave climate
Wave roses of the 4 buoys are presented in Figures 365 and 366 while wave roses at 13 model points are
shown in Figure 367 These wave roses represent the percentage of data in each direction for different
significant wave height (Hs) intervals that are indicated by different blue tones
In the case of the buoys the Hs intervals are taken from 00 m to 25 m with a 05 m width with the last
color indicating waves over 25 m and in the case of the model points the intervals go from 02 m up to 5
m with an interval width of 1 m The last color indicates waves of more than 5 m
Goacutemez M Peacuterez‐Goacutemez B De Alfonso M Peacuterez S and Ruiz M I Waves and tides in the CCLME
122
Regarding the directional information sixteen directions have been considered that indicate the waves
incoming direction
These wave roses give a description of the mean wave climate in each area as they indicate the main
direction from which the waves come and the distribution of the significant wave height
It is important to distinguish between the wave roses that represent open deep water conditions from
those at coastal points that can be very much affected by the coast line This remark is especially
important at the Canary Islands where in general each location is affected by different islands
It can be said that the wave rose of Golfo de Caacutediz buoy (Figure 365) and of model points number 1 2 and
3 (Figure 367) represent open deep water conditions while the others represent coastal conditions
At open and deep water locations the most common wave height is between 1 m and 3 m being higher at
northern locations and decreasing as moving southwards
In regard with the wave direction the Gulf of Cadiz is dominated by waves coming from the west and the
main directions turn first to the north and finally to the north‐east as we move southwards being the
northeast the main direction at model point number 3 (Figure 367) at the north of Canary Islands
As it has been said the wave conditions at coastal points are very much affected by the coast line and some
of them only represent very local wave climate
This is the case of the Tarifa buoy (Figure 365) in which there is no presence of waves coming from the
west while in model point number 13 (Figure 367) that is very close to the buoy the west is the main
direction It is well known that the wave climate at the Strait of Gibraltar has two main components from
the west and the east respectively as it is shown in the wave rose of point number 13 but the buoy is
protected from this direction by the coast line
Model points from 8 to 12 (Figure 367) represent the wave climate along the Moroccan coast It can be
seen that the main direction is the north‐west being more northern or western depending on the coast
orientation The most frequent significant wave heights are between 1 m and 3 m being a little bit lower at
points 11 and 12 because they are a little bit protected by San Vicente Cape
Additionally at the Canary Islands the wave climate is represented by the wave roses of Gran Canaria and
Tenerife buoys (Figure 366) and model points from 4 to 7 (Figure 367) In general it can be seen that the
main direction is north‐northeast but analysing each single case it depends very much on the point
location related with the different islands The most common significant wave height is between 1 m and 2
m that is lower than in the locations at open deep water or at the Moroccan coast because of the
protection provided by the Islands
IOC TECHNICAL SERIES No 115 pp 115‐131 URI httphdlhandlenet18349182 2015
123
Figure 365 Wave roses from Golfo de Caacutediz (left) and Tarifa (right) buoys (yellow dots)
Figure 366 Wave roses from Tenerife (left) and Gran Canaria (right) buoys (yellow dots)
Goacutemez M Peacuterez‐Goacutemez B De Alfonso M Peacuterez S and Ruiz M I Waves and tides in the CCLME
124
1 2
3 4
5 6 7
8 9 10
11 12 13
Figure 367 Wave roses of 13 model points representing different locations of the area of interest
1
2
3
4 5 6 7
8
9
10
11
12
13
IOC TECHNICAL SERIES No 115 pp 115‐131 URI httphdlhandlenet18349182 2015
125
The most extreme significant wave height ever registered by the 4 buoys and obtained at the 13 model
points per season are shown in Tables 364 and 365
Unfortunately some of the buoys have not always been directional buoys and the extreme events have
occurred in dates in which they were not so there is not information about the direction In these cases
directional information from the nearest wave model point was used to draw conclusions
It can be seen that as expected the highest extreme storms appear during the winter season Autumn and
spring seasons are very similar while the lowest extreme storms appear in summer This is valid not only for
the significant wave height but also for the peak period
The Golfo de Caacutediz buoy is an exception because the highest significant wave height was registered in
spring However it can be considered a rare event because taking a more general look of this buoy data
most of the highest storms appear during the winter season as in the other locations
There is more difference between one location and the others in winter being the climate more severe in
the North than in the South In summer the extreme wave climate is very similar at all the locations
Regarding the directions it can be seen that almost all the extreme events come from the north‐west
being slightly more western in winter than in summer
All the seasonal differences are more evident at the northern locations than at the southern ones
Table 364 The highest significant wave height (Hs) ever registered by the 4 buoys per season (W winter
Sp spring S summer A autumn) The corresponding peak period (Tp) direction and date are also shown
Number of station corresponds to the number on the map in Figure 361
Buoy Season Max Hs (m)
Tp(s)
Direction (0‐N90‐E)
Date(GMT)
Buoy Season Max Hs(m)
Tp(s)
Direction (0‐N90‐E)
Date(GMT)
1 Golfo de Caacutediz
W 62 107 ‐‐ 19971218 02h 3Tenerife W 48 94 ‐‐ 19990108 03h
Sp 66 150 ‐‐ 20030413 23h Sp 36 91 230 20130303 22h
S 35 85 ‐‐ 19970605 12h S 27 6478
90 107
20090725 02h20130807 01h
A 36 85 ‐‐ 19990919 13h A 32 94 ‐‐ 19981009 14h
2 Tarifa W 36 105 107 20100128 01h 4 Gran Canaria
W 57 135 ‐‐ 19990112 09h
Sp 33 90 107 20110405 22h Sp 52 98 ‐‐ 20010313 21h
S 18 71 83 20130625 07h S 38 85 ‐‐ 20000610 13h
A 29 89 105 20121108 10h A 55 166 337 2014 1129 06h
The extreme events have lower significant heights at the buoy locations than at the model points because
as it has been said in the previous section the sensors are placed relatively close to the coast so they are
protected by it On the other hand the locations in which the extreme storms are the highest are in the
model points 1 2 9 10 and 11 that as it can be seen in Figure 367 are the less protected by the coast
Goacutemez M Peacuterez‐Goacutemez B De Alfonso M Peacuterez S and Ruiz M I Waves and tides in the CCLME
126
Table 365 The highest significant wave height (Hs) ever got at each of the 13 the model points per season
(W winter Sp spring S summer A autumn) The corresponding peak period (Tp) direction and date are
also shown (number of station corresponds to the number on the map in Figure 367)
Point Season Max Hs (m)
Tp (s)
Direction (0‐N90‐E)
Date(GMT)
Point Season Max Hs(m)
Tp(s)
Direction (0‐N90‐E)
Date(GMT)
1 W 102 175 307 19730117 12h 8 W 88 183 322 19820112 15h
Sp 78 123 77 19550331 21h Sp 64 178 310 19910307 12h
S 43 93 357 19790816 00h S 47 108 357 19660611 00h
A 72 161 296 19821108 03h A 65 181 332 19621107 06h
2 W 86 180 288 19660221 03h 9 W 104 183 309 19820112 12h
Sp 67 153 299 19890409 09h Sp 73 179 301 19910307 06h
S 41 148 356 20080819 15h S 47 91 358 20120612 20h
A 62 151 308 20141129 05h A 75 181 323 19621107 03h
3 W 66 134 308 19891229 00h 10 W 96 183 290 19660221 00h
Sp 58 138 285 20130305 12h Sp 74 178 297 19910307 06h
S 33 90 38 20120712 10h S 37 134 322 19610601 00h
A 70 136 314 20141129 00h A 80 117 268 19891119 18h
4 W 58 180 314 19660221 06h 11 W 97 182 283 19660221 06h
Sp 54 135 290 20130305 04h Sp 73 177 290 19910307 09h
S 41 83 29 20120715 05h S 37 132 309 19610601 00h
A 60 142 321 20141129 06h A 83 159 293 19841105 06h
5 W 49 110 29 20140124 10h 12 W 81 172 293 19730117 21h
Sp 46 85 230 20130303 23h Sp 50 145 275 19910307 15h
S 33 88 28 20120612 02h S 26 143 296 19850601 09h
A 46 145 343 20141129 10h A 48 115 258 19821107 15h
6 W 63 122 319 19720223 06h 13 W 62 109 272 20130119 18h
Sp 45 189 353 20140304 11h Sp 48 112 257 20130306 08h
S 33 89 17 20120712 10h S 25 65 83 20130625 11h
A 63 146 326 20141129 10h A 40 91 81 20081011 00h
7 W 56 118 10 19940117 18h
Sp 52 112 22 19940403 09h
S 37 95 10 20070622 21h
A 46 149 319 20141129 16h
3642 Tides regime
The relative importance of the tide and the meteorological component was estimated by computing the
standard deviation of the tidal elevations and the meteorological component for the REDMAR stations
during the year 2012 (Figure 368 left) Examples of the probability density functions or histograms of both
components are also displayed in Figure 368 (right)
IOC TECHNICAL SERIES No 115 pp 115‐131 URI httphdlhandlenet18349182 2015
127
Figure 368 Left Standard deviation (Stdv) of the tide and the meteorological or residual component for
REDMAR tide gauges in the region (year 2012) Right From the top to the bottom tide and surge
histograms for Tarifa (Gulf of Cadiz) Arrecife (Lanzarote Eastern Canary Islands) and La Palma (Western
Canary Islands) (hourly data year 2012)
The amplitudes and phases of the main semidiurnal (M2 S2) and diurnal (O1 K1) constituents were compiled
in Table 366 not only for the REDMAR stations but also for the ones provided by other organizations The
period of data used for the computation is included as well as the Form Factor F obtained from the ratio of
the amplitudes of these main constituents
)()(
)()(
22
11
SAMA
KAOAF
The value of F is usually employed for tides classification (Pugh 1987) diurnal semidiurnal or mixed
Finally the spatial variation of the main tidal constituents is shown from COMAPI model at Figures 369
and 3610
The Form Factor values in Table 366 well below 25 for all the stations indicate a clear dominant
semidiurnal tide (two highs and two lows per day) in the Canary Current region from the Gulf of Cadiz up to
Mauritania This reflects in the two peaks observed in the tide histograms of Figure 368 (right) the most
probable levels being close to the mean high waters and mean low waters respectively This is coherent on
the other hand with the larger amplitudes of the semidiurnal constituents (M2 and S2) in Table 366 with
respect to the diurnal ones at all the stations we could compile
Station Tide Stdv (cm) Res Stdv (cm)
Bonanza 7048 648
Tarifa 3346 615
Tenerife 5595 388
Granadilla (Tenerife) 4973 944
La Palma 5199 391
La Gomera 4681 370
El Hierro 4747 400
Las Palmas (G C) 5925 419
Arinaga (G C) 5389 485
Fuerteventura 6406 344
Arrecife (Lanz) 6648 351
Goacutemez M Peacuterez‐Goacutemez B De Alfonso M Peacuterez S and Ruiz M I Waves and tides in the CCLME
128
Table 366 Amplitude and phase of the main semidiurnal and diurnal tidal constituents form factor (F)
and period of data for its computation REDMAR stations are shown in bold Harmonic constants provided
by other institutions for those stations shaded in grey
Station M2 S2 O1 K1 F Years Amp
(cm) Phase Lag
(o) Amp(cm)
Phase Lag (o)
Amp (cm)
Phase Lag (o)
Amp(cm)
Phase Lag (o)
Gulf of Cadiz
Bonanza 8987 6374 3089 9033 612 32258 615 6030 0102 2010‐2012 Caacutediz 9967 6513 3593 9282 660 30763 676 5128 0081 2013 Tarifa 4173 4163 1566 6888 048 12849 263 1295 0054 2010‐2012 Taacutenger (Morocco) 6832 6536 1792 7111 446 33613 658 6018 0128 2005
Canary Islands
Tenerife 7063 2892 2718 5261 469 29284 625 4032 0112 2010‐2012 Granadilla (Tenerife) 6130 2596 2463 4731 474 29226 595 4072 0124 2003‐2011 La Palma 6516 3030 2551 5296 458 29365 578 4164 0114 2007‐2012 La Gomera 5794 2358 2335 4592 434 29005 558 3297 0122 2007‐2012 El Hierro 5946 2123 2426 4376 430 29067 613 3233 0125 2010‐2012 Las Palmas (G Canaria) 7527 2838 2897 5317 488 29345 619 4005 0106 2008‐2012 Arinaga (Gran Canaria) 6808 2818 2664 5060 476 29233 604 3724 0114 2003‐2011 Fuerteventura 8089 3233 3053 5621 518 29434 614 3853 0102 2010‐2012 Arrecife (Lanzarote) 8423 3482 3173 5835 522 29599 684 4210 0104 2008‐2012
West Africa coast Ifni (Morocco) 9138 3847 4078 7655 353 27855 437 2901 0060 1949 C Bojador (W Sah) 6155 1865 3340 3824 398 28355 302 1575 0070 1948 Dakhla (W Sah) 6855 1130 1981 3347 374 27909 769 3513 0130 1949 Nouakchott (Maur) 4271 2898 1737 3000 425 ‐ 628 1504 0178 2007
The surge or residual component is small in this area (Figure 8 left) with larger standard deviation
(between 6‐7 cm) at the Gulf of Cadiz (higher latitudes more prompt to suffer the effect of storms) and
lower values at the Canary Islands stations (between 3‐5 cm) The small magnitude of the surge component
is also related to the narrow shelf especially at the Canary Islands We lack information concerning this
component of sea level along the coast of Africa where it is expected to be larger than in the Canary
Islands due to the broader continental shelf and the southern part of the CCLME Bonanza and Tarifa in
the Gulf of Cadiz are the stations with larger and lower amplitude of the tide respectively due to the
variability of M2 and S2 close to the Strait of Gibraltar as can be seen also in Figure 369 from COMAPI
model Maximum tidal ranges are around 15 m at Tarifa 35 m at Bonanza 25 m at La Palma and 32 m at
Lanzarote The relative importance of meteorological sea level at each station obtained as
Res_StdvTide_Stdv (Table enclosed in Figure 368) varies between the 184 of the tide at Tarifa due to
its small tide amplitude and the 5 at Arrecife
In the Canary Islands there is a longitudinal variation of the tide amplitude becoming larger for the four
main constituents in Table 366 as we move eastwards and approach the continental slope (African coast)
this can also be observed from the spatial variation of their amplitude in Figures 369 and 3610 for the
whole region This longitudinal variation is most evident in fact for the diurnal constituents (K1 and O1)
IOC TECHNICAL SERIES No 115 pp 115‐131 URI httphdlhandlenet18349182 2015
129
Figure 369 Spatial variation of amplitude and phase of M2 S2 and M4 harmonic constituents from the
COMAPI tidal atlas in the area of interest (resolution 1rsquotimes1rsquo)
M2
Amplitude (m)
M2
Phase lag (deg)
S2
Phase lag (deg)
S2
Amplitude (m)
M4
Amplitude (m)
M4
Phase lag (deg)
Goacutemez M Peacuterez‐Goacutemez B De Alfonso M Peacuterez S and Ruiz M I Waves and tides in the CCLME
130
In these figures it is also evident the significant decrease of the tide as we approach the Strait of Gibraltar
with respect to the surrounding Atlantic waters The phase lag of the main semidiurnal constituents
however presents a latitudinal variation (Figure 369 right) due to the propagation of the tidal waves from
South to North as a Kelvin wave (with larger amplitude close to the continental shelf)
The higher frequency tidal constituents (such as M4 and M6) are usually related to shallow waters non‐
linear effects This is why they are not important in the Canary Islands either (amplitudes less than 1 cm)
and their magnitude becomes significant at the Gulf of Cadiz (up to 5 cm of M4 amplitude in Bonanza and
47 cm in Tarifa) It should be taken into account that Bonanza station is at the mouth of the Guadalquivir
river so shallow water effects are even more important here For the stations along the west coast of
Africa provided by IHM the amplitude of M4 reaches also relatively higher values (3‐35 cm) the quality of
these tidal constants is not clear but the spatial variation observed from COMAPI tidal atlas reveals also a
coherent increase of the amplitude of this harmonic towards the shelf (Figure 369 bottom)
For all the mentioned constituents an increase of the amplitude of the tide is observed at the Western
Sahara coast north of Dakhla (around 245degN) most important for S2 and K1 Larger tidal amplitudes in the
region according to Figures 369 and 3610 are found along the Morocco coast This is not totally
coherent however with results from tide gauge observations in Table 366 which reflect as already
mentioned the larger tidal amplitudes at Bonanza and Caacutediz
Evaluation of the trends of the main harmonic constants in Las Palmas and Tenerife stations (not shown
see Peacuterez‐Goacutemez 2014 for details) do not reveal an increase on the tidal amplitude since 1992 Although
the time series is short this in principle does not confirm the increase of tidal amplitudes observed in other
regions of the world (Ray 2006 2009 Woodworth 2010) On the contrary only M2 presents a significant
negative trend at Las Palmas (Peacuterez‐Goacutemez 2014)
Figure 3610 Spatial variation of the amplitude of the main diurnal constituents (O1 and K1) from the
COMAPI tidal atlas in the area of interest (resolution 1rsquotimes1rsquo)
O1
Amplitude (m)
K1
Amplitude (m)
IOC TECHNICAL SERIES No 115 pp 115‐131 URI httphdlhandlenet18349182 2015
131
365 CONCLUSIONS AND RECOMMENDATIONS
Waves
Several wave climates exist in the area of interest The Strait of Gibraltar Gulf of Cadiz Moroccan Coast
and Canary Islands wave climates are well described by PdE buoys and models Golfo de Caacutediz buoy (Figure
365) and model points number 1 2 and 3 (Figure 367) represent open deep water conditions while the
other model points and buoys represent local conditions affected by the coastline South of 20deg
unfortunately there is no source of information on waves available
The most common significant wave height is between 1 m and 3 m being higher at northern locations and
decreasing as moving southwards In regard with the wave direction the Gulf of Cadiz is dominated by
waves coming from the west and the main directions turn first to the north and finally to the north‐east as
moving southwards to the Canary Islands
The highest extreme storms appear during the winter season This is valid not only for the significant wave
height but for the peak period too The climate is more severe in the north than in the south and the
extreme events come from the North West The extreme events are lowest at the locations close to the
coast because they are protected by it
Tides
With respect to the tide its variability has been reviewed based on the available tidal constants from tide
gauges in the region and the regional tidal atlas based on COMAPI model The type of tide is mainly
semidiurnal for the whole area with tidal ranges between 15 m and 35 m and with local variations
basically coherent between observations and the model The meteorological component of sea level is
relatively small with respect to the tide although we lack information from the African coast
The analysis has been made only for the area north of 225degN covered by COMAPI model In order to
complete the study the domain of this model should be extended to cover the whole region including
Senegal and Cape Verde There is also a significant lack of tide gauge observations in most of the countries
what would be crucial for detailed information of local tide conditions in the region
Acknowledgements
We would like to thank Mr Angora Aman (Laboratory of Atmospheric Physics and Fluid Mechanics Cote
drsquoIvoire) and Mr Salvador Moreno (IHM) for providing tidal constants information of several stations in the
African coast and Dr Florent Lyard (LEGOS) for providing the output of the new high resolution tidal atlas
based on the COMAPI model
Goacutemez M Peacuterez‐Goacutemez B De Alfonso M Peacuterez S and Ruiz M I Waves and tides in the CCLME
BIBLIOGRAPHY
Alfonso M Lopez J D Alvarez E and Ruiz M I 2005 Real time buoy data quality control and exploitation The Fifth COPRI International Conference on ocean Wave Measurement and Analysis (WAVES) Coasts Oceans Ports and Rivers Institute American Society of Civil Engineers Madrid
Aacutelvarez‐Fanjul E Peacuterez‐Goacutemez B and Rodriacuteguez I 2001 Nivmar a storm surge forecasting system for Spanish waters Scientia Marina Vol 65 pp 203‐212
Aacutelvarez‐Fanjul E Alfonso M Ruiz M I Lopez J D and Rodriguez I 2002 Real Time Monitoring of Spanish coastal waters The Deep Water Network Proceedings of the Third International Conference on EuroGOOS Athens Greece
Cancet M Lux M Peacutenard C Lyard F Birol F Lemouroux J Bourgogne S and Bronner E 2010 COMAPI New regional tide atlases and high frequency dynamical atmospheric correction Ocean Surface Topography Science Team meeting Lisbon Portugal 2010
Foreman F G G 1977 Manual for tidal heights analysis and predictions Pacific Marine Science Report 77‐10 Institute of Ocean Sciences Patricia Bay Sidney BC 58 pp (2004 revision)
Goacutemez‐Lahoz M and Carretero‐Albiach J C 2005 Wave Forecasting at the Spanish Coasts Journal of Atmospheric and Ocean Science Vol 10 (4) pp 389‐405
Peacuterez‐Goacutemez B 2014 Design and implementation of an operational sea level monitoring and forecasting system for the Spanish coast PhD Thesis Cantabria University Santander Spain 242 pp
Peacuterez‐Goacutemez B Aacutelvarez‐Fanjul E Peacuterez S de Alfonso M and Vela J 2013 Use of tide gauge data in operational oceanography and sea level hazard warning systems Journal of Operational Oceanography Vol 6 (2) pp 1‐18 doi 1010801755876X201311020147
Peacuterez‐Goacutemez B Payo A Loacutepez D Woodworth P L and Aacutelvarez‐Fanjul E 2014 Overlapping sea level time series measured using different technologies an example from the REDMAR Spanish network Natural Hazards and Earth System Science Vol 14 (3) pp 589‐610 doi105194nhess‐14‐589‐2014
Pugh D T 1987 Tides Surges and Mean Sea‐Level John Wiley amp Sons Ltd 472 pp
Ray R 2006 Secular changes of the M2 tide in the Gulf of Maine Continental Shelf Research Vol 26 (3) pp 422‐427
Ray R 2009 Secular changes in the solar semidiurnal tide of the western North Atlantic Ocean Geophysical Research Letters Vol 36 L19601
Tolman H L 1991 A third‐generation model for wind waves on slowly varying unsteady and inhomogeneous depths and currents Journal of Physical Oceanography Vol 21 pp 782‐797
WAMDI Group et al 1988 The WAM model a third‐generation ocean wave prediction model Journal of Physical Oceanography Vol 18 pp 1775‐1810
Woodworth P L 2010 A survey of recent changes in the main components of the ocean tide Continental Shelf Research Vol 30 (5) pp 1680‐1691
- IOCTS115-PRESENTATION 36 OK dots - revised -h
- IOCTS115-ARTICLE 36 - h
- IOCTS115-BIBLIOGRAPHY 36 OK DOIs - h
-

Goacutemez M Peacuterez‐Goacutemez B De Alfonso M Peacuterez S and Ruiz M I Waves and tides in the CCLME
122
Regarding the directional information sixteen directions have been considered that indicate the waves
incoming direction
These wave roses give a description of the mean wave climate in each area as they indicate the main
direction from which the waves come and the distribution of the significant wave height
It is important to distinguish between the wave roses that represent open deep water conditions from
those at coastal points that can be very much affected by the coast line This remark is especially
important at the Canary Islands where in general each location is affected by different islands
It can be said that the wave rose of Golfo de Caacutediz buoy (Figure 365) and of model points number 1 2 and
3 (Figure 367) represent open deep water conditions while the others represent coastal conditions
At open and deep water locations the most common wave height is between 1 m and 3 m being higher at
northern locations and decreasing as moving southwards
In regard with the wave direction the Gulf of Cadiz is dominated by waves coming from the west and the
main directions turn first to the north and finally to the north‐east as we move southwards being the
northeast the main direction at model point number 3 (Figure 367) at the north of Canary Islands
As it has been said the wave conditions at coastal points are very much affected by the coast line and some
of them only represent very local wave climate
This is the case of the Tarifa buoy (Figure 365) in which there is no presence of waves coming from the
west while in model point number 13 (Figure 367) that is very close to the buoy the west is the main
direction It is well known that the wave climate at the Strait of Gibraltar has two main components from
the west and the east respectively as it is shown in the wave rose of point number 13 but the buoy is
protected from this direction by the coast line
Model points from 8 to 12 (Figure 367) represent the wave climate along the Moroccan coast It can be
seen that the main direction is the north‐west being more northern or western depending on the coast
orientation The most frequent significant wave heights are between 1 m and 3 m being a little bit lower at
points 11 and 12 because they are a little bit protected by San Vicente Cape
Additionally at the Canary Islands the wave climate is represented by the wave roses of Gran Canaria and
Tenerife buoys (Figure 366) and model points from 4 to 7 (Figure 367) In general it can be seen that the
main direction is north‐northeast but analysing each single case it depends very much on the point
location related with the different islands The most common significant wave height is between 1 m and 2
m that is lower than in the locations at open deep water or at the Moroccan coast because of the
protection provided by the Islands
IOC TECHNICAL SERIES No 115 pp 115‐131 URI httphdlhandlenet18349182 2015
123
Figure 365 Wave roses from Golfo de Caacutediz (left) and Tarifa (right) buoys (yellow dots)
Figure 366 Wave roses from Tenerife (left) and Gran Canaria (right) buoys (yellow dots)
Goacutemez M Peacuterez‐Goacutemez B De Alfonso M Peacuterez S and Ruiz M I Waves and tides in the CCLME
124
1 2
3 4
5 6 7
8 9 10
11 12 13
Figure 367 Wave roses of 13 model points representing different locations of the area of interest
1
2
3
4 5 6 7
8
9
10
11
12
13
IOC TECHNICAL SERIES No 115 pp 115‐131 URI httphdlhandlenet18349182 2015
125
The most extreme significant wave height ever registered by the 4 buoys and obtained at the 13 model
points per season are shown in Tables 364 and 365
Unfortunately some of the buoys have not always been directional buoys and the extreme events have
occurred in dates in which they were not so there is not information about the direction In these cases
directional information from the nearest wave model point was used to draw conclusions
It can be seen that as expected the highest extreme storms appear during the winter season Autumn and
spring seasons are very similar while the lowest extreme storms appear in summer This is valid not only for
the significant wave height but also for the peak period
The Golfo de Caacutediz buoy is an exception because the highest significant wave height was registered in
spring However it can be considered a rare event because taking a more general look of this buoy data
most of the highest storms appear during the winter season as in the other locations
There is more difference between one location and the others in winter being the climate more severe in
the North than in the South In summer the extreme wave climate is very similar at all the locations
Regarding the directions it can be seen that almost all the extreme events come from the north‐west
being slightly more western in winter than in summer
All the seasonal differences are more evident at the northern locations than at the southern ones
Table 364 The highest significant wave height (Hs) ever registered by the 4 buoys per season (W winter
Sp spring S summer A autumn) The corresponding peak period (Tp) direction and date are also shown
Number of station corresponds to the number on the map in Figure 361
Buoy Season Max Hs (m)
Tp(s)
Direction (0‐N90‐E)
Date(GMT)
Buoy Season Max Hs(m)
Tp(s)
Direction (0‐N90‐E)
Date(GMT)
1 Golfo de Caacutediz
W 62 107 ‐‐ 19971218 02h 3Tenerife W 48 94 ‐‐ 19990108 03h
Sp 66 150 ‐‐ 20030413 23h Sp 36 91 230 20130303 22h
S 35 85 ‐‐ 19970605 12h S 27 6478
90 107
20090725 02h20130807 01h
A 36 85 ‐‐ 19990919 13h A 32 94 ‐‐ 19981009 14h
2 Tarifa W 36 105 107 20100128 01h 4 Gran Canaria
W 57 135 ‐‐ 19990112 09h
Sp 33 90 107 20110405 22h Sp 52 98 ‐‐ 20010313 21h
S 18 71 83 20130625 07h S 38 85 ‐‐ 20000610 13h
A 29 89 105 20121108 10h A 55 166 337 2014 1129 06h
The extreme events have lower significant heights at the buoy locations than at the model points because
as it has been said in the previous section the sensors are placed relatively close to the coast so they are
protected by it On the other hand the locations in which the extreme storms are the highest are in the
model points 1 2 9 10 and 11 that as it can be seen in Figure 367 are the less protected by the coast
Goacutemez M Peacuterez‐Goacutemez B De Alfonso M Peacuterez S and Ruiz M I Waves and tides in the CCLME
126
Table 365 The highest significant wave height (Hs) ever got at each of the 13 the model points per season
(W winter Sp spring S summer A autumn) The corresponding peak period (Tp) direction and date are
also shown (number of station corresponds to the number on the map in Figure 367)
Point Season Max Hs (m)
Tp (s)
Direction (0‐N90‐E)
Date(GMT)
Point Season Max Hs(m)
Tp(s)
Direction (0‐N90‐E)
Date(GMT)
1 W 102 175 307 19730117 12h 8 W 88 183 322 19820112 15h
Sp 78 123 77 19550331 21h Sp 64 178 310 19910307 12h
S 43 93 357 19790816 00h S 47 108 357 19660611 00h
A 72 161 296 19821108 03h A 65 181 332 19621107 06h
2 W 86 180 288 19660221 03h 9 W 104 183 309 19820112 12h
Sp 67 153 299 19890409 09h Sp 73 179 301 19910307 06h
S 41 148 356 20080819 15h S 47 91 358 20120612 20h
A 62 151 308 20141129 05h A 75 181 323 19621107 03h
3 W 66 134 308 19891229 00h 10 W 96 183 290 19660221 00h
Sp 58 138 285 20130305 12h Sp 74 178 297 19910307 06h
S 33 90 38 20120712 10h S 37 134 322 19610601 00h
A 70 136 314 20141129 00h A 80 117 268 19891119 18h
4 W 58 180 314 19660221 06h 11 W 97 182 283 19660221 06h
Sp 54 135 290 20130305 04h Sp 73 177 290 19910307 09h
S 41 83 29 20120715 05h S 37 132 309 19610601 00h
A 60 142 321 20141129 06h A 83 159 293 19841105 06h
5 W 49 110 29 20140124 10h 12 W 81 172 293 19730117 21h
Sp 46 85 230 20130303 23h Sp 50 145 275 19910307 15h
S 33 88 28 20120612 02h S 26 143 296 19850601 09h
A 46 145 343 20141129 10h A 48 115 258 19821107 15h
6 W 63 122 319 19720223 06h 13 W 62 109 272 20130119 18h
Sp 45 189 353 20140304 11h Sp 48 112 257 20130306 08h
S 33 89 17 20120712 10h S 25 65 83 20130625 11h
A 63 146 326 20141129 10h A 40 91 81 20081011 00h
7 W 56 118 10 19940117 18h
Sp 52 112 22 19940403 09h
S 37 95 10 20070622 21h
A 46 149 319 20141129 16h
3642 Tides regime
The relative importance of the tide and the meteorological component was estimated by computing the
standard deviation of the tidal elevations and the meteorological component for the REDMAR stations
during the year 2012 (Figure 368 left) Examples of the probability density functions or histograms of both
components are also displayed in Figure 368 (right)
IOC TECHNICAL SERIES No 115 pp 115‐131 URI httphdlhandlenet18349182 2015
127
Figure 368 Left Standard deviation (Stdv) of the tide and the meteorological or residual component for
REDMAR tide gauges in the region (year 2012) Right From the top to the bottom tide and surge
histograms for Tarifa (Gulf of Cadiz) Arrecife (Lanzarote Eastern Canary Islands) and La Palma (Western
Canary Islands) (hourly data year 2012)
The amplitudes and phases of the main semidiurnal (M2 S2) and diurnal (O1 K1) constituents were compiled
in Table 366 not only for the REDMAR stations but also for the ones provided by other organizations The
period of data used for the computation is included as well as the Form Factor F obtained from the ratio of
the amplitudes of these main constituents
)()(
)()(
22
11
SAMA
KAOAF
The value of F is usually employed for tides classification (Pugh 1987) diurnal semidiurnal or mixed
Finally the spatial variation of the main tidal constituents is shown from COMAPI model at Figures 369
and 3610
The Form Factor values in Table 366 well below 25 for all the stations indicate a clear dominant
semidiurnal tide (two highs and two lows per day) in the Canary Current region from the Gulf of Cadiz up to
Mauritania This reflects in the two peaks observed in the tide histograms of Figure 368 (right) the most
probable levels being close to the mean high waters and mean low waters respectively This is coherent on
the other hand with the larger amplitudes of the semidiurnal constituents (M2 and S2) in Table 366 with
respect to the diurnal ones at all the stations we could compile
Station Tide Stdv (cm) Res Stdv (cm)
Bonanza 7048 648
Tarifa 3346 615
Tenerife 5595 388
Granadilla (Tenerife) 4973 944
La Palma 5199 391
La Gomera 4681 370
El Hierro 4747 400
Las Palmas (G C) 5925 419
Arinaga (G C) 5389 485
Fuerteventura 6406 344
Arrecife (Lanz) 6648 351
Goacutemez M Peacuterez‐Goacutemez B De Alfonso M Peacuterez S and Ruiz M I Waves and tides in the CCLME
128
Table 366 Amplitude and phase of the main semidiurnal and diurnal tidal constituents form factor (F)
and period of data for its computation REDMAR stations are shown in bold Harmonic constants provided
by other institutions for those stations shaded in grey
Station M2 S2 O1 K1 F Years Amp
(cm) Phase Lag
(o) Amp(cm)
Phase Lag (o)
Amp (cm)
Phase Lag (o)
Amp(cm)
Phase Lag (o)
Gulf of Cadiz
Bonanza 8987 6374 3089 9033 612 32258 615 6030 0102 2010‐2012 Caacutediz 9967 6513 3593 9282 660 30763 676 5128 0081 2013 Tarifa 4173 4163 1566 6888 048 12849 263 1295 0054 2010‐2012 Taacutenger (Morocco) 6832 6536 1792 7111 446 33613 658 6018 0128 2005
Canary Islands
Tenerife 7063 2892 2718 5261 469 29284 625 4032 0112 2010‐2012 Granadilla (Tenerife) 6130 2596 2463 4731 474 29226 595 4072 0124 2003‐2011 La Palma 6516 3030 2551 5296 458 29365 578 4164 0114 2007‐2012 La Gomera 5794 2358 2335 4592 434 29005 558 3297 0122 2007‐2012 El Hierro 5946 2123 2426 4376 430 29067 613 3233 0125 2010‐2012 Las Palmas (G Canaria) 7527 2838 2897 5317 488 29345 619 4005 0106 2008‐2012 Arinaga (Gran Canaria) 6808 2818 2664 5060 476 29233 604 3724 0114 2003‐2011 Fuerteventura 8089 3233 3053 5621 518 29434 614 3853 0102 2010‐2012 Arrecife (Lanzarote) 8423 3482 3173 5835 522 29599 684 4210 0104 2008‐2012
West Africa coast Ifni (Morocco) 9138 3847 4078 7655 353 27855 437 2901 0060 1949 C Bojador (W Sah) 6155 1865 3340 3824 398 28355 302 1575 0070 1948 Dakhla (W Sah) 6855 1130 1981 3347 374 27909 769 3513 0130 1949 Nouakchott (Maur) 4271 2898 1737 3000 425 ‐ 628 1504 0178 2007
The surge or residual component is small in this area (Figure 8 left) with larger standard deviation
(between 6‐7 cm) at the Gulf of Cadiz (higher latitudes more prompt to suffer the effect of storms) and
lower values at the Canary Islands stations (between 3‐5 cm) The small magnitude of the surge component
is also related to the narrow shelf especially at the Canary Islands We lack information concerning this
component of sea level along the coast of Africa where it is expected to be larger than in the Canary
Islands due to the broader continental shelf and the southern part of the CCLME Bonanza and Tarifa in
the Gulf of Cadiz are the stations with larger and lower amplitude of the tide respectively due to the
variability of M2 and S2 close to the Strait of Gibraltar as can be seen also in Figure 369 from COMAPI
model Maximum tidal ranges are around 15 m at Tarifa 35 m at Bonanza 25 m at La Palma and 32 m at
Lanzarote The relative importance of meteorological sea level at each station obtained as
Res_StdvTide_Stdv (Table enclosed in Figure 368) varies between the 184 of the tide at Tarifa due to
its small tide amplitude and the 5 at Arrecife
In the Canary Islands there is a longitudinal variation of the tide amplitude becoming larger for the four
main constituents in Table 366 as we move eastwards and approach the continental slope (African coast)
this can also be observed from the spatial variation of their amplitude in Figures 369 and 3610 for the
whole region This longitudinal variation is most evident in fact for the diurnal constituents (K1 and O1)
IOC TECHNICAL SERIES No 115 pp 115‐131 URI httphdlhandlenet18349182 2015
129
Figure 369 Spatial variation of amplitude and phase of M2 S2 and M4 harmonic constituents from the
COMAPI tidal atlas in the area of interest (resolution 1rsquotimes1rsquo)
M2
Amplitude (m)
M2
Phase lag (deg)
S2
Phase lag (deg)
S2
Amplitude (m)
M4
Amplitude (m)
M4
Phase lag (deg)
Goacutemez M Peacuterez‐Goacutemez B De Alfonso M Peacuterez S and Ruiz M I Waves and tides in the CCLME
130
In these figures it is also evident the significant decrease of the tide as we approach the Strait of Gibraltar
with respect to the surrounding Atlantic waters The phase lag of the main semidiurnal constituents
however presents a latitudinal variation (Figure 369 right) due to the propagation of the tidal waves from
South to North as a Kelvin wave (with larger amplitude close to the continental shelf)
The higher frequency tidal constituents (such as M4 and M6) are usually related to shallow waters non‐
linear effects This is why they are not important in the Canary Islands either (amplitudes less than 1 cm)
and their magnitude becomes significant at the Gulf of Cadiz (up to 5 cm of M4 amplitude in Bonanza and
47 cm in Tarifa) It should be taken into account that Bonanza station is at the mouth of the Guadalquivir
river so shallow water effects are even more important here For the stations along the west coast of
Africa provided by IHM the amplitude of M4 reaches also relatively higher values (3‐35 cm) the quality of
these tidal constants is not clear but the spatial variation observed from COMAPI tidal atlas reveals also a
coherent increase of the amplitude of this harmonic towards the shelf (Figure 369 bottom)
For all the mentioned constituents an increase of the amplitude of the tide is observed at the Western
Sahara coast north of Dakhla (around 245degN) most important for S2 and K1 Larger tidal amplitudes in the
region according to Figures 369 and 3610 are found along the Morocco coast This is not totally
coherent however with results from tide gauge observations in Table 366 which reflect as already
mentioned the larger tidal amplitudes at Bonanza and Caacutediz
Evaluation of the trends of the main harmonic constants in Las Palmas and Tenerife stations (not shown
see Peacuterez‐Goacutemez 2014 for details) do not reveal an increase on the tidal amplitude since 1992 Although
the time series is short this in principle does not confirm the increase of tidal amplitudes observed in other
regions of the world (Ray 2006 2009 Woodworth 2010) On the contrary only M2 presents a significant
negative trend at Las Palmas (Peacuterez‐Goacutemez 2014)
Figure 3610 Spatial variation of the amplitude of the main diurnal constituents (O1 and K1) from the
COMAPI tidal atlas in the area of interest (resolution 1rsquotimes1rsquo)
O1
Amplitude (m)
K1
Amplitude (m)
IOC TECHNICAL SERIES No 115 pp 115‐131 URI httphdlhandlenet18349182 2015
131
365 CONCLUSIONS AND RECOMMENDATIONS
Waves
Several wave climates exist in the area of interest The Strait of Gibraltar Gulf of Cadiz Moroccan Coast
and Canary Islands wave climates are well described by PdE buoys and models Golfo de Caacutediz buoy (Figure
365) and model points number 1 2 and 3 (Figure 367) represent open deep water conditions while the
other model points and buoys represent local conditions affected by the coastline South of 20deg
unfortunately there is no source of information on waves available
The most common significant wave height is between 1 m and 3 m being higher at northern locations and
decreasing as moving southwards In regard with the wave direction the Gulf of Cadiz is dominated by
waves coming from the west and the main directions turn first to the north and finally to the north‐east as
moving southwards to the Canary Islands
The highest extreme storms appear during the winter season This is valid not only for the significant wave
height but for the peak period too The climate is more severe in the north than in the south and the
extreme events come from the North West The extreme events are lowest at the locations close to the
coast because they are protected by it
Tides
With respect to the tide its variability has been reviewed based on the available tidal constants from tide
gauges in the region and the regional tidal atlas based on COMAPI model The type of tide is mainly
semidiurnal for the whole area with tidal ranges between 15 m and 35 m and with local variations
basically coherent between observations and the model The meteorological component of sea level is
relatively small with respect to the tide although we lack information from the African coast
The analysis has been made only for the area north of 225degN covered by COMAPI model In order to
complete the study the domain of this model should be extended to cover the whole region including
Senegal and Cape Verde There is also a significant lack of tide gauge observations in most of the countries
what would be crucial for detailed information of local tide conditions in the region
Acknowledgements
We would like to thank Mr Angora Aman (Laboratory of Atmospheric Physics and Fluid Mechanics Cote
drsquoIvoire) and Mr Salvador Moreno (IHM) for providing tidal constants information of several stations in the
African coast and Dr Florent Lyard (LEGOS) for providing the output of the new high resolution tidal atlas
based on the COMAPI model
Goacutemez M Peacuterez‐Goacutemez B De Alfonso M Peacuterez S and Ruiz M I Waves and tides in the CCLME
BIBLIOGRAPHY
Alfonso M Lopez J D Alvarez E and Ruiz M I 2005 Real time buoy data quality control and exploitation The Fifth COPRI International Conference on ocean Wave Measurement and Analysis (WAVES) Coasts Oceans Ports and Rivers Institute American Society of Civil Engineers Madrid
Aacutelvarez‐Fanjul E Peacuterez‐Goacutemez B and Rodriacuteguez I 2001 Nivmar a storm surge forecasting system for Spanish waters Scientia Marina Vol 65 pp 203‐212
Aacutelvarez‐Fanjul E Alfonso M Ruiz M I Lopez J D and Rodriguez I 2002 Real Time Monitoring of Spanish coastal waters The Deep Water Network Proceedings of the Third International Conference on EuroGOOS Athens Greece
Cancet M Lux M Peacutenard C Lyard F Birol F Lemouroux J Bourgogne S and Bronner E 2010 COMAPI New regional tide atlases and high frequency dynamical atmospheric correction Ocean Surface Topography Science Team meeting Lisbon Portugal 2010
Foreman F G G 1977 Manual for tidal heights analysis and predictions Pacific Marine Science Report 77‐10 Institute of Ocean Sciences Patricia Bay Sidney BC 58 pp (2004 revision)
Goacutemez‐Lahoz M and Carretero‐Albiach J C 2005 Wave Forecasting at the Spanish Coasts Journal of Atmospheric and Ocean Science Vol 10 (4) pp 389‐405
Peacuterez‐Goacutemez B 2014 Design and implementation of an operational sea level monitoring and forecasting system for the Spanish coast PhD Thesis Cantabria University Santander Spain 242 pp
Peacuterez‐Goacutemez B Aacutelvarez‐Fanjul E Peacuterez S de Alfonso M and Vela J 2013 Use of tide gauge data in operational oceanography and sea level hazard warning systems Journal of Operational Oceanography Vol 6 (2) pp 1‐18 doi 1010801755876X201311020147
Peacuterez‐Goacutemez B Payo A Loacutepez D Woodworth P L and Aacutelvarez‐Fanjul E 2014 Overlapping sea level time series measured using different technologies an example from the REDMAR Spanish network Natural Hazards and Earth System Science Vol 14 (3) pp 589‐610 doi105194nhess‐14‐589‐2014
Pugh D T 1987 Tides Surges and Mean Sea‐Level John Wiley amp Sons Ltd 472 pp
Ray R 2006 Secular changes of the M2 tide in the Gulf of Maine Continental Shelf Research Vol 26 (3) pp 422‐427
Ray R 2009 Secular changes in the solar semidiurnal tide of the western North Atlantic Ocean Geophysical Research Letters Vol 36 L19601
Tolman H L 1991 A third‐generation model for wind waves on slowly varying unsteady and inhomogeneous depths and currents Journal of Physical Oceanography Vol 21 pp 782‐797
WAMDI Group et al 1988 The WAM model a third‐generation ocean wave prediction model Journal of Physical Oceanography Vol 18 pp 1775‐1810
Woodworth P L 2010 A survey of recent changes in the main components of the ocean tide Continental Shelf Research Vol 30 (5) pp 1680‐1691
- IOCTS115-PRESENTATION 36 OK dots - revised -h
- IOCTS115-ARTICLE 36 - h
- IOCTS115-BIBLIOGRAPHY 36 OK DOIs - h
-

IOC TECHNICAL SERIES No 115 pp 115‐131 URI httphdlhandlenet18349182 2015
123
Figure 365 Wave roses from Golfo de Caacutediz (left) and Tarifa (right) buoys (yellow dots)
Figure 366 Wave roses from Tenerife (left) and Gran Canaria (right) buoys (yellow dots)
Goacutemez M Peacuterez‐Goacutemez B De Alfonso M Peacuterez S and Ruiz M I Waves and tides in the CCLME
124
1 2
3 4
5 6 7
8 9 10
11 12 13
Figure 367 Wave roses of 13 model points representing different locations of the area of interest
1
2
3
4 5 6 7
8
9
10
11
12
13
IOC TECHNICAL SERIES No 115 pp 115‐131 URI httphdlhandlenet18349182 2015
125
The most extreme significant wave height ever registered by the 4 buoys and obtained at the 13 model
points per season are shown in Tables 364 and 365
Unfortunately some of the buoys have not always been directional buoys and the extreme events have
occurred in dates in which they were not so there is not information about the direction In these cases
directional information from the nearest wave model point was used to draw conclusions
It can be seen that as expected the highest extreme storms appear during the winter season Autumn and
spring seasons are very similar while the lowest extreme storms appear in summer This is valid not only for
the significant wave height but also for the peak period
The Golfo de Caacutediz buoy is an exception because the highest significant wave height was registered in
spring However it can be considered a rare event because taking a more general look of this buoy data
most of the highest storms appear during the winter season as in the other locations
There is more difference between one location and the others in winter being the climate more severe in
the North than in the South In summer the extreme wave climate is very similar at all the locations
Regarding the directions it can be seen that almost all the extreme events come from the north‐west
being slightly more western in winter than in summer
All the seasonal differences are more evident at the northern locations than at the southern ones
Table 364 The highest significant wave height (Hs) ever registered by the 4 buoys per season (W winter
Sp spring S summer A autumn) The corresponding peak period (Tp) direction and date are also shown
Number of station corresponds to the number on the map in Figure 361
Buoy Season Max Hs (m)
Tp(s)
Direction (0‐N90‐E)
Date(GMT)
Buoy Season Max Hs(m)
Tp(s)
Direction (0‐N90‐E)
Date(GMT)
1 Golfo de Caacutediz
W 62 107 ‐‐ 19971218 02h 3Tenerife W 48 94 ‐‐ 19990108 03h
Sp 66 150 ‐‐ 20030413 23h Sp 36 91 230 20130303 22h
S 35 85 ‐‐ 19970605 12h S 27 6478
90 107
20090725 02h20130807 01h
A 36 85 ‐‐ 19990919 13h A 32 94 ‐‐ 19981009 14h
2 Tarifa W 36 105 107 20100128 01h 4 Gran Canaria
W 57 135 ‐‐ 19990112 09h
Sp 33 90 107 20110405 22h Sp 52 98 ‐‐ 20010313 21h
S 18 71 83 20130625 07h S 38 85 ‐‐ 20000610 13h
A 29 89 105 20121108 10h A 55 166 337 2014 1129 06h
The extreme events have lower significant heights at the buoy locations than at the model points because
as it has been said in the previous section the sensors are placed relatively close to the coast so they are
protected by it On the other hand the locations in which the extreme storms are the highest are in the
model points 1 2 9 10 and 11 that as it can be seen in Figure 367 are the less protected by the coast
Goacutemez M Peacuterez‐Goacutemez B De Alfonso M Peacuterez S and Ruiz M I Waves and tides in the CCLME
126
Table 365 The highest significant wave height (Hs) ever got at each of the 13 the model points per season
(W winter Sp spring S summer A autumn) The corresponding peak period (Tp) direction and date are
also shown (number of station corresponds to the number on the map in Figure 367)
Point Season Max Hs (m)
Tp (s)
Direction (0‐N90‐E)
Date(GMT)
Point Season Max Hs(m)
Tp(s)
Direction (0‐N90‐E)
Date(GMT)
1 W 102 175 307 19730117 12h 8 W 88 183 322 19820112 15h
Sp 78 123 77 19550331 21h Sp 64 178 310 19910307 12h
S 43 93 357 19790816 00h S 47 108 357 19660611 00h
A 72 161 296 19821108 03h A 65 181 332 19621107 06h
2 W 86 180 288 19660221 03h 9 W 104 183 309 19820112 12h
Sp 67 153 299 19890409 09h Sp 73 179 301 19910307 06h
S 41 148 356 20080819 15h S 47 91 358 20120612 20h
A 62 151 308 20141129 05h A 75 181 323 19621107 03h
3 W 66 134 308 19891229 00h 10 W 96 183 290 19660221 00h
Sp 58 138 285 20130305 12h Sp 74 178 297 19910307 06h
S 33 90 38 20120712 10h S 37 134 322 19610601 00h
A 70 136 314 20141129 00h A 80 117 268 19891119 18h
4 W 58 180 314 19660221 06h 11 W 97 182 283 19660221 06h
Sp 54 135 290 20130305 04h Sp 73 177 290 19910307 09h
S 41 83 29 20120715 05h S 37 132 309 19610601 00h
A 60 142 321 20141129 06h A 83 159 293 19841105 06h
5 W 49 110 29 20140124 10h 12 W 81 172 293 19730117 21h
Sp 46 85 230 20130303 23h Sp 50 145 275 19910307 15h
S 33 88 28 20120612 02h S 26 143 296 19850601 09h
A 46 145 343 20141129 10h A 48 115 258 19821107 15h
6 W 63 122 319 19720223 06h 13 W 62 109 272 20130119 18h
Sp 45 189 353 20140304 11h Sp 48 112 257 20130306 08h
S 33 89 17 20120712 10h S 25 65 83 20130625 11h
A 63 146 326 20141129 10h A 40 91 81 20081011 00h
7 W 56 118 10 19940117 18h
Sp 52 112 22 19940403 09h
S 37 95 10 20070622 21h
A 46 149 319 20141129 16h
3642 Tides regime
The relative importance of the tide and the meteorological component was estimated by computing the
standard deviation of the tidal elevations and the meteorological component for the REDMAR stations
during the year 2012 (Figure 368 left) Examples of the probability density functions or histograms of both
components are also displayed in Figure 368 (right)
IOC TECHNICAL SERIES No 115 pp 115‐131 URI httphdlhandlenet18349182 2015
127
Figure 368 Left Standard deviation (Stdv) of the tide and the meteorological or residual component for
REDMAR tide gauges in the region (year 2012) Right From the top to the bottom tide and surge
histograms for Tarifa (Gulf of Cadiz) Arrecife (Lanzarote Eastern Canary Islands) and La Palma (Western
Canary Islands) (hourly data year 2012)
The amplitudes and phases of the main semidiurnal (M2 S2) and diurnal (O1 K1) constituents were compiled
in Table 366 not only for the REDMAR stations but also for the ones provided by other organizations The
period of data used for the computation is included as well as the Form Factor F obtained from the ratio of
the amplitudes of these main constituents
)()(
)()(
22
11
SAMA
KAOAF
The value of F is usually employed for tides classification (Pugh 1987) diurnal semidiurnal or mixed
Finally the spatial variation of the main tidal constituents is shown from COMAPI model at Figures 369
and 3610
The Form Factor values in Table 366 well below 25 for all the stations indicate a clear dominant
semidiurnal tide (two highs and two lows per day) in the Canary Current region from the Gulf of Cadiz up to
Mauritania This reflects in the two peaks observed in the tide histograms of Figure 368 (right) the most
probable levels being close to the mean high waters and mean low waters respectively This is coherent on
the other hand with the larger amplitudes of the semidiurnal constituents (M2 and S2) in Table 366 with
respect to the diurnal ones at all the stations we could compile
Station Tide Stdv (cm) Res Stdv (cm)
Bonanza 7048 648
Tarifa 3346 615
Tenerife 5595 388
Granadilla (Tenerife) 4973 944
La Palma 5199 391
La Gomera 4681 370
El Hierro 4747 400
Las Palmas (G C) 5925 419
Arinaga (G C) 5389 485
Fuerteventura 6406 344
Arrecife (Lanz) 6648 351
Goacutemez M Peacuterez‐Goacutemez B De Alfonso M Peacuterez S and Ruiz M I Waves and tides in the CCLME
128
Table 366 Amplitude and phase of the main semidiurnal and diurnal tidal constituents form factor (F)
and period of data for its computation REDMAR stations are shown in bold Harmonic constants provided
by other institutions for those stations shaded in grey
Station M2 S2 O1 K1 F Years Amp
(cm) Phase Lag
(o) Amp(cm)
Phase Lag (o)
Amp (cm)
Phase Lag (o)
Amp(cm)
Phase Lag (o)
Gulf of Cadiz
Bonanza 8987 6374 3089 9033 612 32258 615 6030 0102 2010‐2012 Caacutediz 9967 6513 3593 9282 660 30763 676 5128 0081 2013 Tarifa 4173 4163 1566 6888 048 12849 263 1295 0054 2010‐2012 Taacutenger (Morocco) 6832 6536 1792 7111 446 33613 658 6018 0128 2005
Canary Islands
Tenerife 7063 2892 2718 5261 469 29284 625 4032 0112 2010‐2012 Granadilla (Tenerife) 6130 2596 2463 4731 474 29226 595 4072 0124 2003‐2011 La Palma 6516 3030 2551 5296 458 29365 578 4164 0114 2007‐2012 La Gomera 5794 2358 2335 4592 434 29005 558 3297 0122 2007‐2012 El Hierro 5946 2123 2426 4376 430 29067 613 3233 0125 2010‐2012 Las Palmas (G Canaria) 7527 2838 2897 5317 488 29345 619 4005 0106 2008‐2012 Arinaga (Gran Canaria) 6808 2818 2664 5060 476 29233 604 3724 0114 2003‐2011 Fuerteventura 8089 3233 3053 5621 518 29434 614 3853 0102 2010‐2012 Arrecife (Lanzarote) 8423 3482 3173 5835 522 29599 684 4210 0104 2008‐2012
West Africa coast Ifni (Morocco) 9138 3847 4078 7655 353 27855 437 2901 0060 1949 C Bojador (W Sah) 6155 1865 3340 3824 398 28355 302 1575 0070 1948 Dakhla (W Sah) 6855 1130 1981 3347 374 27909 769 3513 0130 1949 Nouakchott (Maur) 4271 2898 1737 3000 425 ‐ 628 1504 0178 2007
The surge or residual component is small in this area (Figure 8 left) with larger standard deviation
(between 6‐7 cm) at the Gulf of Cadiz (higher latitudes more prompt to suffer the effect of storms) and
lower values at the Canary Islands stations (between 3‐5 cm) The small magnitude of the surge component
is also related to the narrow shelf especially at the Canary Islands We lack information concerning this
component of sea level along the coast of Africa where it is expected to be larger than in the Canary
Islands due to the broader continental shelf and the southern part of the CCLME Bonanza and Tarifa in
the Gulf of Cadiz are the stations with larger and lower amplitude of the tide respectively due to the
variability of M2 and S2 close to the Strait of Gibraltar as can be seen also in Figure 369 from COMAPI
model Maximum tidal ranges are around 15 m at Tarifa 35 m at Bonanza 25 m at La Palma and 32 m at
Lanzarote The relative importance of meteorological sea level at each station obtained as
Res_StdvTide_Stdv (Table enclosed in Figure 368) varies between the 184 of the tide at Tarifa due to
its small tide amplitude and the 5 at Arrecife
In the Canary Islands there is a longitudinal variation of the tide amplitude becoming larger for the four
main constituents in Table 366 as we move eastwards and approach the continental slope (African coast)
this can also be observed from the spatial variation of their amplitude in Figures 369 and 3610 for the
whole region This longitudinal variation is most evident in fact for the diurnal constituents (K1 and O1)
IOC TECHNICAL SERIES No 115 pp 115‐131 URI httphdlhandlenet18349182 2015
129
Figure 369 Spatial variation of amplitude and phase of M2 S2 and M4 harmonic constituents from the
COMAPI tidal atlas in the area of interest (resolution 1rsquotimes1rsquo)
M2
Amplitude (m)
M2
Phase lag (deg)
S2
Phase lag (deg)
S2
Amplitude (m)
M4
Amplitude (m)
M4
Phase lag (deg)
Goacutemez M Peacuterez‐Goacutemez B De Alfonso M Peacuterez S and Ruiz M I Waves and tides in the CCLME
130
In these figures it is also evident the significant decrease of the tide as we approach the Strait of Gibraltar
with respect to the surrounding Atlantic waters The phase lag of the main semidiurnal constituents
however presents a latitudinal variation (Figure 369 right) due to the propagation of the tidal waves from
South to North as a Kelvin wave (with larger amplitude close to the continental shelf)
The higher frequency tidal constituents (such as M4 and M6) are usually related to shallow waters non‐
linear effects This is why they are not important in the Canary Islands either (amplitudes less than 1 cm)
and their magnitude becomes significant at the Gulf of Cadiz (up to 5 cm of M4 amplitude in Bonanza and
47 cm in Tarifa) It should be taken into account that Bonanza station is at the mouth of the Guadalquivir
river so shallow water effects are even more important here For the stations along the west coast of
Africa provided by IHM the amplitude of M4 reaches also relatively higher values (3‐35 cm) the quality of
these tidal constants is not clear but the spatial variation observed from COMAPI tidal atlas reveals also a
coherent increase of the amplitude of this harmonic towards the shelf (Figure 369 bottom)
For all the mentioned constituents an increase of the amplitude of the tide is observed at the Western
Sahara coast north of Dakhla (around 245degN) most important for S2 and K1 Larger tidal amplitudes in the
region according to Figures 369 and 3610 are found along the Morocco coast This is not totally
coherent however with results from tide gauge observations in Table 366 which reflect as already
mentioned the larger tidal amplitudes at Bonanza and Caacutediz
Evaluation of the trends of the main harmonic constants in Las Palmas and Tenerife stations (not shown
see Peacuterez‐Goacutemez 2014 for details) do not reveal an increase on the tidal amplitude since 1992 Although
the time series is short this in principle does not confirm the increase of tidal amplitudes observed in other
regions of the world (Ray 2006 2009 Woodworth 2010) On the contrary only M2 presents a significant
negative trend at Las Palmas (Peacuterez‐Goacutemez 2014)
Figure 3610 Spatial variation of the amplitude of the main diurnal constituents (O1 and K1) from the
COMAPI tidal atlas in the area of interest (resolution 1rsquotimes1rsquo)
O1
Amplitude (m)
K1
Amplitude (m)
IOC TECHNICAL SERIES No 115 pp 115‐131 URI httphdlhandlenet18349182 2015
131
365 CONCLUSIONS AND RECOMMENDATIONS
Waves
Several wave climates exist in the area of interest The Strait of Gibraltar Gulf of Cadiz Moroccan Coast
and Canary Islands wave climates are well described by PdE buoys and models Golfo de Caacutediz buoy (Figure
365) and model points number 1 2 and 3 (Figure 367) represent open deep water conditions while the
other model points and buoys represent local conditions affected by the coastline South of 20deg
unfortunately there is no source of information on waves available
The most common significant wave height is between 1 m and 3 m being higher at northern locations and
decreasing as moving southwards In regard with the wave direction the Gulf of Cadiz is dominated by
waves coming from the west and the main directions turn first to the north and finally to the north‐east as
moving southwards to the Canary Islands
The highest extreme storms appear during the winter season This is valid not only for the significant wave
height but for the peak period too The climate is more severe in the north than in the south and the
extreme events come from the North West The extreme events are lowest at the locations close to the
coast because they are protected by it
Tides
With respect to the tide its variability has been reviewed based on the available tidal constants from tide
gauges in the region and the regional tidal atlas based on COMAPI model The type of tide is mainly
semidiurnal for the whole area with tidal ranges between 15 m and 35 m and with local variations
basically coherent between observations and the model The meteorological component of sea level is
relatively small with respect to the tide although we lack information from the African coast
The analysis has been made only for the area north of 225degN covered by COMAPI model In order to
complete the study the domain of this model should be extended to cover the whole region including
Senegal and Cape Verde There is also a significant lack of tide gauge observations in most of the countries
what would be crucial for detailed information of local tide conditions in the region
Acknowledgements
We would like to thank Mr Angora Aman (Laboratory of Atmospheric Physics and Fluid Mechanics Cote
drsquoIvoire) and Mr Salvador Moreno (IHM) for providing tidal constants information of several stations in the
African coast and Dr Florent Lyard (LEGOS) for providing the output of the new high resolution tidal atlas
based on the COMAPI model
Goacutemez M Peacuterez‐Goacutemez B De Alfonso M Peacuterez S and Ruiz M I Waves and tides in the CCLME
BIBLIOGRAPHY
Alfonso M Lopez J D Alvarez E and Ruiz M I 2005 Real time buoy data quality control and exploitation The Fifth COPRI International Conference on ocean Wave Measurement and Analysis (WAVES) Coasts Oceans Ports and Rivers Institute American Society of Civil Engineers Madrid
Aacutelvarez‐Fanjul E Peacuterez‐Goacutemez B and Rodriacuteguez I 2001 Nivmar a storm surge forecasting system for Spanish waters Scientia Marina Vol 65 pp 203‐212
Aacutelvarez‐Fanjul E Alfonso M Ruiz M I Lopez J D and Rodriguez I 2002 Real Time Monitoring of Spanish coastal waters The Deep Water Network Proceedings of the Third International Conference on EuroGOOS Athens Greece
Cancet M Lux M Peacutenard C Lyard F Birol F Lemouroux J Bourgogne S and Bronner E 2010 COMAPI New regional tide atlases and high frequency dynamical atmospheric correction Ocean Surface Topography Science Team meeting Lisbon Portugal 2010
Foreman F G G 1977 Manual for tidal heights analysis and predictions Pacific Marine Science Report 77‐10 Institute of Ocean Sciences Patricia Bay Sidney BC 58 pp (2004 revision)
Goacutemez‐Lahoz M and Carretero‐Albiach J C 2005 Wave Forecasting at the Spanish Coasts Journal of Atmospheric and Ocean Science Vol 10 (4) pp 389‐405
Peacuterez‐Goacutemez B 2014 Design and implementation of an operational sea level monitoring and forecasting system for the Spanish coast PhD Thesis Cantabria University Santander Spain 242 pp
Peacuterez‐Goacutemez B Aacutelvarez‐Fanjul E Peacuterez S de Alfonso M and Vela J 2013 Use of tide gauge data in operational oceanography and sea level hazard warning systems Journal of Operational Oceanography Vol 6 (2) pp 1‐18 doi 1010801755876X201311020147
Peacuterez‐Goacutemez B Payo A Loacutepez D Woodworth P L and Aacutelvarez‐Fanjul E 2014 Overlapping sea level time series measured using different technologies an example from the REDMAR Spanish network Natural Hazards and Earth System Science Vol 14 (3) pp 589‐610 doi105194nhess‐14‐589‐2014
Pugh D T 1987 Tides Surges and Mean Sea‐Level John Wiley amp Sons Ltd 472 pp
Ray R 2006 Secular changes of the M2 tide in the Gulf of Maine Continental Shelf Research Vol 26 (3) pp 422‐427
Ray R 2009 Secular changes in the solar semidiurnal tide of the western North Atlantic Ocean Geophysical Research Letters Vol 36 L19601
Tolman H L 1991 A third‐generation model for wind waves on slowly varying unsteady and inhomogeneous depths and currents Journal of Physical Oceanography Vol 21 pp 782‐797
WAMDI Group et al 1988 The WAM model a third‐generation ocean wave prediction model Journal of Physical Oceanography Vol 18 pp 1775‐1810
Woodworth P L 2010 A survey of recent changes in the main components of the ocean tide Continental Shelf Research Vol 30 (5) pp 1680‐1691
- IOCTS115-PRESENTATION 36 OK dots - revised -h
- IOCTS115-ARTICLE 36 - h
- IOCTS115-BIBLIOGRAPHY 36 OK DOIs - h
-

Goacutemez M Peacuterez‐Goacutemez B De Alfonso M Peacuterez S and Ruiz M I Waves and tides in the CCLME
124
1 2
3 4
5 6 7
8 9 10
11 12 13
Figure 367 Wave roses of 13 model points representing different locations of the area of interest
1
2
3
4 5 6 7
8
9
10
11
12
13
IOC TECHNICAL SERIES No 115 pp 115‐131 URI httphdlhandlenet18349182 2015
125
The most extreme significant wave height ever registered by the 4 buoys and obtained at the 13 model
points per season are shown in Tables 364 and 365
Unfortunately some of the buoys have not always been directional buoys and the extreme events have
occurred in dates in which they were not so there is not information about the direction In these cases
directional information from the nearest wave model point was used to draw conclusions
It can be seen that as expected the highest extreme storms appear during the winter season Autumn and
spring seasons are very similar while the lowest extreme storms appear in summer This is valid not only for
the significant wave height but also for the peak period
The Golfo de Caacutediz buoy is an exception because the highest significant wave height was registered in
spring However it can be considered a rare event because taking a more general look of this buoy data
most of the highest storms appear during the winter season as in the other locations
There is more difference between one location and the others in winter being the climate more severe in
the North than in the South In summer the extreme wave climate is very similar at all the locations
Regarding the directions it can be seen that almost all the extreme events come from the north‐west
being slightly more western in winter than in summer
All the seasonal differences are more evident at the northern locations than at the southern ones
Table 364 The highest significant wave height (Hs) ever registered by the 4 buoys per season (W winter
Sp spring S summer A autumn) The corresponding peak period (Tp) direction and date are also shown
Number of station corresponds to the number on the map in Figure 361
Buoy Season Max Hs (m)
Tp(s)
Direction (0‐N90‐E)
Date(GMT)
Buoy Season Max Hs(m)
Tp(s)
Direction (0‐N90‐E)
Date(GMT)
1 Golfo de Caacutediz
W 62 107 ‐‐ 19971218 02h 3Tenerife W 48 94 ‐‐ 19990108 03h
Sp 66 150 ‐‐ 20030413 23h Sp 36 91 230 20130303 22h
S 35 85 ‐‐ 19970605 12h S 27 6478
90 107
20090725 02h20130807 01h
A 36 85 ‐‐ 19990919 13h A 32 94 ‐‐ 19981009 14h
2 Tarifa W 36 105 107 20100128 01h 4 Gran Canaria
W 57 135 ‐‐ 19990112 09h
Sp 33 90 107 20110405 22h Sp 52 98 ‐‐ 20010313 21h
S 18 71 83 20130625 07h S 38 85 ‐‐ 20000610 13h
A 29 89 105 20121108 10h A 55 166 337 2014 1129 06h
The extreme events have lower significant heights at the buoy locations than at the model points because
as it has been said in the previous section the sensors are placed relatively close to the coast so they are
protected by it On the other hand the locations in which the extreme storms are the highest are in the
model points 1 2 9 10 and 11 that as it can be seen in Figure 367 are the less protected by the coast
Goacutemez M Peacuterez‐Goacutemez B De Alfonso M Peacuterez S and Ruiz M I Waves and tides in the CCLME
126
Table 365 The highest significant wave height (Hs) ever got at each of the 13 the model points per season
(W winter Sp spring S summer A autumn) The corresponding peak period (Tp) direction and date are
also shown (number of station corresponds to the number on the map in Figure 367)
Point Season Max Hs (m)
Tp (s)
Direction (0‐N90‐E)
Date(GMT)
Point Season Max Hs(m)
Tp(s)
Direction (0‐N90‐E)
Date(GMT)
1 W 102 175 307 19730117 12h 8 W 88 183 322 19820112 15h
Sp 78 123 77 19550331 21h Sp 64 178 310 19910307 12h
S 43 93 357 19790816 00h S 47 108 357 19660611 00h
A 72 161 296 19821108 03h A 65 181 332 19621107 06h
2 W 86 180 288 19660221 03h 9 W 104 183 309 19820112 12h
Sp 67 153 299 19890409 09h Sp 73 179 301 19910307 06h
S 41 148 356 20080819 15h S 47 91 358 20120612 20h
A 62 151 308 20141129 05h A 75 181 323 19621107 03h
3 W 66 134 308 19891229 00h 10 W 96 183 290 19660221 00h
Sp 58 138 285 20130305 12h Sp 74 178 297 19910307 06h
S 33 90 38 20120712 10h S 37 134 322 19610601 00h
A 70 136 314 20141129 00h A 80 117 268 19891119 18h
4 W 58 180 314 19660221 06h 11 W 97 182 283 19660221 06h
Sp 54 135 290 20130305 04h Sp 73 177 290 19910307 09h
S 41 83 29 20120715 05h S 37 132 309 19610601 00h
A 60 142 321 20141129 06h A 83 159 293 19841105 06h
5 W 49 110 29 20140124 10h 12 W 81 172 293 19730117 21h
Sp 46 85 230 20130303 23h Sp 50 145 275 19910307 15h
S 33 88 28 20120612 02h S 26 143 296 19850601 09h
A 46 145 343 20141129 10h A 48 115 258 19821107 15h
6 W 63 122 319 19720223 06h 13 W 62 109 272 20130119 18h
Sp 45 189 353 20140304 11h Sp 48 112 257 20130306 08h
S 33 89 17 20120712 10h S 25 65 83 20130625 11h
A 63 146 326 20141129 10h A 40 91 81 20081011 00h
7 W 56 118 10 19940117 18h
Sp 52 112 22 19940403 09h
S 37 95 10 20070622 21h
A 46 149 319 20141129 16h
3642 Tides regime
The relative importance of the tide and the meteorological component was estimated by computing the
standard deviation of the tidal elevations and the meteorological component for the REDMAR stations
during the year 2012 (Figure 368 left) Examples of the probability density functions or histograms of both
components are also displayed in Figure 368 (right)
IOC TECHNICAL SERIES No 115 pp 115‐131 URI httphdlhandlenet18349182 2015
127
Figure 368 Left Standard deviation (Stdv) of the tide and the meteorological or residual component for
REDMAR tide gauges in the region (year 2012) Right From the top to the bottom tide and surge
histograms for Tarifa (Gulf of Cadiz) Arrecife (Lanzarote Eastern Canary Islands) and La Palma (Western
Canary Islands) (hourly data year 2012)
The amplitudes and phases of the main semidiurnal (M2 S2) and diurnal (O1 K1) constituents were compiled
in Table 366 not only for the REDMAR stations but also for the ones provided by other organizations The
period of data used for the computation is included as well as the Form Factor F obtained from the ratio of
the amplitudes of these main constituents
)()(
)()(
22
11
SAMA
KAOAF
The value of F is usually employed for tides classification (Pugh 1987) diurnal semidiurnal or mixed
Finally the spatial variation of the main tidal constituents is shown from COMAPI model at Figures 369
and 3610
The Form Factor values in Table 366 well below 25 for all the stations indicate a clear dominant
semidiurnal tide (two highs and two lows per day) in the Canary Current region from the Gulf of Cadiz up to
Mauritania This reflects in the two peaks observed in the tide histograms of Figure 368 (right) the most
probable levels being close to the mean high waters and mean low waters respectively This is coherent on
the other hand with the larger amplitudes of the semidiurnal constituents (M2 and S2) in Table 366 with
respect to the diurnal ones at all the stations we could compile
Station Tide Stdv (cm) Res Stdv (cm)
Bonanza 7048 648
Tarifa 3346 615
Tenerife 5595 388
Granadilla (Tenerife) 4973 944
La Palma 5199 391
La Gomera 4681 370
El Hierro 4747 400
Las Palmas (G C) 5925 419
Arinaga (G C) 5389 485
Fuerteventura 6406 344
Arrecife (Lanz) 6648 351
Goacutemez M Peacuterez‐Goacutemez B De Alfonso M Peacuterez S and Ruiz M I Waves and tides in the CCLME
128
Table 366 Amplitude and phase of the main semidiurnal and diurnal tidal constituents form factor (F)
and period of data for its computation REDMAR stations are shown in bold Harmonic constants provided
by other institutions for those stations shaded in grey
Station M2 S2 O1 K1 F Years Amp
(cm) Phase Lag
(o) Amp(cm)
Phase Lag (o)
Amp (cm)
Phase Lag (o)
Amp(cm)
Phase Lag (o)
Gulf of Cadiz
Bonanza 8987 6374 3089 9033 612 32258 615 6030 0102 2010‐2012 Caacutediz 9967 6513 3593 9282 660 30763 676 5128 0081 2013 Tarifa 4173 4163 1566 6888 048 12849 263 1295 0054 2010‐2012 Taacutenger (Morocco) 6832 6536 1792 7111 446 33613 658 6018 0128 2005
Canary Islands
Tenerife 7063 2892 2718 5261 469 29284 625 4032 0112 2010‐2012 Granadilla (Tenerife) 6130 2596 2463 4731 474 29226 595 4072 0124 2003‐2011 La Palma 6516 3030 2551 5296 458 29365 578 4164 0114 2007‐2012 La Gomera 5794 2358 2335 4592 434 29005 558 3297 0122 2007‐2012 El Hierro 5946 2123 2426 4376 430 29067 613 3233 0125 2010‐2012 Las Palmas (G Canaria) 7527 2838 2897 5317 488 29345 619 4005 0106 2008‐2012 Arinaga (Gran Canaria) 6808 2818 2664 5060 476 29233 604 3724 0114 2003‐2011 Fuerteventura 8089 3233 3053 5621 518 29434 614 3853 0102 2010‐2012 Arrecife (Lanzarote) 8423 3482 3173 5835 522 29599 684 4210 0104 2008‐2012
West Africa coast Ifni (Morocco) 9138 3847 4078 7655 353 27855 437 2901 0060 1949 C Bojador (W Sah) 6155 1865 3340 3824 398 28355 302 1575 0070 1948 Dakhla (W Sah) 6855 1130 1981 3347 374 27909 769 3513 0130 1949 Nouakchott (Maur) 4271 2898 1737 3000 425 ‐ 628 1504 0178 2007
The surge or residual component is small in this area (Figure 8 left) with larger standard deviation
(between 6‐7 cm) at the Gulf of Cadiz (higher latitudes more prompt to suffer the effect of storms) and
lower values at the Canary Islands stations (between 3‐5 cm) The small magnitude of the surge component
is also related to the narrow shelf especially at the Canary Islands We lack information concerning this
component of sea level along the coast of Africa where it is expected to be larger than in the Canary
Islands due to the broader continental shelf and the southern part of the CCLME Bonanza and Tarifa in
the Gulf of Cadiz are the stations with larger and lower amplitude of the tide respectively due to the
variability of M2 and S2 close to the Strait of Gibraltar as can be seen also in Figure 369 from COMAPI
model Maximum tidal ranges are around 15 m at Tarifa 35 m at Bonanza 25 m at La Palma and 32 m at
Lanzarote The relative importance of meteorological sea level at each station obtained as
Res_StdvTide_Stdv (Table enclosed in Figure 368) varies between the 184 of the tide at Tarifa due to
its small tide amplitude and the 5 at Arrecife
In the Canary Islands there is a longitudinal variation of the tide amplitude becoming larger for the four
main constituents in Table 366 as we move eastwards and approach the continental slope (African coast)
this can also be observed from the spatial variation of their amplitude in Figures 369 and 3610 for the
whole region This longitudinal variation is most evident in fact for the diurnal constituents (K1 and O1)
IOC TECHNICAL SERIES No 115 pp 115‐131 URI httphdlhandlenet18349182 2015
129
Figure 369 Spatial variation of amplitude and phase of M2 S2 and M4 harmonic constituents from the
COMAPI tidal atlas in the area of interest (resolution 1rsquotimes1rsquo)
M2
Amplitude (m)
M2
Phase lag (deg)
S2
Phase lag (deg)
S2
Amplitude (m)
M4
Amplitude (m)
M4
Phase lag (deg)
Goacutemez M Peacuterez‐Goacutemez B De Alfonso M Peacuterez S and Ruiz M I Waves and tides in the CCLME
130
In these figures it is also evident the significant decrease of the tide as we approach the Strait of Gibraltar
with respect to the surrounding Atlantic waters The phase lag of the main semidiurnal constituents
however presents a latitudinal variation (Figure 369 right) due to the propagation of the tidal waves from
South to North as a Kelvin wave (with larger amplitude close to the continental shelf)
The higher frequency tidal constituents (such as M4 and M6) are usually related to shallow waters non‐
linear effects This is why they are not important in the Canary Islands either (amplitudes less than 1 cm)
and their magnitude becomes significant at the Gulf of Cadiz (up to 5 cm of M4 amplitude in Bonanza and
47 cm in Tarifa) It should be taken into account that Bonanza station is at the mouth of the Guadalquivir
river so shallow water effects are even more important here For the stations along the west coast of
Africa provided by IHM the amplitude of M4 reaches also relatively higher values (3‐35 cm) the quality of
these tidal constants is not clear but the spatial variation observed from COMAPI tidal atlas reveals also a
coherent increase of the amplitude of this harmonic towards the shelf (Figure 369 bottom)
For all the mentioned constituents an increase of the amplitude of the tide is observed at the Western
Sahara coast north of Dakhla (around 245degN) most important for S2 and K1 Larger tidal amplitudes in the
region according to Figures 369 and 3610 are found along the Morocco coast This is not totally
coherent however with results from tide gauge observations in Table 366 which reflect as already
mentioned the larger tidal amplitudes at Bonanza and Caacutediz
Evaluation of the trends of the main harmonic constants in Las Palmas and Tenerife stations (not shown
see Peacuterez‐Goacutemez 2014 for details) do not reveal an increase on the tidal amplitude since 1992 Although
the time series is short this in principle does not confirm the increase of tidal amplitudes observed in other
regions of the world (Ray 2006 2009 Woodworth 2010) On the contrary only M2 presents a significant
negative trend at Las Palmas (Peacuterez‐Goacutemez 2014)
Figure 3610 Spatial variation of the amplitude of the main diurnal constituents (O1 and K1) from the
COMAPI tidal atlas in the area of interest (resolution 1rsquotimes1rsquo)
O1
Amplitude (m)
K1
Amplitude (m)
IOC TECHNICAL SERIES No 115 pp 115‐131 URI httphdlhandlenet18349182 2015
131
365 CONCLUSIONS AND RECOMMENDATIONS
Waves
Several wave climates exist in the area of interest The Strait of Gibraltar Gulf of Cadiz Moroccan Coast
and Canary Islands wave climates are well described by PdE buoys and models Golfo de Caacutediz buoy (Figure
365) and model points number 1 2 and 3 (Figure 367) represent open deep water conditions while the
other model points and buoys represent local conditions affected by the coastline South of 20deg
unfortunately there is no source of information on waves available
The most common significant wave height is between 1 m and 3 m being higher at northern locations and
decreasing as moving southwards In regard with the wave direction the Gulf of Cadiz is dominated by
waves coming from the west and the main directions turn first to the north and finally to the north‐east as
moving southwards to the Canary Islands
The highest extreme storms appear during the winter season This is valid not only for the significant wave
height but for the peak period too The climate is more severe in the north than in the south and the
extreme events come from the North West The extreme events are lowest at the locations close to the
coast because they are protected by it
Tides
With respect to the tide its variability has been reviewed based on the available tidal constants from tide
gauges in the region and the regional tidal atlas based on COMAPI model The type of tide is mainly
semidiurnal for the whole area with tidal ranges between 15 m and 35 m and with local variations
basically coherent between observations and the model The meteorological component of sea level is
relatively small with respect to the tide although we lack information from the African coast
The analysis has been made only for the area north of 225degN covered by COMAPI model In order to
complete the study the domain of this model should be extended to cover the whole region including
Senegal and Cape Verde There is also a significant lack of tide gauge observations in most of the countries
what would be crucial for detailed information of local tide conditions in the region
Acknowledgements
We would like to thank Mr Angora Aman (Laboratory of Atmospheric Physics and Fluid Mechanics Cote
drsquoIvoire) and Mr Salvador Moreno (IHM) for providing tidal constants information of several stations in the
African coast and Dr Florent Lyard (LEGOS) for providing the output of the new high resolution tidal atlas
based on the COMAPI model
Goacutemez M Peacuterez‐Goacutemez B De Alfonso M Peacuterez S and Ruiz M I Waves and tides in the CCLME
BIBLIOGRAPHY
Alfonso M Lopez J D Alvarez E and Ruiz M I 2005 Real time buoy data quality control and exploitation The Fifth COPRI International Conference on ocean Wave Measurement and Analysis (WAVES) Coasts Oceans Ports and Rivers Institute American Society of Civil Engineers Madrid
Aacutelvarez‐Fanjul E Peacuterez‐Goacutemez B and Rodriacuteguez I 2001 Nivmar a storm surge forecasting system for Spanish waters Scientia Marina Vol 65 pp 203‐212
Aacutelvarez‐Fanjul E Alfonso M Ruiz M I Lopez J D and Rodriguez I 2002 Real Time Monitoring of Spanish coastal waters The Deep Water Network Proceedings of the Third International Conference on EuroGOOS Athens Greece
Cancet M Lux M Peacutenard C Lyard F Birol F Lemouroux J Bourgogne S and Bronner E 2010 COMAPI New regional tide atlases and high frequency dynamical atmospheric correction Ocean Surface Topography Science Team meeting Lisbon Portugal 2010
Foreman F G G 1977 Manual for tidal heights analysis and predictions Pacific Marine Science Report 77‐10 Institute of Ocean Sciences Patricia Bay Sidney BC 58 pp (2004 revision)
Goacutemez‐Lahoz M and Carretero‐Albiach J C 2005 Wave Forecasting at the Spanish Coasts Journal of Atmospheric and Ocean Science Vol 10 (4) pp 389‐405
Peacuterez‐Goacutemez B 2014 Design and implementation of an operational sea level monitoring and forecasting system for the Spanish coast PhD Thesis Cantabria University Santander Spain 242 pp
Peacuterez‐Goacutemez B Aacutelvarez‐Fanjul E Peacuterez S de Alfonso M and Vela J 2013 Use of tide gauge data in operational oceanography and sea level hazard warning systems Journal of Operational Oceanography Vol 6 (2) pp 1‐18 doi 1010801755876X201311020147
Peacuterez‐Goacutemez B Payo A Loacutepez D Woodworth P L and Aacutelvarez‐Fanjul E 2014 Overlapping sea level time series measured using different technologies an example from the REDMAR Spanish network Natural Hazards and Earth System Science Vol 14 (3) pp 589‐610 doi105194nhess‐14‐589‐2014
Pugh D T 1987 Tides Surges and Mean Sea‐Level John Wiley amp Sons Ltd 472 pp
Ray R 2006 Secular changes of the M2 tide in the Gulf of Maine Continental Shelf Research Vol 26 (3) pp 422‐427
Ray R 2009 Secular changes in the solar semidiurnal tide of the western North Atlantic Ocean Geophysical Research Letters Vol 36 L19601
Tolman H L 1991 A third‐generation model for wind waves on slowly varying unsteady and inhomogeneous depths and currents Journal of Physical Oceanography Vol 21 pp 782‐797
WAMDI Group et al 1988 The WAM model a third‐generation ocean wave prediction model Journal of Physical Oceanography Vol 18 pp 1775‐1810
Woodworth P L 2010 A survey of recent changes in the main components of the ocean tide Continental Shelf Research Vol 30 (5) pp 1680‐1691
- IOCTS115-PRESENTATION 36 OK dots - revised -h
- IOCTS115-ARTICLE 36 - h
- IOCTS115-BIBLIOGRAPHY 36 OK DOIs - h
-

IOC TECHNICAL SERIES No 115 pp 115‐131 URI httphdlhandlenet18349182 2015
125
The most extreme significant wave height ever registered by the 4 buoys and obtained at the 13 model
points per season are shown in Tables 364 and 365
Unfortunately some of the buoys have not always been directional buoys and the extreme events have
occurred in dates in which they were not so there is not information about the direction In these cases
directional information from the nearest wave model point was used to draw conclusions
It can be seen that as expected the highest extreme storms appear during the winter season Autumn and
spring seasons are very similar while the lowest extreme storms appear in summer This is valid not only for
the significant wave height but also for the peak period
The Golfo de Caacutediz buoy is an exception because the highest significant wave height was registered in
spring However it can be considered a rare event because taking a more general look of this buoy data
most of the highest storms appear during the winter season as in the other locations
There is more difference between one location and the others in winter being the climate more severe in
the North than in the South In summer the extreme wave climate is very similar at all the locations
Regarding the directions it can be seen that almost all the extreme events come from the north‐west
being slightly more western in winter than in summer
All the seasonal differences are more evident at the northern locations than at the southern ones
Table 364 The highest significant wave height (Hs) ever registered by the 4 buoys per season (W winter
Sp spring S summer A autumn) The corresponding peak period (Tp) direction and date are also shown
Number of station corresponds to the number on the map in Figure 361
Buoy Season Max Hs (m)
Tp(s)
Direction (0‐N90‐E)
Date(GMT)
Buoy Season Max Hs(m)
Tp(s)
Direction (0‐N90‐E)
Date(GMT)
1 Golfo de Caacutediz
W 62 107 ‐‐ 19971218 02h 3Tenerife W 48 94 ‐‐ 19990108 03h
Sp 66 150 ‐‐ 20030413 23h Sp 36 91 230 20130303 22h
S 35 85 ‐‐ 19970605 12h S 27 6478
90 107
20090725 02h20130807 01h
A 36 85 ‐‐ 19990919 13h A 32 94 ‐‐ 19981009 14h
2 Tarifa W 36 105 107 20100128 01h 4 Gran Canaria
W 57 135 ‐‐ 19990112 09h
Sp 33 90 107 20110405 22h Sp 52 98 ‐‐ 20010313 21h
S 18 71 83 20130625 07h S 38 85 ‐‐ 20000610 13h
A 29 89 105 20121108 10h A 55 166 337 2014 1129 06h
The extreme events have lower significant heights at the buoy locations than at the model points because
as it has been said in the previous section the sensors are placed relatively close to the coast so they are
protected by it On the other hand the locations in which the extreme storms are the highest are in the
model points 1 2 9 10 and 11 that as it can be seen in Figure 367 are the less protected by the coast
Goacutemez M Peacuterez‐Goacutemez B De Alfonso M Peacuterez S and Ruiz M I Waves and tides in the CCLME
126
Table 365 The highest significant wave height (Hs) ever got at each of the 13 the model points per season
(W winter Sp spring S summer A autumn) The corresponding peak period (Tp) direction and date are
also shown (number of station corresponds to the number on the map in Figure 367)
Point Season Max Hs (m)
Tp (s)
Direction (0‐N90‐E)
Date(GMT)
Point Season Max Hs(m)
Tp(s)
Direction (0‐N90‐E)
Date(GMT)
1 W 102 175 307 19730117 12h 8 W 88 183 322 19820112 15h
Sp 78 123 77 19550331 21h Sp 64 178 310 19910307 12h
S 43 93 357 19790816 00h S 47 108 357 19660611 00h
A 72 161 296 19821108 03h A 65 181 332 19621107 06h
2 W 86 180 288 19660221 03h 9 W 104 183 309 19820112 12h
Sp 67 153 299 19890409 09h Sp 73 179 301 19910307 06h
S 41 148 356 20080819 15h S 47 91 358 20120612 20h
A 62 151 308 20141129 05h A 75 181 323 19621107 03h
3 W 66 134 308 19891229 00h 10 W 96 183 290 19660221 00h
Sp 58 138 285 20130305 12h Sp 74 178 297 19910307 06h
S 33 90 38 20120712 10h S 37 134 322 19610601 00h
A 70 136 314 20141129 00h A 80 117 268 19891119 18h
4 W 58 180 314 19660221 06h 11 W 97 182 283 19660221 06h
Sp 54 135 290 20130305 04h Sp 73 177 290 19910307 09h
S 41 83 29 20120715 05h S 37 132 309 19610601 00h
A 60 142 321 20141129 06h A 83 159 293 19841105 06h
5 W 49 110 29 20140124 10h 12 W 81 172 293 19730117 21h
Sp 46 85 230 20130303 23h Sp 50 145 275 19910307 15h
S 33 88 28 20120612 02h S 26 143 296 19850601 09h
A 46 145 343 20141129 10h A 48 115 258 19821107 15h
6 W 63 122 319 19720223 06h 13 W 62 109 272 20130119 18h
Sp 45 189 353 20140304 11h Sp 48 112 257 20130306 08h
S 33 89 17 20120712 10h S 25 65 83 20130625 11h
A 63 146 326 20141129 10h A 40 91 81 20081011 00h
7 W 56 118 10 19940117 18h
Sp 52 112 22 19940403 09h
S 37 95 10 20070622 21h
A 46 149 319 20141129 16h
3642 Tides regime
The relative importance of the tide and the meteorological component was estimated by computing the
standard deviation of the tidal elevations and the meteorological component for the REDMAR stations
during the year 2012 (Figure 368 left) Examples of the probability density functions or histograms of both
components are also displayed in Figure 368 (right)
IOC TECHNICAL SERIES No 115 pp 115‐131 URI httphdlhandlenet18349182 2015
127
Figure 368 Left Standard deviation (Stdv) of the tide and the meteorological or residual component for
REDMAR tide gauges in the region (year 2012) Right From the top to the bottom tide and surge
histograms for Tarifa (Gulf of Cadiz) Arrecife (Lanzarote Eastern Canary Islands) and La Palma (Western
Canary Islands) (hourly data year 2012)
The amplitudes and phases of the main semidiurnal (M2 S2) and diurnal (O1 K1) constituents were compiled
in Table 366 not only for the REDMAR stations but also for the ones provided by other organizations The
period of data used for the computation is included as well as the Form Factor F obtained from the ratio of
the amplitudes of these main constituents
)()(
)()(
22
11
SAMA
KAOAF
The value of F is usually employed for tides classification (Pugh 1987) diurnal semidiurnal or mixed
Finally the spatial variation of the main tidal constituents is shown from COMAPI model at Figures 369
and 3610
The Form Factor values in Table 366 well below 25 for all the stations indicate a clear dominant
semidiurnal tide (two highs and two lows per day) in the Canary Current region from the Gulf of Cadiz up to
Mauritania This reflects in the two peaks observed in the tide histograms of Figure 368 (right) the most
probable levels being close to the mean high waters and mean low waters respectively This is coherent on
the other hand with the larger amplitudes of the semidiurnal constituents (M2 and S2) in Table 366 with
respect to the diurnal ones at all the stations we could compile
Station Tide Stdv (cm) Res Stdv (cm)
Bonanza 7048 648
Tarifa 3346 615
Tenerife 5595 388
Granadilla (Tenerife) 4973 944
La Palma 5199 391
La Gomera 4681 370
El Hierro 4747 400
Las Palmas (G C) 5925 419
Arinaga (G C) 5389 485
Fuerteventura 6406 344
Arrecife (Lanz) 6648 351
Goacutemez M Peacuterez‐Goacutemez B De Alfonso M Peacuterez S and Ruiz M I Waves and tides in the CCLME
128
Table 366 Amplitude and phase of the main semidiurnal and diurnal tidal constituents form factor (F)
and period of data for its computation REDMAR stations are shown in bold Harmonic constants provided
by other institutions for those stations shaded in grey
Station M2 S2 O1 K1 F Years Amp
(cm) Phase Lag
(o) Amp(cm)
Phase Lag (o)
Amp (cm)
Phase Lag (o)
Amp(cm)
Phase Lag (o)
Gulf of Cadiz
Bonanza 8987 6374 3089 9033 612 32258 615 6030 0102 2010‐2012 Caacutediz 9967 6513 3593 9282 660 30763 676 5128 0081 2013 Tarifa 4173 4163 1566 6888 048 12849 263 1295 0054 2010‐2012 Taacutenger (Morocco) 6832 6536 1792 7111 446 33613 658 6018 0128 2005
Canary Islands
Tenerife 7063 2892 2718 5261 469 29284 625 4032 0112 2010‐2012 Granadilla (Tenerife) 6130 2596 2463 4731 474 29226 595 4072 0124 2003‐2011 La Palma 6516 3030 2551 5296 458 29365 578 4164 0114 2007‐2012 La Gomera 5794 2358 2335 4592 434 29005 558 3297 0122 2007‐2012 El Hierro 5946 2123 2426 4376 430 29067 613 3233 0125 2010‐2012 Las Palmas (G Canaria) 7527 2838 2897 5317 488 29345 619 4005 0106 2008‐2012 Arinaga (Gran Canaria) 6808 2818 2664 5060 476 29233 604 3724 0114 2003‐2011 Fuerteventura 8089 3233 3053 5621 518 29434 614 3853 0102 2010‐2012 Arrecife (Lanzarote) 8423 3482 3173 5835 522 29599 684 4210 0104 2008‐2012
West Africa coast Ifni (Morocco) 9138 3847 4078 7655 353 27855 437 2901 0060 1949 C Bojador (W Sah) 6155 1865 3340 3824 398 28355 302 1575 0070 1948 Dakhla (W Sah) 6855 1130 1981 3347 374 27909 769 3513 0130 1949 Nouakchott (Maur) 4271 2898 1737 3000 425 ‐ 628 1504 0178 2007
The surge or residual component is small in this area (Figure 8 left) with larger standard deviation
(between 6‐7 cm) at the Gulf of Cadiz (higher latitudes more prompt to suffer the effect of storms) and
lower values at the Canary Islands stations (between 3‐5 cm) The small magnitude of the surge component
is also related to the narrow shelf especially at the Canary Islands We lack information concerning this
component of sea level along the coast of Africa where it is expected to be larger than in the Canary
Islands due to the broader continental shelf and the southern part of the CCLME Bonanza and Tarifa in
the Gulf of Cadiz are the stations with larger and lower amplitude of the tide respectively due to the
variability of M2 and S2 close to the Strait of Gibraltar as can be seen also in Figure 369 from COMAPI
model Maximum tidal ranges are around 15 m at Tarifa 35 m at Bonanza 25 m at La Palma and 32 m at
Lanzarote The relative importance of meteorological sea level at each station obtained as
Res_StdvTide_Stdv (Table enclosed in Figure 368) varies between the 184 of the tide at Tarifa due to
its small tide amplitude and the 5 at Arrecife
In the Canary Islands there is a longitudinal variation of the tide amplitude becoming larger for the four
main constituents in Table 366 as we move eastwards and approach the continental slope (African coast)
this can also be observed from the spatial variation of their amplitude in Figures 369 and 3610 for the
whole region This longitudinal variation is most evident in fact for the diurnal constituents (K1 and O1)
IOC TECHNICAL SERIES No 115 pp 115‐131 URI httphdlhandlenet18349182 2015
129
Figure 369 Spatial variation of amplitude and phase of M2 S2 and M4 harmonic constituents from the
COMAPI tidal atlas in the area of interest (resolution 1rsquotimes1rsquo)
M2
Amplitude (m)
M2
Phase lag (deg)
S2
Phase lag (deg)
S2
Amplitude (m)
M4
Amplitude (m)
M4
Phase lag (deg)
Goacutemez M Peacuterez‐Goacutemez B De Alfonso M Peacuterez S and Ruiz M I Waves and tides in the CCLME
130
In these figures it is also evident the significant decrease of the tide as we approach the Strait of Gibraltar
with respect to the surrounding Atlantic waters The phase lag of the main semidiurnal constituents
however presents a latitudinal variation (Figure 369 right) due to the propagation of the tidal waves from
South to North as a Kelvin wave (with larger amplitude close to the continental shelf)
The higher frequency tidal constituents (such as M4 and M6) are usually related to shallow waters non‐
linear effects This is why they are not important in the Canary Islands either (amplitudes less than 1 cm)
and their magnitude becomes significant at the Gulf of Cadiz (up to 5 cm of M4 amplitude in Bonanza and
47 cm in Tarifa) It should be taken into account that Bonanza station is at the mouth of the Guadalquivir
river so shallow water effects are even more important here For the stations along the west coast of
Africa provided by IHM the amplitude of M4 reaches also relatively higher values (3‐35 cm) the quality of
these tidal constants is not clear but the spatial variation observed from COMAPI tidal atlas reveals also a
coherent increase of the amplitude of this harmonic towards the shelf (Figure 369 bottom)
For all the mentioned constituents an increase of the amplitude of the tide is observed at the Western
Sahara coast north of Dakhla (around 245degN) most important for S2 and K1 Larger tidal amplitudes in the
region according to Figures 369 and 3610 are found along the Morocco coast This is not totally
coherent however with results from tide gauge observations in Table 366 which reflect as already
mentioned the larger tidal amplitudes at Bonanza and Caacutediz
Evaluation of the trends of the main harmonic constants in Las Palmas and Tenerife stations (not shown
see Peacuterez‐Goacutemez 2014 for details) do not reveal an increase on the tidal amplitude since 1992 Although
the time series is short this in principle does not confirm the increase of tidal amplitudes observed in other
regions of the world (Ray 2006 2009 Woodworth 2010) On the contrary only M2 presents a significant
negative trend at Las Palmas (Peacuterez‐Goacutemez 2014)
Figure 3610 Spatial variation of the amplitude of the main diurnal constituents (O1 and K1) from the
COMAPI tidal atlas in the area of interest (resolution 1rsquotimes1rsquo)
O1
Amplitude (m)
K1
Amplitude (m)
IOC TECHNICAL SERIES No 115 pp 115‐131 URI httphdlhandlenet18349182 2015
131
365 CONCLUSIONS AND RECOMMENDATIONS
Waves
Several wave climates exist in the area of interest The Strait of Gibraltar Gulf of Cadiz Moroccan Coast
and Canary Islands wave climates are well described by PdE buoys and models Golfo de Caacutediz buoy (Figure
365) and model points number 1 2 and 3 (Figure 367) represent open deep water conditions while the
other model points and buoys represent local conditions affected by the coastline South of 20deg
unfortunately there is no source of information on waves available
The most common significant wave height is between 1 m and 3 m being higher at northern locations and
decreasing as moving southwards In regard with the wave direction the Gulf of Cadiz is dominated by
waves coming from the west and the main directions turn first to the north and finally to the north‐east as
moving southwards to the Canary Islands
The highest extreme storms appear during the winter season This is valid not only for the significant wave
height but for the peak period too The climate is more severe in the north than in the south and the
extreme events come from the North West The extreme events are lowest at the locations close to the
coast because they are protected by it
Tides
With respect to the tide its variability has been reviewed based on the available tidal constants from tide
gauges in the region and the regional tidal atlas based on COMAPI model The type of tide is mainly
semidiurnal for the whole area with tidal ranges between 15 m and 35 m and with local variations
basically coherent between observations and the model The meteorological component of sea level is
relatively small with respect to the tide although we lack information from the African coast
The analysis has been made only for the area north of 225degN covered by COMAPI model In order to
complete the study the domain of this model should be extended to cover the whole region including
Senegal and Cape Verde There is also a significant lack of tide gauge observations in most of the countries
what would be crucial for detailed information of local tide conditions in the region
Acknowledgements
We would like to thank Mr Angora Aman (Laboratory of Atmospheric Physics and Fluid Mechanics Cote
drsquoIvoire) and Mr Salvador Moreno (IHM) for providing tidal constants information of several stations in the
African coast and Dr Florent Lyard (LEGOS) for providing the output of the new high resolution tidal atlas
based on the COMAPI model
Goacutemez M Peacuterez‐Goacutemez B De Alfonso M Peacuterez S and Ruiz M I Waves and tides in the CCLME
BIBLIOGRAPHY
Alfonso M Lopez J D Alvarez E and Ruiz M I 2005 Real time buoy data quality control and exploitation The Fifth COPRI International Conference on ocean Wave Measurement and Analysis (WAVES) Coasts Oceans Ports and Rivers Institute American Society of Civil Engineers Madrid
Aacutelvarez‐Fanjul E Peacuterez‐Goacutemez B and Rodriacuteguez I 2001 Nivmar a storm surge forecasting system for Spanish waters Scientia Marina Vol 65 pp 203‐212
Aacutelvarez‐Fanjul E Alfonso M Ruiz M I Lopez J D and Rodriguez I 2002 Real Time Monitoring of Spanish coastal waters The Deep Water Network Proceedings of the Third International Conference on EuroGOOS Athens Greece
Cancet M Lux M Peacutenard C Lyard F Birol F Lemouroux J Bourgogne S and Bronner E 2010 COMAPI New regional tide atlases and high frequency dynamical atmospheric correction Ocean Surface Topography Science Team meeting Lisbon Portugal 2010
Foreman F G G 1977 Manual for tidal heights analysis and predictions Pacific Marine Science Report 77‐10 Institute of Ocean Sciences Patricia Bay Sidney BC 58 pp (2004 revision)
Goacutemez‐Lahoz M and Carretero‐Albiach J C 2005 Wave Forecasting at the Spanish Coasts Journal of Atmospheric and Ocean Science Vol 10 (4) pp 389‐405
Peacuterez‐Goacutemez B 2014 Design and implementation of an operational sea level monitoring and forecasting system for the Spanish coast PhD Thesis Cantabria University Santander Spain 242 pp
Peacuterez‐Goacutemez B Aacutelvarez‐Fanjul E Peacuterez S de Alfonso M and Vela J 2013 Use of tide gauge data in operational oceanography and sea level hazard warning systems Journal of Operational Oceanography Vol 6 (2) pp 1‐18 doi 1010801755876X201311020147
Peacuterez‐Goacutemez B Payo A Loacutepez D Woodworth P L and Aacutelvarez‐Fanjul E 2014 Overlapping sea level time series measured using different technologies an example from the REDMAR Spanish network Natural Hazards and Earth System Science Vol 14 (3) pp 589‐610 doi105194nhess‐14‐589‐2014
Pugh D T 1987 Tides Surges and Mean Sea‐Level John Wiley amp Sons Ltd 472 pp
Ray R 2006 Secular changes of the M2 tide in the Gulf of Maine Continental Shelf Research Vol 26 (3) pp 422‐427
Ray R 2009 Secular changes in the solar semidiurnal tide of the western North Atlantic Ocean Geophysical Research Letters Vol 36 L19601
Tolman H L 1991 A third‐generation model for wind waves on slowly varying unsteady and inhomogeneous depths and currents Journal of Physical Oceanography Vol 21 pp 782‐797
WAMDI Group et al 1988 The WAM model a third‐generation ocean wave prediction model Journal of Physical Oceanography Vol 18 pp 1775‐1810
Woodworth P L 2010 A survey of recent changes in the main components of the ocean tide Continental Shelf Research Vol 30 (5) pp 1680‐1691
- IOCTS115-PRESENTATION 36 OK dots - revised -h
- IOCTS115-ARTICLE 36 - h
- IOCTS115-BIBLIOGRAPHY 36 OK DOIs - h
-

Goacutemez M Peacuterez‐Goacutemez B De Alfonso M Peacuterez S and Ruiz M I Waves and tides in the CCLME
126
Table 365 The highest significant wave height (Hs) ever got at each of the 13 the model points per season
(W winter Sp spring S summer A autumn) The corresponding peak period (Tp) direction and date are
also shown (number of station corresponds to the number on the map in Figure 367)
Point Season Max Hs (m)
Tp (s)
Direction (0‐N90‐E)
Date(GMT)
Point Season Max Hs(m)
Tp(s)
Direction (0‐N90‐E)
Date(GMT)
1 W 102 175 307 19730117 12h 8 W 88 183 322 19820112 15h
Sp 78 123 77 19550331 21h Sp 64 178 310 19910307 12h
S 43 93 357 19790816 00h S 47 108 357 19660611 00h
A 72 161 296 19821108 03h A 65 181 332 19621107 06h
2 W 86 180 288 19660221 03h 9 W 104 183 309 19820112 12h
Sp 67 153 299 19890409 09h Sp 73 179 301 19910307 06h
S 41 148 356 20080819 15h S 47 91 358 20120612 20h
A 62 151 308 20141129 05h A 75 181 323 19621107 03h
3 W 66 134 308 19891229 00h 10 W 96 183 290 19660221 00h
Sp 58 138 285 20130305 12h Sp 74 178 297 19910307 06h
S 33 90 38 20120712 10h S 37 134 322 19610601 00h
A 70 136 314 20141129 00h A 80 117 268 19891119 18h
4 W 58 180 314 19660221 06h 11 W 97 182 283 19660221 06h
Sp 54 135 290 20130305 04h Sp 73 177 290 19910307 09h
S 41 83 29 20120715 05h S 37 132 309 19610601 00h
A 60 142 321 20141129 06h A 83 159 293 19841105 06h
5 W 49 110 29 20140124 10h 12 W 81 172 293 19730117 21h
Sp 46 85 230 20130303 23h Sp 50 145 275 19910307 15h
S 33 88 28 20120612 02h S 26 143 296 19850601 09h
A 46 145 343 20141129 10h A 48 115 258 19821107 15h
6 W 63 122 319 19720223 06h 13 W 62 109 272 20130119 18h
Sp 45 189 353 20140304 11h Sp 48 112 257 20130306 08h
S 33 89 17 20120712 10h S 25 65 83 20130625 11h
A 63 146 326 20141129 10h A 40 91 81 20081011 00h
7 W 56 118 10 19940117 18h
Sp 52 112 22 19940403 09h
S 37 95 10 20070622 21h
A 46 149 319 20141129 16h
3642 Tides regime
The relative importance of the tide and the meteorological component was estimated by computing the
standard deviation of the tidal elevations and the meteorological component for the REDMAR stations
during the year 2012 (Figure 368 left) Examples of the probability density functions or histograms of both
components are also displayed in Figure 368 (right)
IOC TECHNICAL SERIES No 115 pp 115‐131 URI httphdlhandlenet18349182 2015
127
Figure 368 Left Standard deviation (Stdv) of the tide and the meteorological or residual component for
REDMAR tide gauges in the region (year 2012) Right From the top to the bottom tide and surge
histograms for Tarifa (Gulf of Cadiz) Arrecife (Lanzarote Eastern Canary Islands) and La Palma (Western
Canary Islands) (hourly data year 2012)
The amplitudes and phases of the main semidiurnal (M2 S2) and diurnal (O1 K1) constituents were compiled
in Table 366 not only for the REDMAR stations but also for the ones provided by other organizations The
period of data used for the computation is included as well as the Form Factor F obtained from the ratio of
the amplitudes of these main constituents
)()(
)()(
22
11
SAMA
KAOAF
The value of F is usually employed for tides classification (Pugh 1987) diurnal semidiurnal or mixed
Finally the spatial variation of the main tidal constituents is shown from COMAPI model at Figures 369
and 3610
The Form Factor values in Table 366 well below 25 for all the stations indicate a clear dominant
semidiurnal tide (two highs and two lows per day) in the Canary Current region from the Gulf of Cadiz up to
Mauritania This reflects in the two peaks observed in the tide histograms of Figure 368 (right) the most
probable levels being close to the mean high waters and mean low waters respectively This is coherent on
the other hand with the larger amplitudes of the semidiurnal constituents (M2 and S2) in Table 366 with
respect to the diurnal ones at all the stations we could compile
Station Tide Stdv (cm) Res Stdv (cm)
Bonanza 7048 648
Tarifa 3346 615
Tenerife 5595 388
Granadilla (Tenerife) 4973 944
La Palma 5199 391
La Gomera 4681 370
El Hierro 4747 400
Las Palmas (G C) 5925 419
Arinaga (G C) 5389 485
Fuerteventura 6406 344
Arrecife (Lanz) 6648 351
Goacutemez M Peacuterez‐Goacutemez B De Alfonso M Peacuterez S and Ruiz M I Waves and tides in the CCLME
128
Table 366 Amplitude and phase of the main semidiurnal and diurnal tidal constituents form factor (F)
and period of data for its computation REDMAR stations are shown in bold Harmonic constants provided
by other institutions for those stations shaded in grey
Station M2 S2 O1 K1 F Years Amp
(cm) Phase Lag
(o) Amp(cm)
Phase Lag (o)
Amp (cm)
Phase Lag (o)
Amp(cm)
Phase Lag (o)
Gulf of Cadiz
Bonanza 8987 6374 3089 9033 612 32258 615 6030 0102 2010‐2012 Caacutediz 9967 6513 3593 9282 660 30763 676 5128 0081 2013 Tarifa 4173 4163 1566 6888 048 12849 263 1295 0054 2010‐2012 Taacutenger (Morocco) 6832 6536 1792 7111 446 33613 658 6018 0128 2005
Canary Islands
Tenerife 7063 2892 2718 5261 469 29284 625 4032 0112 2010‐2012 Granadilla (Tenerife) 6130 2596 2463 4731 474 29226 595 4072 0124 2003‐2011 La Palma 6516 3030 2551 5296 458 29365 578 4164 0114 2007‐2012 La Gomera 5794 2358 2335 4592 434 29005 558 3297 0122 2007‐2012 El Hierro 5946 2123 2426 4376 430 29067 613 3233 0125 2010‐2012 Las Palmas (G Canaria) 7527 2838 2897 5317 488 29345 619 4005 0106 2008‐2012 Arinaga (Gran Canaria) 6808 2818 2664 5060 476 29233 604 3724 0114 2003‐2011 Fuerteventura 8089 3233 3053 5621 518 29434 614 3853 0102 2010‐2012 Arrecife (Lanzarote) 8423 3482 3173 5835 522 29599 684 4210 0104 2008‐2012
West Africa coast Ifni (Morocco) 9138 3847 4078 7655 353 27855 437 2901 0060 1949 C Bojador (W Sah) 6155 1865 3340 3824 398 28355 302 1575 0070 1948 Dakhla (W Sah) 6855 1130 1981 3347 374 27909 769 3513 0130 1949 Nouakchott (Maur) 4271 2898 1737 3000 425 ‐ 628 1504 0178 2007
The surge or residual component is small in this area (Figure 8 left) with larger standard deviation
(between 6‐7 cm) at the Gulf of Cadiz (higher latitudes more prompt to suffer the effect of storms) and
lower values at the Canary Islands stations (between 3‐5 cm) The small magnitude of the surge component
is also related to the narrow shelf especially at the Canary Islands We lack information concerning this
component of sea level along the coast of Africa where it is expected to be larger than in the Canary
Islands due to the broader continental shelf and the southern part of the CCLME Bonanza and Tarifa in
the Gulf of Cadiz are the stations with larger and lower amplitude of the tide respectively due to the
variability of M2 and S2 close to the Strait of Gibraltar as can be seen also in Figure 369 from COMAPI
model Maximum tidal ranges are around 15 m at Tarifa 35 m at Bonanza 25 m at La Palma and 32 m at
Lanzarote The relative importance of meteorological sea level at each station obtained as
Res_StdvTide_Stdv (Table enclosed in Figure 368) varies between the 184 of the tide at Tarifa due to
its small tide amplitude and the 5 at Arrecife
In the Canary Islands there is a longitudinal variation of the tide amplitude becoming larger for the four
main constituents in Table 366 as we move eastwards and approach the continental slope (African coast)
this can also be observed from the spatial variation of their amplitude in Figures 369 and 3610 for the
whole region This longitudinal variation is most evident in fact for the diurnal constituents (K1 and O1)
IOC TECHNICAL SERIES No 115 pp 115‐131 URI httphdlhandlenet18349182 2015
129
Figure 369 Spatial variation of amplitude and phase of M2 S2 and M4 harmonic constituents from the
COMAPI tidal atlas in the area of interest (resolution 1rsquotimes1rsquo)
M2
Amplitude (m)
M2
Phase lag (deg)
S2
Phase lag (deg)
S2
Amplitude (m)
M4
Amplitude (m)
M4
Phase lag (deg)
Goacutemez M Peacuterez‐Goacutemez B De Alfonso M Peacuterez S and Ruiz M I Waves and tides in the CCLME
130
In these figures it is also evident the significant decrease of the tide as we approach the Strait of Gibraltar
with respect to the surrounding Atlantic waters The phase lag of the main semidiurnal constituents
however presents a latitudinal variation (Figure 369 right) due to the propagation of the tidal waves from
South to North as a Kelvin wave (with larger amplitude close to the continental shelf)
The higher frequency tidal constituents (such as M4 and M6) are usually related to shallow waters non‐
linear effects This is why they are not important in the Canary Islands either (amplitudes less than 1 cm)
and their magnitude becomes significant at the Gulf of Cadiz (up to 5 cm of M4 amplitude in Bonanza and
47 cm in Tarifa) It should be taken into account that Bonanza station is at the mouth of the Guadalquivir
river so shallow water effects are even more important here For the stations along the west coast of
Africa provided by IHM the amplitude of M4 reaches also relatively higher values (3‐35 cm) the quality of
these tidal constants is not clear but the spatial variation observed from COMAPI tidal atlas reveals also a
coherent increase of the amplitude of this harmonic towards the shelf (Figure 369 bottom)
For all the mentioned constituents an increase of the amplitude of the tide is observed at the Western
Sahara coast north of Dakhla (around 245degN) most important for S2 and K1 Larger tidal amplitudes in the
region according to Figures 369 and 3610 are found along the Morocco coast This is not totally
coherent however with results from tide gauge observations in Table 366 which reflect as already
mentioned the larger tidal amplitudes at Bonanza and Caacutediz
Evaluation of the trends of the main harmonic constants in Las Palmas and Tenerife stations (not shown
see Peacuterez‐Goacutemez 2014 for details) do not reveal an increase on the tidal amplitude since 1992 Although
the time series is short this in principle does not confirm the increase of tidal amplitudes observed in other
regions of the world (Ray 2006 2009 Woodworth 2010) On the contrary only M2 presents a significant
negative trend at Las Palmas (Peacuterez‐Goacutemez 2014)
Figure 3610 Spatial variation of the amplitude of the main diurnal constituents (O1 and K1) from the
COMAPI tidal atlas in the area of interest (resolution 1rsquotimes1rsquo)
O1
Amplitude (m)
K1
Amplitude (m)
IOC TECHNICAL SERIES No 115 pp 115‐131 URI httphdlhandlenet18349182 2015
131
365 CONCLUSIONS AND RECOMMENDATIONS
Waves
Several wave climates exist in the area of interest The Strait of Gibraltar Gulf of Cadiz Moroccan Coast
and Canary Islands wave climates are well described by PdE buoys and models Golfo de Caacutediz buoy (Figure
365) and model points number 1 2 and 3 (Figure 367) represent open deep water conditions while the
other model points and buoys represent local conditions affected by the coastline South of 20deg
unfortunately there is no source of information on waves available
The most common significant wave height is between 1 m and 3 m being higher at northern locations and
decreasing as moving southwards In regard with the wave direction the Gulf of Cadiz is dominated by
waves coming from the west and the main directions turn first to the north and finally to the north‐east as
moving southwards to the Canary Islands
The highest extreme storms appear during the winter season This is valid not only for the significant wave
height but for the peak period too The climate is more severe in the north than in the south and the
extreme events come from the North West The extreme events are lowest at the locations close to the
coast because they are protected by it
Tides
With respect to the tide its variability has been reviewed based on the available tidal constants from tide
gauges in the region and the regional tidal atlas based on COMAPI model The type of tide is mainly
semidiurnal for the whole area with tidal ranges between 15 m and 35 m and with local variations
basically coherent between observations and the model The meteorological component of sea level is
relatively small with respect to the tide although we lack information from the African coast
The analysis has been made only for the area north of 225degN covered by COMAPI model In order to
complete the study the domain of this model should be extended to cover the whole region including
Senegal and Cape Verde There is also a significant lack of tide gauge observations in most of the countries
what would be crucial for detailed information of local tide conditions in the region
Acknowledgements
We would like to thank Mr Angora Aman (Laboratory of Atmospheric Physics and Fluid Mechanics Cote
drsquoIvoire) and Mr Salvador Moreno (IHM) for providing tidal constants information of several stations in the
African coast and Dr Florent Lyard (LEGOS) for providing the output of the new high resolution tidal atlas
based on the COMAPI model
Goacutemez M Peacuterez‐Goacutemez B De Alfonso M Peacuterez S and Ruiz M I Waves and tides in the CCLME
BIBLIOGRAPHY
Alfonso M Lopez J D Alvarez E and Ruiz M I 2005 Real time buoy data quality control and exploitation The Fifth COPRI International Conference on ocean Wave Measurement and Analysis (WAVES) Coasts Oceans Ports and Rivers Institute American Society of Civil Engineers Madrid
Aacutelvarez‐Fanjul E Peacuterez‐Goacutemez B and Rodriacuteguez I 2001 Nivmar a storm surge forecasting system for Spanish waters Scientia Marina Vol 65 pp 203‐212
Aacutelvarez‐Fanjul E Alfonso M Ruiz M I Lopez J D and Rodriguez I 2002 Real Time Monitoring of Spanish coastal waters The Deep Water Network Proceedings of the Third International Conference on EuroGOOS Athens Greece
Cancet M Lux M Peacutenard C Lyard F Birol F Lemouroux J Bourgogne S and Bronner E 2010 COMAPI New regional tide atlases and high frequency dynamical atmospheric correction Ocean Surface Topography Science Team meeting Lisbon Portugal 2010
Foreman F G G 1977 Manual for tidal heights analysis and predictions Pacific Marine Science Report 77‐10 Institute of Ocean Sciences Patricia Bay Sidney BC 58 pp (2004 revision)
Goacutemez‐Lahoz M and Carretero‐Albiach J C 2005 Wave Forecasting at the Spanish Coasts Journal of Atmospheric and Ocean Science Vol 10 (4) pp 389‐405
Peacuterez‐Goacutemez B 2014 Design and implementation of an operational sea level monitoring and forecasting system for the Spanish coast PhD Thesis Cantabria University Santander Spain 242 pp
Peacuterez‐Goacutemez B Aacutelvarez‐Fanjul E Peacuterez S de Alfonso M and Vela J 2013 Use of tide gauge data in operational oceanography and sea level hazard warning systems Journal of Operational Oceanography Vol 6 (2) pp 1‐18 doi 1010801755876X201311020147
Peacuterez‐Goacutemez B Payo A Loacutepez D Woodworth P L and Aacutelvarez‐Fanjul E 2014 Overlapping sea level time series measured using different technologies an example from the REDMAR Spanish network Natural Hazards and Earth System Science Vol 14 (3) pp 589‐610 doi105194nhess‐14‐589‐2014
Pugh D T 1987 Tides Surges and Mean Sea‐Level John Wiley amp Sons Ltd 472 pp
Ray R 2006 Secular changes of the M2 tide in the Gulf of Maine Continental Shelf Research Vol 26 (3) pp 422‐427
Ray R 2009 Secular changes in the solar semidiurnal tide of the western North Atlantic Ocean Geophysical Research Letters Vol 36 L19601
Tolman H L 1991 A third‐generation model for wind waves on slowly varying unsteady and inhomogeneous depths and currents Journal of Physical Oceanography Vol 21 pp 782‐797
WAMDI Group et al 1988 The WAM model a third‐generation ocean wave prediction model Journal of Physical Oceanography Vol 18 pp 1775‐1810
Woodworth P L 2010 A survey of recent changes in the main components of the ocean tide Continental Shelf Research Vol 30 (5) pp 1680‐1691
- IOCTS115-PRESENTATION 36 OK dots - revised -h
- IOCTS115-ARTICLE 36 - h
- IOCTS115-BIBLIOGRAPHY 36 OK DOIs - h
-

IOC TECHNICAL SERIES No 115 pp 115‐131 URI httphdlhandlenet18349182 2015
127
Figure 368 Left Standard deviation (Stdv) of the tide and the meteorological or residual component for
REDMAR tide gauges in the region (year 2012) Right From the top to the bottom tide and surge
histograms for Tarifa (Gulf of Cadiz) Arrecife (Lanzarote Eastern Canary Islands) and La Palma (Western
Canary Islands) (hourly data year 2012)
The amplitudes and phases of the main semidiurnal (M2 S2) and diurnal (O1 K1) constituents were compiled
in Table 366 not only for the REDMAR stations but also for the ones provided by other organizations The
period of data used for the computation is included as well as the Form Factor F obtained from the ratio of
the amplitudes of these main constituents
)()(
)()(
22
11
SAMA
KAOAF
The value of F is usually employed for tides classification (Pugh 1987) diurnal semidiurnal or mixed
Finally the spatial variation of the main tidal constituents is shown from COMAPI model at Figures 369
and 3610
The Form Factor values in Table 366 well below 25 for all the stations indicate a clear dominant
semidiurnal tide (two highs and two lows per day) in the Canary Current region from the Gulf of Cadiz up to
Mauritania This reflects in the two peaks observed in the tide histograms of Figure 368 (right) the most
probable levels being close to the mean high waters and mean low waters respectively This is coherent on
the other hand with the larger amplitudes of the semidiurnal constituents (M2 and S2) in Table 366 with
respect to the diurnal ones at all the stations we could compile
Station Tide Stdv (cm) Res Stdv (cm)
Bonanza 7048 648
Tarifa 3346 615
Tenerife 5595 388
Granadilla (Tenerife) 4973 944
La Palma 5199 391
La Gomera 4681 370
El Hierro 4747 400
Las Palmas (G C) 5925 419
Arinaga (G C) 5389 485
Fuerteventura 6406 344
Arrecife (Lanz) 6648 351
Goacutemez M Peacuterez‐Goacutemez B De Alfonso M Peacuterez S and Ruiz M I Waves and tides in the CCLME
128
Table 366 Amplitude and phase of the main semidiurnal and diurnal tidal constituents form factor (F)
and period of data for its computation REDMAR stations are shown in bold Harmonic constants provided
by other institutions for those stations shaded in grey
Station M2 S2 O1 K1 F Years Amp
(cm) Phase Lag
(o) Amp(cm)
Phase Lag (o)
Amp (cm)
Phase Lag (o)
Amp(cm)
Phase Lag (o)
Gulf of Cadiz
Bonanza 8987 6374 3089 9033 612 32258 615 6030 0102 2010‐2012 Caacutediz 9967 6513 3593 9282 660 30763 676 5128 0081 2013 Tarifa 4173 4163 1566 6888 048 12849 263 1295 0054 2010‐2012 Taacutenger (Morocco) 6832 6536 1792 7111 446 33613 658 6018 0128 2005
Canary Islands
Tenerife 7063 2892 2718 5261 469 29284 625 4032 0112 2010‐2012 Granadilla (Tenerife) 6130 2596 2463 4731 474 29226 595 4072 0124 2003‐2011 La Palma 6516 3030 2551 5296 458 29365 578 4164 0114 2007‐2012 La Gomera 5794 2358 2335 4592 434 29005 558 3297 0122 2007‐2012 El Hierro 5946 2123 2426 4376 430 29067 613 3233 0125 2010‐2012 Las Palmas (G Canaria) 7527 2838 2897 5317 488 29345 619 4005 0106 2008‐2012 Arinaga (Gran Canaria) 6808 2818 2664 5060 476 29233 604 3724 0114 2003‐2011 Fuerteventura 8089 3233 3053 5621 518 29434 614 3853 0102 2010‐2012 Arrecife (Lanzarote) 8423 3482 3173 5835 522 29599 684 4210 0104 2008‐2012
West Africa coast Ifni (Morocco) 9138 3847 4078 7655 353 27855 437 2901 0060 1949 C Bojador (W Sah) 6155 1865 3340 3824 398 28355 302 1575 0070 1948 Dakhla (W Sah) 6855 1130 1981 3347 374 27909 769 3513 0130 1949 Nouakchott (Maur) 4271 2898 1737 3000 425 ‐ 628 1504 0178 2007
The surge or residual component is small in this area (Figure 8 left) with larger standard deviation
(between 6‐7 cm) at the Gulf of Cadiz (higher latitudes more prompt to suffer the effect of storms) and
lower values at the Canary Islands stations (between 3‐5 cm) The small magnitude of the surge component
is also related to the narrow shelf especially at the Canary Islands We lack information concerning this
component of sea level along the coast of Africa where it is expected to be larger than in the Canary
Islands due to the broader continental shelf and the southern part of the CCLME Bonanza and Tarifa in
the Gulf of Cadiz are the stations with larger and lower amplitude of the tide respectively due to the
variability of M2 and S2 close to the Strait of Gibraltar as can be seen also in Figure 369 from COMAPI
model Maximum tidal ranges are around 15 m at Tarifa 35 m at Bonanza 25 m at La Palma and 32 m at
Lanzarote The relative importance of meteorological sea level at each station obtained as
Res_StdvTide_Stdv (Table enclosed in Figure 368) varies between the 184 of the tide at Tarifa due to
its small tide amplitude and the 5 at Arrecife
In the Canary Islands there is a longitudinal variation of the tide amplitude becoming larger for the four
main constituents in Table 366 as we move eastwards and approach the continental slope (African coast)
this can also be observed from the spatial variation of their amplitude in Figures 369 and 3610 for the
whole region This longitudinal variation is most evident in fact for the diurnal constituents (K1 and O1)
IOC TECHNICAL SERIES No 115 pp 115‐131 URI httphdlhandlenet18349182 2015
129
Figure 369 Spatial variation of amplitude and phase of M2 S2 and M4 harmonic constituents from the
COMAPI tidal atlas in the area of interest (resolution 1rsquotimes1rsquo)
M2
Amplitude (m)
M2
Phase lag (deg)
S2
Phase lag (deg)
S2
Amplitude (m)
M4
Amplitude (m)
M4
Phase lag (deg)
Goacutemez M Peacuterez‐Goacutemez B De Alfonso M Peacuterez S and Ruiz M I Waves and tides in the CCLME
130
In these figures it is also evident the significant decrease of the tide as we approach the Strait of Gibraltar
with respect to the surrounding Atlantic waters The phase lag of the main semidiurnal constituents
however presents a latitudinal variation (Figure 369 right) due to the propagation of the tidal waves from
South to North as a Kelvin wave (with larger amplitude close to the continental shelf)
The higher frequency tidal constituents (such as M4 and M6) are usually related to shallow waters non‐
linear effects This is why they are not important in the Canary Islands either (amplitudes less than 1 cm)
and their magnitude becomes significant at the Gulf of Cadiz (up to 5 cm of M4 amplitude in Bonanza and
47 cm in Tarifa) It should be taken into account that Bonanza station is at the mouth of the Guadalquivir
river so shallow water effects are even more important here For the stations along the west coast of
Africa provided by IHM the amplitude of M4 reaches also relatively higher values (3‐35 cm) the quality of
these tidal constants is not clear but the spatial variation observed from COMAPI tidal atlas reveals also a
coherent increase of the amplitude of this harmonic towards the shelf (Figure 369 bottom)
For all the mentioned constituents an increase of the amplitude of the tide is observed at the Western
Sahara coast north of Dakhla (around 245degN) most important for S2 and K1 Larger tidal amplitudes in the
region according to Figures 369 and 3610 are found along the Morocco coast This is not totally
coherent however with results from tide gauge observations in Table 366 which reflect as already
mentioned the larger tidal amplitudes at Bonanza and Caacutediz
Evaluation of the trends of the main harmonic constants in Las Palmas and Tenerife stations (not shown
see Peacuterez‐Goacutemez 2014 for details) do not reveal an increase on the tidal amplitude since 1992 Although
the time series is short this in principle does not confirm the increase of tidal amplitudes observed in other
regions of the world (Ray 2006 2009 Woodworth 2010) On the contrary only M2 presents a significant
negative trend at Las Palmas (Peacuterez‐Goacutemez 2014)
Figure 3610 Spatial variation of the amplitude of the main diurnal constituents (O1 and K1) from the
COMAPI tidal atlas in the area of interest (resolution 1rsquotimes1rsquo)
O1
Amplitude (m)
K1
Amplitude (m)
IOC TECHNICAL SERIES No 115 pp 115‐131 URI httphdlhandlenet18349182 2015
131
365 CONCLUSIONS AND RECOMMENDATIONS
Waves
Several wave climates exist in the area of interest The Strait of Gibraltar Gulf of Cadiz Moroccan Coast
and Canary Islands wave climates are well described by PdE buoys and models Golfo de Caacutediz buoy (Figure
365) and model points number 1 2 and 3 (Figure 367) represent open deep water conditions while the
other model points and buoys represent local conditions affected by the coastline South of 20deg
unfortunately there is no source of information on waves available
The most common significant wave height is between 1 m and 3 m being higher at northern locations and
decreasing as moving southwards In regard with the wave direction the Gulf of Cadiz is dominated by
waves coming from the west and the main directions turn first to the north and finally to the north‐east as
moving southwards to the Canary Islands
The highest extreme storms appear during the winter season This is valid not only for the significant wave
height but for the peak period too The climate is more severe in the north than in the south and the
extreme events come from the North West The extreme events are lowest at the locations close to the
coast because they are protected by it
Tides
With respect to the tide its variability has been reviewed based on the available tidal constants from tide
gauges in the region and the regional tidal atlas based on COMAPI model The type of tide is mainly
semidiurnal for the whole area with tidal ranges between 15 m and 35 m and with local variations
basically coherent between observations and the model The meteorological component of sea level is
relatively small with respect to the tide although we lack information from the African coast
The analysis has been made only for the area north of 225degN covered by COMAPI model In order to
complete the study the domain of this model should be extended to cover the whole region including
Senegal and Cape Verde There is also a significant lack of tide gauge observations in most of the countries
what would be crucial for detailed information of local tide conditions in the region
Acknowledgements
We would like to thank Mr Angora Aman (Laboratory of Atmospheric Physics and Fluid Mechanics Cote
drsquoIvoire) and Mr Salvador Moreno (IHM) for providing tidal constants information of several stations in the
African coast and Dr Florent Lyard (LEGOS) for providing the output of the new high resolution tidal atlas
based on the COMAPI model
Goacutemez M Peacuterez‐Goacutemez B De Alfonso M Peacuterez S and Ruiz M I Waves and tides in the CCLME
BIBLIOGRAPHY
Alfonso M Lopez J D Alvarez E and Ruiz M I 2005 Real time buoy data quality control and exploitation The Fifth COPRI International Conference on ocean Wave Measurement and Analysis (WAVES) Coasts Oceans Ports and Rivers Institute American Society of Civil Engineers Madrid
Aacutelvarez‐Fanjul E Peacuterez‐Goacutemez B and Rodriacuteguez I 2001 Nivmar a storm surge forecasting system for Spanish waters Scientia Marina Vol 65 pp 203‐212
Aacutelvarez‐Fanjul E Alfonso M Ruiz M I Lopez J D and Rodriguez I 2002 Real Time Monitoring of Spanish coastal waters The Deep Water Network Proceedings of the Third International Conference on EuroGOOS Athens Greece
Cancet M Lux M Peacutenard C Lyard F Birol F Lemouroux J Bourgogne S and Bronner E 2010 COMAPI New regional tide atlases and high frequency dynamical atmospheric correction Ocean Surface Topography Science Team meeting Lisbon Portugal 2010
Foreman F G G 1977 Manual for tidal heights analysis and predictions Pacific Marine Science Report 77‐10 Institute of Ocean Sciences Patricia Bay Sidney BC 58 pp (2004 revision)
Goacutemez‐Lahoz M and Carretero‐Albiach J C 2005 Wave Forecasting at the Spanish Coasts Journal of Atmospheric and Ocean Science Vol 10 (4) pp 389‐405
Peacuterez‐Goacutemez B 2014 Design and implementation of an operational sea level monitoring and forecasting system for the Spanish coast PhD Thesis Cantabria University Santander Spain 242 pp
Peacuterez‐Goacutemez B Aacutelvarez‐Fanjul E Peacuterez S de Alfonso M and Vela J 2013 Use of tide gauge data in operational oceanography and sea level hazard warning systems Journal of Operational Oceanography Vol 6 (2) pp 1‐18 doi 1010801755876X201311020147
Peacuterez‐Goacutemez B Payo A Loacutepez D Woodworth P L and Aacutelvarez‐Fanjul E 2014 Overlapping sea level time series measured using different technologies an example from the REDMAR Spanish network Natural Hazards and Earth System Science Vol 14 (3) pp 589‐610 doi105194nhess‐14‐589‐2014
Pugh D T 1987 Tides Surges and Mean Sea‐Level John Wiley amp Sons Ltd 472 pp
Ray R 2006 Secular changes of the M2 tide in the Gulf of Maine Continental Shelf Research Vol 26 (3) pp 422‐427
Ray R 2009 Secular changes in the solar semidiurnal tide of the western North Atlantic Ocean Geophysical Research Letters Vol 36 L19601
Tolman H L 1991 A third‐generation model for wind waves on slowly varying unsteady and inhomogeneous depths and currents Journal of Physical Oceanography Vol 21 pp 782‐797
WAMDI Group et al 1988 The WAM model a third‐generation ocean wave prediction model Journal of Physical Oceanography Vol 18 pp 1775‐1810
Woodworth P L 2010 A survey of recent changes in the main components of the ocean tide Continental Shelf Research Vol 30 (5) pp 1680‐1691
- IOCTS115-PRESENTATION 36 OK dots - revised -h
- IOCTS115-ARTICLE 36 - h
- IOCTS115-BIBLIOGRAPHY 36 OK DOIs - h
-

Goacutemez M Peacuterez‐Goacutemez B De Alfonso M Peacuterez S and Ruiz M I Waves and tides in the CCLME
128
Table 366 Amplitude and phase of the main semidiurnal and diurnal tidal constituents form factor (F)
and period of data for its computation REDMAR stations are shown in bold Harmonic constants provided
by other institutions for those stations shaded in grey
Station M2 S2 O1 K1 F Years Amp
(cm) Phase Lag
(o) Amp(cm)
Phase Lag (o)
Amp (cm)
Phase Lag (o)
Amp(cm)
Phase Lag (o)
Gulf of Cadiz
Bonanza 8987 6374 3089 9033 612 32258 615 6030 0102 2010‐2012 Caacutediz 9967 6513 3593 9282 660 30763 676 5128 0081 2013 Tarifa 4173 4163 1566 6888 048 12849 263 1295 0054 2010‐2012 Taacutenger (Morocco) 6832 6536 1792 7111 446 33613 658 6018 0128 2005
Canary Islands
Tenerife 7063 2892 2718 5261 469 29284 625 4032 0112 2010‐2012 Granadilla (Tenerife) 6130 2596 2463 4731 474 29226 595 4072 0124 2003‐2011 La Palma 6516 3030 2551 5296 458 29365 578 4164 0114 2007‐2012 La Gomera 5794 2358 2335 4592 434 29005 558 3297 0122 2007‐2012 El Hierro 5946 2123 2426 4376 430 29067 613 3233 0125 2010‐2012 Las Palmas (G Canaria) 7527 2838 2897 5317 488 29345 619 4005 0106 2008‐2012 Arinaga (Gran Canaria) 6808 2818 2664 5060 476 29233 604 3724 0114 2003‐2011 Fuerteventura 8089 3233 3053 5621 518 29434 614 3853 0102 2010‐2012 Arrecife (Lanzarote) 8423 3482 3173 5835 522 29599 684 4210 0104 2008‐2012
West Africa coast Ifni (Morocco) 9138 3847 4078 7655 353 27855 437 2901 0060 1949 C Bojador (W Sah) 6155 1865 3340 3824 398 28355 302 1575 0070 1948 Dakhla (W Sah) 6855 1130 1981 3347 374 27909 769 3513 0130 1949 Nouakchott (Maur) 4271 2898 1737 3000 425 ‐ 628 1504 0178 2007
The surge or residual component is small in this area (Figure 8 left) with larger standard deviation
(between 6‐7 cm) at the Gulf of Cadiz (higher latitudes more prompt to suffer the effect of storms) and
lower values at the Canary Islands stations (between 3‐5 cm) The small magnitude of the surge component
is also related to the narrow shelf especially at the Canary Islands We lack information concerning this
component of sea level along the coast of Africa where it is expected to be larger than in the Canary
Islands due to the broader continental shelf and the southern part of the CCLME Bonanza and Tarifa in
the Gulf of Cadiz are the stations with larger and lower amplitude of the tide respectively due to the
variability of M2 and S2 close to the Strait of Gibraltar as can be seen also in Figure 369 from COMAPI
model Maximum tidal ranges are around 15 m at Tarifa 35 m at Bonanza 25 m at La Palma and 32 m at
Lanzarote The relative importance of meteorological sea level at each station obtained as
Res_StdvTide_Stdv (Table enclosed in Figure 368) varies between the 184 of the tide at Tarifa due to
its small tide amplitude and the 5 at Arrecife
In the Canary Islands there is a longitudinal variation of the tide amplitude becoming larger for the four
main constituents in Table 366 as we move eastwards and approach the continental slope (African coast)
this can also be observed from the spatial variation of their amplitude in Figures 369 and 3610 for the
whole region This longitudinal variation is most evident in fact for the diurnal constituents (K1 and O1)
IOC TECHNICAL SERIES No 115 pp 115‐131 URI httphdlhandlenet18349182 2015
129
Figure 369 Spatial variation of amplitude and phase of M2 S2 and M4 harmonic constituents from the
COMAPI tidal atlas in the area of interest (resolution 1rsquotimes1rsquo)
M2
Amplitude (m)
M2
Phase lag (deg)
S2
Phase lag (deg)
S2
Amplitude (m)
M4
Amplitude (m)
M4
Phase lag (deg)
Goacutemez M Peacuterez‐Goacutemez B De Alfonso M Peacuterez S and Ruiz M I Waves and tides in the CCLME
130
In these figures it is also evident the significant decrease of the tide as we approach the Strait of Gibraltar
with respect to the surrounding Atlantic waters The phase lag of the main semidiurnal constituents
however presents a latitudinal variation (Figure 369 right) due to the propagation of the tidal waves from
South to North as a Kelvin wave (with larger amplitude close to the continental shelf)
The higher frequency tidal constituents (such as M4 and M6) are usually related to shallow waters non‐
linear effects This is why they are not important in the Canary Islands either (amplitudes less than 1 cm)
and their magnitude becomes significant at the Gulf of Cadiz (up to 5 cm of M4 amplitude in Bonanza and
47 cm in Tarifa) It should be taken into account that Bonanza station is at the mouth of the Guadalquivir
river so shallow water effects are even more important here For the stations along the west coast of
Africa provided by IHM the amplitude of M4 reaches also relatively higher values (3‐35 cm) the quality of
these tidal constants is not clear but the spatial variation observed from COMAPI tidal atlas reveals also a
coherent increase of the amplitude of this harmonic towards the shelf (Figure 369 bottom)
For all the mentioned constituents an increase of the amplitude of the tide is observed at the Western
Sahara coast north of Dakhla (around 245degN) most important for S2 and K1 Larger tidal amplitudes in the
region according to Figures 369 and 3610 are found along the Morocco coast This is not totally
coherent however with results from tide gauge observations in Table 366 which reflect as already
mentioned the larger tidal amplitudes at Bonanza and Caacutediz
Evaluation of the trends of the main harmonic constants in Las Palmas and Tenerife stations (not shown
see Peacuterez‐Goacutemez 2014 for details) do not reveal an increase on the tidal amplitude since 1992 Although
the time series is short this in principle does not confirm the increase of tidal amplitudes observed in other
regions of the world (Ray 2006 2009 Woodworth 2010) On the contrary only M2 presents a significant
negative trend at Las Palmas (Peacuterez‐Goacutemez 2014)
Figure 3610 Spatial variation of the amplitude of the main diurnal constituents (O1 and K1) from the
COMAPI tidal atlas in the area of interest (resolution 1rsquotimes1rsquo)
O1
Amplitude (m)
K1
Amplitude (m)
IOC TECHNICAL SERIES No 115 pp 115‐131 URI httphdlhandlenet18349182 2015
131
365 CONCLUSIONS AND RECOMMENDATIONS
Waves
Several wave climates exist in the area of interest The Strait of Gibraltar Gulf of Cadiz Moroccan Coast
and Canary Islands wave climates are well described by PdE buoys and models Golfo de Caacutediz buoy (Figure
365) and model points number 1 2 and 3 (Figure 367) represent open deep water conditions while the
other model points and buoys represent local conditions affected by the coastline South of 20deg
unfortunately there is no source of information on waves available
The most common significant wave height is between 1 m and 3 m being higher at northern locations and
decreasing as moving southwards In regard with the wave direction the Gulf of Cadiz is dominated by
waves coming from the west and the main directions turn first to the north and finally to the north‐east as
moving southwards to the Canary Islands
The highest extreme storms appear during the winter season This is valid not only for the significant wave
height but for the peak period too The climate is more severe in the north than in the south and the
extreme events come from the North West The extreme events are lowest at the locations close to the
coast because they are protected by it
Tides
With respect to the tide its variability has been reviewed based on the available tidal constants from tide
gauges in the region and the regional tidal atlas based on COMAPI model The type of tide is mainly
semidiurnal for the whole area with tidal ranges between 15 m and 35 m and with local variations
basically coherent between observations and the model The meteorological component of sea level is
relatively small with respect to the tide although we lack information from the African coast
The analysis has been made only for the area north of 225degN covered by COMAPI model In order to
complete the study the domain of this model should be extended to cover the whole region including
Senegal and Cape Verde There is also a significant lack of tide gauge observations in most of the countries
what would be crucial for detailed information of local tide conditions in the region
Acknowledgements
We would like to thank Mr Angora Aman (Laboratory of Atmospheric Physics and Fluid Mechanics Cote
drsquoIvoire) and Mr Salvador Moreno (IHM) for providing tidal constants information of several stations in the
African coast and Dr Florent Lyard (LEGOS) for providing the output of the new high resolution tidal atlas
based on the COMAPI model
Goacutemez M Peacuterez‐Goacutemez B De Alfonso M Peacuterez S and Ruiz M I Waves and tides in the CCLME
BIBLIOGRAPHY
Alfonso M Lopez J D Alvarez E and Ruiz M I 2005 Real time buoy data quality control and exploitation The Fifth COPRI International Conference on ocean Wave Measurement and Analysis (WAVES) Coasts Oceans Ports and Rivers Institute American Society of Civil Engineers Madrid
Aacutelvarez‐Fanjul E Peacuterez‐Goacutemez B and Rodriacuteguez I 2001 Nivmar a storm surge forecasting system for Spanish waters Scientia Marina Vol 65 pp 203‐212
Aacutelvarez‐Fanjul E Alfonso M Ruiz M I Lopez J D and Rodriguez I 2002 Real Time Monitoring of Spanish coastal waters The Deep Water Network Proceedings of the Third International Conference on EuroGOOS Athens Greece
Cancet M Lux M Peacutenard C Lyard F Birol F Lemouroux J Bourgogne S and Bronner E 2010 COMAPI New regional tide atlases and high frequency dynamical atmospheric correction Ocean Surface Topography Science Team meeting Lisbon Portugal 2010
Foreman F G G 1977 Manual for tidal heights analysis and predictions Pacific Marine Science Report 77‐10 Institute of Ocean Sciences Patricia Bay Sidney BC 58 pp (2004 revision)
Goacutemez‐Lahoz M and Carretero‐Albiach J C 2005 Wave Forecasting at the Spanish Coasts Journal of Atmospheric and Ocean Science Vol 10 (4) pp 389‐405
Peacuterez‐Goacutemez B 2014 Design and implementation of an operational sea level monitoring and forecasting system for the Spanish coast PhD Thesis Cantabria University Santander Spain 242 pp
Peacuterez‐Goacutemez B Aacutelvarez‐Fanjul E Peacuterez S de Alfonso M and Vela J 2013 Use of tide gauge data in operational oceanography and sea level hazard warning systems Journal of Operational Oceanography Vol 6 (2) pp 1‐18 doi 1010801755876X201311020147
Peacuterez‐Goacutemez B Payo A Loacutepez D Woodworth P L and Aacutelvarez‐Fanjul E 2014 Overlapping sea level time series measured using different technologies an example from the REDMAR Spanish network Natural Hazards and Earth System Science Vol 14 (3) pp 589‐610 doi105194nhess‐14‐589‐2014
Pugh D T 1987 Tides Surges and Mean Sea‐Level John Wiley amp Sons Ltd 472 pp
Ray R 2006 Secular changes of the M2 tide in the Gulf of Maine Continental Shelf Research Vol 26 (3) pp 422‐427
Ray R 2009 Secular changes in the solar semidiurnal tide of the western North Atlantic Ocean Geophysical Research Letters Vol 36 L19601
Tolman H L 1991 A third‐generation model for wind waves on slowly varying unsteady and inhomogeneous depths and currents Journal of Physical Oceanography Vol 21 pp 782‐797
WAMDI Group et al 1988 The WAM model a third‐generation ocean wave prediction model Journal of Physical Oceanography Vol 18 pp 1775‐1810
Woodworth P L 2010 A survey of recent changes in the main components of the ocean tide Continental Shelf Research Vol 30 (5) pp 1680‐1691
- IOCTS115-PRESENTATION 36 OK dots - revised -h
- IOCTS115-ARTICLE 36 - h
- IOCTS115-BIBLIOGRAPHY 36 OK DOIs - h
-

IOC TECHNICAL SERIES No 115 pp 115‐131 URI httphdlhandlenet18349182 2015
129
Figure 369 Spatial variation of amplitude and phase of M2 S2 and M4 harmonic constituents from the
COMAPI tidal atlas in the area of interest (resolution 1rsquotimes1rsquo)
M2
Amplitude (m)
M2
Phase lag (deg)
S2
Phase lag (deg)
S2
Amplitude (m)
M4
Amplitude (m)
M4
Phase lag (deg)
Goacutemez M Peacuterez‐Goacutemez B De Alfonso M Peacuterez S and Ruiz M I Waves and tides in the CCLME
130
In these figures it is also evident the significant decrease of the tide as we approach the Strait of Gibraltar
with respect to the surrounding Atlantic waters The phase lag of the main semidiurnal constituents
however presents a latitudinal variation (Figure 369 right) due to the propagation of the tidal waves from
South to North as a Kelvin wave (with larger amplitude close to the continental shelf)
The higher frequency tidal constituents (such as M4 and M6) are usually related to shallow waters non‐
linear effects This is why they are not important in the Canary Islands either (amplitudes less than 1 cm)
and their magnitude becomes significant at the Gulf of Cadiz (up to 5 cm of M4 amplitude in Bonanza and
47 cm in Tarifa) It should be taken into account that Bonanza station is at the mouth of the Guadalquivir
river so shallow water effects are even more important here For the stations along the west coast of
Africa provided by IHM the amplitude of M4 reaches also relatively higher values (3‐35 cm) the quality of
these tidal constants is not clear but the spatial variation observed from COMAPI tidal atlas reveals also a
coherent increase of the amplitude of this harmonic towards the shelf (Figure 369 bottom)
For all the mentioned constituents an increase of the amplitude of the tide is observed at the Western
Sahara coast north of Dakhla (around 245degN) most important for S2 and K1 Larger tidal amplitudes in the
region according to Figures 369 and 3610 are found along the Morocco coast This is not totally
coherent however with results from tide gauge observations in Table 366 which reflect as already
mentioned the larger tidal amplitudes at Bonanza and Caacutediz
Evaluation of the trends of the main harmonic constants in Las Palmas and Tenerife stations (not shown
see Peacuterez‐Goacutemez 2014 for details) do not reveal an increase on the tidal amplitude since 1992 Although
the time series is short this in principle does not confirm the increase of tidal amplitudes observed in other
regions of the world (Ray 2006 2009 Woodworth 2010) On the contrary only M2 presents a significant
negative trend at Las Palmas (Peacuterez‐Goacutemez 2014)
Figure 3610 Spatial variation of the amplitude of the main diurnal constituents (O1 and K1) from the
COMAPI tidal atlas in the area of interest (resolution 1rsquotimes1rsquo)
O1
Amplitude (m)
K1
Amplitude (m)
IOC TECHNICAL SERIES No 115 pp 115‐131 URI httphdlhandlenet18349182 2015
131
365 CONCLUSIONS AND RECOMMENDATIONS
Waves
Several wave climates exist in the area of interest The Strait of Gibraltar Gulf of Cadiz Moroccan Coast
and Canary Islands wave climates are well described by PdE buoys and models Golfo de Caacutediz buoy (Figure
365) and model points number 1 2 and 3 (Figure 367) represent open deep water conditions while the
other model points and buoys represent local conditions affected by the coastline South of 20deg
unfortunately there is no source of information on waves available
The most common significant wave height is between 1 m and 3 m being higher at northern locations and
decreasing as moving southwards In regard with the wave direction the Gulf of Cadiz is dominated by
waves coming from the west and the main directions turn first to the north and finally to the north‐east as
moving southwards to the Canary Islands
The highest extreme storms appear during the winter season This is valid not only for the significant wave
height but for the peak period too The climate is more severe in the north than in the south and the
extreme events come from the North West The extreme events are lowest at the locations close to the
coast because they are protected by it
Tides
With respect to the tide its variability has been reviewed based on the available tidal constants from tide
gauges in the region and the regional tidal atlas based on COMAPI model The type of tide is mainly
semidiurnal for the whole area with tidal ranges between 15 m and 35 m and with local variations
basically coherent between observations and the model The meteorological component of sea level is
relatively small with respect to the tide although we lack information from the African coast
The analysis has been made only for the area north of 225degN covered by COMAPI model In order to
complete the study the domain of this model should be extended to cover the whole region including
Senegal and Cape Verde There is also a significant lack of tide gauge observations in most of the countries
what would be crucial for detailed information of local tide conditions in the region
Acknowledgements
We would like to thank Mr Angora Aman (Laboratory of Atmospheric Physics and Fluid Mechanics Cote
drsquoIvoire) and Mr Salvador Moreno (IHM) for providing tidal constants information of several stations in the
African coast and Dr Florent Lyard (LEGOS) for providing the output of the new high resolution tidal atlas
based on the COMAPI model
Goacutemez M Peacuterez‐Goacutemez B De Alfonso M Peacuterez S and Ruiz M I Waves and tides in the CCLME
BIBLIOGRAPHY
Alfonso M Lopez J D Alvarez E and Ruiz M I 2005 Real time buoy data quality control and exploitation The Fifth COPRI International Conference on ocean Wave Measurement and Analysis (WAVES) Coasts Oceans Ports and Rivers Institute American Society of Civil Engineers Madrid
Aacutelvarez‐Fanjul E Peacuterez‐Goacutemez B and Rodriacuteguez I 2001 Nivmar a storm surge forecasting system for Spanish waters Scientia Marina Vol 65 pp 203‐212
Aacutelvarez‐Fanjul E Alfonso M Ruiz M I Lopez J D and Rodriguez I 2002 Real Time Monitoring of Spanish coastal waters The Deep Water Network Proceedings of the Third International Conference on EuroGOOS Athens Greece
Cancet M Lux M Peacutenard C Lyard F Birol F Lemouroux J Bourgogne S and Bronner E 2010 COMAPI New regional tide atlases and high frequency dynamical atmospheric correction Ocean Surface Topography Science Team meeting Lisbon Portugal 2010
Foreman F G G 1977 Manual for tidal heights analysis and predictions Pacific Marine Science Report 77‐10 Institute of Ocean Sciences Patricia Bay Sidney BC 58 pp (2004 revision)
Goacutemez‐Lahoz M and Carretero‐Albiach J C 2005 Wave Forecasting at the Spanish Coasts Journal of Atmospheric and Ocean Science Vol 10 (4) pp 389‐405
Peacuterez‐Goacutemez B 2014 Design and implementation of an operational sea level monitoring and forecasting system for the Spanish coast PhD Thesis Cantabria University Santander Spain 242 pp
Peacuterez‐Goacutemez B Aacutelvarez‐Fanjul E Peacuterez S de Alfonso M and Vela J 2013 Use of tide gauge data in operational oceanography and sea level hazard warning systems Journal of Operational Oceanography Vol 6 (2) pp 1‐18 doi 1010801755876X201311020147
Peacuterez‐Goacutemez B Payo A Loacutepez D Woodworth P L and Aacutelvarez‐Fanjul E 2014 Overlapping sea level time series measured using different technologies an example from the REDMAR Spanish network Natural Hazards and Earth System Science Vol 14 (3) pp 589‐610 doi105194nhess‐14‐589‐2014
Pugh D T 1987 Tides Surges and Mean Sea‐Level John Wiley amp Sons Ltd 472 pp
Ray R 2006 Secular changes of the M2 tide in the Gulf of Maine Continental Shelf Research Vol 26 (3) pp 422‐427
Ray R 2009 Secular changes in the solar semidiurnal tide of the western North Atlantic Ocean Geophysical Research Letters Vol 36 L19601
Tolman H L 1991 A third‐generation model for wind waves on slowly varying unsteady and inhomogeneous depths and currents Journal of Physical Oceanography Vol 21 pp 782‐797
WAMDI Group et al 1988 The WAM model a third‐generation ocean wave prediction model Journal of Physical Oceanography Vol 18 pp 1775‐1810
Woodworth P L 2010 A survey of recent changes in the main components of the ocean tide Continental Shelf Research Vol 30 (5) pp 1680‐1691
- IOCTS115-PRESENTATION 36 OK dots - revised -h
- IOCTS115-ARTICLE 36 - h
- IOCTS115-BIBLIOGRAPHY 36 OK DOIs - h
-

Goacutemez M Peacuterez‐Goacutemez B De Alfonso M Peacuterez S and Ruiz M I Waves and tides in the CCLME
130
In these figures it is also evident the significant decrease of the tide as we approach the Strait of Gibraltar
with respect to the surrounding Atlantic waters The phase lag of the main semidiurnal constituents
however presents a latitudinal variation (Figure 369 right) due to the propagation of the tidal waves from
South to North as a Kelvin wave (with larger amplitude close to the continental shelf)
The higher frequency tidal constituents (such as M4 and M6) are usually related to shallow waters non‐
linear effects This is why they are not important in the Canary Islands either (amplitudes less than 1 cm)
and their magnitude becomes significant at the Gulf of Cadiz (up to 5 cm of M4 amplitude in Bonanza and
47 cm in Tarifa) It should be taken into account that Bonanza station is at the mouth of the Guadalquivir
river so shallow water effects are even more important here For the stations along the west coast of
Africa provided by IHM the amplitude of M4 reaches also relatively higher values (3‐35 cm) the quality of
these tidal constants is not clear but the spatial variation observed from COMAPI tidal atlas reveals also a
coherent increase of the amplitude of this harmonic towards the shelf (Figure 369 bottom)
For all the mentioned constituents an increase of the amplitude of the tide is observed at the Western
Sahara coast north of Dakhla (around 245degN) most important for S2 and K1 Larger tidal amplitudes in the
region according to Figures 369 and 3610 are found along the Morocco coast This is not totally
coherent however with results from tide gauge observations in Table 366 which reflect as already
mentioned the larger tidal amplitudes at Bonanza and Caacutediz
Evaluation of the trends of the main harmonic constants in Las Palmas and Tenerife stations (not shown
see Peacuterez‐Goacutemez 2014 for details) do not reveal an increase on the tidal amplitude since 1992 Although
the time series is short this in principle does not confirm the increase of tidal amplitudes observed in other
regions of the world (Ray 2006 2009 Woodworth 2010) On the contrary only M2 presents a significant
negative trend at Las Palmas (Peacuterez‐Goacutemez 2014)
Figure 3610 Spatial variation of the amplitude of the main diurnal constituents (O1 and K1) from the
COMAPI tidal atlas in the area of interest (resolution 1rsquotimes1rsquo)
O1
Amplitude (m)
K1
Amplitude (m)
IOC TECHNICAL SERIES No 115 pp 115‐131 URI httphdlhandlenet18349182 2015
131
365 CONCLUSIONS AND RECOMMENDATIONS
Waves
Several wave climates exist in the area of interest The Strait of Gibraltar Gulf of Cadiz Moroccan Coast
and Canary Islands wave climates are well described by PdE buoys and models Golfo de Caacutediz buoy (Figure
365) and model points number 1 2 and 3 (Figure 367) represent open deep water conditions while the
other model points and buoys represent local conditions affected by the coastline South of 20deg
unfortunately there is no source of information on waves available
The most common significant wave height is between 1 m and 3 m being higher at northern locations and
decreasing as moving southwards In regard with the wave direction the Gulf of Cadiz is dominated by
waves coming from the west and the main directions turn first to the north and finally to the north‐east as
moving southwards to the Canary Islands
The highest extreme storms appear during the winter season This is valid not only for the significant wave
height but for the peak period too The climate is more severe in the north than in the south and the
extreme events come from the North West The extreme events are lowest at the locations close to the
coast because they are protected by it
Tides
With respect to the tide its variability has been reviewed based on the available tidal constants from tide
gauges in the region and the regional tidal atlas based on COMAPI model The type of tide is mainly
semidiurnal for the whole area with tidal ranges between 15 m and 35 m and with local variations
basically coherent between observations and the model The meteorological component of sea level is
relatively small with respect to the tide although we lack information from the African coast
The analysis has been made only for the area north of 225degN covered by COMAPI model In order to
complete the study the domain of this model should be extended to cover the whole region including
Senegal and Cape Verde There is also a significant lack of tide gauge observations in most of the countries
what would be crucial for detailed information of local tide conditions in the region
Acknowledgements
We would like to thank Mr Angora Aman (Laboratory of Atmospheric Physics and Fluid Mechanics Cote
drsquoIvoire) and Mr Salvador Moreno (IHM) for providing tidal constants information of several stations in the
African coast and Dr Florent Lyard (LEGOS) for providing the output of the new high resolution tidal atlas
based on the COMAPI model
Goacutemez M Peacuterez‐Goacutemez B De Alfonso M Peacuterez S and Ruiz M I Waves and tides in the CCLME
BIBLIOGRAPHY
Alfonso M Lopez J D Alvarez E and Ruiz M I 2005 Real time buoy data quality control and exploitation The Fifth COPRI International Conference on ocean Wave Measurement and Analysis (WAVES) Coasts Oceans Ports and Rivers Institute American Society of Civil Engineers Madrid
Aacutelvarez‐Fanjul E Peacuterez‐Goacutemez B and Rodriacuteguez I 2001 Nivmar a storm surge forecasting system for Spanish waters Scientia Marina Vol 65 pp 203‐212
Aacutelvarez‐Fanjul E Alfonso M Ruiz M I Lopez J D and Rodriguez I 2002 Real Time Monitoring of Spanish coastal waters The Deep Water Network Proceedings of the Third International Conference on EuroGOOS Athens Greece
Cancet M Lux M Peacutenard C Lyard F Birol F Lemouroux J Bourgogne S and Bronner E 2010 COMAPI New regional tide atlases and high frequency dynamical atmospheric correction Ocean Surface Topography Science Team meeting Lisbon Portugal 2010
Foreman F G G 1977 Manual for tidal heights analysis and predictions Pacific Marine Science Report 77‐10 Institute of Ocean Sciences Patricia Bay Sidney BC 58 pp (2004 revision)
Goacutemez‐Lahoz M and Carretero‐Albiach J C 2005 Wave Forecasting at the Spanish Coasts Journal of Atmospheric and Ocean Science Vol 10 (4) pp 389‐405
Peacuterez‐Goacutemez B 2014 Design and implementation of an operational sea level monitoring and forecasting system for the Spanish coast PhD Thesis Cantabria University Santander Spain 242 pp
Peacuterez‐Goacutemez B Aacutelvarez‐Fanjul E Peacuterez S de Alfonso M and Vela J 2013 Use of tide gauge data in operational oceanography and sea level hazard warning systems Journal of Operational Oceanography Vol 6 (2) pp 1‐18 doi 1010801755876X201311020147
Peacuterez‐Goacutemez B Payo A Loacutepez D Woodworth P L and Aacutelvarez‐Fanjul E 2014 Overlapping sea level time series measured using different technologies an example from the REDMAR Spanish network Natural Hazards and Earth System Science Vol 14 (3) pp 589‐610 doi105194nhess‐14‐589‐2014
Pugh D T 1987 Tides Surges and Mean Sea‐Level John Wiley amp Sons Ltd 472 pp
Ray R 2006 Secular changes of the M2 tide in the Gulf of Maine Continental Shelf Research Vol 26 (3) pp 422‐427
Ray R 2009 Secular changes in the solar semidiurnal tide of the western North Atlantic Ocean Geophysical Research Letters Vol 36 L19601
Tolman H L 1991 A third‐generation model for wind waves on slowly varying unsteady and inhomogeneous depths and currents Journal of Physical Oceanography Vol 21 pp 782‐797
WAMDI Group et al 1988 The WAM model a third‐generation ocean wave prediction model Journal of Physical Oceanography Vol 18 pp 1775‐1810
Woodworth P L 2010 A survey of recent changes in the main components of the ocean tide Continental Shelf Research Vol 30 (5) pp 1680‐1691
- IOCTS115-PRESENTATION 36 OK dots - revised -h
- IOCTS115-ARTICLE 36 - h
- IOCTS115-BIBLIOGRAPHY 36 OK DOIs - h
-