wbsn q412 investor presentation
TRANSCRIPT

© 2012 Websense, Inc.
Q4’12 Investor Presentation
© 2012 Websense, Inc. 2
GAAP to Non-GAAP Reconciliation During this presentation references to financial measures of Websense, Inc. (“Websense”) will include references to non-GAAP financial measures. Websense provides a reconciliation between GAAP and non-GAAP financial information on our website at www.Websense.com under “About Us” in the “Investors” section. www.investor.websense.com
Forward Looking Statements This presentation contains projections and other forward-looking statements regarding future events or the future financial performance of Websense, including future operating results. These projections and statements are only predictions. Actual events or results may differ materially from those in the projections or other forward-looking statements. Please see Websense’s filings with the SEC, including its most recent filings on Form 10-K, for a discussion of important risk factors that could cause actual events or results to differ materially from those in the projections or other forward-looking statements.
© 2012 Websense, Inc.
• Introduction to Websense
• Aligned with modern security needs
• Growth company with a legacy business
• Attractive subscription-based business model
Agenda
3

© 2012 Websense, Inc.
• Market leader – Advanced web security, email security, mobile security and data loss
prevention (DLP) solutions
– Market share leader in content security
• Technology pioneer – 15 years classifying content and threats
– >170 patents granted or pending
– First to market with unified web/email/data security,
hybrid SaaS/on-premise, Threatseeker, ACE, Defensio
• Global presence – ~1,500 employees in 35 countries
– 15,000 resellers in 130 countries
– R&D on four continents
– Follow-the-sun technical support
– ~50% of revenue outside the U.S.
• Financial strength – Attractive business model
• 2011 revenue of ~90% subscription software
and service/~10% appliances
– $363 million annual billings (2011)
About Websense
4
Data
Security
Email Security
Web Security
Mobile Security
© 2012 Websense, Inc.
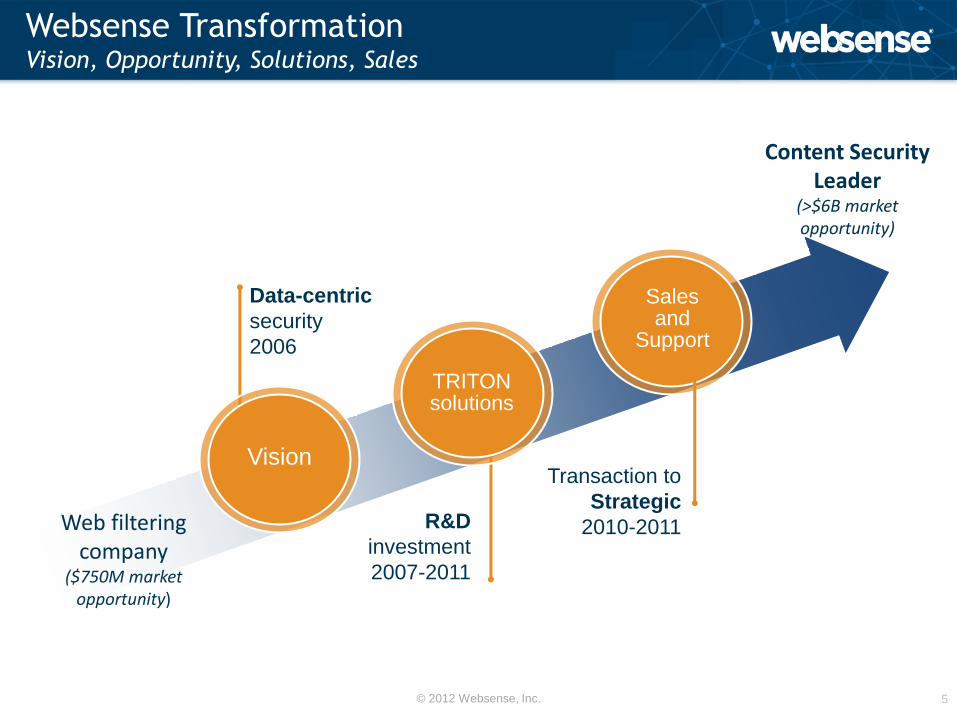
Websense Transformation Vision, Opportunity, Solutions, Sales
5
Vision
Content security solutions
Sales and
Support
Data-centric
security
2006
Transaction to
Strategic
2010-2011 R&D
investment
2007-2011
TRITON solutions
Web filtering company
($750M market opportunity)
Content Security Leader
(>$6B market opportunity)
© 2012 Websense, Inc.
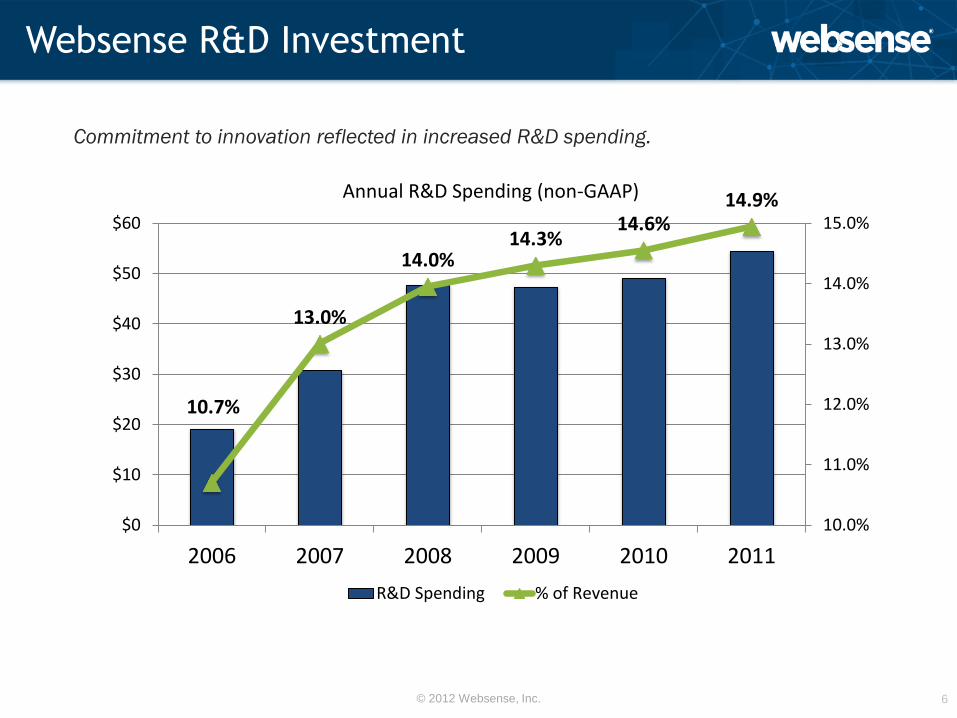
10.7%
13.0%
14.0% 14.3%
14.6% 14.9%
10.0%
11.0%
12.0%
13.0%
14.0%
15.0%
$0
$10
$20
$30
$40
$50
$60
2006 2007 2008 2009 2010 2011
Annual R&D Spending (non-GAAP)
R&D Spending % of Revenue
Websense R&D Investment
6
Commitment to innovation reflected in increased R&D spending.

© 2012 Websense, Inc.
Leader in Content Security
7
$347.0 $362.9
$359.5-364.5
2010 2011 2012E*
Annual Billings ($M)
Recurring revenue model $600M Installed base
2012E
Legacy TRITON TRITON SUITE
“No One Stops More
Threats”
Portfolio of security
technologies
Software and service Appliance
* Guidance range as of 10/23/12
© 2012 Websense, Inc.
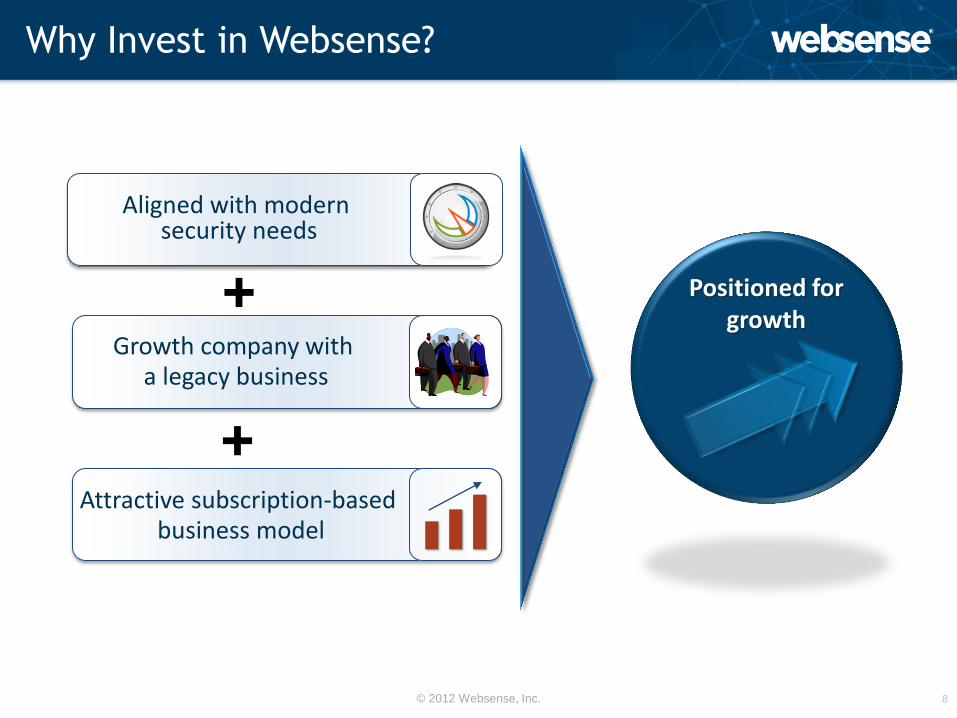
Positioned for growth
Why Invest in Websense?
8
Attractive subscription-based business model
Growth company with a legacy business
Aligned with modern security needs

© 2012 Websense, Inc.
• Introduction to Websense
• Aligned with modern security needs
• Growth company with a legacy business
• Attractive subscription-based business model
Agenda
9

© 2012 Websense, Inc.
Modern Security Requirements Protection from APTs, modern malware and targeted threats
10
Social Web
Cloud Computing Mobility
Data Loss & Theft
Risk management,
governance, and
compliance
Productivity & Liability Modern Malware and
Advanced Persistent Threats (APTs)

© 2012 Websense, Inc.
$50.4 $55.3
$60.5
$65.8
$71.2
$0
$10
$20
$30
$40
$50
$60
$70
$80
2010 2011 2012 2013 2014
Gartner Global Security Spending Forecast ($ billions)
Infrastructure Services
Global Security Spending Security remains a top IT priority
11
Large and growing market supported by increasingly targeted and complex attacks, as
well as regulatory and compliance requirements.
Presented by Lawrence Pingree at the Gartner Security and Risk Management Summit, June 20-23, 2011
Infrastructure 11% CAGR
Services 8% CAGR
© 2012 Websense, Inc. 12
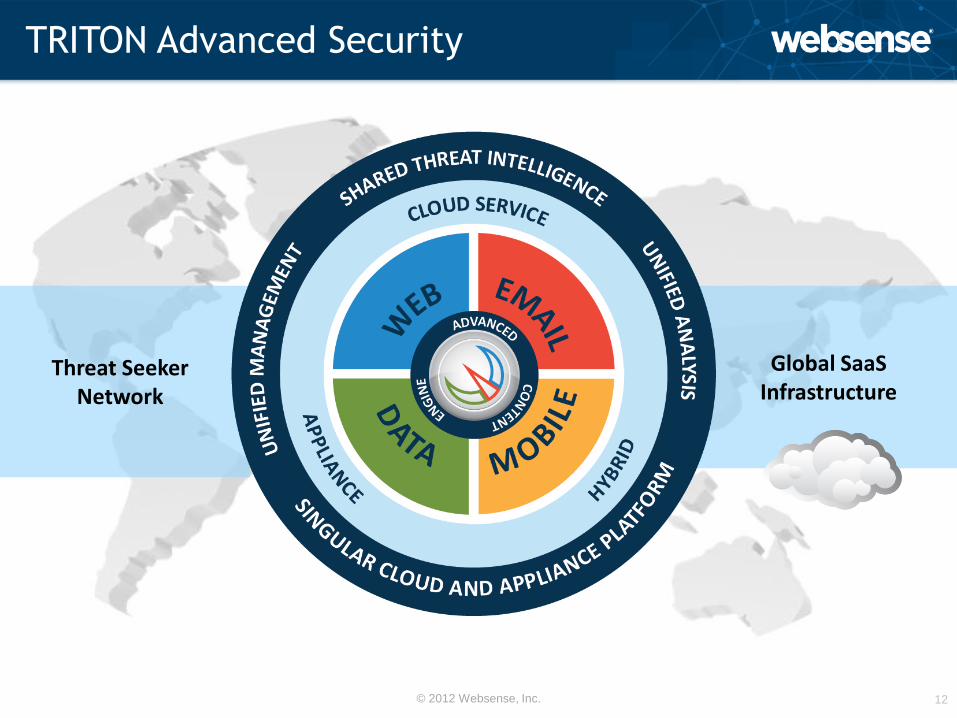
TRITON Advanced Security
Threat Seeker Network
Global SaaS Infrastructure

© 2012 Websense, Inc.
TRITON Addresses Today’s Threats
13
IMP
AC
T
1980’s 1990’s 2000’s Today
Infrastructure
Security Firewall VPN
IDS
Anti-virus
Anti-spam
URL Filters
Identity & Access
Management
Secure Web
Gateway
Data Loss
Prevention
Content Security Suite
Contextual Reasoning
Packet Level Inspection
Who, What, Where,
When, Why, How
Content Security
NAC
© 2012 Websense, Inc.
TRITON Security Gateway
Anywhere
Mobile Security
i-Platform
2012
Web Security Gateway
Web Security Gateway
Anywhere
Web Security
Suite
Web Filter
FUTURE
TRITON Enterprise
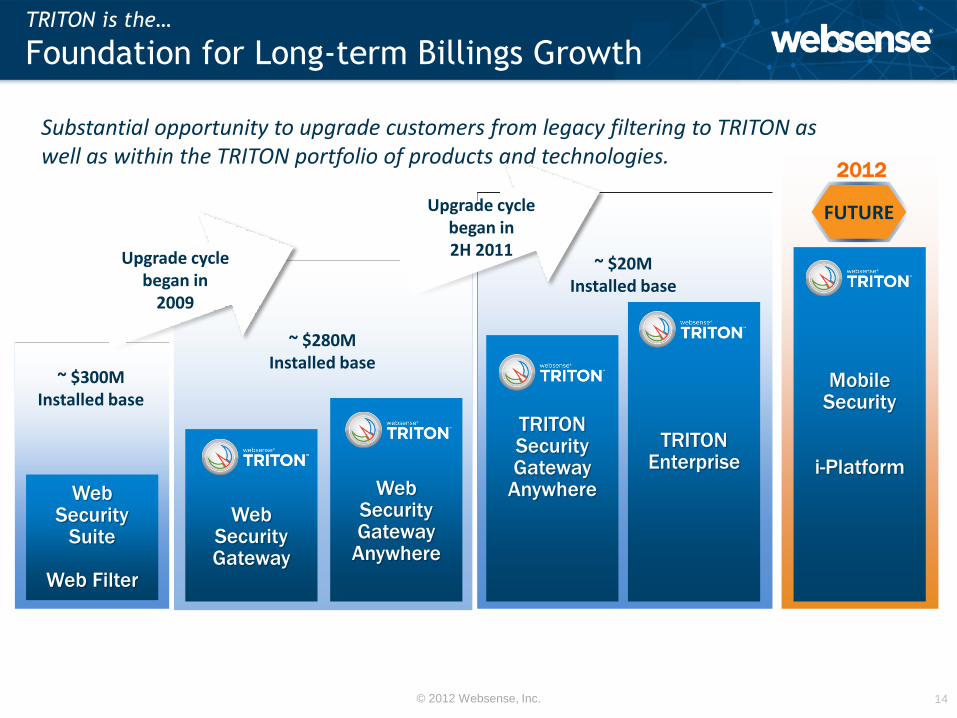
TRITON is the…
Foundation for Long-term Billings Growth
14
~ $280M Installed base
~ $300M Installed base
Upgrade cycle began in 2H 2011 Upgrade cycle
began in 2009
Substantial opportunity to upgrade customers from legacy filtering to TRITON as well as within the TRITON portfolio of products and technologies.
~ $20M Installed base
© 2012 Websense, Inc.
Web filter and Web Security
Suite
Web Security Gateway
Web Security Gateway
Anywhere
TRITON Security Gateway
Anywhere TRITON
Enterprise
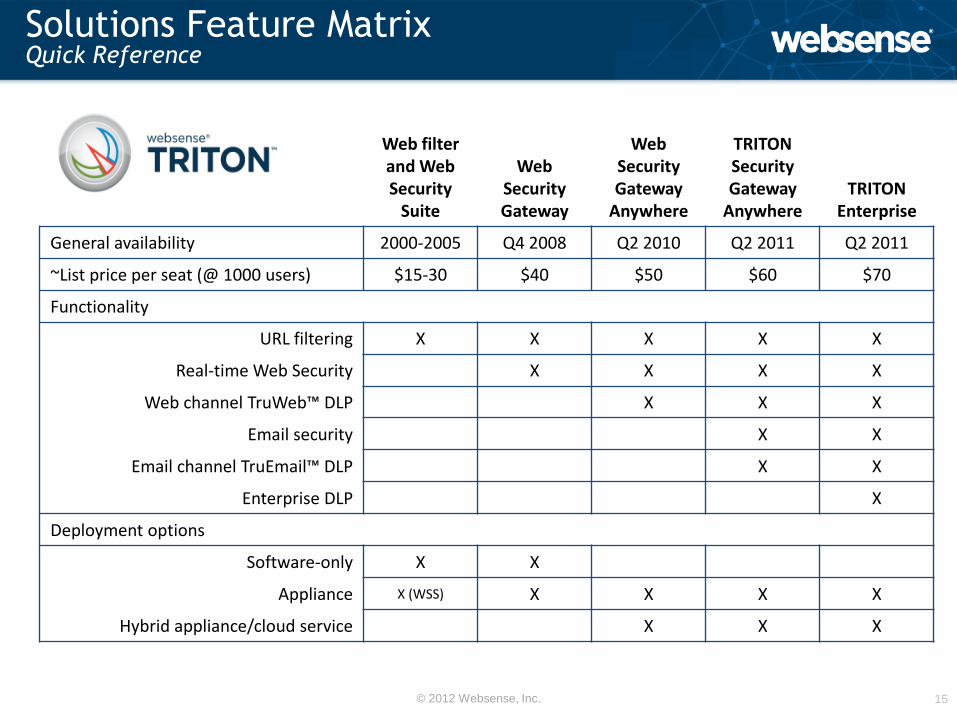
General availability 2000-2005 Q4 2008 Q2 2010 Q2 2011 Q2 2011
~List price per seat (@ 1000 users) $15-30 $40 $50 $60 $70
Functionality
URL filtering X X X X X
Real-time Web Security X X X X
Web channel TruWeb™ DLP X X X
Email security X X
Email channel TruEmail™ DLP X X
Enterprise DLP X
Deployment options
Software-only X X
Appliance X (WSS) X X X X
Hybrid appliance/cloud service X X X
Solutions Feature Matrix Quick Reference
15
© 2012 Websense, Inc.
• Introduction to Websense
• Aligned with modern security needs
• Growth company with a legacy business
• Attractive subscription-based business model
Agenda
16
© 2012 Websense, Inc.
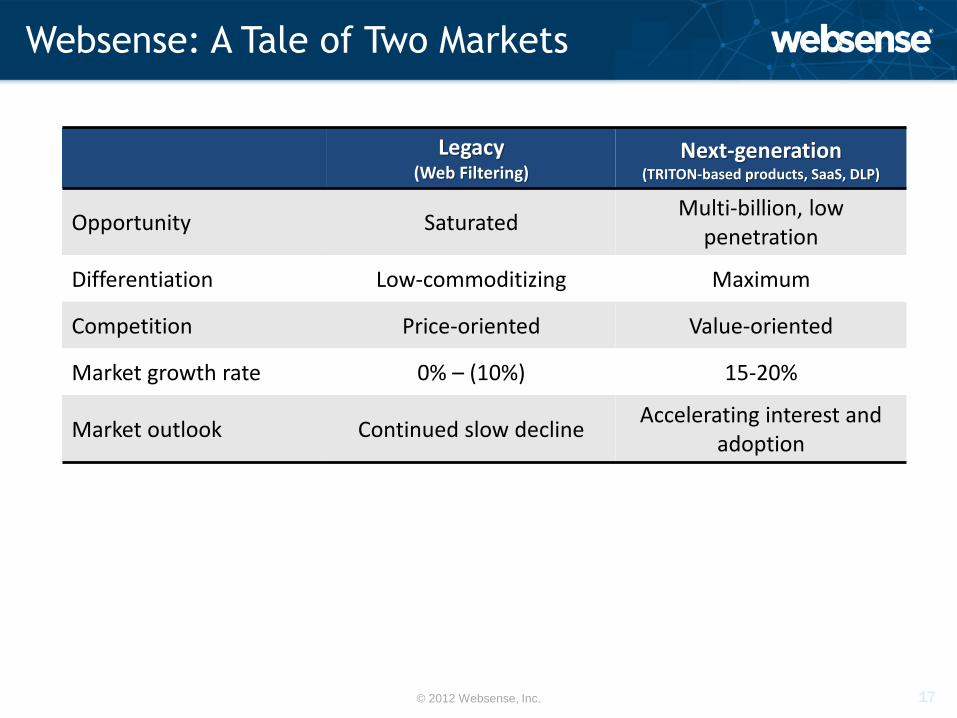
Websense: A Tale of Two Markets
Legacy (Web Filtering)
Next-generation (TRITON-based products, SaaS, DLP)
Opportunity Saturated Multi-billion, low
penetration
Differentiation Low-commoditizing Maximum
Competition Price-oriented Value-oriented
Market growth rate 0% – (10%) 15-20%
Market outlook Continued slow decline Accelerating interest and
adoption
17

© 2012 Websense, Inc. 18
The “TRITON Effect”
LEGACY FILTERING
Improved retention
Rates
Increased protection
Expanded footprint
Competitive displacement opportunity
$ V
alu
e o
f C
ust
om
er
Future Upsell
IN-LINE TECHNOLOGY
REAL TIME ANALYTICS
ADD SEATS / CROSS SELL
NEW CUSTOMERS
PLATFORM EXTENSIONS
Mobile
Security
i-Platform

© 2012 Websense, Inc.
$34.4
$44.5 $45.3
$68.3
$49.0 $50.7 $49.4
45%
52% 54%
59% 61% 59% 61%
0%
10%
20%
30%
40%
50%
60%
70%
$0
$10
$20
$30
$40
$50
$60
$70
$80
Q1'11 Q2'11 Q3'11 Q4'11 Q1'12 Q2'12 Q3'12
% o
f Total B
illings
Mill
ion
s
$ % of total billings
TRITON Billings
19
TRITON solutions include the TRITON family of security gateways for web, email, mobile and data security (including related appliances and
technical support subscriptions), Websense Data Security Suite and cloud-based security solutions.
© 2012 Websense, Inc.
• Introduction to Websense
• Aligned with modern security needs
• Growth company with a legacy business
• Attractive subscription-based business model
Agenda
20

© 2012 Websense, Inc. 21
Value Creation Priorities
Sustainable
growth
Cash flow and
profitability
Shareholder
value
“TRITON effect”
Excess free cash flow
used for share
repurchases
Sales performance
Expense management
for growth
Billings Business Productivity Capital
Allocation
Deliver shareholder value
through top-line growth

© 2012 Websense, Inc.
Expiration/renewal
Expansion of TRITON billings
drives improved customer
retention rates
Income statement Revenue follows billings
growth. In 2012, revenue is impacted by the decline in revenue recognized from OEM and appliance deferred revenue
Upgrade and “new logo” opportunities
Migration to TRITON and within the TRITON portfolio of products yields growth
Cash flow statement In 2012, higher cash taxes will impact cash generated by billings
Subscription Model Dynamics
22
Billings (Non-GAAP)
Cash Flow
Renewal/ Upgrade
Revenue
© 2012 Websense, Inc.
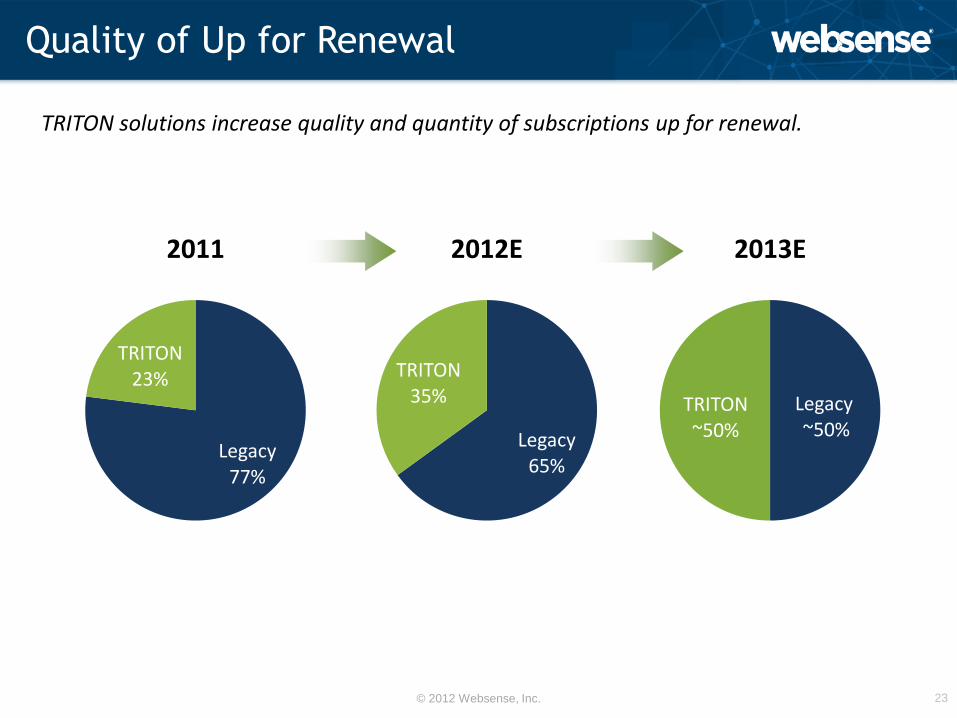
Quality of Up for Renewal
23
Legacy 77%
TRITON 23%
2011
TRITON solutions increase quality and quantity of subscriptions up for renewal.
Legacy 65%
TRITON 35%
2012E
Legacy ~50%
TRITON ~50%
2013E
© 2012 Websense, Inc.
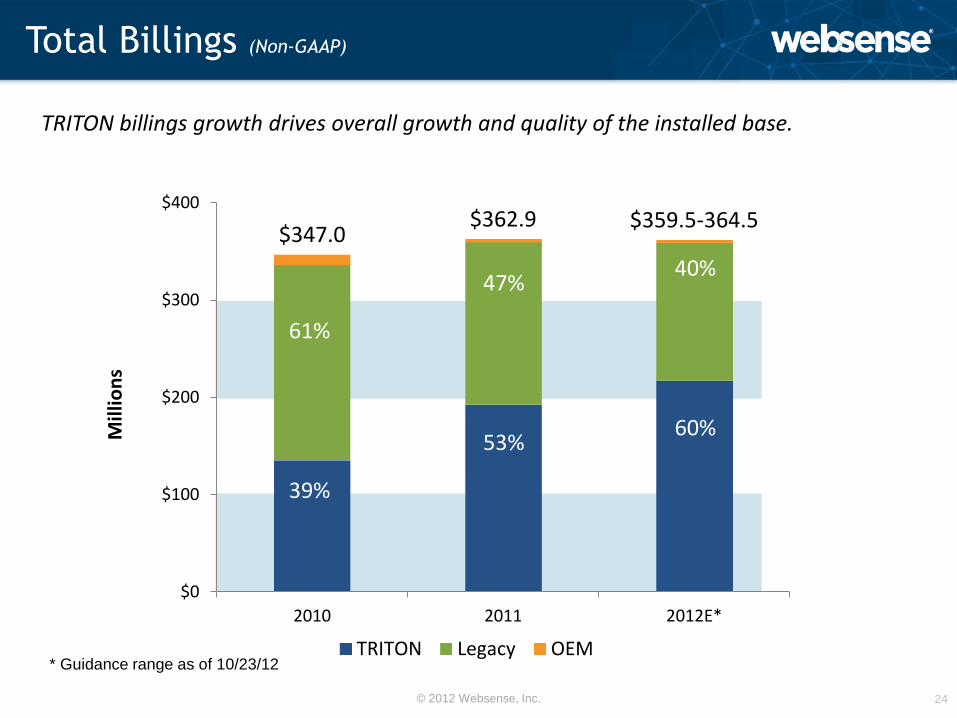
$347.0 $362.9 $359.5-364.5
$0
$100
$200
$300
$400
2010 2011 2012E*
Mill
ion
s
TRITON Legacy OEM
Total Billings (Non-GAAP)
24
TRITON billings growth drives overall growth and quality of the installed base.
61%
39%
47%
53%
40%
60%
* Guidance range as of 10/23/12
© 2012 Websense, Inc.
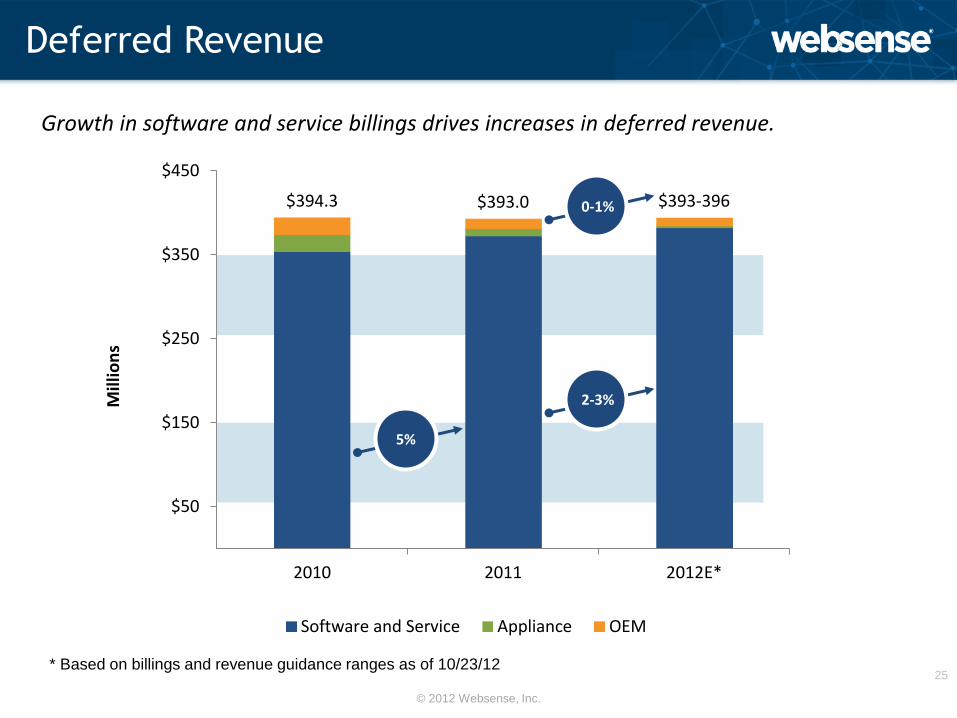
$394.3 $393.0 $393-396
-$50
$50
$150
$250
$350
$450
2010 2011 2012E*
Mill
ion
s
Software and Service Appliance OEM
Deferred Revenue
25
Growth in software and service billings drives increases in deferred revenue.
* Based on billings and revenue guidance ranges as of 10/23/12
5%
2-3%
0-1%
© 2012 Websense, Inc.
Q3’12 Financial Results
October 23, 2012

© 2012 Websense, Inc.
Billings Metrics
27
TRITON solutions include the TRITON family of security gateways for web, email, mobile and data security (including related appliances and
technical support subscriptions), Websense Data Security Suite and cloud-based security solutions.
Software and service $76.3 $74.6 -2% $226.9 $227.6 0%
Appliance $8.0 $6.9 -14% $20.0 $19.9 -1%
Total billings $84.3 $81.5 -3% $246.9 $247.5 0%
Billings by Product Category
TRITON $45.3 $49.4 9% $124.1 $149.1 20%
Non-TRITON $39.0 $32.1 -18% $122.8 $98.4 -20%
Billings by Region
U.S. $47.2 $39.3 -17% $121.5 $119.7 -1%
International $37.1 $42.2 14% $125.4 $127.8 2%
Contract Metrics
Number of customer transactions >$100k 132 144 9% 358 405 13%
Average contract duration (months) 23.1 24.1 4%
Q3'12 YTD'12$ in millions, except no. of transactions, average contract duration and
percentages $ % ∆ $ % ∆YTD'11Q3'11
© 2012 Websense, Inc.
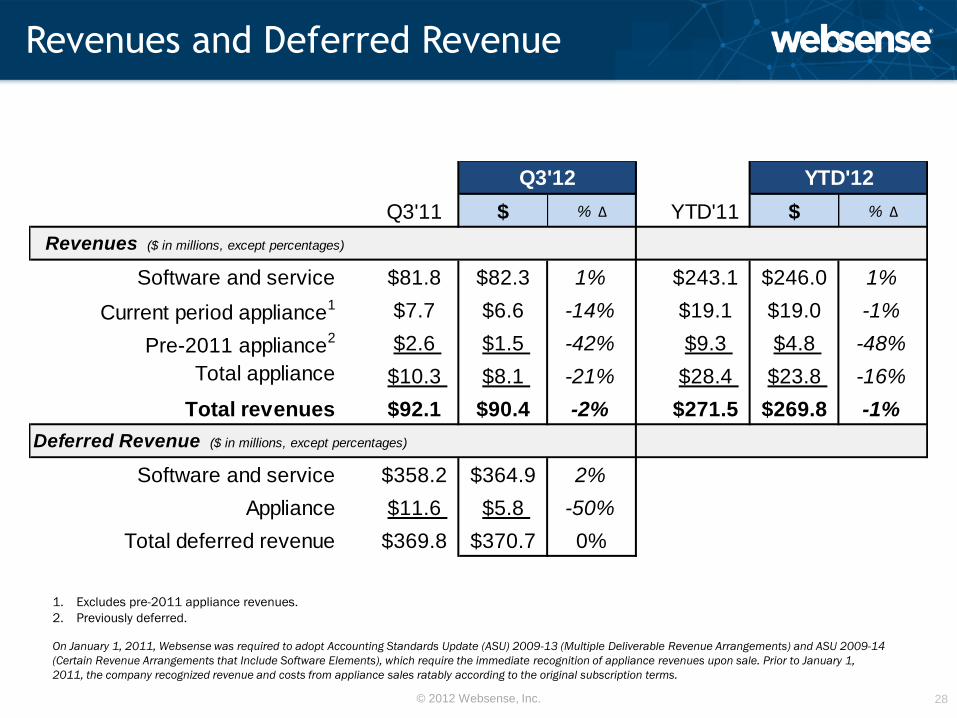
Revenues and Deferred Revenue
28
1. Excludes pre-2011 appliance revenues.
2. Previously deferred.
On January 1, 2011, Websense was required to adopt Accounting Standards Update (ASU) 2009-13 (Multiple Deliverable Revenue Arrangements) and ASU 2009-14
(Certain Revenue Arrangements that Include Software Elements), which require the immediate recognition of appliance revenues upon sale. Prior to January 1,
2011, the company recognized revenue and costs from appliance sales ratably according to the original subscription terms.
Q3'11 $ % ∆ YTD'11 $ % ∆
Software and service $81.8 $82.3 1% $243.1 $246.0 1%
Current period appliance1 $7.7 $6.6 -14% $19.1 $19.0 -1%
Pre-2011 appliance2 $2.6 $1.5 -42% $9.3 $4.8 -48%
Total appliance $10.3 $8.1 -21% $28.4 $23.8 -16%
Total revenues $92.1 $90.4 -2% $271.5 $269.8 -1%
Software and service $358.2 $364.9 2%
Appliance $11.6 $5.8 -50%
Total deferred revenue $369.8 $370.7 0%
Q3'12 YTD'12
Revenues ($ in millions, except percentages)
Deferred Revenue ($ in millions, except percentages)
© 2012 Websense, Inc.
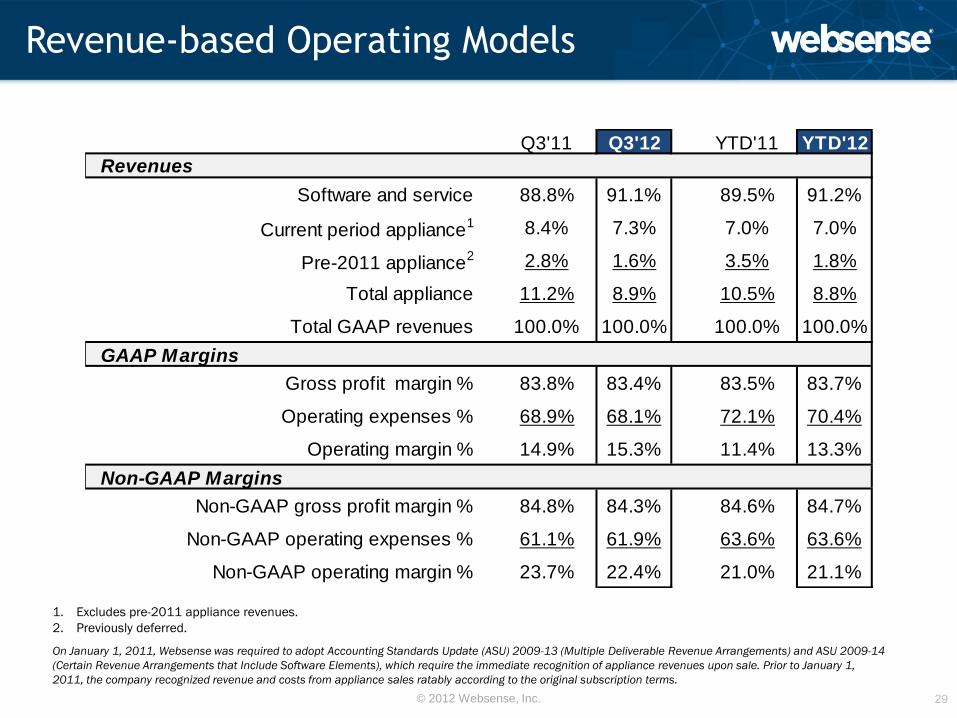
Revenue-based Operating Models
29
1. Excludes pre-2011 appliance revenues.
2. Previously deferred.
On January 1, 2011, Websense was required to adopt Accounting Standards Update (ASU) 2009-13 (Multiple Deliverable Revenue Arrangements) and ASU 2009-14
(Certain Revenue Arrangements that Include Software Elements), which require the immediate recognition of appliance revenues upon sale. Prior to January 1,
2011, the company recognized revenue and costs from appliance sales ratably according to the original subscription terms.
Q3'11 Q3'12 YTD'11 YTD'12
Software and service 88.8% 91.1% 89.5% 91.2%
Current period appliance1 8.4% 7.3% 7.0% 7.0%
Pre-2011 appliance2 2.8% 1.6% 3.5% 1.8%
Total appliance 11.2% 8.9% 10.5% 8.8%
Total GAAP revenues 100.0% 100.0% 100.0% 100.0%
GAAP Margins
Gross profit margin % 83.8% 83.4% 83.5% 83.7%
Operating expenses % 68.9% 68.1% 72.1% 70.4%
Operating margin % 14.9% 15.3% 11.4% 13.3%
Non-GAAP Margins
Non-GAAP gross profit margin % 84.8% 84.3% 84.6% 84.7%
Non-GAAP operating expenses % 61.1% 61.9% 63.6% 63.6%
Non-GAAP operating margin % 23.7% 22.4% 21.0% 21.1%
Revenues
© 2012 Websense, Inc.
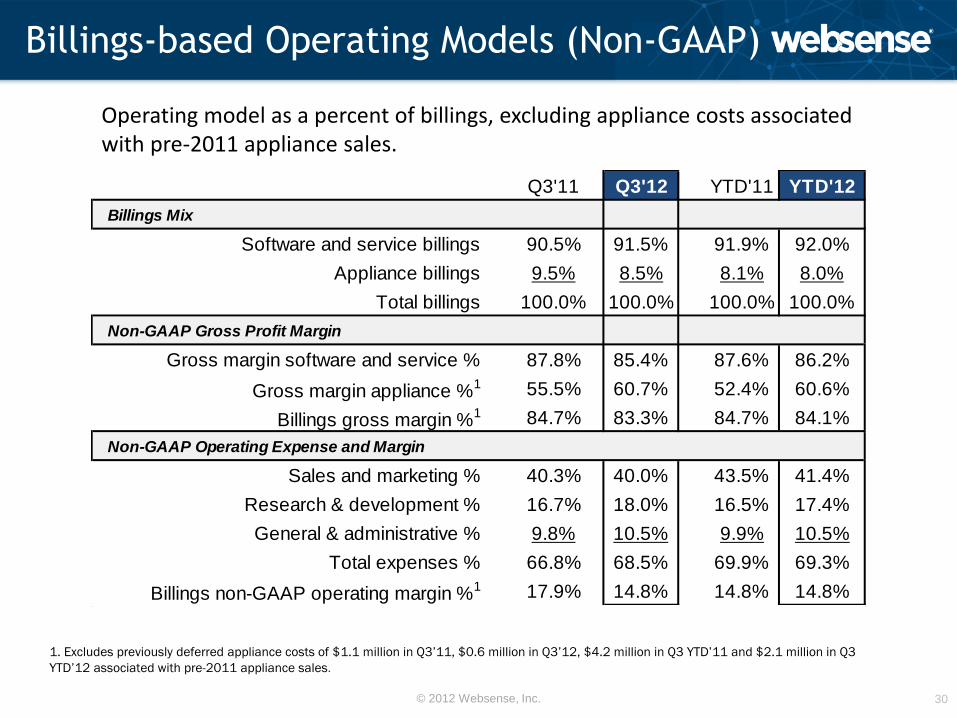
Billings-based Operating Models (Non-GAAP)
30
Operating model as a percent of billings, excluding appliance costs associated with pre-2011 appliance sales.
1. Excludes previously deferred appliance costs of $1.1 million in Q3’11, $0.6 million in Q3’12, $4.2 million in Q3 YTD’11 and $2.1 million in Q3
YTD’12 associated with pre-2011 appliance sales.
Q3'11 Q3'12 YTD'11 YTD'12
Software and service billings 90.5% 91.5% 91.9% 92.0%
Appliance billings 9.5% 8.5% 8.1% 8.0%
Total billings 100.0% 100.0% 100.0% 100.0%
Non-GAAP Gross Profit Margin
Gross margin software and service % 87.8% 85.4% 87.6% 86.2%
Gross margin appliance %1 55.5% 60.7% 52.4% 60.6%
Billings gross margin %1 84.7% 83.3% 84.7% 84.1%
Non-GAAP Operating Expense and Margin
Sales and marketing % 40.3% 40.0% 43.5% 41.4%
Research & development % 16.7% 18.0% 16.5% 17.4%
General & administrative % 9.8% 10.5% 9.9% 10.5%
Total expenses % 66.8% 68.5% 69.9% 69.3%
Billings non-GAAP operating margin %1 17.9% 14.8% 14.8% 14.8%
Billings Mix
© 2012 Websense, Inc.
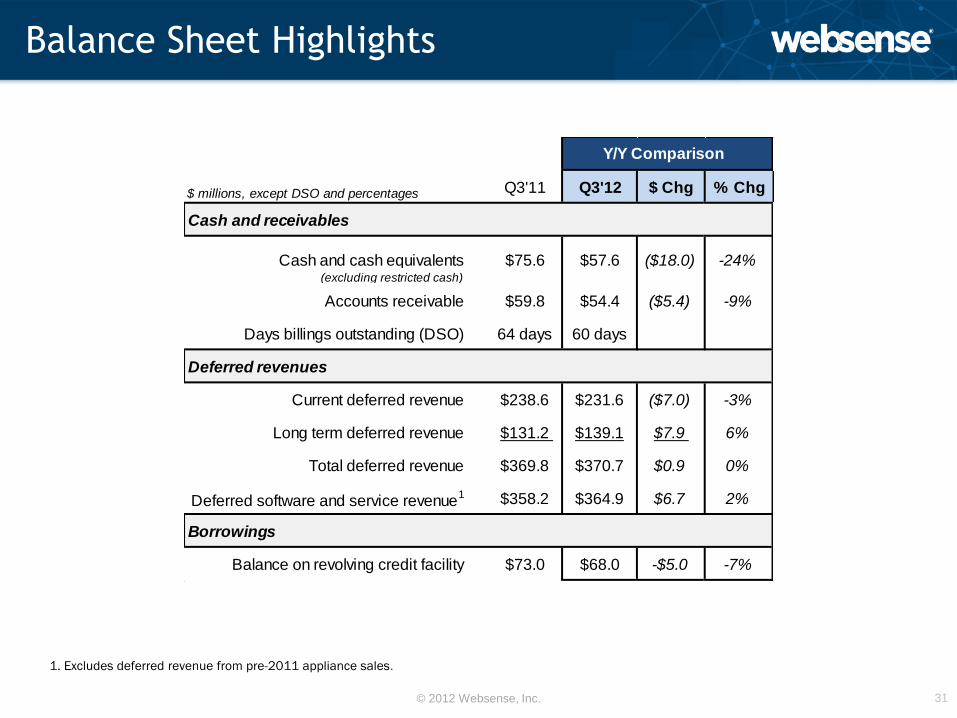
Balance Sheet Highlights
31
1. Excludes deferred revenue from pre-2011 appliance sales.
$ millions, except DSO and percentages Q3'11 Q3'12 $ Chg % Chg
Cash and receivables
Cash and cash equivalents (excluding restricted cash)
Accounts receivable $59.8 $54.4 ($5.4) -9%
Days billings outstanding (DSO) 64 days 60 days
Deferred revenues
Current deferred revenue $238.6 $231.6 ($7.0) -3%
Long term deferred revenue $131.2 $139.1 $7.9 6%
Total deferred revenue $369.8 $370.7 $0.9 0%
Deferred software and service revenue1 $358.2 $364.9 $6.7 2%
Borrowings
Balance on revolving credit facility $73.0 $68.0 -$5.0 -7%
Y/Y Comparison
$75.6 $57.6 ($18.0) -24%
© 2012 Websense, Inc.
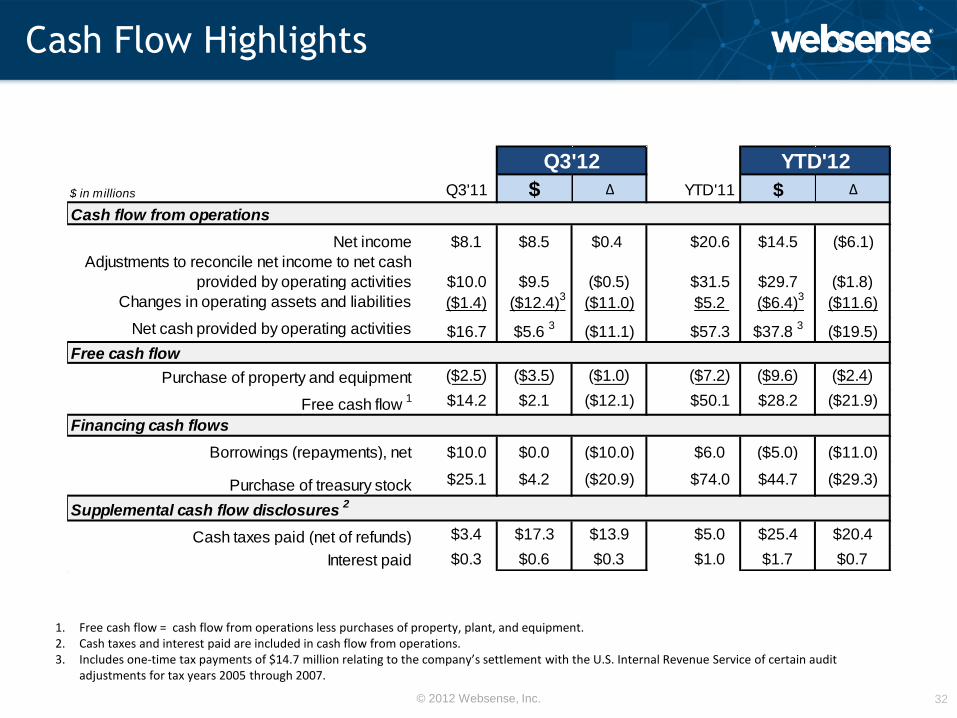
Cash Flow Highlights
32
1. Free cash flow = cash flow from operations less purchases of property, plant, and equipment. 2. Cash taxes and interest paid are included in cash flow from operations. 3. Includes one-time tax payments of $14.7 million relating to the company’s settlement with the U.S. Internal Revenue Service of certain audit
adjustments for tax years 2005 through 2007.
$ in millions Q3'11 $ ∆ YTD'11 $ ∆
Cash flow from operations
Net income $8.1 $8.5 $0.4 $20.6 $14.5 ($6.1)
Adjustments to reconcile net income to net cash
provided by operating activities $10.0 $9.5 ($0.5) $31.5 $29.7 ($1.8)
Changes in operating assets and liabilities ($1.4)1($12.4)
3($11.0) $5.2
1($6.4)
3($11.6)
Net cash provided by operating activities $16.7 $5.6 3
($11.1) $57.3 $37.8 3
($19.5)
Free cash flow
Purchase of property and equipment ($2.5) ($3.5) ($1.0) ($7.2) ($9.6) ($2.4)
Free cash flow 1 $14.2 $2.1 ($12.1) $50.1 $28.2 ($21.9)
Financing cash flows
Borrowings (repayments), net $10.0 $0.0 ($10.0) $6.0 ($5.0) ($11.0)
Purchase of treasury stock $25.1 $4.2 ($20.9) $74.0 $44.7 ($29.3)
Supplemental cash flow disclosures2
Cash taxes paid (net of refunds) $3.4 $17.3 $13.9 $5.0 $25.4 $20.4
Interest paid $0.3 $0.6 $0.3 $1.0 $1.7 $0.7
Q3'12 YTD'12

© 2012 Websense, Inc.
Q4 2012 Outlook
33
1. Long-term non-GAAP effective tax rate.
$ in millions, except per share and percentages
GAAP
Revenues $92.7 $90 - $92 -3% - -1%
Cash flow from operations $21.9 $8 - $11
Cash taxes (net of refunds) $3.6 $3 - $4
Capital expenditures $1.9 $3 - $3.5
Weighted average diluted shares 38.9 37.0 - 37.5
Non-GAAP
Software and service billings % 92.6% 92% - 93%
Appliance billings % 7.4% 7% - 8%
Total billings $116.0 $112 - $117 -3% - 1%
Non-GAAP gross profit margin 84.8% 83% - 84%
Non-GAAP operating margin 23.4% 16% - 18%
Diluted non-GAAP EPS $0.44 $0.32 - $0.35 -27% - -20%
Non-GAAP tax rate 18.5%
(as of 10/23/12) Q4'11
Actual
Q4'12 Guidance
Range Y/Y Chg
19.0% 1
© 2012 Websense, Inc.
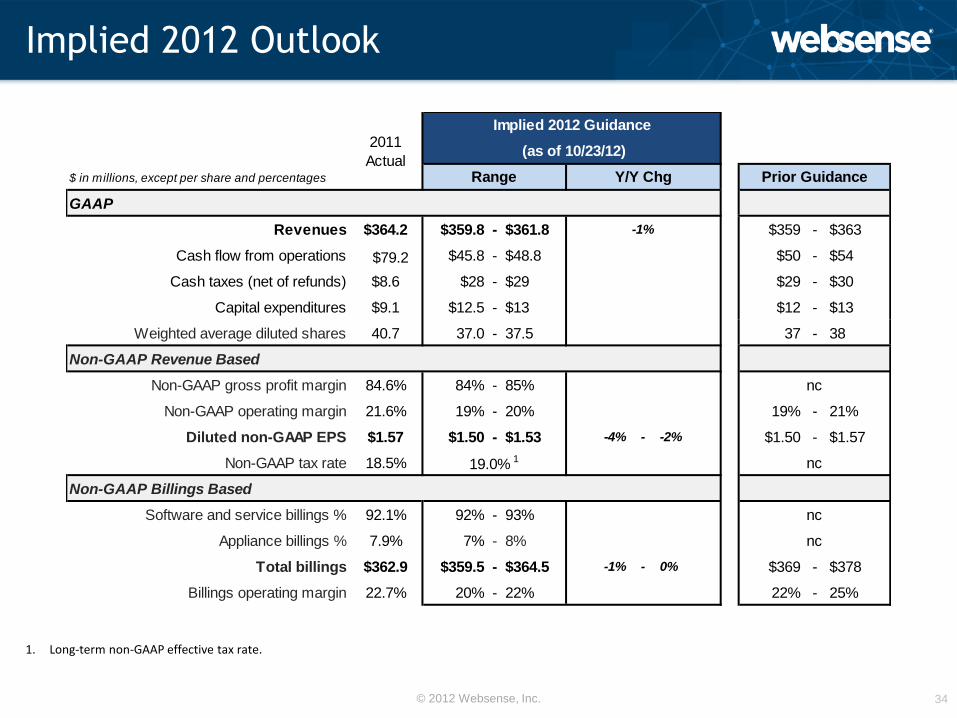
Implied 2012 Outlook
34
1. Long-term non-GAAP effective tax rate.
$ in millions, except per share and percentages
GAAP
Revenues $364.2 $359.8 - $361.8 $359 - $363
Cash flow from operations 1 $79.2 $45.8 - $48.8 $50 - $54
Cash taxes (net of refunds) $8.6 $28 - $29 $29 - $30
Capital expenditures $9.1 $12.5 - $13 $12 - $13
Weighted average diluted shares 40.7 37.0 - 37.5 37 - 38
Non-GAAP Revenue Based
Non-GAAP gross profit margin 84.6% 84% - 85% nc
Non-GAAP operating margin 21.6% 19% - 20% 19% - 21%
Diluted non-GAAP EPS $1.57 $1.50 - $1.53 -4% - -2% $1.50 - $1.57
Non-GAAP tax rate 18.5%
Non-GAAP Billings Based
Software and service billings % 92.1% 92% - 93% nc
Appliance billings % 7.9% 7% - 8% nc
Total billings $362.9 $359.5 - $364.5 -1% - 0% $369 - $378
Billings operating margin 22.7% 20% - 22% 22% - 25%
Prior Guidance
19.0% 1
2011
Actual
Implied 2012 Guidance
(as of 10/23/12)
Range Y/Y Chg
nc
-1%
© 2012 Websense, Inc.
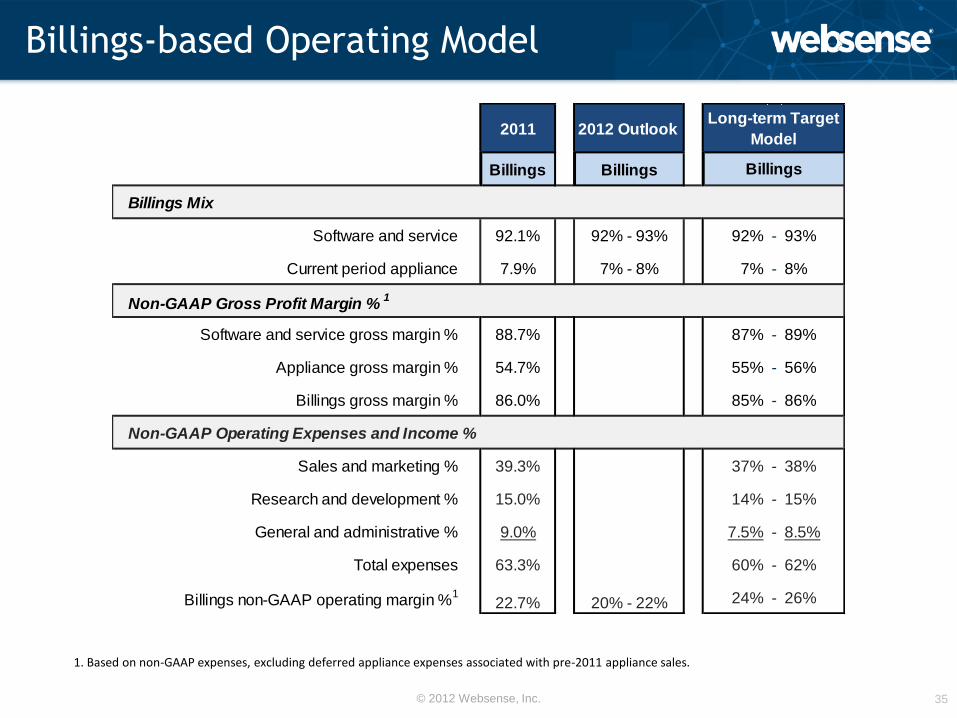
Billings-based Operating Model
35
1. Based on non-GAAP expenses, excluding deferred appliance expenses associated with pre-2011 appliance sales.
2011 2012 Outlook
Billings Billings
Billings Mix
Software and service 92.1% 92% - 93% 92% - 93%
Current period appliance 7.9% 7% - 8% 7% - 8%
Software and service gross margin % 88.7% 87% - 89%
Appliance gross margin % 54.7% 55% - 56%
Billings gross margin % 86.0% 85% - 86%
Sales and marketing % 39.3% 37% - 38%
Research and development % 15.0% 14% - 15%
General and administrative % 9.0% 7.5% - 8.5%
Total expenses 63.3% 60% - 62%
Billings non-GAAP operating margin %1
22.7% 20% - 22% 24% - 26%
Long-term Target
Model
Billings
Non-GAAP Gross Profit Margin %1
Non-GAAP Operating Expenses and Income %
© 2012 Websense, Inc.
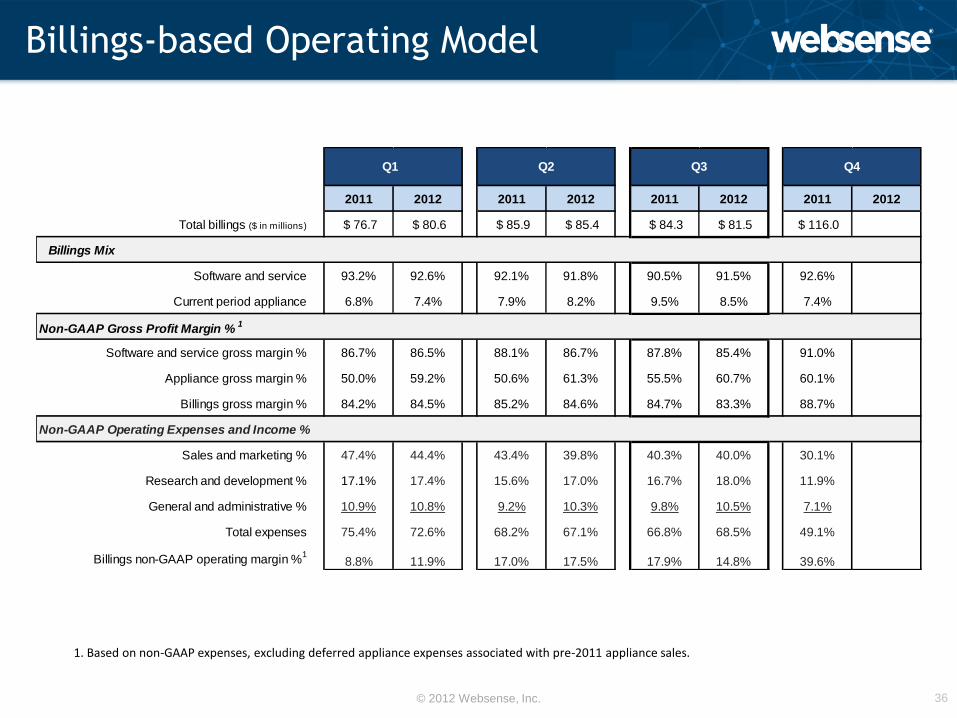
Billings-based Operating Model
36
1. Based on non-GAAP expenses, excluding deferred appliance expenses associated with pre-2011 appliance sales.
2011 2012 2011 2012 2011 2012 2011 2012
Total billings ($ in millions) $ 76.7 $ 80.6 $ 85.9 $ 85.4 $ 84.3 $ 81.5 $ 116.0
Billings Mix
Software and service 93.2% 92.6% 92.1% 91.8% 90.5% 91.5% 92.6%
Current period appliance 6.8% 7.4% 7.9% 8.2% 9.5% 8.5% 7.4%
Non-GAAP Gross Profit Margin %1
Software and service gross margin % 86.7% 86.5% 88.1% 86.7% 87.8% 85.4% 91.0%
Appliance gross margin % 50.0% 59.2% 50.6% 61.3% 55.5% 60.7% 60.1%
Billings gross margin % 84.2% 84.5% 85.2% 84.6% 84.7% 83.3% 88.7%
Sales and marketing % 47.4% 44.4% 43.4% 39.8% 40.3% 40.0% 30.1%
Research and development % 17.1% 17.4% 15.6% 17.0% 16.7% 18.0% 11.9%
General and administrative % 10.9% 10.8% 9.2% 10.3% 9.8% 10.5% 7.1%
Total expenses 75.4% 72.6% 68.2% 67.1% 66.8% 68.5% 49.1%
Billings non-GAAP operating margin %1
8.8% 11.9% 17.0% 17.5% 17.9% 14.8% 39.6%
Q4
Non-GAAP Operating Expenses and Income %
Q1 Q2 Q3

© 2012 Websense, Inc.
2012 Guidance Assumptions as of 10/23/12
37
Exchange Rates
Q1 Q2 Q3 Q4
~% Billings (expected)
Guidance Assumption 2011 2012 2011 2012 2011 2012 2011 2012
GBP Euro
~12% ~12%
$1.61 $1.29
$1.60 $1.37
$1.59 $1.33
$1.65 $1.44
$1.58 $1.27
$1.63 $1.44
$1.58 $1.25
$1.57 $1.36
Currency impact on financial results
Weaker dollar relative to the prior period increases billings and expenses; stronger dollar relative to prior periods decreases billings and expenses.
Deferred revenue primarily denominated in US dollars.
© 2012 Websense, Inc.
Websense Corporate – www.websense.com
– http://twitter.com/websense
– http://www.facebook.com/websense
– http://www.youtube.com/user/WBSNMKTG
– http://community.websense.com/blogs/
– http://community.websense.com/blogs/newsletter/
Websense Security Labs – securitylabs.websense.com
– http://community.websense.com/blogs/securitylabs/
– http://twitter.com/websenselabs
– http://www.youtube.com/user/wslabsutube
Follow us…
38