wcssg environmental health working group · wcssg environmental health working group ... pu-alpha...
TRANSCRIPT


2
WCSSG Environmental Health Working Group
Discharges and Environmental Monitoring 2016
Paul McDonald
Environmental Specialist
Date: 30th November 2017

3
Liquid Discharges 2016
Radionuclide Limit 2015 2016 2016
Discharge Discharge Discharge GBq GBq GBq As % of limit
H-3 1.80E+07 1.54E+06 2.05E+06 11%
C-14 2.10E+04 4.92E+03 4.83E+03 23%
Co-60 3.60E+03 5.13E+01 3.53E+01 1%
Sr-90 4.50E+04 1.59E+03 2.01E+03 4%
Zr/Nb-95 2.80E+03 9.64E+01 9.43E+01 3%
Tc-99 1.00E+04 1.66E+03 1.90E+03 19%
Ru-106 5.10E+04 7.03E+02 1.09E+03 2%
I-129 2.00E+03 3.65E+02 5.22E+02 26%
Cs-134 1.60E+03 6.67E+01 6.56E+01 4%
Cs-137 3.40E+04 3.08E+03 3.72E+03 11%
Ce-144 4.00E+03 1.94E+02 2.13E+02 5%
Np-237 7.30E+02 3.65E+01 3.14E+01 4%
Pu-Alpha 7.00E+02 1.39E+02 1.79E+02 26%
Pu-241 2.50E+04 2.36E+03 2.99E+03 12%
Am-241 3.00E+02 2.87E+01 2.58E+01 9%
Cm-Alpha 5.00E+01 1.19E+00 2.96E+00 6%
Alpha 9.00E+02 1.87E+02 2.53E+02 28%
Beta 2.00E+05(1) 9.52E+03 1.31E+04 7%
Uranium (kg) 2000 328 342 17%
(1) Discharge limit changed from 200 TBq to 180 TBq on 1 December 2016

4
Sellafield marine sampling and monitoring locations
5
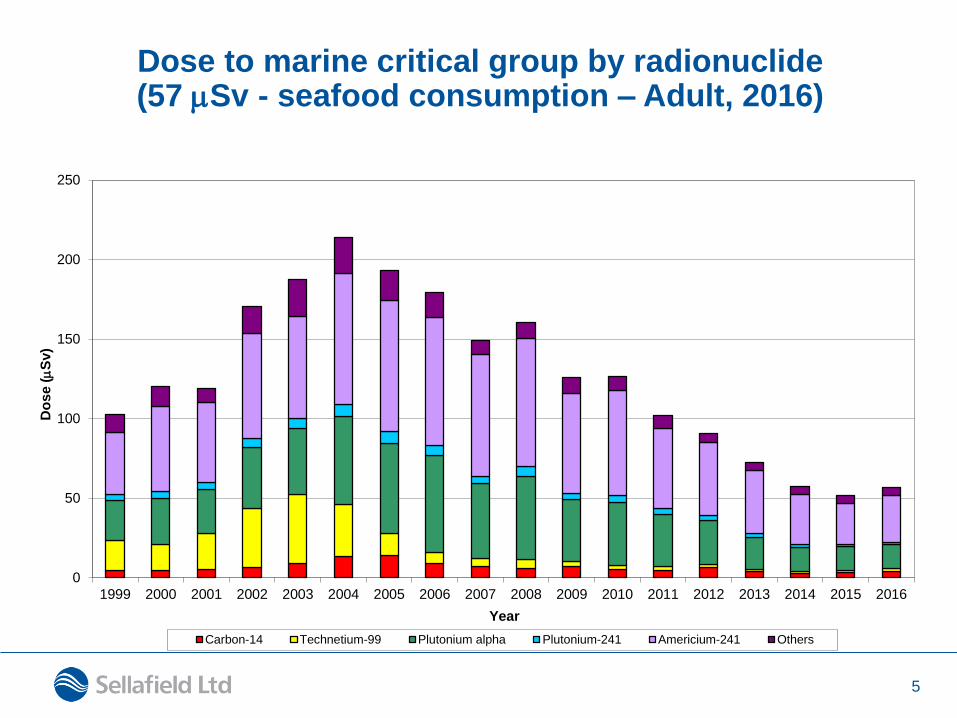
Dose to marine critical group by radionuclide (57 mSv - seafood consumption – Adult, 2016)
0
50
100
150
200
250
1999 2000 2001 2002 2003 2004 2005 2006 2007 2008 2009 2010 2011 2012 2013 2014 2015 2016
Do
se
(m
Sv)
Year
Carbon-14 Technetium-99 Plutonium alpha Plutonium-241 Americium-241 Others

6
Pathway contributions to marine critical group total dose (108 mSv – Adult, 2016)
0
50
100
150
200
250
300
1999 2000 2001 2002 2003 2004 2005 2006 2007 2008 2009 2010 2011 2012 2013 2014 2015 2016
Do
se (m
Sv
)
Year
Cod Plaice Lobster Crab Nephrops Winkles Mussels &Other Molluscs
Aerial pathways External radiation frombeach occupancy

7
External gamma dose rates at Newbiggin compared to sediment concentrations
0
200
400
600
800
1000
1200
0
0.05
0.1
0.15
0.2
0.25
0.3
1993 1995 1997 1999 2001 2003 2005 2007 2009 2011 2013 2015
Bq
kg-1
dry
we
igh
t
mic
roG
ray
h-1
Year
Co-60 in sediment
Ru-106 in sediment
Cs-137 in sediment
Gamma dose rate
8
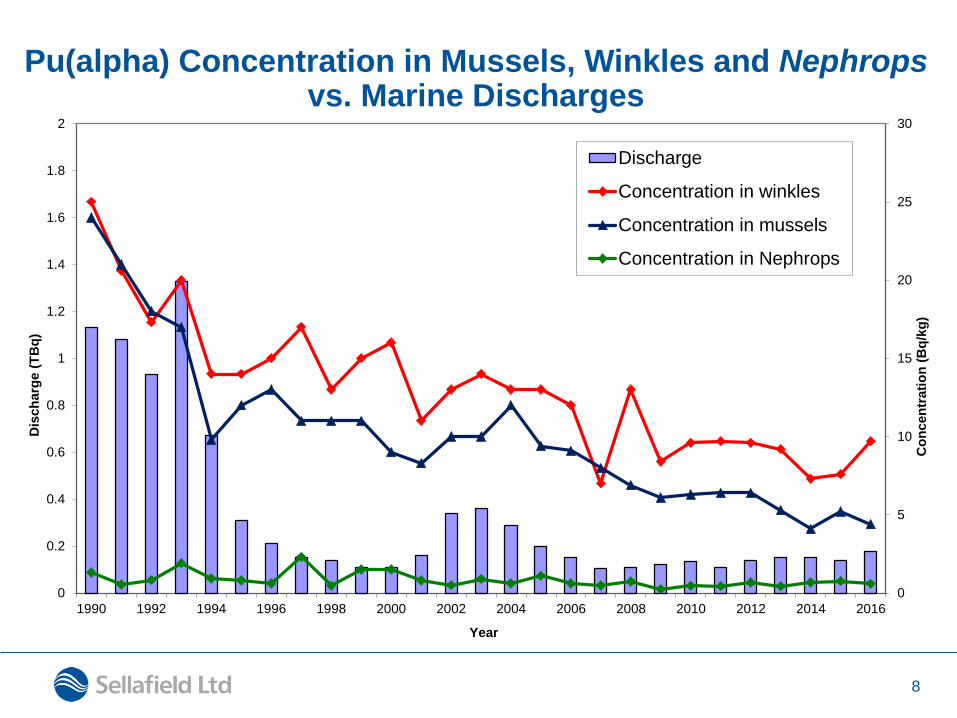
Pu(alpha) Concentration in Mussels, Winkles and Nephrops vs. Marine Discharges
0
5
10
15
20
25
30
0
0.2
0.4
0.6
0.8
1
1.2
1.4
1.6
1.8
2
1990 1992 1994 1996 1998 2000 2002 2004 2006 2008 2010 2012 2014 2016
Co
ncen
trati
on
(B
q/k
g)
Dis
ch
arg
e (
TB
q)
Year
Discharge
Concentration in winkles
Concentration in mussels
Concentration in Nephrops

9
241Am Concentration in Mussels, Winkles and Nephrops vs. Marine Discharges
0
5
10
15
20
25
30
35
40
0
0.1
0.2
0.3
0.4
0.5
0.6
0.7
0.8
0.9
1
1990 1992 1994 1996 1998 2000 2002 2004 2006 2008 2010 2012 2014 2016
Co
ncen
trati
on
(B
q/k
g)
Dis
ch
arg
e (
TB
q)
Year
Discharge
Concentration in winkles
Concentration in mussels

10
Dose from Winkles consumption for Pu(Alpha) and 241Am
0
5
10
15
20
25
30
35
40
45
50
0
2
4
6
8
10
12
14
16
18
20
1990 1992 1994 1996 1998 2000 2002 2004 2006 2008 2010 2012 2014 2016
Do
se (m
Sv
)
Co
nsu
mp
tio
n r
ate
(k
g/y
ear)
Year
Winkle Consumption rate
Dose - Pu-alpha
Dose - Am-241

11
Dose from Mussel consumption for Pu(Alpha) and 241Am
0
10
20
30
40
50
60
0
5
10
15
20
25
30
1993 1995 1997 1999 2001 2003 2005 2007 2009 2011 2013 2015
Do
se (m
Sv
)
Co
nsu
mp
tio
n r
ate
(k
g/y
ear)
Year
Mussels Consumption rate
Dose - Pu-alpha
Dose - Am-241

12
Dose from Nephrops consumption for Pu(Alpha) and 241Am
0
2
4
6
8
10
12
14
16
18
20
0
2
4
6
8
10
12
14
16
18
20
1995 1997 1999 2001 2003 2005 2007 2009 2011 2013 2015
Do
se (m
Sv
)
Co
nsu
mp
tio
n r
ate
(kg
/year)
Year
Nephrops Consumption rate
Dose - Pu-alpha
Dose - Am-241

13
Aerial Discharges 2016
Radionuclide Limit 2015 2016 2016
Discharge Discharge Discharge
MBq MBq MBq as % of limit H-3 1.10E+09 8.42E+07 1.23E+08 11%
C-14 3.30E+06 4.18E+05 4.42E+05 13%
Kr-85 4.40E+11 6.82E+10 8.75E+10 20%
Sr-90 7.10E+02 2.88E+01 2.95E+01 4%
Ru-106 2.30E+04 7.32E+02 7.02E+02 3%
Sb-125 3.00E+04 1.24E+04 1.01E+04 34%
I-129 7.00E+04 1.12E+04 1.30E+04 19%
I-131 3.70E+04 4.35E+02 4.23E+02 1%
Cs-137 5.80E+03 8.95E+01 1.02E+02 2%
Rn-222 5.00E+05 4.26E+04 4.26E+04 9%
Pu-Alpha 1.90E+02 2.57E+01 1.54E+01 8%
Pu-241 3.00E+03 2.93E+02 1.47E+02 5%
Am-241/Cm-242 1.20E+02 1.55E+01 1.36E+01 11%
Alpha 8.80E+02 8.17E+01 1.08E+02 12%
Beta 4.20E+04 6.20E+02 1.24E+03 3%

14
Sellafield terrestrial monitoring locations

15
Nuclide contributions to terrestrial critical group dose (Terrestrial Foodstuff and Inhalation 5.9 mSv Adult)
Infant Adult
0
5
10
15
20
25
30
1999 2000 2001 2002 2003 2004 2005 2006 2007 2008 2009 2010 2011 2012 2013 2014 2015 2016
Do
se
(m
Sv)
Year
Carbon-14 Strontium-90 Technetium-99 Ruthenium-106 Iodine-129 Iodine-131 Caesium-137 Americium Others
16
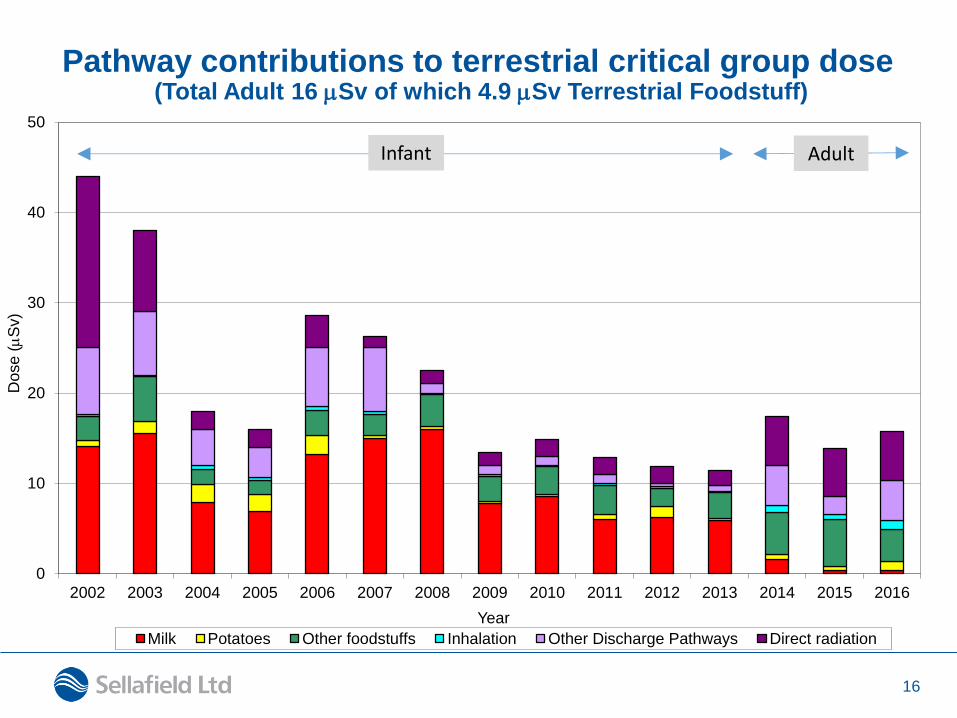
Pathway contributions to terrestrial critical group dose (Total Adult 16 mSv of which 4.9 mSv Terrestrial Foodstuff)
Infant Adult
0
10
20
30
40
50
2002 2003 2004 2005 2006 2007 2008 2009 2010 2011 2012 2013 2014 2015 2016
Dose
(m
Sv)
Year
Milk Potatoes Other foodstuffs Inhalation Other Discharge Pathways Direct radiation
17
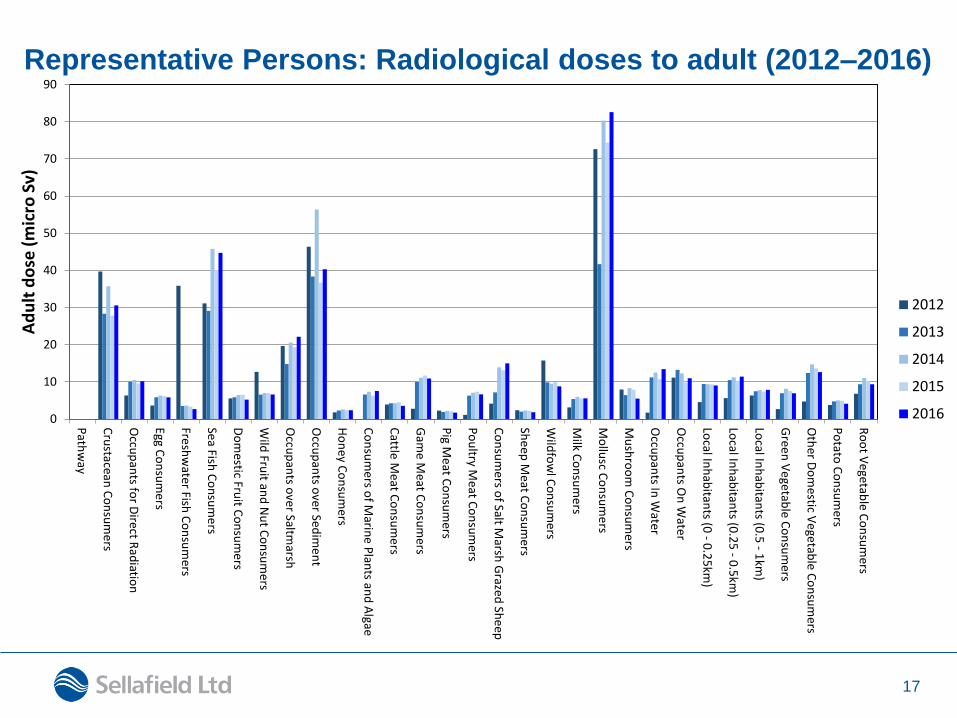
Representative Persons: Radiological doses to adult (2012–2016)
0
10
20
30
40
50
60
70
80
90
Path
way
Cru
stacean C
on
sum
ers
Occu
pan
ts for D
irect Rad
iation
Egg Co
nsu
me
rs
Fresh
water Fish
Co
nsu
mers
Sea Fish
Co
nsu
me
rs
Do
mestic Fru
it Co
nsu
me
rs
Wild
Fruit an
d N
ut C
on
sum
ers
Occu
pan
ts over Saltm
arsh
Occu
pan
ts over Sed
ime
nt
Ho
ney C
on
sum
ers
Co
nsu
me
rs of M
arine
Plan
ts and
Algae
Cattle
Meat C
on
sum
ers
Gam
e M
eat Co
nsu
mers
Pig M
eat C
on
sum
ers
Po
ultry M
eat Co
nsu
mers
Co
nsu
me
rs of Salt M
arsh G
razed
She
ep
She
ep M
eat Co
nsu
me
rs
Wild
fow
l Co
nsu
me
rs
Milk C
on
sum
ers
Mo
llusc C
on
sum
ers
Mu
shro
om
Co
nsu
mers
Occu
pan
ts In W
ater
Occu
pan
ts On
Wate
r
Local In
hab
itants (0
- 0.2
5km
)
Local In
hab
itants (0
.25
- 0.5
km)
Local In
hab
itants (0
.5 - 1
km)
Gree
n V
ege
table
Co
nsu
mers
Oth
er Do
mestic V
ege
table
Co
nsu
mers
Po
tato C
on
sum
ers
Ro
ot V
egetab
le C
on
sum
ers
Ad
ult
do
se (
mic
ro S
v)
2012
2013
2014
2015
2016

18
Review of the Monitoring Programme
• The programme continues to work well with the majority of samples successfully collected.
• Audited by EA/NII in February 2009 where no major issues were identified and by EU (Article 35) in November 2017.
• An update to the Best Available Techniques review of the environmental monitoring programme was completed in September 2017 and is currently with the EA for comment.
• Whitehaven high volume air sampler returned to operation in May 2016 after being damaged in storms in December 2013. Data gathered in 2016 were consistent with pre-December 2013 data.
19
Summary
• Radioactive discharges (aerial and liquid) in 2016 were generally similar to those in 2015 and were well below the permitted limits.
• The estimated marine critical group dose in 2016 was about 110 μSv.
• The estimated terrestrial critical group dose in 2016 was about 16 μSv.
• Doses were similar to 2015 and well below the 1000 μSv dose limit for the general public.
• The dose limit of 1000 μSv is for the exposure of members of the UK public from man-made controlled sources of radiation, excluding medical uses.
• The 2016 ‘Monitoring our Environment’ is available on our website https://www.gov.uk/government/collections/sellafield-ltd-environmental-and-safety-reports