we add value as - basf usa - home add value as one company beate ehle president market and business...
TRANSCRIPT

We add value as one company
Beate Ehle President Market and Business Development North America Barclays European Select Conference Yountville, CA June 19-20, 2014
BASF Capital Market Story June 2014 2
Cautionary note regarding forward-looking statements
This presentation may contain forward-looking statements that are subject to risks and uncertainties, including those pertaining to the anticipated benefits to be realized from the proposals described herein. Forward-looking statements may include, in particular, statements about future events, future financial performance, plans, strategies, expectations, prospects, competitive environment, regulation and supply and demand. BASF has based these forward-looking statements on its views and assumptions with respect to future events and financial performance. Actual financial performance could differ materially from that projected in the forward-looking statements due to the inherent uncertainty of estimates, forecasts and projections, and financial performance may be better or worse than anticipated. Given these uncertainties, readers should not put undue reliance on any forward-looking statements. The information contained in this presentation is subject to change without notice and BASF does not undertake any duty to update the forward-looking statements, and the estimates and assumptions associated with them, except to the extent required by applicable laws and regulations.
BASF Capital Market Story June 2014 3
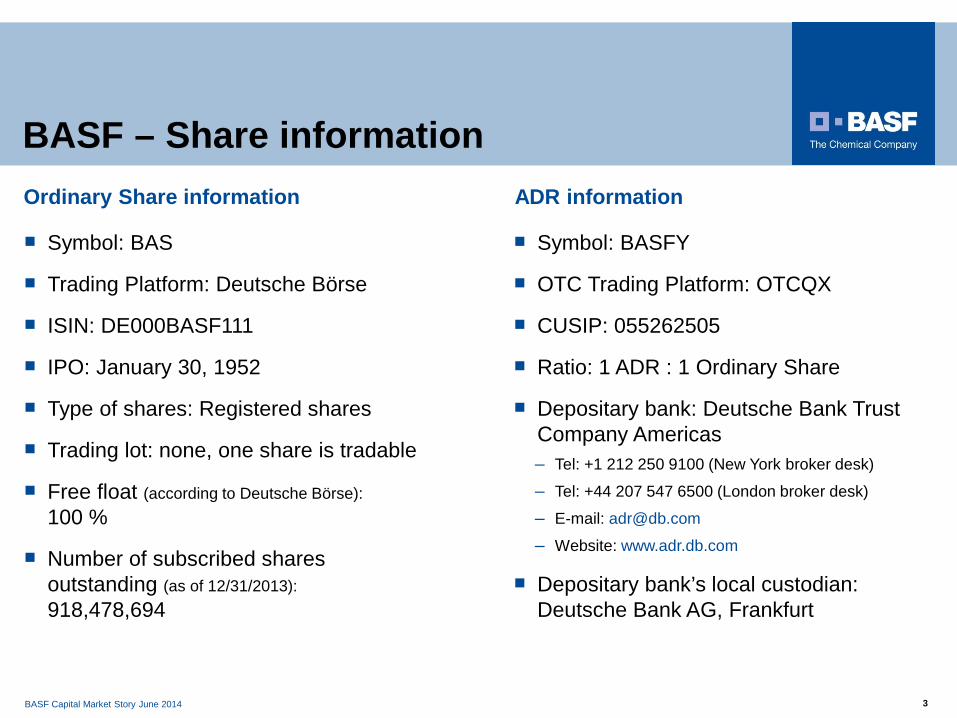
BASF – Share information
Symbol: BAS
Trading Platform: Deutsche Börse
ISIN: DE000BASF111
IPO: January 30, 1952
Type of shares: Registered shares
Trading lot: none, one share is tradable
Free float (according to Deutsche Börse): 100 %
Number of subscribed shares outstanding (as of 12/31/2013): 918,478,694
Symbol: BASFY
OTC Trading Platform: OTCQX
CUSIP: 055262505
Ratio: 1 ADR : 1 Ordinary Share
Depositary bank: Deutsche Bank Trust Company Americas – Tel: +1 212 250 9100 (New York broker desk)
– Tel: +44 207 547 6500 (London broker desk)
– E-mail: [email protected]
– Website: www.adr.db.com
Depositary bank’s local custodian: Deutsche Bank AG, Frankfurt
Ordinary Share information ADR information
BASF Capital Market Story June 2014 4
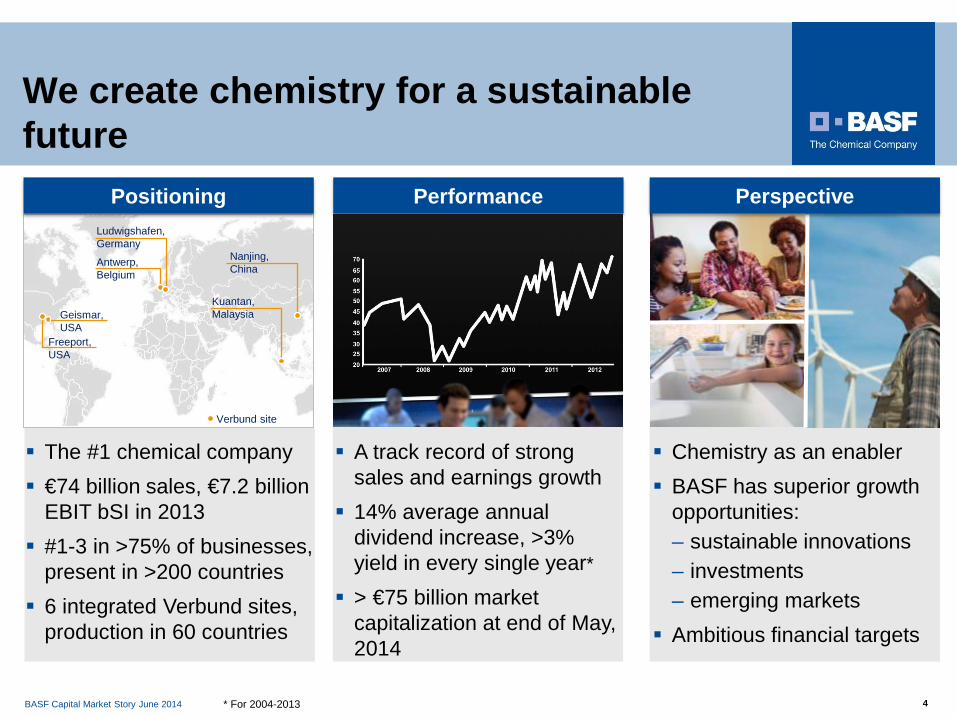
Chemistry as an enabler BASF has superior growth
opportunities: – sustainable innovations – investments – emerging markets
Ambitious financial targets
The #1 chemical company €74 billion sales, €7.2 billion
EBIT bSI in 2013 #1-3 in >75% of businesses,
present in >200 countries 6 integrated Verbund sites,
production in 60 countries
A track record of strong sales and earnings growth
14% average annual dividend increase, >3% yield in every single year*
> €75 billion market capitalization at end of May, 2014
Performance Perspective
* For 2004-2013
Ludwigshafen, Germany
Antwerp, Belgium
Nanjing, China
Kuantan, Malaysia Geismar,
USA Freeport, USA
Verbund site
Positioning
We create chemistry for a sustainable future
BASF Capital Market Story June 2014 5
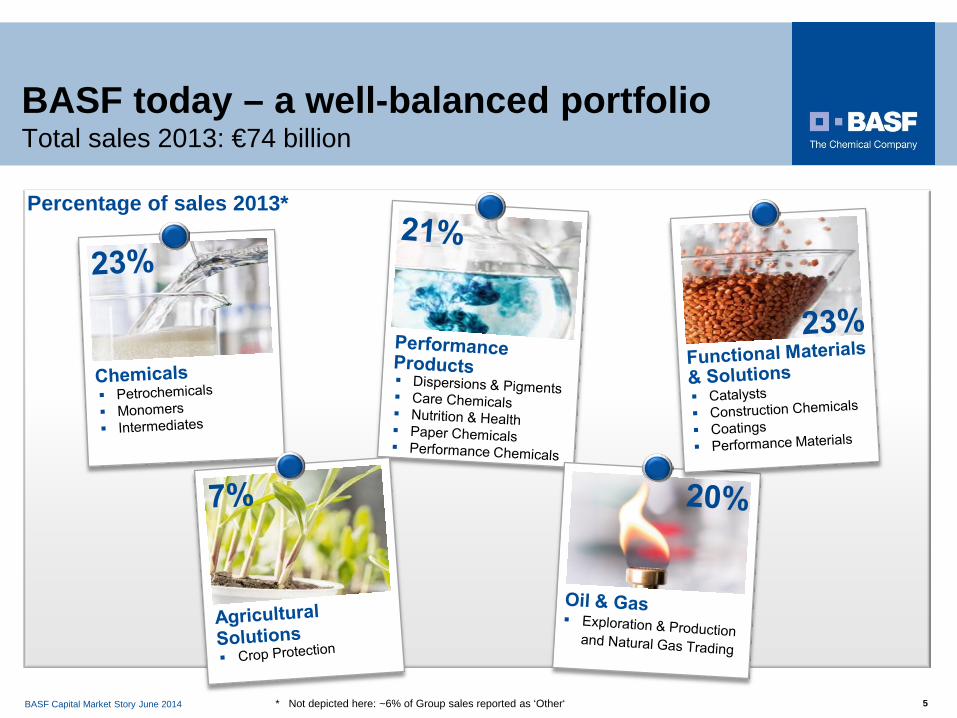
Percentage of sales 2013*
* Not depicted here: ~6% of Group sales reported as ‘Other‘
BASF today – a well-balanced portfolio Total sales 2013: €74 billion

BASF Capital Market Story June 2014 6
Global reduction in carbon emissions of 6.1 million metric tons/a. and reduction of waste
Example Ludwigshafen: avoidance of 7 million metric tons of freight/a. = 280,000 fewer truckloads
Shared use of on-site facilities: fire department, security, waste water treatment and analytics
Verbund generates >€1 billion p.a. global cost savings*, supports sustainability
* Savings include only tangible synergies. Additional (intangible) benefits and retained profits are not included.
BASF Capital Market Story June 2014 7
Business review
BASF strategy & growth targets
Strategic levers
BASF Capital Market Story June 2014 8
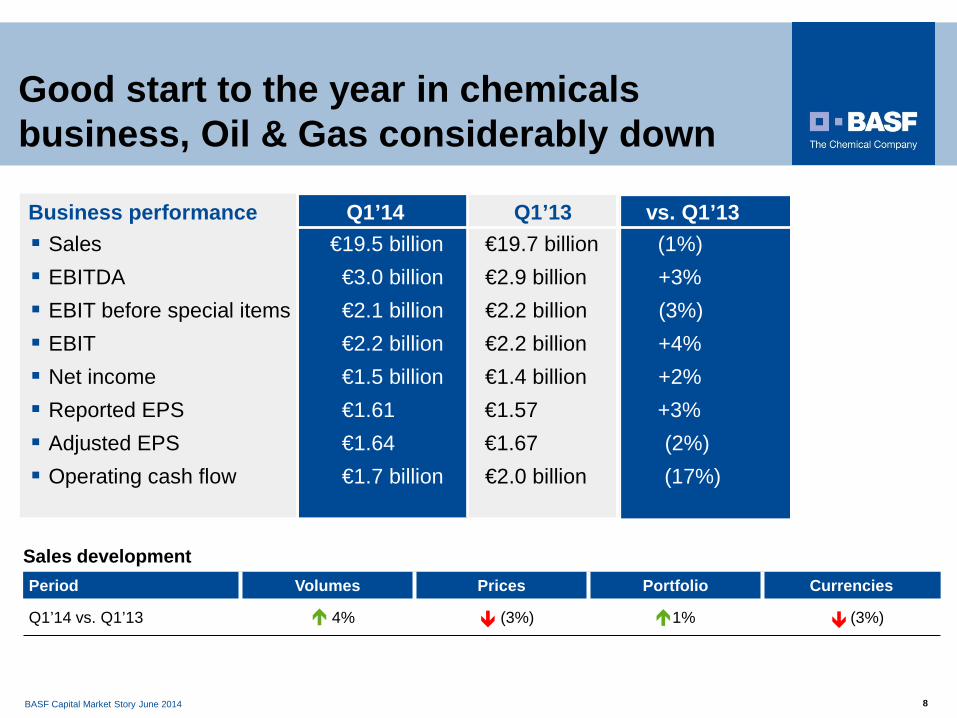
Good start to the year in chemicals business, Oil & Gas considerably down
Business performance Q1’14 Q1’13 vs. Q1’13 Sales €19.5 billion €19.7 billion (1%) EBITDA €3.0 billion €2.9 billion +3% EBIT before special items €2.1 billion €2.2 billion (3%) EBIT €2.2 billion €2.2 billion +4% Net income €1.5 billion €1.4 billion +2% Reported EPS €1.61 €1.57 +3% Adjusted EPS €1.64 €1.67 (2%) Operating cash flow €1.7 billion €2.0 billion (17%)
Sales development Period Volumes Prices Portfolio Currencies
Q1’14 vs. Q1’13 4% (3%) 1% (3%)

BASF Capital Market Story June 2014 9
BASF outperformed global chemical production by ~3 percentage points p.a. Sales to third parties billion €
33
79
72
74
16.6
20.7 -4.8
13.7 -6.6
3.7 -0.5 -2.0 0.6
20
40
60
80
2001 2012 2012 restated
2013
Volumes
Prices
Currencies M&A
Volumes Prices Currencies M&A
IFRS Impact
BASF nominal growth 2001 - 2013
Global chemical production
(BASF growth adj. for IFRS: ~8%)
(CAGR 2001 – 2013)
BASF Capital Market Story June 2014 10
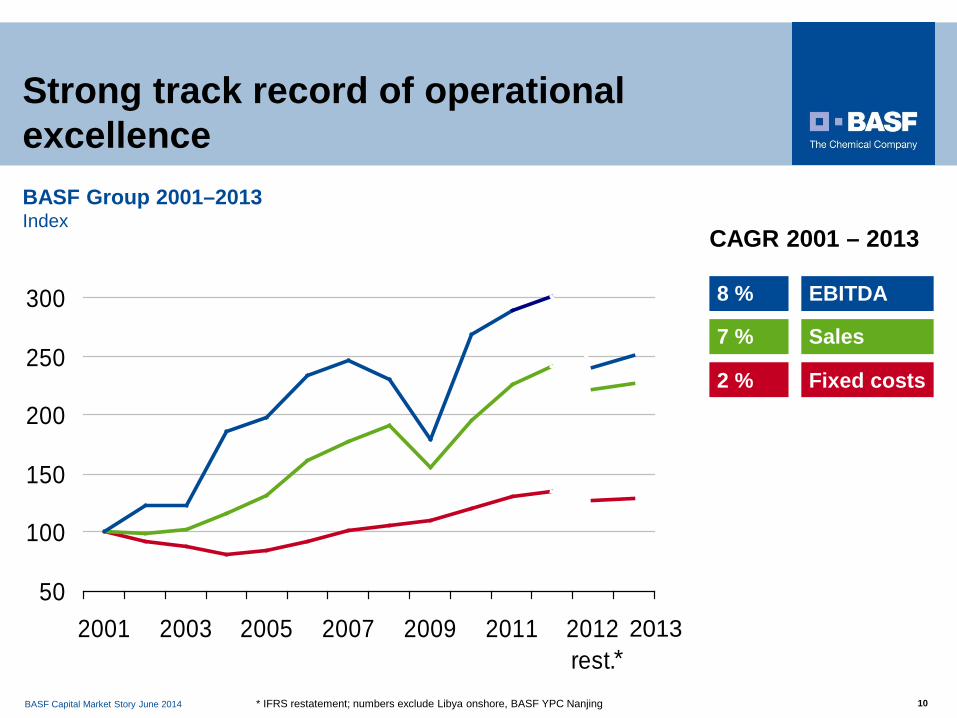
Strong track record of operational excellence BASF Group 2001–2013 Index
50
100
150
200
250
300
2001 2003 2005 2007 2009 2011 2012rest.
CAGR 2001 – 2013
8 %
7 %
2 %
EBITDA
Sales
Fixed costs
* IFRS restatement; numbers exclude Libya onshore, BASF YPC Nanjing
2013 *
BASF Capital Market Story June 2014 11
0
1
2
3
4
2004 2005 2006 2007 2008 2009** 2010 2011 2012 2013 Q12014
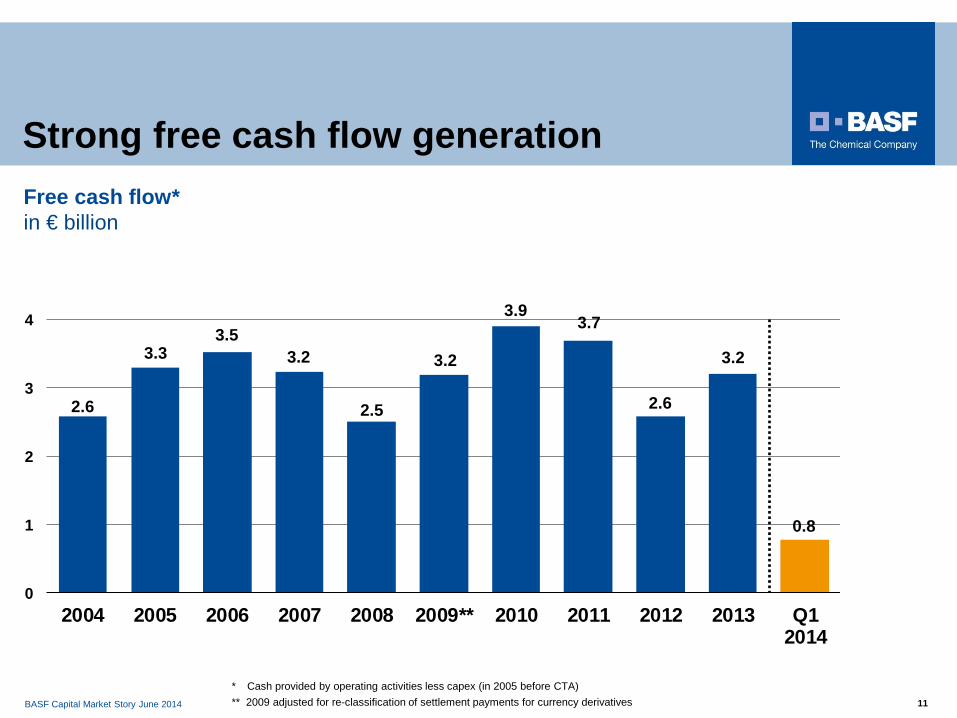
Strong free cash flow generation
* Cash provided by operating activities less capex (in 2005 before CTA) ** 2009 adjusted for re-classification of settlement payments for currency derivatives
Free cash flow* in € billion
2.6
3.3 3.5
3.2
2.5
3.2
3.9 3.7
2.6
3.2
0.8

BASF Capital Market Story June 2014 12
0.851.00
1.50
1.95 1.951.70
2.202.50
2004 2005 2006 2007 2008 2009 2010 2011 2012 2013
Attractive dividend yield
Dividend of €2.70 per share for 2013, an increase of ~4%
2004-2013: Average annual dividend increase of ~14%
Attractive dividend yield of 3.5% in 2013**
Dividend yield above 3% in any given year since 2004
* Dividend yield based on share price at year-end
Dividend payments
3.7% 3.2% 3.1% 4.1% 3.8% 7.0% 3.9%
Dividend yield* 4.6%
2.60 2.70
3.7%
** Based on BASF share price of €77.49 on Dec. 30, 2013
Dividend per share in €
CAGR 14%
3.5%
BASF Capital Market Story June 2014 13
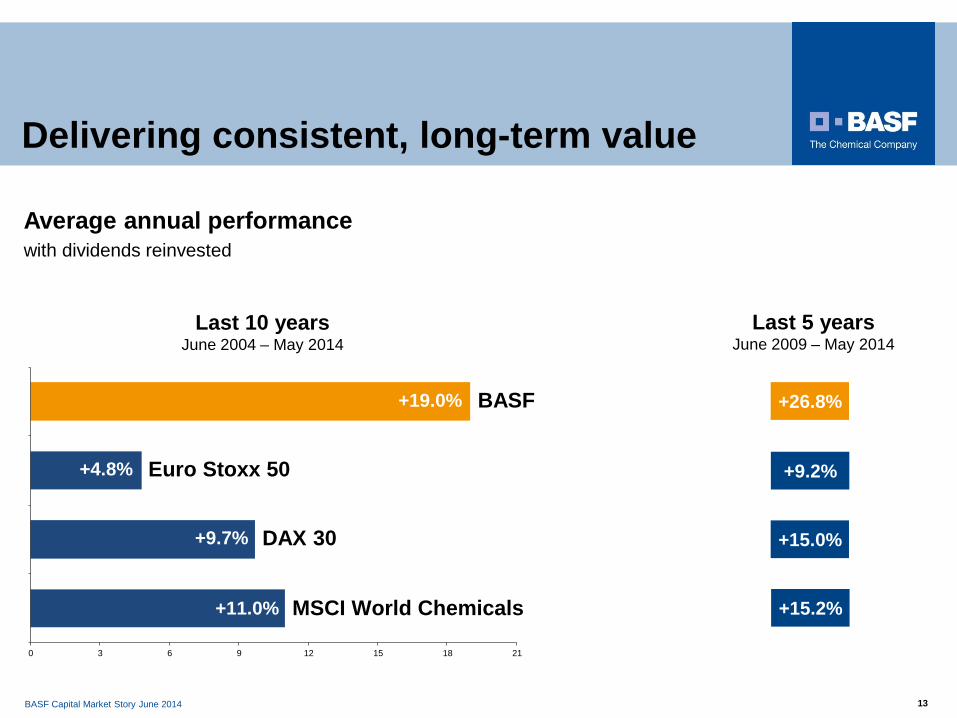
Average annual performance with dividends reinvested
0 3 6 9 12 15 18 21
Euro Stoxx 50
DAX 30
MSCI World Chemicals
+9.7%
Last 5 years June 2009 – May 2014
+26.8%
+9.2%
+15.0%
+15.2%
Last 10 years June 2004 – May 2014
BASF
+11.0%
+4.8%
+19.0%
Delivering consistent, long-term value
BASF Capital Market Story June 2014 14
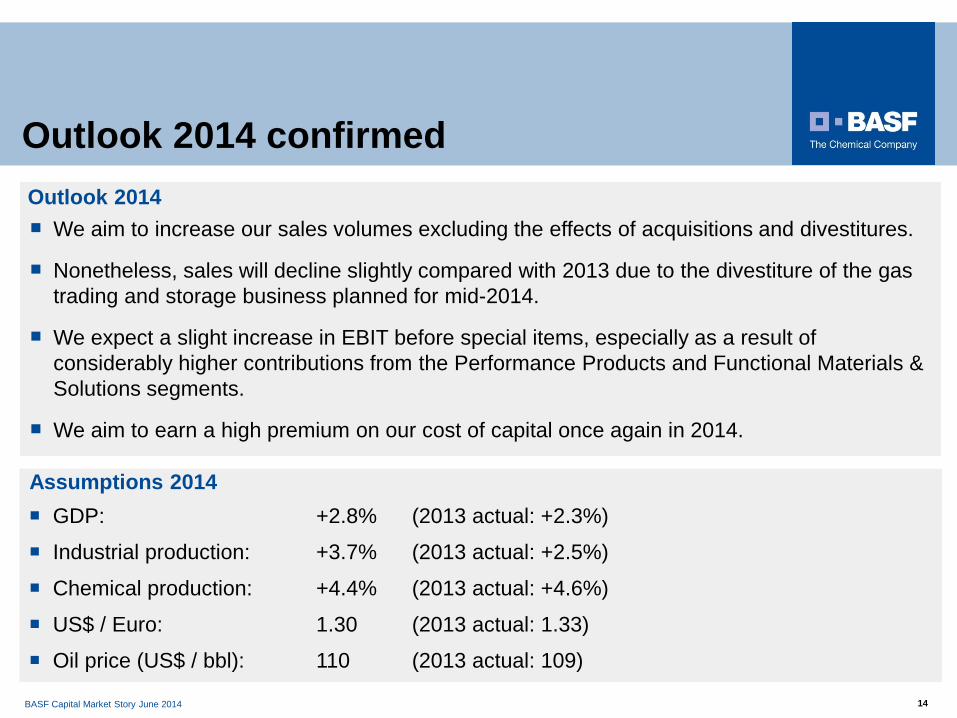
We aim to increase our sales volumes excluding the effects of acquisitions and divestitures.
Nonetheless, sales will decline slightly compared with 2013 due to the divestiture of the gas trading and storage business planned for mid-2014.
We expect a slight increase in EBIT before special items, especially as a result of considerably higher contributions from the Performance Products and Functional Materials & Solutions segments.
We aim to earn a high premium on our cost of capital once again in 2014.
Outlook 2014
GDP: +2.8% (2013 actual: +2.3%)
Industrial production: +3.7% (2013 actual: +2.5%)
Chemical production: +4.4% (2013 actual: +4.6%)
US$ / Euro: 1.30 (2013 actual: 1.33)
Oil price (US$ / bbl): 110 (2013 actual: 109)
Assumptions 2014
Outlook 2014 confirmed
BASF Capital Market Story June 2014 15
Business review
BASF strategy & growth targets
Strategic levers
BASF Capital Market Story June 2014 16
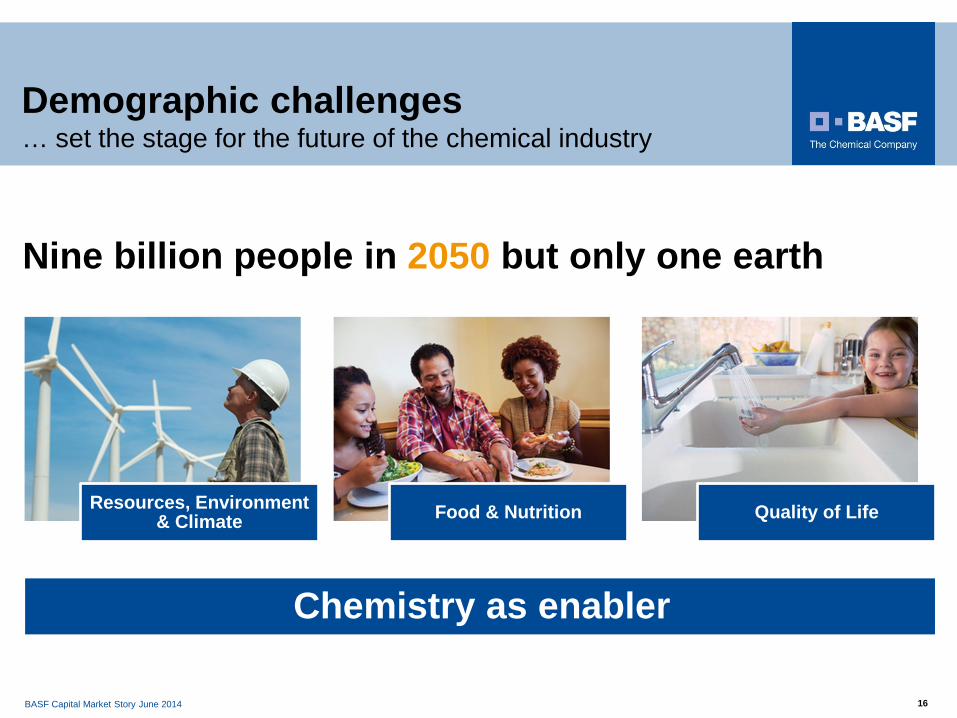
Demographic challenges … set the stage for the future of the chemical industry
Nine billion people in 2050 but only one earth
Resources, Environment & Climate Food & Nutrition Quality of Life
Chemistry as enabler
BASF Capital Market Story June 2014 17
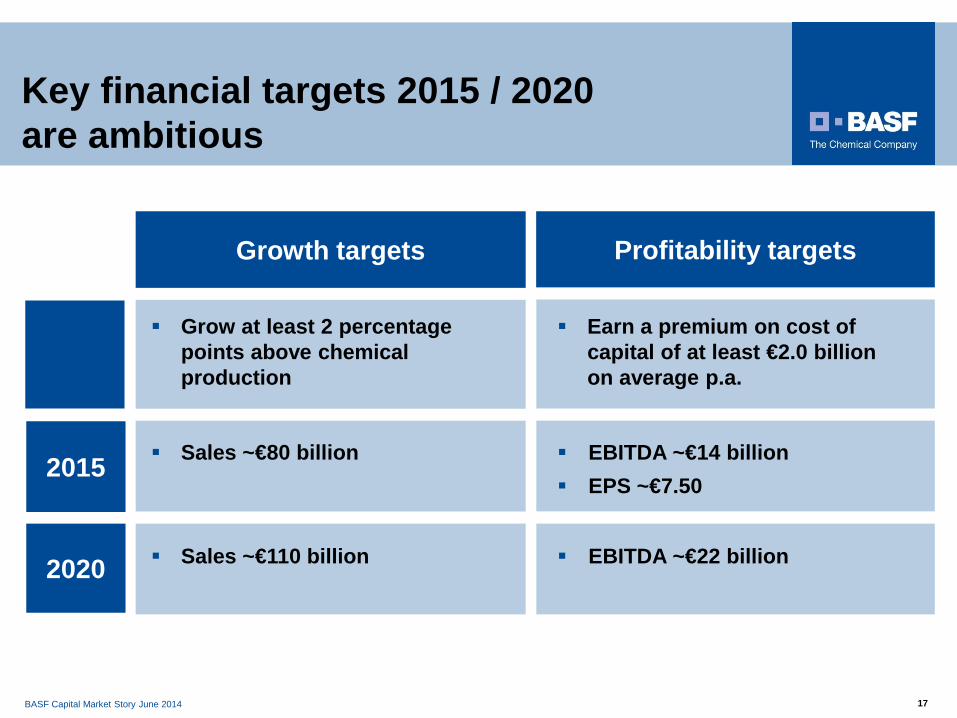
Grow at least 2 percentage points above chemical production
Earn a premium on cost of capital of at least €2.0 billion on average p.a.
Profitability targets Growth targets
2015
2020
Sales ~€80 billion
Sales ~€110 billion
EBITDA ~€14 billion EPS ~€7.50
EBITDA ~€22 billion
Key financial targets 2015 / 2020 are ambitious

BASF Capital Market Story June 2014 18
Business review
BASF strategy & growth targets
Strategic levers – Portfolio development
– Market approach – Innovations for a sustainable future – Investments – Acquisitions – Operational excellence
BASF Capital Market Story June 2014 19
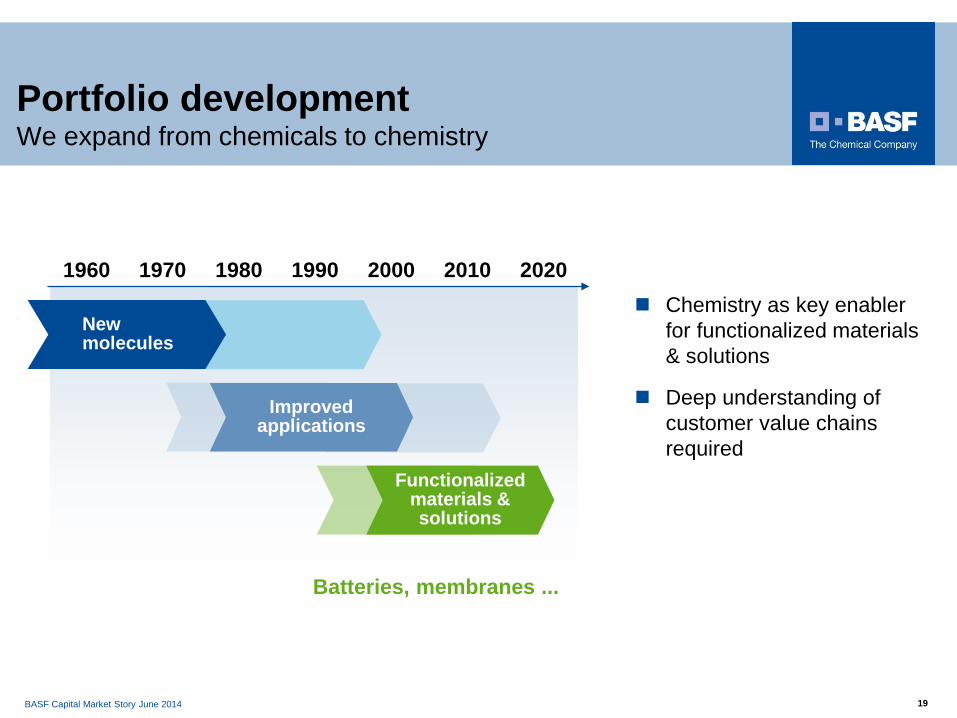
Portfolio development We expand from chemicals to chemistry
Chemistry as key enabler for functionalized materials & solutions
Deep understanding of customer value chains required
New molecules
Improved applications
Functionalized materials & solutions
1960 1970 1980 1990 2000 2010 2020
Batteries, membranes ...
BASF Capital Market Story June 2014 20
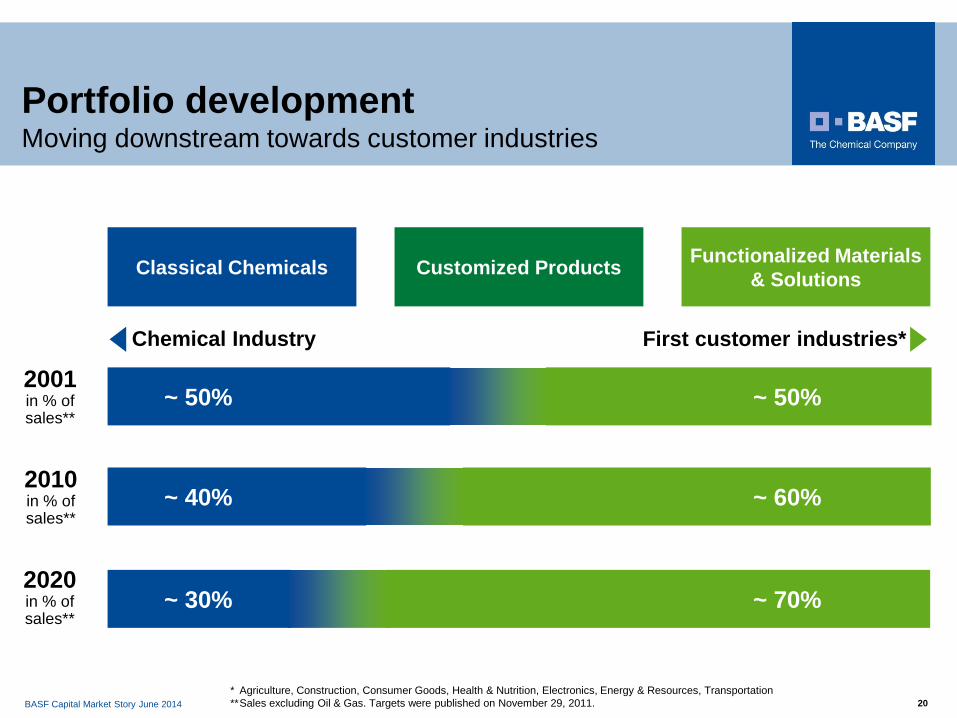
Portfolio development Moving downstream towards customer industries
* Agriculture, Construction, Consumer Goods, Health & Nutrition, Electronics, Energy & Resources, Transportation ** Sales excluding Oil & Gas. Targets were published on November 29, 2011.
Functionalized Materials & Solutions Customized Products Classical Chemicals
2020 in % of sales**
Chemical Industry First customer industries*
2010 in % of sales**
~ 40%
~ 30% ~ 70%
2001 in % of sales**
~ 50%
~ 60%
~ 50%
BASF Capital Market Story June 2014 21
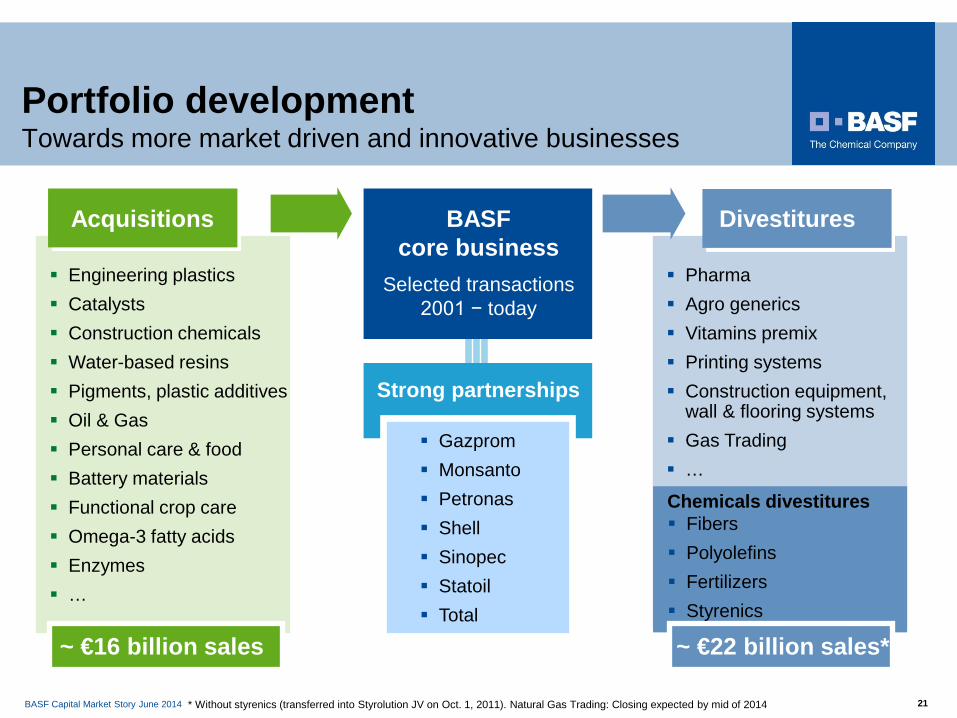
Engineering plastics Catalysts Construction chemicals Water-based resins Pigments, plastic additives Oil & Gas Personal care & food Battery materials Functional crop care Omega-3 fatty acids Enzymes …
BASF core business
Strong partnerships
Gazprom Monsanto Petronas Shell Sinopec Statoil Total
Selected transactions 2001 − today
Acquisitions
~ €16 billion sales
Divestitures
Pharma Agro generics Vitamins premix Printing systems Construction equipment,
wall & flooring systems Gas Trading …
~ €22 billion sales*
Fibers Polyolefins Fertilizers Styrenics
Chemicals divestitures
Portfolio development Towards more market driven and innovative businesses
* Without styrenics (transferred into Styrolution JV on Oct. 1, 2011). Natural Gas Trading: Closing expected by mid of 2014
BASF Capital Market Story June 2014 22
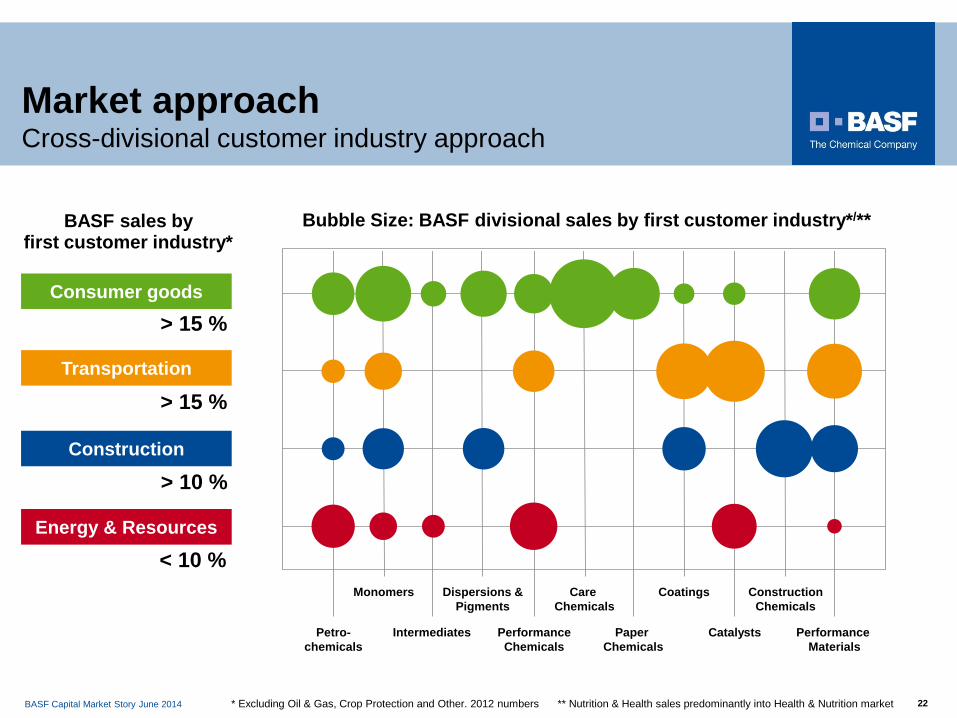
Monomers
Intermediates
Dispersions & Pigments
Performance Chemicals
Care Chemicals
Paper Chemicals
Coatings
Catalysts
Construction Chemicals
BASF sales by first customer industry*
> 15 %
> 10 %
< 10 %
> 15 %
Consumer goods
Transportation
Construction
Energy & Resources
Market approach Cross-divisional customer industry approach
* Excluding Oil & Gas, Crop Protection and Other. 2012 numbers
Petro- chemicals
Performance Materials
Bubble Size: BASF divisional sales by first customer industry*/**
** Nutrition & Health sales predominantly into Health & Nutrition market
BASF Capital Market Story June 2014 23
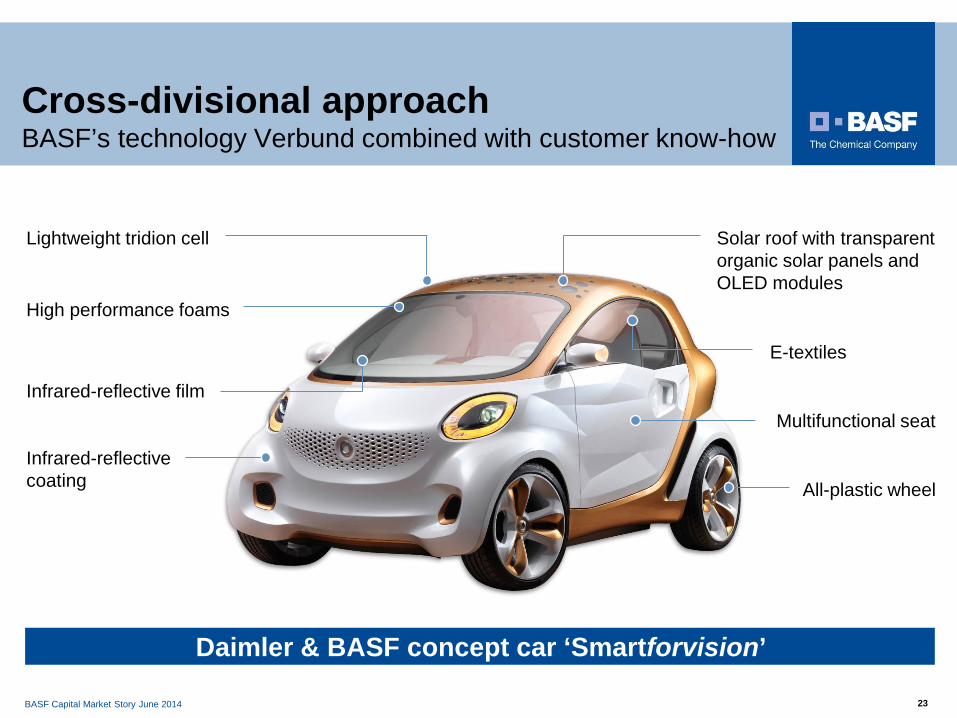
E-textiles
Solar roof with transparent organic solar panels and OLED modules
Multifunctional seat
Infrared-reflective coating
Infrared-reflective film
High performance foams
Lightweight tridion cell
All-plastic wheel
Cross-divisional approach BASF’s technology Verbund combined with customer know-how
Daimler & BASF concept car ‘Smartforvision’
BASF Capital Market Story June 2014 24
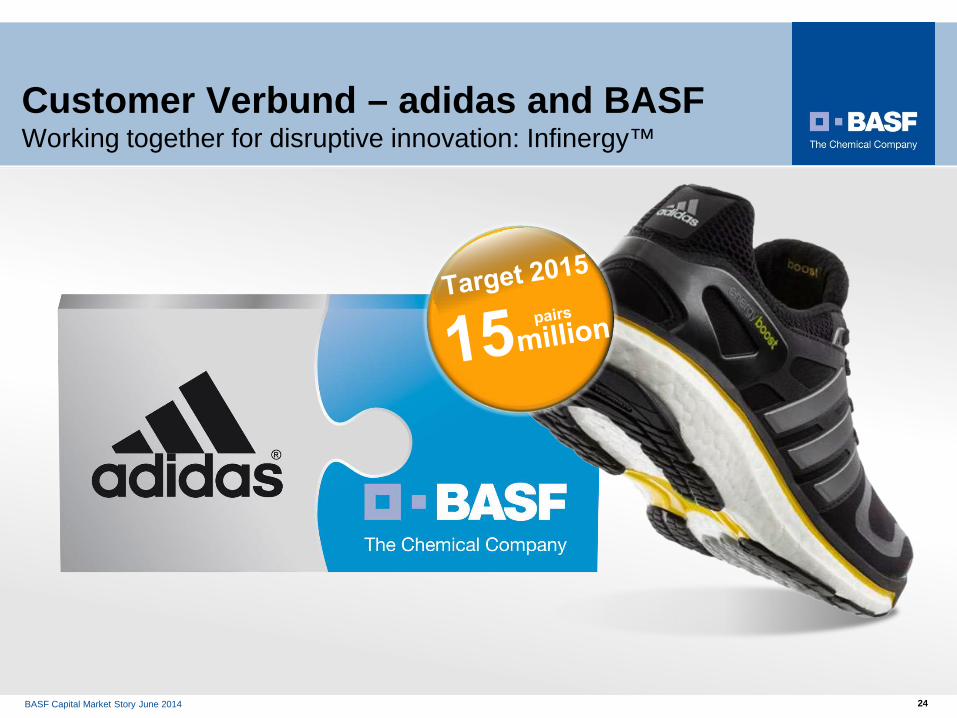
Customer Verbund – adidas and BASF Working together for disruptive innovation: Infinergy™

BASF Capital Market Story June 2014 25
Strong commitment to innovation Innovations for a sustainable future
1.4 1.5
1.6 1.7
1.8
0.0
0.5
1.0
1.5
2.0
2009 2010 2011 2012 2013
€1.8 billion R&D expenditure in 2013, further increase of R&D spending planned in 2014
~10,650 employees in R&D
~3,000 projects
Research Verbund: Cooperations with ~600 excellent partners from universities, start-ups and industry
Target 2015 and 2020:
– €10 billion in sales from innovations younger 5 years
– €30 billion in sales from innovations younger 10 years
R&D expenditures in € billion
Chemicals 10%
Performance Products 20%
Functional Mat. & Sol. 20%
Agricultural Solutions 26%
Oil & Gas 3%
Corporate Research 21%
Key facts
2.0
1.5
1.0
0.5
0
BASF Capital Market Story June 2014 26
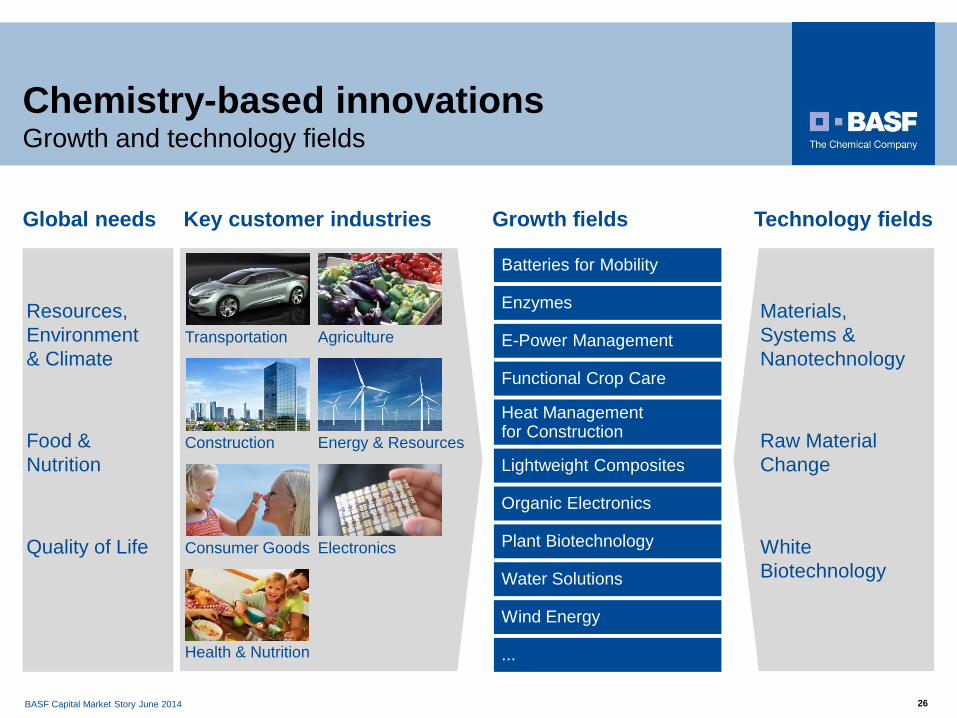
Chemistry-based innovations Growth and technology fields
Growth fields
Resources, Environment & Climate
Food & Nutrition
Quality of Life White Biotechnology
Materials, Systems & Nanotechnology
Raw Material Change
Key customer industries
Health & Nutrition
Consumer Goods
Transportation
Energy & Resources
Electronics
Agriculture
Construction
Technology fields Global needs
...
Batteries for Mobility
Enzymes
Heat Management for Construction
Organic Electronics
Functional Crop Care
Plant Biotechnology
E-Power Management
Wind Energy
Lightweight Composites
Water Solutions
BASF Capital Market Story June 2014 27
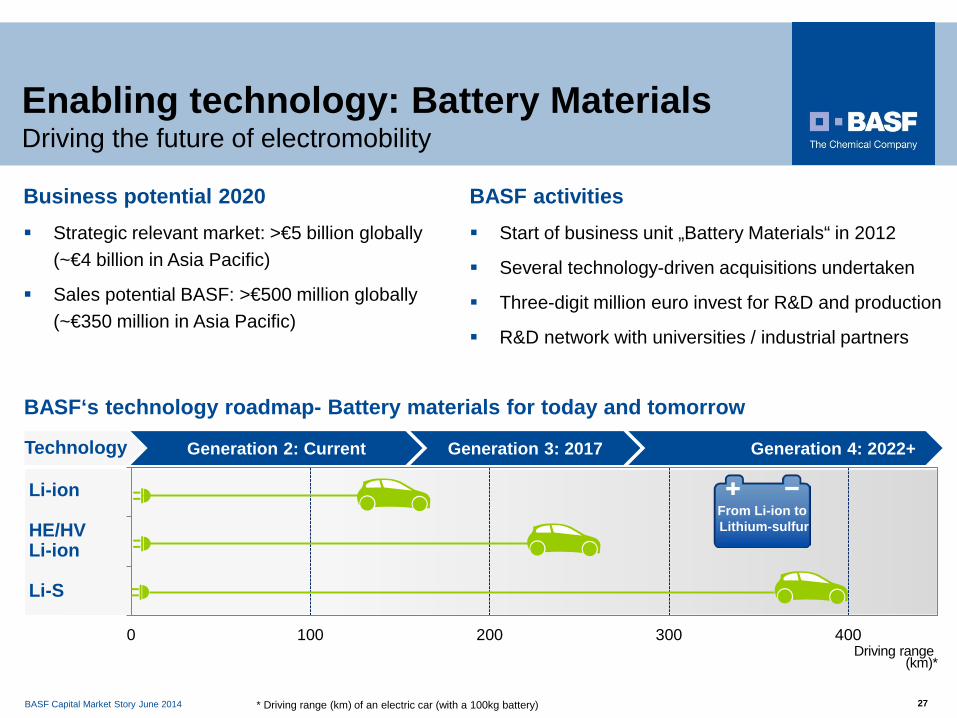
Enabling technology: Battery Materials Driving the future of electromobility
* Driving range (km) of an electric car (with a 100kg battery)
0 100 200 300 400
Li-S**
HE/HV
Li-ion
Generation 2: Current Generation 3: 2017 Generation 4: 2022+
BASF‘s technology roadmap- Battery materials for today and tomorrow
Li-ion HE/HV Li-ion Li-S
Driving range (km)*
Technology
From Li-ion to Lithium-sulfur
Business potential 2020 Strategic relevant market: >€5 billion globally
(~€4 billion in Asia Pacific)
Sales potential BASF: >€500 million globally (~€350 million in Asia Pacific)
BASF activities Start of business unit „Battery Materials“ in 2012
Several technology-driven acquisitions undertaken
Three-digit million euro invest for R&D and production
R&D network with universities / industrial partners
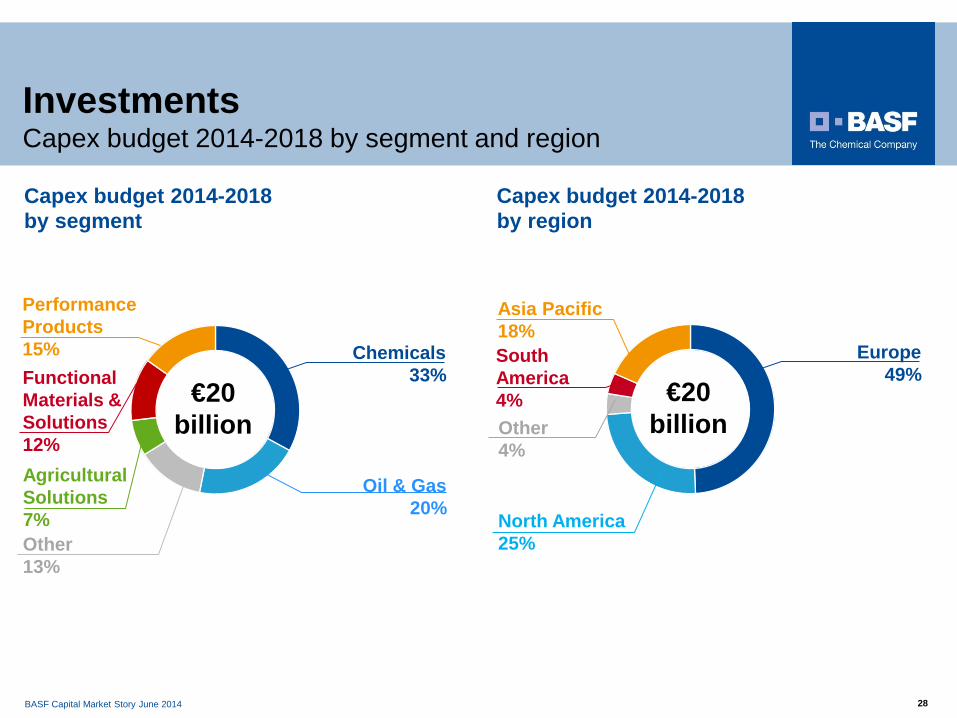
BASF Capital Market Story June 2014 28
Performance Products 15%
Oil & Gas 20%
€20 billion
Functional Materials & Solutions 12%
Capex budget 2014-2018
Other 13%
Chemicals 33%
Capex budget 2014-2018
Asia Pacific 18%
€20 billion
South America 4%
North America 25%
Europe 49%
Agricultural Solutions 7%
Other 4%
by segment by region
Investments Capex budget 2014-2018 by segment and region
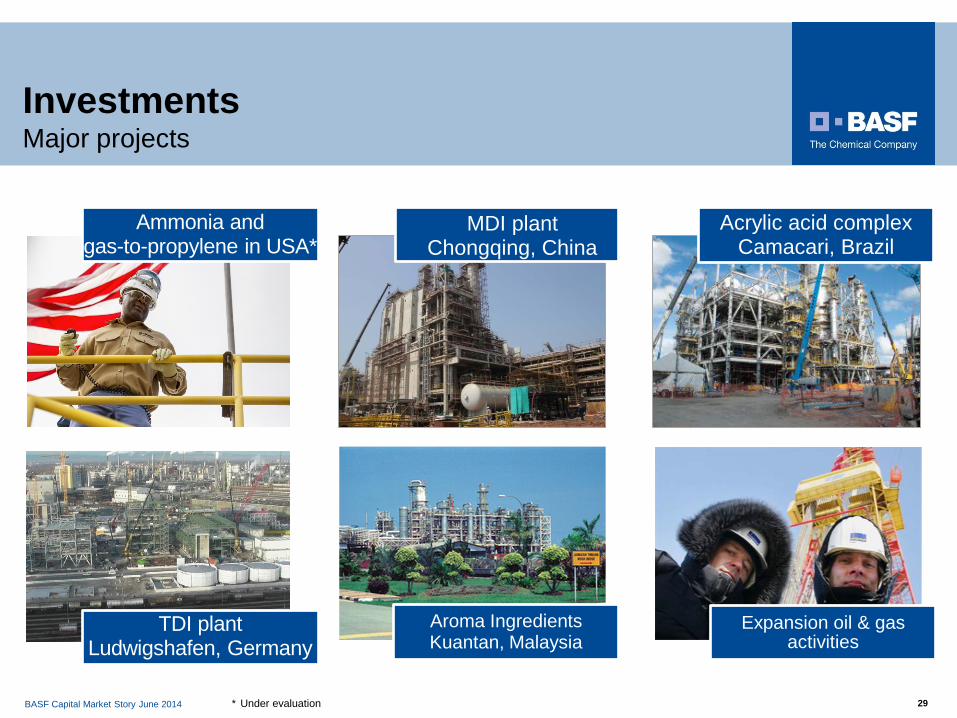
BASF Capital Market Story June 2014 29
Expansion oil & gas activities
Aroma Ingredients Kuantan, Malaysia
Investments Major projects
Ammonia and gas-to-propylene in USA*
MDI plant Chongqing, China
Acrylic acid complex Camacari, Brazil
TDI plant Ludwigshafen, Germany
* Under evaluation
BASF Capital Market Story June 2014 30
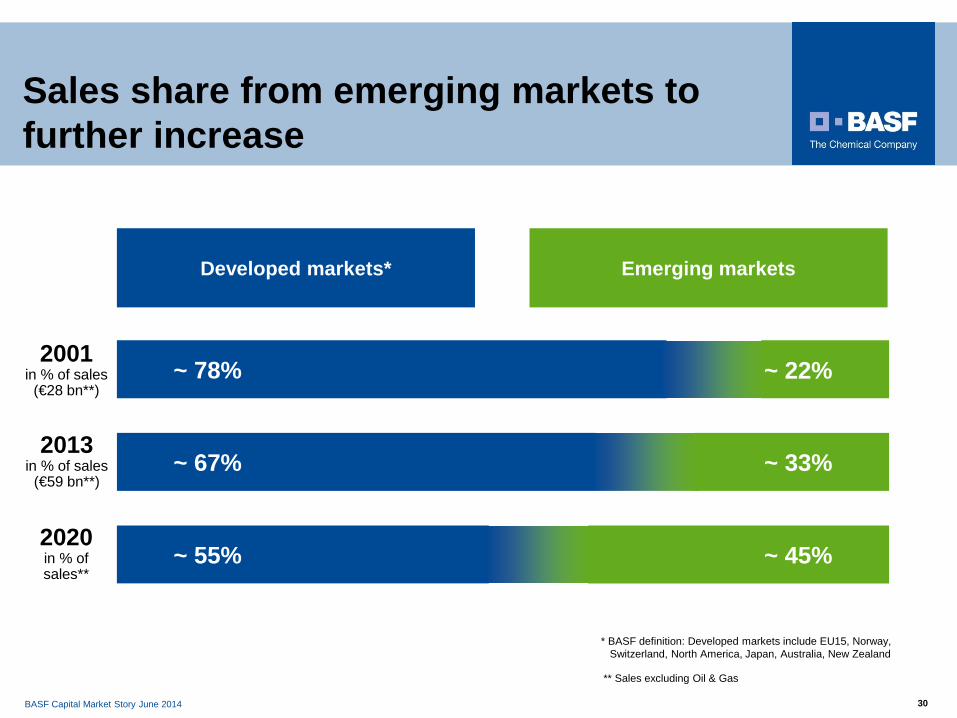
Sales share from emerging markets to further increase
* BASF definition: Developed markets include EU15, Norway, Switzerland, North America, Japan, Australia, New Zealand
2020 in % of sales**
2013 in % of sales
(€59 bn**)
2001 in % of sales
(€28 bn**)
Emerging markets Developed markets*
~ 67%
~ 55% ~ 45%
~ 78%
~ 33%
~ 22%
** Sales excluding Oil & Gas
BASF Capital Market Story June 2014 31
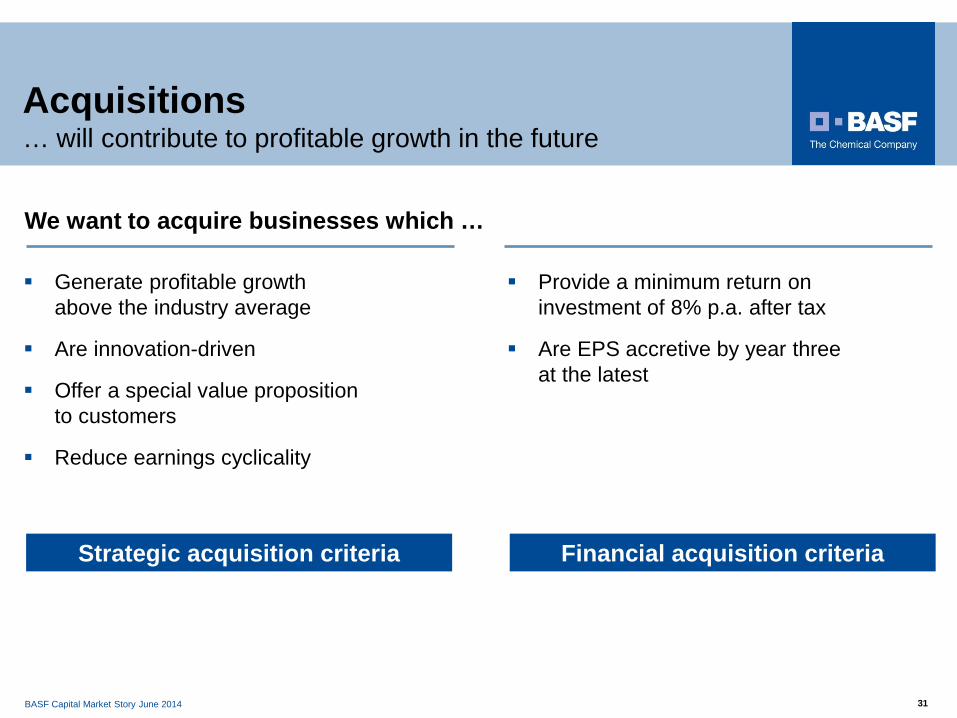
Acquisitions … will contribute to profitable growth in the future
Provide a minimum return on investment of 8% p.a. after tax
Are EPS accretive by year three at the latest
Financial acquisition criteria
Generate profitable growth above the industry average
Are innovation-driven
Offer a special value proposition to customers
Reduce earnings cyclicality
Strategic acquisition criteria
We want to acquire businesses which …
BASF Capital Market Story June 2014 32
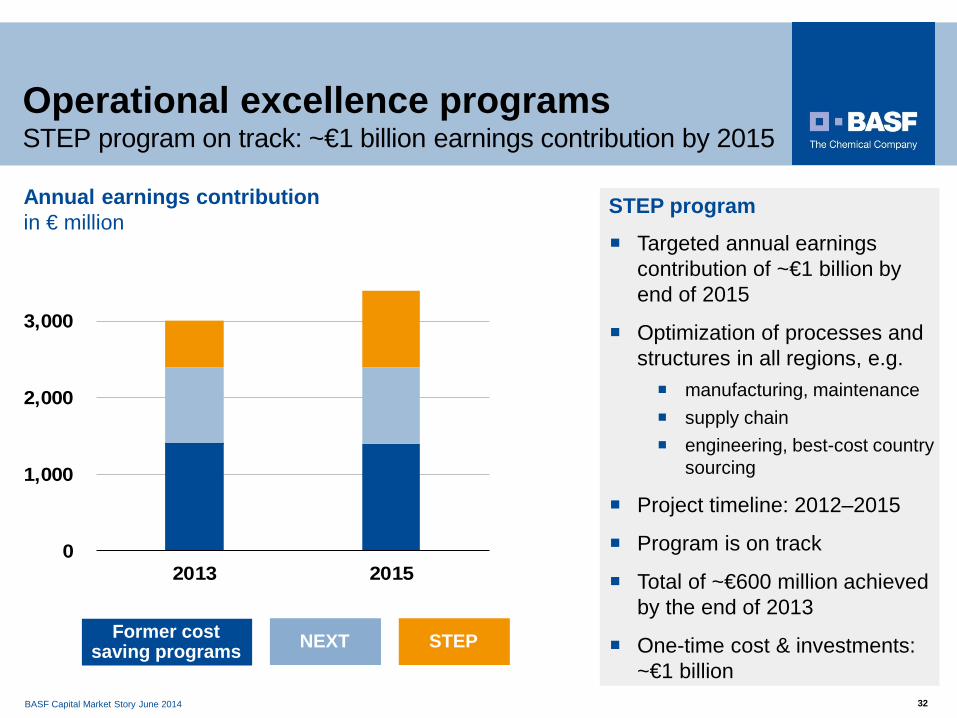
0
1,000
2,000
3,000
2013 2015
Former cost saving programs NEXT STEP
Operational excellence programs STEP program on track: ~€1 billion earnings contribution by 2015
Annual earnings contribution in € million
Targeted annual earnings contribution of ~€1 billion by end of 2015
Optimization of processes and structures in all regions, e.g. manufacturing, maintenance supply chain engineering, best-cost country
sourcing
Project timeline: 2012–2015
Program is on track
Total of ~€600 million achieved by the end of 2013
One-time cost & investments: ~€1 billion
STEP program
BASF Capital Market Story June 2014 33
Appendix:
Q1 2014 Reporting

BASF Capital Market Story June 2014 34
Portfolio optimization & development
Portfolio optimization in Oil & Gas Increasing backward integration in the US
Strengthen competitiveness of Performance Products
Strengthening Verbund sites in Asia
BASF Capital Market Story June 2014 35
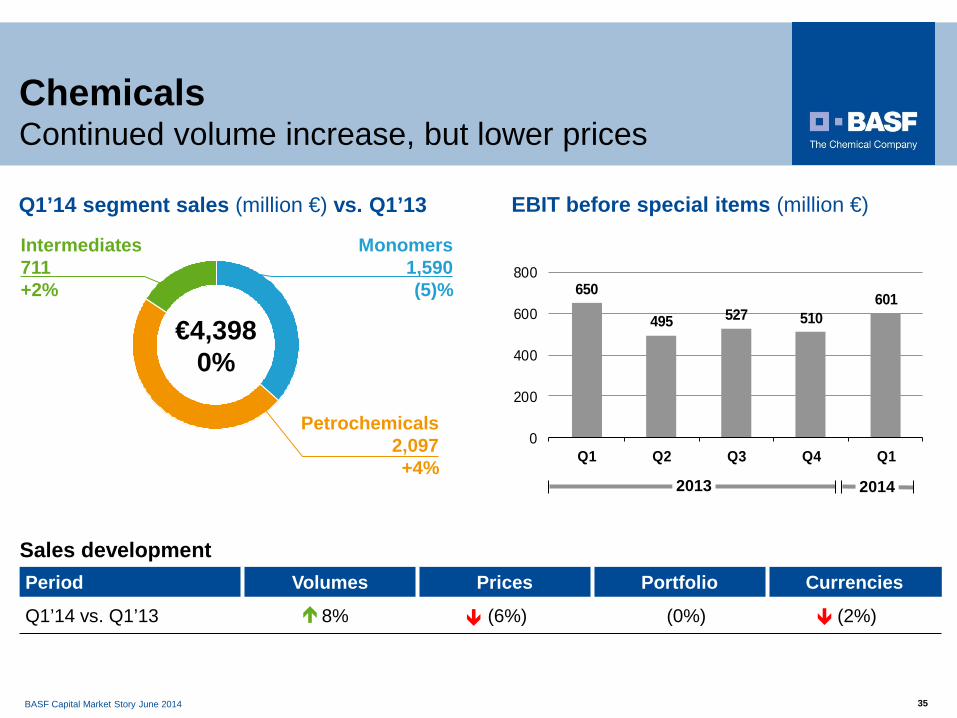
Chemicals Continued volume increase, but lower prices
Intermediates 711 +2%
Monomers 1,590 (5)%
Petrochemicals 2,097 +4%
€4,398 0%
650
495 527 510601
0
200
400
600
800
Q1 Q2 Q3 Q4 Q1
EBIT before special items (million €)
2014 2013
Q1’14 segment sales (million €) vs. Q1’13
Sales development Period Volumes Prices Portfolio Currencies
Q1’14 vs. Q1’13 8% (6%) (0%) (2%)
BASF Capital Market Story June 2014 36
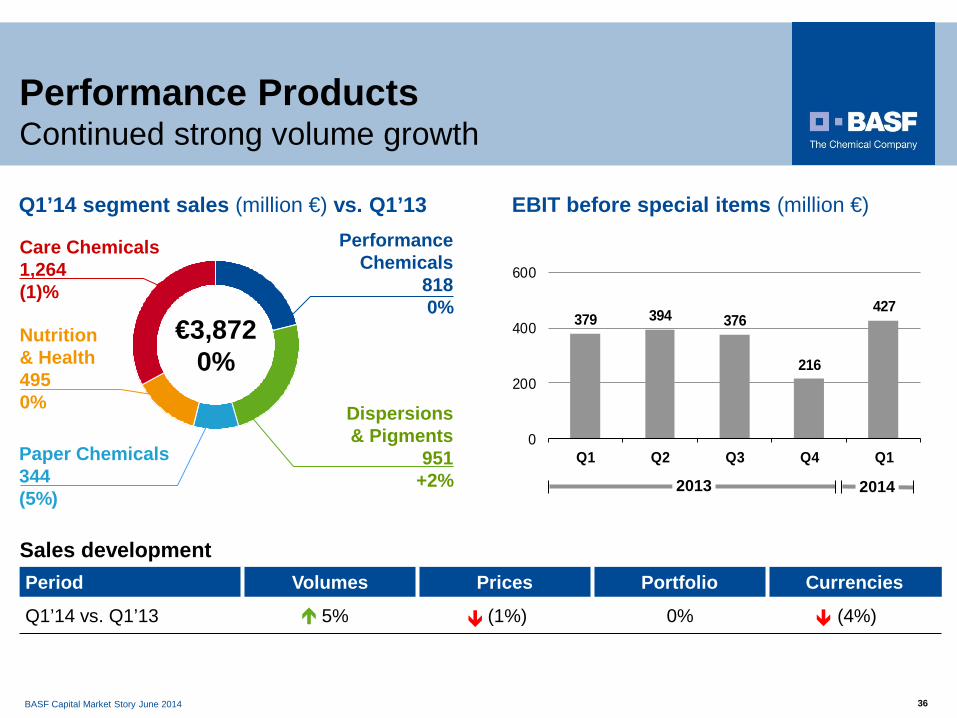
Performance Products Continued strong volume growth
Performance Chemicals
818 0%
Care Chemicals 1,264 (1)%
€3,8720%
Paper Chemicals 344 (5%)
Q1’14 segment sales (million €) vs. Q1’13
Nutrition & Health 495 0% Dispersions
& Pigments 951
+2%
379 394 376
216
427
0
200
400
600
Q1 Q2 Q3 Q4 Q1
EBIT before special items (million €)
2014 2013
Sales development Period Volumes Prices Portfolio Currencies
Q1’14 vs. Q1’13 5% (1%) 0% (4%)
BASF Capital Market Story June 2014 37
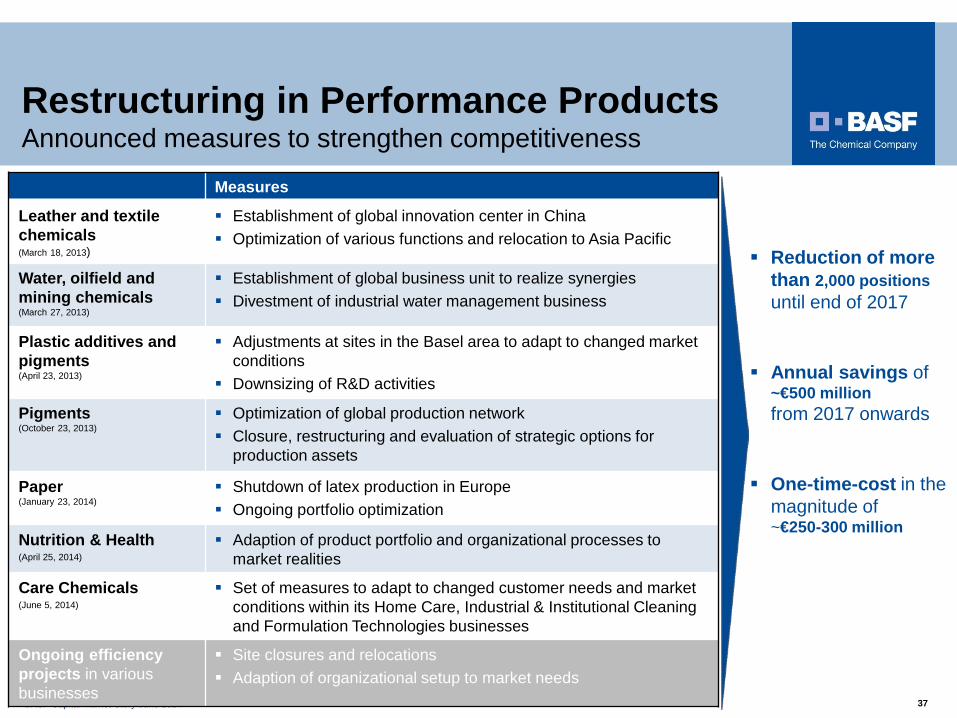
Restructuring in Performance Products Announced measures to strengthen competitiveness
Measures
Leather and textile chemicals (March 18, 2013)
Establishment of global innovation center in China Optimization of various functions and relocation to Asia Pacific
Water, oilfield and mining chemicals (March 27, 2013)
Establishment of global business unit to realize synergies Divestment of industrial water management business
Plastic additives and pigments (April 23, 2013)
Adjustments at sites in the Basel area to adapt to changed market conditions
Downsizing of R&D activities
Pigments (October 23, 2013)
Optimization of global production network Closure, restructuring and evaluation of strategic options for
production assets
Paper (January 23, 2014)
Shutdown of latex production in Europe Ongoing portfolio optimization
Nutrition & Health (April 25, 2014)
Adaption of product portfolio and organizational processes to market realities
Care Chemicals (June 5, 2014)
Set of measures to adapt to changed customer needs and market conditions within its Home Care, Industrial & Institutional Cleaning and Formulation Technologies businesses
Ongoing efficiency projects in various businesses
Site closures and relocations Adaption of organizational setup to market needs
Reduction of more than 2,000 positions until end of 2017
Annual savings of ~€500 million from 2017 onwards
One-time-cost in the magnitude of ~€250-300 million

BASF Capital Market Story June 2014 38
Functional Materials & Solutions Strong demand from automotive industry
Catalysts 1,458 0%
Construction Chemicals
443 (3%)
Coatings 721
+3%
€4,236+1%
Q1’14 segment sales (million €) vs. Q1’13
239293 300
238
311
050
100150200250300350
Q1 Q2 Q3 Q4 Q1
EBIT before special items (million €)
2014 2013
Sales development Period Volumes Prices Portfolio Currencies
Q1’14 vs. Q1’13 7% (1%) 0% (5%)
Performance Materials 1,614 +3%
BASF Capital Market Story June 2014 39
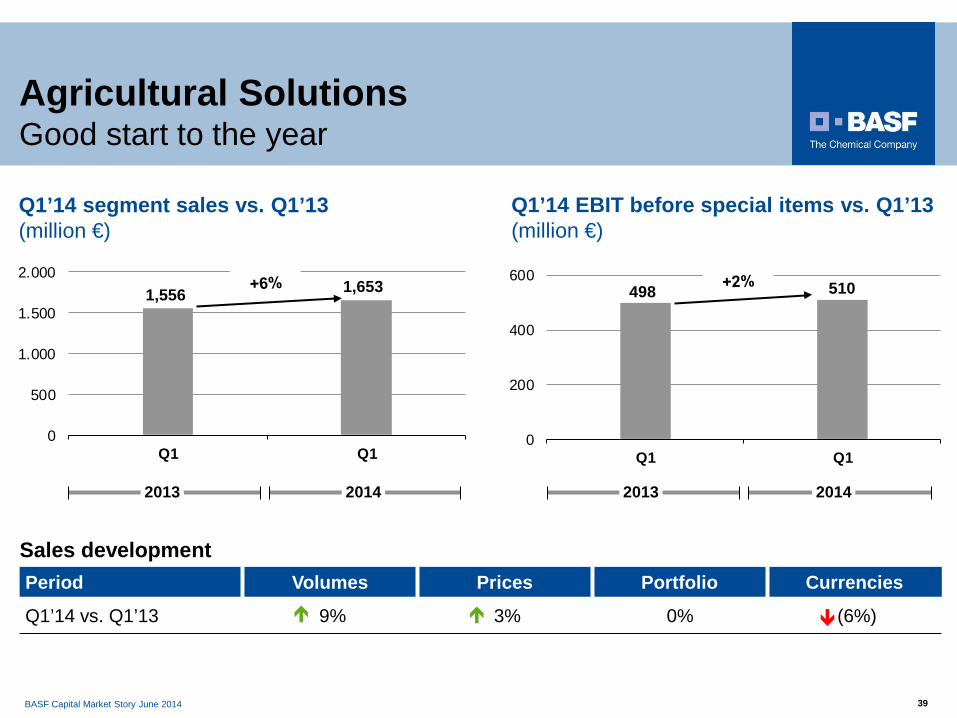
Agricultural Solutions Good start to the year
Q1’14 segment sales vs. Q1’13 (million €)
Q1’14 EBIT before special items vs. Q1’13 (million €)
2014 2013
0
200
400
600
Q1 Q1
2014 2013
0
500
1.000
1.500
2.000
Q1 Q1
1,653 510 498 1,556
Sales development Period Volumes Prices Portfolio Currencies
Q1’14 vs. Q1’13 9% 3% 0% (6%)

BASF Capital Market Story June 2014 40
Oil & Gas Lower sales and earnings, net income increased
Exploration & Production
792 0%
Natural Gas Trading 3,484 (10%) €4,276
-8%
Q1’14 segment sales (million €) vs. Q1’13 EBIT bSI/Net income (million €)
162397
65
442
0
200
400
600
800
Q1/2013 Net Income Q1/2014 Net Income
Natural Gas Trading
Exploration & Production
Net income
630
Sales development Period Volumes Prices/Currencies Portfolio
Q1’14 vs. Q1’13 (7%) (4%) 3%
468
494
429
BASF Capital Market Story June 2014 41
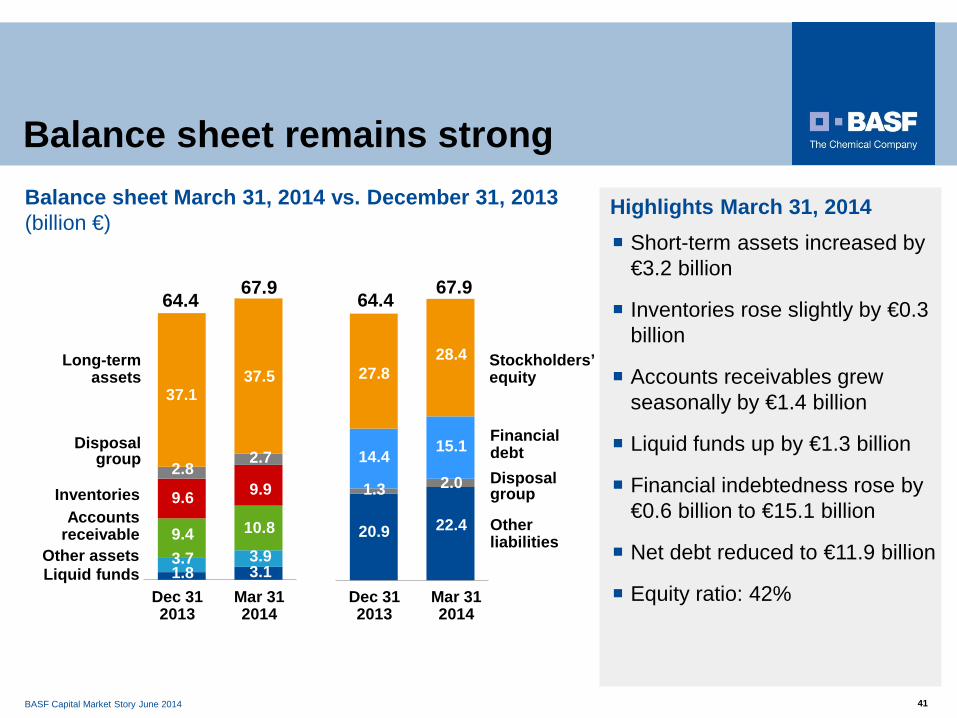
Balance sheet remains strong Balance sheet March 31, 2014 vs. December 31, 2013 (billion €)
Liquid funds
Accounts receivable
Long-term assets
37.1
9.4
1.8
Other liabilities
Financial debt
Stockholders’ equity
Dec 31 2013
Mar 31 2014
Mar 31 2014
Dec 31 2013
64.4
Inventories
Other assets
9.6
3.7
Highlights March 31, 2014 Short-term assets increased by
€3.2 billion
Inventories rose slightly by €0.3 billion
Accounts receivables grew seasonally by €1.4 billion
Liquid funds up by €1.3 billion
Financial indebtedness rose by €0.6 billion to €15.1 billion
Net debt reduced to €11.9 billion
Equity ratio: 42%
37.5
10.8
3.1
9.9
3.9
67.9
2.7 Disposal group
Disposal group 2.8
27.8
20.9
64.4
1.3
28.4
22.4
2.0
67.9
15.1 14.4

BASF Capital Market Story June 2014 42
We aim to increase our sales volumes excluding the effects of acquisitions and divestitures.
Nonetheless, sales will decline slightly compared with 2013 due to the divestiture of the gas trading and storage business planned for mid-2014.
We expect a slight increase in EBIT before special items, especially as a result of considerably higher contributions from the Performance Products and Functional Materials & Solutions segments.
We aim to earn a high premium on our cost of capital once again in 2014.
Outlook 2014
GDP: +2.8%
Industrial production: +3.7%
Chemical production: +4.4%
US$ / Euro: 1.30
Oil price (US$ / bbl): 110
Assumptions 2014
Outlook 2014 confirmed
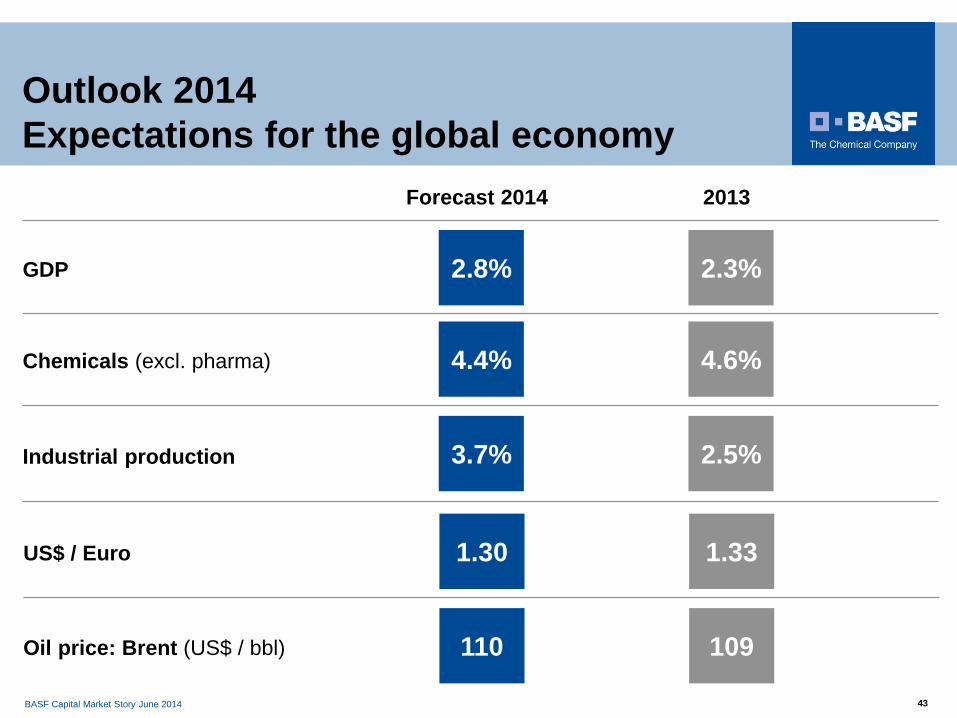
BASF Capital Market Story June 2014 43
Outlook 2014 Expectations for the global economy
2013
GDP 2.3%
Chemicals (excl. pharma) 4.6%
Industrial production 2.5%
US$ / Euro 1.33
Oil price: Brent (US$ / bbl) 109
Forecast 2014
2.8%
4.4%
3.7%
1.30
110
BASF Capital Market Story June 2014 44
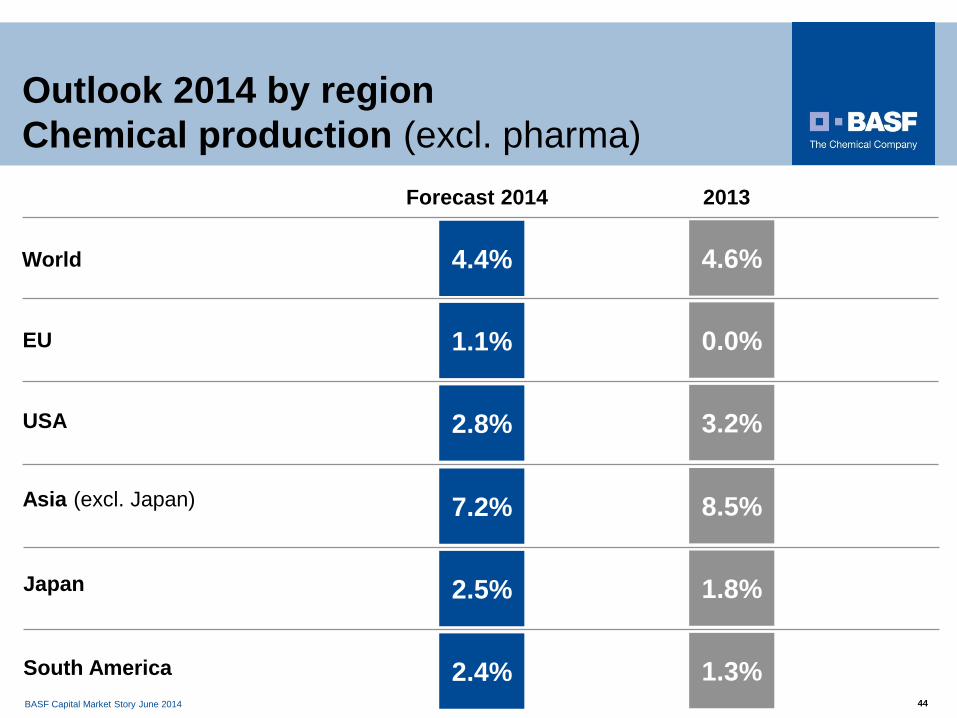
Outlook 2014 by region Chemical production (excl. pharma)
EU
USA
Asia (excl. Japan)
Japan
South America
4.4%
1.1%
2.8%
7.2%
2.5%
2.4%
World 4.6%
0.0%
3.2%
8.5%
1.8%
1.3%
2013 Forecast 2014

BASF Capital Market Story June 2014 45
EBIT before special items
(million €) 2013 Forecast 2014
Chemicals 2,182 slight decrease Performance Products 1,365 considerable increase Functional Materials & Solutions 1,070 considerable increase Agricultural Solutions 1,222 slight increase Oil & Gas 1,969 slight increase Other (618) slight decrease
BASF Group 7,190 slight increase
Outlook 2014 Forecast by segment
With respect to EBIT before special items, “slight” means a change of 1-10%, while “considerable” is used for changes greater than 11%. “At prior-year level” indicates no change (+/-0%).
BASF Capital Market Story June 2014 46
46