wealth still matters - education policy and data center · wealth still matters a study of wealth...
TRANSCRIPT

Wealth Still Matters
A Study of Wealth Differentials in Primary School Attendance from 1990-2006 in Developing Countries EPDC Working Paper No. WP-09 Winter 2009
EDUCATION POLICY AND DATA CENTERMaking sense of data to improve education
Arushi TerwayBrian DooleyAnne Smiley
Access to education and patterns of non-attendance
MOST VULNERABLE CHILDREN IN
In 2011, FHI acquired the programs, assets, and expertise of AED.

Wealth Still Matters: A Study of Wealth Differentials in Primary School Attendance from 1990-2006 in Developing Countries
EPDC Working Paper No. WP-09
Wealth Still Matters A Study of Wealth Differentials in Primary School Attendance from 1990-2006 in Developing Countries ‡
ABSTRACT Around the world, there are differentials in children’s school attendance by the wealth of the child’s household. These differentials have been increasingly documented since the 1990s. This study examines changes in attendance differentials by wealth over time from 1990-2006 for 61 developing and transitional countries, based on household surveys. The level of inequality in attendance is calculated with a Gini coefficient. The study finds that:
over the whole period there were school attendance differentials by wealth except in countries with universal attendance;
these differentials have declined over time in almost all countries.
The decline in attendance differentials by wealth is an expected (and welcomed) result of overall increases in TNAR which are associated with more inclusion of poorer children. However, there also appears to be a real decline of attendance inequality by wealth within each level of TNAR, which suggests that pro-poor global and national efforts to increase accessibility of schools are having the desired impact and/or that absolute poverty is declining and the poorer households are better able to afford to send their children to school.
The Education Policy and Data Center (EPDC), a partnership of FHI 360 and the US Agency for International Development, was founded in 2004 to contribute to better education policy making and planning through improved access to and use of data and analysis. For more information, see www.epdc.org.
‡ This report has been prepared by the Education Policy and Data Center (EPDC) from a series of studies commissioned by the GMR as background to the 2009 EFA Global Monitoring Report.
Working papers disseminated by the EPDC reflect ongoing research and have received limited review. Views or opinions expressed herein do not necessarily reflect the policy or views of FHI 360 or of any of the EPDC sponsors.
W I N T E R 2 0 0 9 1
Wealth Still Matters: A Study of Wealth Differentials in Primary School Attendance from 1990-2006 in Developing Countries
EPDC Working Paper No. WP-09
INTRODUCTION
The negative relationship between poverty and child school attendance has been well-established over the past decade. Almost all of the evidence for this link has come from household surveys. In their pioneering work, Filmer and Pritchett devised an indirect measure of wealth based on household goods that enables analysts to use household surveys to measure both wealth and school attendance. Over the years, Filmer and other authors have used this index to link household wealth with school attendance and school retention (Filmer and Pritchett 1999a; Filmer and Pritchett, 1999b; Filmer and Prichett, 2001; Filmer, 2005; Filmer, 2006; UNESCO, 2005; Ingram et al., 2006; UNESCO-OREALC, 2007; Smits et al., 2007). The more recent papers also include correlation with other household characteristics, such as region of residence, parental education, gender, ethnic background, disability, orphan status; and a few have included multivariate analysis to sort out the independent effects of each variable. These all find significant, independent effects of household wealth. The studies that include retention find that wealth differentials in education tend to increase towards higher grade levels. Two analyses show that the wealth-enrolment correlation persists at the sub-national scale (Wils, et. al., 2005; EPDC, 2007a), but neither explores whether that correlation is an artifact of the aggregated household-wealth distribution or an independent regional effect. Beyond attendance, it has become evident that learning levels, too, are correlated with household assets: for example, the second round of SACMEQ tests for 14 southern African countries shows that children of the lowest socio-economic status have lower scores than those of the highest status (SACMEQ II reports; UNESCO, 2004). The existence of wealth-attendance differentials is of clear concern for equity reasons. Without overcoming the influence of wealth on school attendance, education for all cannot be attained.
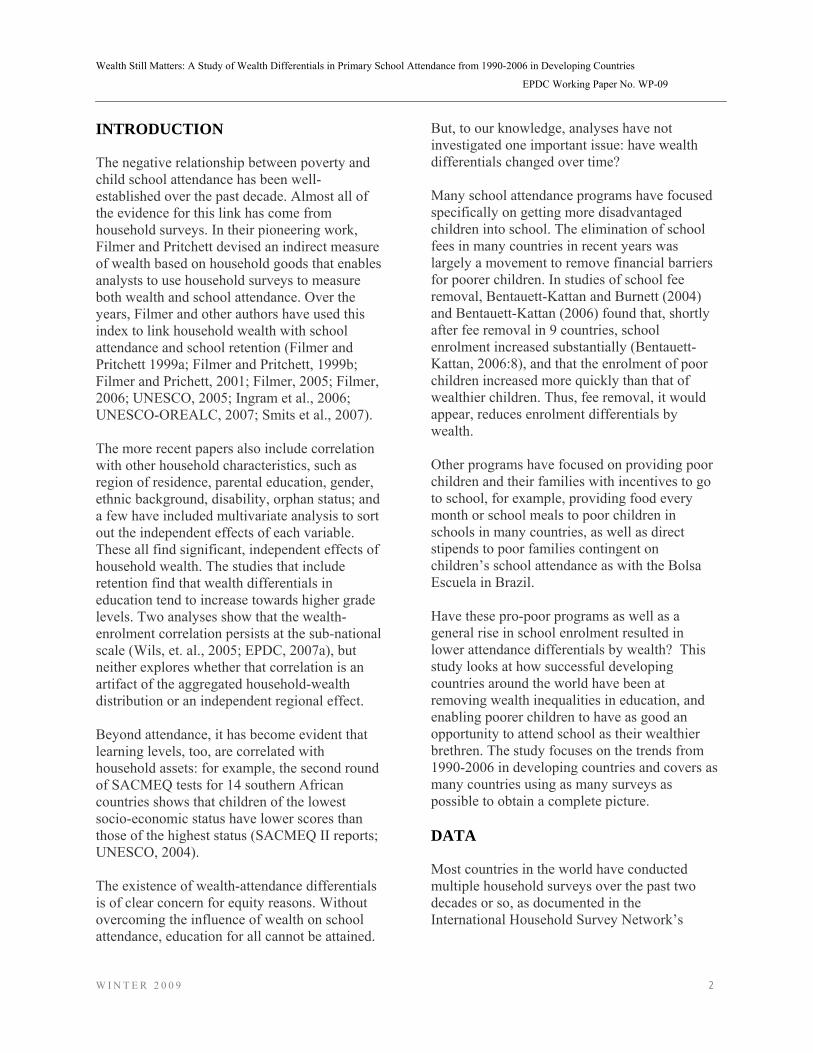
But, to our knowledge, analyses have not investigated one important issue: have wealth differentials changed over time? Many school attendance programs have focused specifically on getting more disadvantaged children into school. The elimination of school fees in many countries in recent years was largely a movement to remove financial barriers for poorer children. In studies of school fee removal, Bentauett-Kattan and Burnett (2004) and Bentauett-Kattan (2006) found that, shortly after fee removal in 9 countries, school enrolment increased substantially (Bentauett-Kattan, 2006:8), and that the enrolment of poor children increased more quickly than that of wealthier children. Thus, fee removal, it would appear, reduces enrolment differentials by wealth. Other programs have focused on providing poor children and their families with incentives to go to school, for example, providing food every month or school meals to poor children in schools in many countries, as well as direct stipends to poor families contingent on children’s school attendance as with the Bolsa Escuela in Brazil. Have these pro-poor programs as well as a general rise in school enrolment resulted in lower attendance differentials by wealth? This study looks at how successful developing countries around the world have been at removing wealth inequalities in education, and enabling poorer children to have as good an opportunity to attend school as their wealthier brethren. The study focuses on the trends from 1990-2006 in developing countries and covers as many countries using as many surveys as possible to obtain a complete picture.
DATA
Most countries in the world have conducted multiple household surveys over the past two decades or so, as documented in the International Household Survey Network’s
W I N T E R 2 0 0 9 2

Wealth Still Matters: A Study of Wealth Differentials in Primary School Attendance from 1990-2006 in Developing Countries
EPDC Working Paper No. WP-09
W I N T E R 2 0 0 9 3
online catalog2. Many, but not all of these surveys contain enough information on household assets so that wealth indices can be calculated, using the method developed by Filmer and Pritchett.
population from the United Nations population division6, and school system information from UIS. For the calculation for TNAR the following formula is used:
Between them, Filmer’s EdAttain project at the World Bank, and the EPDC have accessed over 250 household surveys from over 100 countries. They have extracted from the surveys information on school attendance, and in many cases, attendance by wealth quintile. The data is available on the World Bank EdStats and EPDC websites. The most extensive coverage in terms of countries and surveys for school attendance by wealth is for the total primary net attendance rate, and therefore this is the indicator used in this study.
∑
∑=
=
=
== agea
startageaa
a
agea
startageaa
Pop
PopAttTNAR max
max
*
where Atta is the age-specific attendance rate at age a; and Pop α is the population at age a and the start age and max age refer to the official primary school entry age and the official age at the beginning of the last grade of primary school. The start age and duration of primary school are based on year-specific information and can include changes in the number of years of primary school or the official school entry age. The UN does not provide information on the age-distribution of children by wealth. It was not within the scope of this study to extract the age-distribution of children by wealth quintiles from all of the household surveys (many of which are not available to the EPDC) so it was decided to assume that the age-distribution of children is the same in each of the five wealth quintiles. This is likely to be a reasonably close approximation.
The attendance rate data for this study were obtained either from World Bank EdAttain page or directly from the survey datasets extracted by the EPDC. There are data available from two or more surveys for 61 countries, listed in Table 1. There are 15 countries with five or more post-1990 surveys; 6 with four surveys; 19 countries with three surveys; and 21 with only two surveys. The time interval ranges from two years (Panama and Burundi) to sixteen years (Thailand); a total of 206 surveys are included. For 5 surveys, the EPDC extracted the TNAR with STATA3 and for a further 13 surveys, the TNAR rates by wealth quintile were taken from the MICS 2006 survey reports4. These surveys are noted with italics in the table. For the remaining 188 surveys, the TNAR is based on age-specific attendance rates from the World Bank EdAttain page5, single-year school age
2 The IHSN website is www.surveynetwork.org. The survey catalog is under the heading Activities. Accessed April, 2008. 3 The extraction file is available from the EPDC upon request at epdc.org. 4 The reports were found online at http://www.childinfo.org/mics/mics3/surveyreports.php, and accessed in February, 2008. Since that date it is likely that more reports have become available.
developing countries from 1989-2006. This page is also easily reached via the World Bank EdStats homepage 6 The single-year population estimates are interpolated from 5-year age groups and therefore do not necessarily reflect actual one-year age distributions of particular populations. The data was graciously provided to the EPDC by the United Nations Population Division and are an excerpt from the 2006 Population Prospects 2006 Revision (United Nations, 2007).
5 http://www.worldbank.org/research/projects/edattain/edattain.htm accessed April, 2008. This page, maintained by Deon Filmer, contains household survey-based age-specific enrolment (depending on the indicators queried in the surveys) for surveys in

Wealth Still Matters: A Study of Wealth Differentials in Primary School Attendance from 1990-2006 in Developing Countries
EPDC Working Paper No. WP-09
Table 1. List of countries and surveys for which at least two years of TNAR primary by wealth is available and which are included in this study.
Country Surveys used Country Surveys used Albania MICS 2000,WBED 2002 Madagascar DHS 1997, DHS 2003
Armenia DHS 2000, DHS 2005 Malawi DHS 1992, DHS 1996, DHS 2000, DHS 2004,WBED 2005, MICS Report 2006
Bangladesh DHS 1993, DHS 1996, DHS 1999,WBED 2000, DHS 2004, MICS Report 2006 Mali DHS 1995, DHS 2001
Benin DHS 1996, DHS 2001,WBED 2003 Mexico ENE 1994,WBED 2002
Bolivia DHS 1993, DHS 1997, MICS 2000,WBED 2002, DHS 2003 Moldova MICS 2000, DHS 2005
Brazil DHS 1996,WBED 2001 Mongolia MICS 2000, MICS Report 2005
Burkina Faso DHS 1992,WBED 1994, DHS 1999, DHS 2003 Morocco DHS 1992, DHS 2003
Burundi EQ 1998, MICS 2000 Mozambique INA 1996, DHS 1997, DHS 2003
Cambodia SES 1997, DHS 2000, SES 2004, DHS 2005 Namibia DHS 1992, DHS 2000
Cameroon DHS 1991, DHS 1998, MICS 2000,WBED 2001, DHS 2004 Nepal LSS 1996, DHS 2001, DHS 2006
CAR* DHS 1994, MICS 2000, MICS Report 2006 Nicaragua EMNV 1993, DHS 1998, DHS 2001
Chad DHS 1998, MICS 2000, DHS 2004 Niger DHS 1992, DHS 1997, MICS 2000, DHS 2006
Chile ECSN 1990,WBED 1996,WBED 2003 Nigeria DHS 1999, DHS 2003
Colombia DHS 1990, DHS 1995, DHS 2000, DHS 2005 Panama EH 1995, ENV 1997
Cote d'Ivoire DHS 1994, DHS 1998, MICS 2000,WBED 2002, DHS 2005, MICS Report 2006 Paraguay EH 1995,WBED 2001
Dominican Republic
DHS 1991, DHS 1996, DHS 1999, DHS 2000, MICS 2000, MICS Report 2006 Peru
DHS 1991,WBED 1994, DHS 1996, DHS 2000,WBED 2002, DHS 2004
Egypt, Arab Rep.
DHS 1992, DHS 1995, DHS 2000, DHS 2003, DHS 2005 Philippines DHS 1993, DHS 1998, DHS 2003
Ethiopia WMS 1995, DHS 2000, DHS 2005 Rwanda DHS 1992,WBED 1997, MICS 2000, DHS 2005
Gambia, The MICS 2000, MICS Report 2006 Senegal DHS 1992, MICS 2000, DHS 2005
Ghana LSS 1991, DHS 1993, DHS 1998, DHS 2003, MICS Report 2006 South Africa
LSDS 1993, OHS/IES 1995, DHS 1998, OHS 1999, GHS 2005
Guatemala DHS 1995, DHS 1999,WBED 2002 Tajikistan MICS 2000, MICS Report 2005
Guinea EICV 1994, DHS 1999, DHS 2005 Tanzania DHS 1991, DHS 1996, DHS 1999,WBED 2000, DHS 2004
Guyana LSMS 1992, MICS 2000, DHS 2005 Thailand SES 1990, SES 1994, SES 1998, SES 2002, MICS Report 2006
Haiti DHS 1994, DHS 2001, DHS 2005 Togo DHS 1998, MICS 2000, MICS Report 2006
Honduras EPHPM 1995, DHS 2005 Turkey DHS 1993, DHS 1998, DHS 2003
India DHS 1992, DHS 1998, DHS 2005 Uganda DHS 1995, DHS 2000, DHS 2006
Indonesia DHS 1991, SES 1993, DHS 1994, SES 1995, DHS 1997, SES 1998, SES 2002 Uzbekistan DHS 1996, MICS Report 2006
Kazakhstan DHS 1995, DHS 1999 Vietnam LSS 1992, DHS 1997, LSS 1998, MICS 2000,WBED 2001, DHS 2002
Kenya DHS 1993, DHS 1998, MICS 2000, DHS 2003 Zambia DHS 1992, DHS 1996,WBED 1998, MICS 1999, DHS 2001, LCMS 2003
Kyrgyz Republic DHS 1997, MICS Report 2006 Zimbabwe DHS 1994, DHS 1999, DHS 2005
Lesotho MICS 2000, DHS 2004
W I N T E R 2 0 0 9 4

Wealth Still Matters: A Study of Wealth Differentials in Primary School Attendance from 1990-2006 in Developing Countries
EPDC Working Paper No. WP-09
TNAR BY WEALTH QUINTILE OVER TIME
The raw results of trends of TNAR by wealth quintile over time are shown in Figure 1. These figures confirm earlier findings by Filmer and others discussed above, and show that wealth differences have existed (wherever measured) over the entire observation period 1990-2006. 1. There are consistently wealth differentials in all countries except where the attendance is complete (has reached 100%) for all wealth groups. 2. Consistently (with one or two exceptions), the poorer the quintile, the lower the attendance rates. 3. The extent of the TNAR wealth differentials is not equal across all countries. Some countries have larger TNAR wealth differentials than others7. 4. In general, the differential attendance rates of the five wealth quintile groups are spread evenly. For example, in Benin, on the first page of Figure 1, there is an even spread between the five lines. In contrast, in Burkina Faso (also on the first page of Figure 1), the wealthiest group (Q5) stands out with much higher attendance rates than in the other four wealth groups. The same is true in Ethiopia and Niger. In Turkey and Vietnam the poorest quintile stands out with markedly lower attendance rates than the wealthier four quintiles. The trend lines for some countries fluctuate, with wealth differentials changing much from
W I N T E R 2 0 0 9 5
7 Theoretically, attendance differentials by wealth must lie somewhere between two extremes: perfect exclusion and no wealth exclusion effect. If there is perfect exclusion of children by wealth quintile, then, first, all the children of Q1 (the wealthiest 20%) enter school, then the children in Q2, etcetera, and finally, the poorest 20% of children in Q5. The graph for TNAR by wealth quintile over time would look like the one on the left below, “Perfect inequality by wealth”. At the other extreme, there could be no wealth exclusion, TNAR increases over time, at each period the attendance of all the wealth groups is equal, and the graph for TNAR by wealth quintile would look like the middle graph below, “Perfect equality by wealth”. Reality lies between the two extremes. The TNAR by wealth quintile trends look like segments from the figure on the right, “Partial inequality by wealth” below. Each country lies somewhere between the two extremes, but at different points.
one survey to the next, indicating that there is a margin of uncertainty around all of the values determined by factors such as survey questionnaire design and sampling. One example of such a pattern is seen in Burkina Faso, where the wealth differentials in the 1994 Etude sur les vis de menages survey are very different from the 1992 and 1999 DHS surveys – in the 1994 survey, the attendance rates of the poorer groups are higher and TNAR of the wealthiest group is lower and, overall, the wealth differential is much smaller than in the two DHS surveys. The same type of pattern, with a narrower wealth differential (for TNAR) for a non-DHS survey appears in Benin 2003 (CWIC); Cameroon 2001 (Enquete Camerounaise aupres des menages); Cote d’Ivoire 2002 (Enquete niveau de vie des menages); Indonesia 1993 and 1995 Socio-economic surveys; Malawi 2005 (Welfare monitoring survey); Mozambique 1996 (National household survey); Peru 1994 (Enquesta nacional de hogares sobre Medicion de Niveles de Vida). The very low differentials by wealth in these surveys suggest that they are not as well-designed for disaggregating households by wealth as the DHS surveys are. Another set of fluctuations comes from the MICS 2000 surveys, of which some have relatively low TNAR values compared to surveys shortly before or after 2000 (Burundi, Central African Republic, Dominican Republic, Kenya, Senegal, and Vietnam).
Partial inequality by wealth
0
0.2
0.4
0.6
0.8
1
1
Tota
l net
atte
ndan
ce
Time
Perfect equality by wealth
0
0.2
0.4
0.6
0.8
1
1
Tota
l net
atte
ndan
ce
Q1Q2Q3Q4
Q5All TNAR
Perfect inequality by wealth
0
0.2
0.4
0.6
0.8
1Q1Q2Q3
Time1
Tota
l net
atte
ndan
ce Q4
Q5All TNAR
Time

Wealth Still Matters: A Study of Wealth Differentials in Primary School Attendance from 1990-2006 in Developing Countries
EPDC Working Paper No. WP-09
Figure 1. Total primary attendance rate over time by wealth quintile in 61 developing and transitional countries. Quintile 1 corresponds to the poorest 20% of households, and Quintile 5 corresponds to the wealthiest 20%.
W I N T E R 2 0 0 9 6

Wealth Still Matters: A Study of Wealth Differentials in Primary School Attendance from 1990-2006 in Developing Countries
EPDC Working Paper No. WP-09
Figure 1 continued.
W I N T E R 2 0 0 9 7

Wealth Still Matters: A Study of Wealth Differentials in Primary School Attendance from 1990-2006 in Developing Countries
EPDC Working Paper No. WP-09
Figure 1 continued.
W I N T E R 2 0 0 9 8

Wealth Still Matters: A Study of Wealth Differentials in Primary School Attendance from 1990-2006 in Developing Countries
EPDC Working Paper No. WP-09
Figure 1 continued.
W I N T E R 2 0 0 9 9

Wealth Still Matters: A Study of Wealth Differentials in Primary School Attendance from 1990-2006 in Developing Countries
EPDC Working Paper No. WP-09
Figure 1 continued.
W I N T E R 2 0 0 9 10

Wealth Still Matters: A Study of Wealth Differentials in Primary School Attendance from 1990-2006 in Developing Countries
EPDC Working Paper No. WP-09
Figure 1 continued.
W I N T E R 2 0 0 9 11

Wealth Still Matters: A Study of Wealth Differentials in Primary School Attendance from 1990-2006 in Developing Countries
EPDC Working Paper No. WP-09
Figure 1 continued.
W I N T E R 2 0 0 9 12

Wealth Still Matters: A Study of Wealth Differentials in Primary School Attendance from 1990-2006 in Developing Countries
EPDC Working Paper No. WP-09
W I N T E R 2 0 0 9 13
Figure 1 continued.

Wealth Still Matters: A Study of Wealth Differentials in Primary School Attendance from 1990-2006 in Developing Countries
EPDC Working Paper No. WP-09
MEASURE OF INEQUALITY – THE GINI COEFFICIENT – OVER TIME
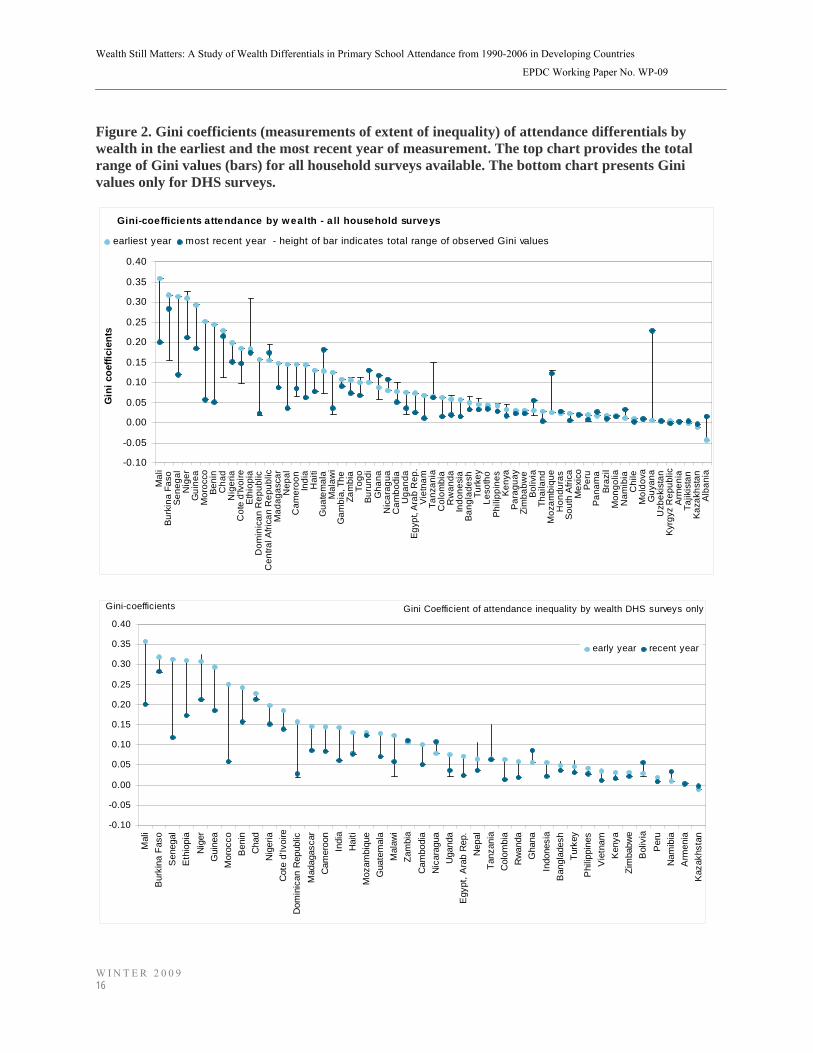
A well-known measure of the extent of inequality is the Gini coefficient8. The Gini coefficient was developed to quantify income inequality, but it has since been used in various sectors, including health (O’Donnel et al., 2008). In this study, the Gini coefficient is used to quantify the inequality of school attendance distribution across five income groups. A larger Gini coefficient implies greater inequality. In general, the Gini coefficient is a positive number, meaning the lower incomes have lower school attendance rates; in a few exceptional countries, the Gini coefficient is negative – children from poor households have slightly higher attendance rates than children from wealthy households. Annex 1 describes the calculation of the Gini coefficient for attendance by income groups. Table 2 shows the Gini coefficients for the 206 household surveys. In general, there appears to be a declining trend, not always linear. For example, in Benin, the Gini coefficients were .24 in 1996, .16 in 2001, and .05 in 2003, a clear declining trend; but in Burkina Faso, the Gini coefficients are 0.32 in 1992; .16 in 1994, and 0.28 in 1999 and 2003, a non-linear and only marginally declining trend. A clearer presentation of the trends is provided by the two charts in Figure 2. The figure shows the range of observed Gini coefficients for each country (vertical lines) and highlights the earliest and the most recent measures. Countries are arranged in declining order of the earliest Gini coefficient value – starting with countries with the greatest school attendance differentials by wealth in the earliest year. There are two charts: the top one includes all surveys, not all of which may be entirely comparable, as evidenced by the fluctuations in Figure 1; the bottom one
8 The Gini coefficient was developed by the Italian statistician Corrado Gini and published in his 1912 paper "Variability and Mutability" (Italian: Variabilità e mutabilità )
includes DHS surveys only, all of which should be reasonably, if not exactly, comparable9. Both graphs clearly show the predominance of declining wealth differentials in school attendance. In most countries, the decline of wealth differentials is substantial, in particular in Mali, Senegal, Niger, Guinea, Morocco, Benin, Dominican Republic, Nepal, and Malawi (listed in the order in which they appear on the graph). In a few countries, Burkina Faso, Chad, and Ethiopia, for example, wealth differentials have more or less remained stagnant. The graphs also show that mixing different surveys together increases the range of the Gini coefficient – to a certain extent, the wealth differentials of attendance are affected by the survey design. For example, the range of the Gini coefficients in Burkina Faso, the second country in both graphs, is large if all surveys are included, but small if only the DHS surveys are included. The outlying value comes from the 1994 Etude sur les vies de menages survey. It is 0.16 compared to 0.28-0.32 for the three DHS surveys. Regardless of whether the non-DHS surveys are included or not, the general pattern remains: declining inequality by wealth in attendance over time.
9 The DHS surveys have been modified a number of times, therefore, from one period to the next, the questionnaires and/or the sampling method are not exactly the same. However, these surveys display consistent trends, suggesting that the indicators are reasonably comparable over time.
W I N T E R 2 0 0 9 14

Wealth Still Matters: A Study of Wealth Differentials in Primary School Attendance from 1990-2006 in Developing Countries
EPDC Working Paper No. WP-09
W I N T E R 2 0 0 9 15
Table 2. Gini coefficients of school attendance differentials by wealth for 206 household surveys. G
ini
Inde
x
1990
1991
1992
1993
1994
1995
1996
1997
1998
1999
2000
2001
2002
2003
2004
2005
2006
Albania -0.04 0.02 Armenia 0 0 Bangladesh 0.04 0.04 0.06 0.06 0.04 Benin 0.24 0.16 0.06 Bolivia 0.02 0.02 0.02 0.02 0.06 Brazil 0.02 0.02 Burkina Faso 0.32 0.16 0.28 0.28 Burundi 0.1 0.14 Cambodia 0.08 0.1 0.06 0.06 Cameroon 0.14 0.12 0.1 0.06 0.08 CAR* 0.16 0.2 Chad 0.22 0.12 0.22 Chile 0 0 0 Colombia 0.06 0.04 0.02 0.02 Cote d'Ivoire 0.18 0.16 0.14 0.1 0.14 DR* 0.16 0.02 0.02 0.04 Egypt 0.08 0.08 0.04 0 0.02 Ethiopia 0.18 0.3 0.18 Gambia 0.1 0.1 Ghana 0.08 0.06 0.06 0.08 Guatemala 0.12 0.08 0.18 Guinea 0.3 0.3 0.18 Guyana 0 0 Haiti 0.14 0.12 0.16 Honduras 0.02 0.04 India 0.14 0.08 0.06 Indonesia 0.06 0.02 0.04 0.02 0.02 0.02 0.02 Kazakhstan -0.02 0 Kenya 0.04 0.02 0.04 0.02 Kyrgyz Rep. 0 0 Lesotho 0.04 0.04 Madagascar 0.14 0.08 Malawi 0.12 0.02 0.04 0.04 Mali 0.36 0.2 Mexico 0.02 0.02 Moldova 0 0.02 Morocco 0.26 0.06 Mozambique 0.02 0.14 0.12 Namibia 0.02 0.04 Nepal 0.14 0.1 0.04 Nicaragua 0.08 0.08 0.1 Niger 0.3 0.32 0.26 0.22 Nigeria 0.2 0.16 Panama 0.02 0.02 Paraguay 0.04 0.02 Peru 0.02 0 0.02 0.02 0 0 Philippines 0.04 0.04 0.02 Rwanda 0.06 0.06 0.06 0.02 Senegal 0.32 0.16 0.12 South Africa 0.02 0 0.02 0 0 Tanzania 0.06 0.08 0.14 0.06 0.06 Thailand 0.02 0.02 0 0 Togo 0.1 0.12 Turkey 0.04 0.06 Uganda 0.08 0.02 0.04 Uzbekistan 0 0 Vietnam 0.06 0.04 0.02 0.04 0.02 0.02 Zambia 0.1 0.1 0.1 0.1 0.12 0.08 Zimbabwe 0.04 0.02 0.02
Wealth Still Matters: A Study of Wealth Differentials in Primary School Attendance from 1990-2006 in Developing Countries
EPDC Working Paper No. WP-09
W I N T E R 2 0 0 9 16
Figure 2. Gini coefficients (measurements of extent of inequality) of attendance differentials by wealth in the earliest and the most recent year of measurement. The top chart provides the total range of Gini values (bars) for all household surveys available. The bottom chart presents Gini values only for DHS surveys.
Gini-coefficients attendance by wealth - a ll household surveys
-0.10
-0.05
0.00
0.05
0.10
0.15
0.20
0.25
0.30
0.35
0.40
Mal
iB
urki
na F
aso
Sen
egal
Nig
erG
uine
aM
oroc
coB
enin
Cha
dN
iger
iaC
ote
d'Iv
oire
Eth
iopi
aD
omin
ican
Rep
ublic
Cen
tral A
frica
n R
epub
licM
adag
asca
rN
epal
Cam
eroo
nIn
dia
Hai
tiG
uate
mal
aM
alaw
iG
ambi
a, T
heZa
mbi
aTo
goB
urun
diG
hana
Nic
arag
uaC
ambo
dia
Uga
nda
Egy
pt, A
rab
Rep
.V
ietn
amTa
nzan
iaC
olom
bia
Rw
anda
Indo
nesi
aB
angl
ades
hTu
rkey
Leso
tho
Phi
lippi
nes
Ken
yaP
arag
uay
Zim
babw
eB
oliv
iaTh
aila
ndM
ozam
biqu
eH
ondu
ras
Sou
th A
frica
Mex
ico
Per
uP
anam
aB
razi
lM
ongo
liaN
amib
iaC
hile
Mol
dova
Guy
ana
Uzb
ekis
tan
Kyr
gyz
Rep
ublic
Arm
enia
Tajik
ista
nK
azak
hsta
nA
lban
ia
Gin
i coe
ffici
ents
earliest year most recent year - height of bar indicates total range of observed Gini values
Gini Coefficient of attendance inequality by wealth DHS surveys only
-0.10
-0.05
0.00
0.05
0.10
0.15
0.20
0.25
0.30
0.35
0.40
Mal
iB
urki
na F
aso
Sen
egal
Eth
iopi
aN
iger
Gui
nea
Mor
occo
Ben
inC
had
Nig
eria
Cot
e d'
Ivoi
reD
omin
ican
Rep
ublic
Mad
agas
car
Cam
eroo
nIn
dia
Hai
tiM
ozam
biqu
eG
uate
mal
aM
alaw
iZa
mbi
aC
ambo
dia
Nic
arag
uaU
gand
aE
gypt
, Ara
b R
ep.
Nep
alTa
nzan
iaC
olom
bia
Rw
anda
Gha
naIn
done
sia
Ban
glad
esh
Turk
eyP
hilip
pine
sV
ietn
amK
enya
Zim
babw
eB
oliv
iaP
eru
Nam
ibia
Arm
enia
Kaz
akhs
tan
early year recent year
Gini-coefficients

Wealth Still Matters: A Study of Wealth Differentials in Primary School Attendance from 1990-2006 in Developing Countries
EPDC Working Paper No. WP-09
CORRELATION OF ATTENDANCE INEQUALITY BY WEALTH AND OVERALL ATTENDANCE RATES
During the period that the Gini coefficients declined, attendance rates increased. We would therefore expect at least some positive correlation between them, but how strong remains to be seen. The closer the correlation, the more wealth correlates with attendance rates, and, by extension, one can posit, the stronger the exclusionary effect of poverty on school attendance10. A cross-tabulation of total net attendance rates (x-axis) and the Gini coefficient of attendance differentials by wealth quintiles (y-axis) is shown in the two panels of Figure 3 with a top panel showing all surveys and the bottom DHS surveys only. The data is divided into four periods, 1990-4 (shown in red), 1995-9 (orange), and 2000-4 (green) and 2005-6 (blue). First, it is clear that there is a strong negative correlation between the TNAR and the Gini coefficients – the dots form a clear linear collection. Universally, when overall schooling is low, the poorer are relatively more excluded. Within any given level of TNAR, the Gini-coefficient ranges only by a factor of 2-3. For example, in the TNAR range of 50-55, the Gini values range from a minimum of .03 to .09; in the TNAR range of 40-45, the Gini values range from a minimum of .09 to .15. The extent of the exclusion of poorer children appears to be not only universal but relatively similar across countries for each given level of TNAR. In more recent years the correlation of wealth and school attendance has been weakened within each TNAR range. The range of Gini values within each TNAR level suggests that there are factors that make poverty a stronger exclusion factor in some countries than in others. One can also imagine 10 Keeping in mind that a correlation by itself is not a proof of causation.
that such factors might have changed over time – as the result of pro-poor education policies. A check on this hypothesis is whether the coefficients of the correlations between the TNAR overall and the Gini coefficients have changed over time. Table 3 shows the intercepts and slope coefficients of the correlations of TNAR and the Gini coefficients in four periods for all surveys and the DHS surveys only. The table shows that the intercepts have been declining over time both for all surveys and only DHS surveys, and are lowest in the 2005-6 period, with small standard error values despite the relatively small sample sizes. The slopes are flatter for each period, as the Gini coefficient tends towards zero at NAR=100% but initiating from consecutively lower starting points (the intercepts). Figure 3 shows the trend-lines through the data points of each of the four periods. Corresponding to the statistics, the correlation trend-lines for the more recent periods lies below the earlier ones. These results suggest that pro-poor programs such as those that have been implemented over the past 10 years – fee removal, stipends, feeding programs, schools specifically for poor children and so forth – have been successful, overall, at reducing the exclusion of poor children from schools, over and beyond the effects of generally rising TNAR.
W I N T E R 2 0 0 9 17

Wealth Still Matters: A Study of Wealth Differentials in Primary School Attendance from 1990-2006 in Developing Countries
EPDC Working Paper No. WP-09
Figure 3. Cross tabulation of Gini coefficients and overall TNAR for all surveys from 61 countries (top panel) and DHS surveys only in 41 countries (bottom panel) divided into four periods - 1990-4, 1995-9, 2000-4, and 2005-6 – including the correlation trend line for reach period.
-0.05
0
0.05
0.1
0.15
0.2
0.25
0.3
0.35
0.4
0.00 0.20 0.40 0.60 0.80 1.00
National TNAR
Gin
i coe
ffici
ent
1990-41995-92000-42005-6Linear (2005-6)Linear (2000-4)Linear (1995-9)Linear (1990-4)
1990-4 Gini trend
1999-9 Gini trend
2000-4 Gini trend
2005-6 Gini trend
DHS SURVEYS ONLY
W I N T E R 2 0 0 9 18
-0.1
-0.05
0
0.05
0.1
0.15
0.2
0.25
0.3
0.35
0.4
0.00 0.20 0.40 0.60 0.80 1.00
National TNAR
Gin
i coe
ffici
ent
1990-41995-92000-42005-6Linear (2000-4)Linear (1995-9)Linear (1990-4)Linear (2005-6)
ALL SURVEYS
1990-4 Gini trend
1995-9 Gini trend
2000-4 Gini trend
2005-6 Gini trend

Wealth Still Matters: A Study of Wealth Differentials in Primary School Attendance from 1990-2006 in Developing Countries
EPDC Working Paper No. WP-09
W I N T E R 2 0 0 9 19
Table 3. Intercept (i) and coefficient (c) with standard errors for the correlation of TNAR and the Gini coefficients in four periods. Statistics based on standard Excel regression function.
Period All surveys DHS only
1990-4 N=40 i=.38 (s.e.=0.02);
c=-.40 (s.e.=0.03) N=26
i=.41 (s.e.=0.03);
c=-.45 (s.e.=0.05)
1995-9 N=61 i=.36 (s.e.=0.02);
c=-.37 (s.e.=0.03) N=38
i=.42 (s.e.=0.02);
c=-.45 (s.e.=0.03)
2000-4 N=71 i=.32 (s.e.=0.02);
c=-.34 (s.e.=0.03) N=35
i=.37 (s.e.=0.02);
c=-.40 (s.e.=0.03)
2005-6 N=32 i=.30 (s.e.=0.02);
c=-.32 (s.e.=0.03) N=15
i=.33 (s.e.=0.02);
c=-.34(s.e.=0.03)
Figure 4. Cross-tabulation of TNAR and the Gini coefficients with the data for each country connected into a line. Highlighted in the figure are 9 countries with atypical trends of TNAR and Gini-coefficient correlation.
-0.05
0
0.05
0.1
0.15
0.2
0.25
0.3
0.35
0.4
0% 20% 40% 60% 80% 100%
National TNAR
Gin
i coe
ffici
ent
Niger
Chad
Haiti
Zambia
Nepal
Tanzania
Colombia
Namibia

Wealth Still Matters: A Study of Wealth Differentials in Primary School Attendance from 1990-2006 in Developing Countries
EPDC Working Paper No. WP-09
EXCEPTIONAL COUNTRIES - WHERE ATTENDANCE INEQUALITY BY WEALTH IS CHANGING MORE RAPIDLY OR MORE SLOWLY THAN EXPECTED
The cross-tabulations of Figure 3 show that, overall, there is a negative correlation between TNAR and the Gini coefficient for attendance differentials by wealth. But the figure does not show the country-specific patterns of correlation. In Figure 4, the country specific dots of Figure 3 are connected – only the DHS surveys are included to eliminate survey structure factors. The slopes of the collection of lines in this graph show the path of TNAR and the Gini coefficients over time for each country. As it turns out, for most countries, the slopes are relatively similar. But there are a few countries where the correlations of TNAR and wealth inequality of attendance are markedly different. These are highlighted in the figure. • In Chad and Zambia the Gini coefficient
remains relatively constant despite TNAR increases.
• Niger, Tanzania and Nepal had a period of increasing TNAR and growing inequalities (rising Gini coefficients) in the 1990s and a switch to declining Gini coefficients sometime in the late 1990s or early 2000s. Of these, Tanzania removed school fees in 2001, and one surmises that the turn-around of the Gini trend is related to this policy change.
• Namibia experienced rising TNAR and a rising Gini coefficient between 1992 and 2000. The most recent survey is relatively old; it is possible that Namibia would have fit with the above three countries with more recent data (a 2006 DHS survey has been conducted but the data is not yet available).
• Columbia has a declining Gini coefficient for a portion of the observation period, with fixed TNAR levels around 90%.
• Haiti experienced a decline in TNAR with constant Gini coefficients – all wealth
groups were similarly affected by the decline in attendance – and subsequently a return to the common pattern of rising TNAR and falling Gini coefficients.
W I N T E R 2 0 0 9 20

Wealth Still Matters: A Study of Wealth Differentials in Primary School Attendance from 1990-2006 in Developing Countries
EPDC Working Paper No. WP-09
REFERENCES
Byamugisha, A. and Ssenabulya, F. 2005. The SACMEQ II Project in Uganda: A Study ofthe Conditions of Schooling and the Quality of Education. Harare, SACMEQ.
Chimombo, J., Kunje, D., Chimuzu, T., and Mchikoma, C. 2005. The SACMEQ II Project in Malawi: A Study of the Conditions of Schooling and the Quality of Education. Harare, SACMEQ.
Education Policy and Data Center. 2007. School attendance and enrolment: global trends and projections. Background paper for EFA Global Monitoring Report 2008.
Filmer, D. 2005. “Gender and wealth disparities in schooling: Evidence from 44 countries.” International Journal of Educational Research, Vol. 43, pp. 351–369.
Filmer, D. 2006. Inequalities in Children's Schooling: Poverty, Gender, Orphanhood and Disability. Presentation at the Population Council. 13 December 2006
Filmer, D. and L. Pritchett. 2001. Estimating Wealth Effects Without Expenditure Data--Or Tears: An Application to Educational Enrolments in States of India Demography, Volume 38, Number 1, pp. 115-132
Filmer, D., and Pritchett, L. H. 1999a. The effect of household wealth on educational attainment: Evidence from 35 countries. Population and Development Review, Vol. 251, pp. 85–120.
Filmer, D., and Pritchett, L. H. 1999b. Determinants of education enrolment in India: Child, household, village and State effects. Journal of Educational Planning and Administration, Vol. 132, pp. 135–164.
Ingram G., A. Wils, B. Carrol, and F. Townsend. 2006. The Untapped Opportunity: How Public-Private Partnerships Can Advance
Education for All. Washington, DC., Education Policy and Data Center, FHI 360.
Kanyika, J. 2005. The SACMEQ II Project in Zambia: A Study of the Conditions of Schooling and the Quality of Education. Harare, SACMEQ.
Keitheile, M., and Mokubung, M. 2005. The SACMEQ II Project in Botswana: A Study of the Conditions of Schooling and the Quality of Education. Harare, SACMEQ.
Kulpoo, D., and Soonarane, M. 2005. The SACMEQ II Project in Mauritius: Study of the Conditions of Schooling and the Quality of Education. Harare, SACMEQ.
Leste, A., Valentin, J., and Hoareau, F. 2005. The SACMEQ II Project in Seychelles: A Study of the Conditions of Schooling and the Quality of Education. Harare, SACMEQ.
Makuwa, D. 2005. The SACMEQ II Project in Namibia: A Study of the Conditions of Schooling and the Quality of Education. Harare, SACMEQ.
Moloi, M., and Strauss, J. 2005. The SACMEQ II Project in South Africa: A Study of the Conditions of Schooling and the Quality of Education. Harare, SACMEQ.
Mothibeli, A., and Maema, M. 2005. The SACMEQ II Project in Lesotho: A Study of the Conditions of Schooling and the Quality of Education. Harare, SACMEQ.
Mrutu, A., Ponera, G., and Nkumbi, E. 2005. The SACMEQ II Project in Tanzania: A Study of the Conditions of Schooling and the Quality of Education. Harare, SACMEQ.
Nassor, S., Abdallah, M., Said Ali, O., and Salim, M. 2005. The SACMEQ II Project in Zanzibar: A Study of the Conditions of Schooling and the Quality of Education. Harare, SACMEQ.
W I N T E R 2 0 0 9 21

Wealth Still Matters: A Study of Wealth Differentials in Primary School Attendance from 1990-2006 in Developing Countries
EPDC Working Paper No. WP-09
O’Donnell, O., E. van Doorslaer, A.Wagstaff and M.Lindelow. 2008 Analyzing Health Equity Using Household Survey Data: A Guide to Techniques and Their Implementation. Washington, DC., World Bank Institute.
Onsumu, E., Nzomo, J., and Obiero, C. 2005. The SACMEQ II Project in Kenya: A Study of the Conditions of Schooling and the Quality of Education. Harare, SACMEQ.
Passos, A., Nahara, T., Magaia, F., and Lauchande, C. 2005. The SACMEQ II Project in Mozambique: A Study of the Conditions of Schooling and the Quality of Education. Harare, SACMEQ.
Shabalala, J. 2005. The SACMEQ II Project in Swaziland: A Study of the Conditions of Schooling and the Quality of Education. Harare, SACMEQ.
Shabalala, J. 2005. The SACMEQ II Project in Swaziland: A Study of the Conditions of Schooling and the Quality of Education. Harare, SACMEQ.
Smits, J., Huisman, J. and Webbink, E. 2007. Family Background, District and National Determinants of Primary School Enrolment in 62 Developing Countries. Paper presented at the XIII World Congress of Comparative Education Societies, Sarajevo, Bosnia and Herzegovina. 3–7 September 2007.
United Nations, Department of Economic and Social Affairs, Population Division. 2007. World Population Prospects: The 2006 Revision, CD-ROM Edition - Extended Dataset in Excel and ASCII formats. United Nations publication, Sales No. E.07.XIII.7
UNESCO-OREALC. 2007. The State of Education in Latin America and the Caribbean: Guaranteeing Quality Education for All. A Regional Report, Reviewing and Assessing the Progress of Latin America and the Caribbean toward Education for All within the Framework of
the Regional Education Project (EFA/PRELAC). Santiago, UNESCO Regional Bureau for Education in Latin America and the Caribbean.
UNESCO. 2005. Children Out Of School: Measuring Exclusion from Primary Education. Montreal, Quebec.
Wils, A., B. Carrol, K. Barrow. 2005. Educating the World’s Children: Patterns of Growth and Inequality. Washington, DC., Education Policy and Data Center, FHI 360.
W I N T E R 2 0 0 9 22

Wealth Still Matters: A Study of Wealth Differentials in Primary School Attendance from 1990-2006 in Developing Countries
EPDC Working Paper No. WP-09
W I N T E R 2 0 0 9 23
ABBREVIATIONS
DHS Demographic and Health Surveys ECSN Encuesta de Caracterizacion
Socioeconomica Nacional EFA Education for All EH Encuesta de Hogares EICV Enquete Integrale sur les Conditions
de Vie des Menages EMNV Encuesta Nacional de Hogares sobre
Medicion de Nivel de Vida ENE Encuesta Nacional de Empleo ENV Encuesta de Niveles de Vida EPDC Education Policy and Data Center EPHPM Encuesta Permanente de Hogares de
Propositos Multiples EQ Enquete Prioritaire GMR Global Monitoring Report IHSN International Household Survey
Network INA Inquerito Nacional aos Agregados LCMS Living Conditions Monitoring Survey LLECE Latin American Laboratory for the
Assessment of Educational Quality LSDS Living Standards Development
Survey LSMS Living Standards Measurement
Survey LSS Living Standard Survey MICS Multiple Indicator Cluster Survey OHS/IES October Household Survey/Income
and Expenditure Survey SES Socio Economic Survey TNAR Total Net Attendance Rate UIS UNESCO Institute of Statistics UNESCO United Nations Education, Science,
and Culture Organization USAID United States Agency for
International Development WBED World Bank EdAttain Project WMS Welfare Monitoring Survey
DEFINITIONS
Gini coefficient. A well-known measure of the extent of inequality, developed by an Italian statistician Corrado Gini to quantify income inequality. In this study, the Gini coefficient is used to quantify the inequality of school attendance distribution across five income groups.
Total primary net attendance rate (TNAR). All children of primary school age who said they were attending either primary or secondary school (but not pre-primary) divided by the number of children of primary age.
ACKNOWLEDGEMENT
This report has been prepared by the Education Policy and Data Center (EPDC) staff, Annababette Wils and Sarah Oliver, and reviewed by George Ingram. The first draft of this paper was prepared as one of a series of reports the EPDC provided as background for the 2009 EFA Global Monitoring Report. The EPDC team is grateful to the GMR team for excellent guidance and commentary and for the collegial spirit in which this work was conducted. However, the views presented in this report are those of the EPDC only and do not necessarily reflect those of the Global Monitoring Report or any other organization.

Wealth Still Matters: A Study of Wealth Differentials in Primary School Attendance from 1990-2006 in Developing Countries
EPDC Working Paper No. WP-09
ANNEX 1. CALCULATION OF GINI COEFFICIENT FOR SCHOOL ATTENDANCE BY WEALTH GROUPS.
To measure the trends in school attendance differentials by wealth of household, the Gini coefficients were calculated for all of the 206 surveys. Figure 5 shows an example of the attendance distribution by wealth in Burkina Faso. The curved line (known as the Lorenz curve) shows the cumulative attendance up to and including each consecutive quintile. The diagonal line shows complete equality. The Gini coefficient is twice the area between the Lorenz and the diagonal curve. This representation assumes the number of children is evenly distributed across incomes - if there are more children in poorer groups, the Gini coefficient is underestimated; vice-versa if there are more children in wealthier groups. For the majority of surveys utilized (those from the World Bank EdAttain site) the distribution is not provided and an assumed distribution was made because extracting from datasets would require resources beyond the scope of this study. However, the assumption is likely to be reasonable and the bias in the Gini coefficients will be small.
Figure 5. Example of attendance distribution by wealth from Burkina Faso 2003.
0%
100%
0% 100%Cumulative % of children
Cum
ulat
ive
% o
f pup
ils
Lorenz curve
area of Gini coefficient
W I N T E R 2 0 0 9 24

Wealth Still Matters: A Study of Wealth Differentials in Primary School Attendance from 1990-2006 in Developing Countries
EPDC Working Paper No. WP-09
W I N T E R 2 0 0 9 25
The Gini coefficient is calculated using the equations in Table 4.
Table 4. General equations used to calculate the Gini coefficient of attendance distribution by wealth of household with n wealth groups.
Wealth group
Attendance rate, aw
Percent of pupils, pw
Cumulative pupils, cw
Area under Lorenz curve, Lww
W1 a1 ∑=
= n
wwa
ap
1
11
11 pc = n
pL
21
1 =
W2 a2 ∑=
= n
wwa
ap
1
22 ∑
=
=2
12
wwpc
nc
np
L 122 2
+=
…
…
…
…
…
Wn an ∑=
= n
ww
nn
a
ap
1
∑=
=n
wwn pc
1
n
cn
pL nn
n1
2−+=
Total ∑=
n
wwL
1
Gini coefficient
∑=
−n
wwL
121