wearable sensors systems for - repositório aberto · wearable sensors systems for human motion...
TRANSCRIPT

WEARABLE SENSORS SYSTEMS FOR
HUMAN MOTION ANALYSIS
SPORTS AND REHABILITATION
ANA SOFIA MATOS SILVA
THESIS SUBMITTED IN FULFILLMENT OF THE
REQUIREMENTS FOR THE DEGREE OF DOCTOR
OF PHILOSOPHY IN BIOMEDICAL ENGINEERING
BY THE FACULTY OF ENGINEERING OF THE
UNIVERSITY OF PORTO, PORTUGAL.
SUPERVISOR: MIGUEL FERNANDO PAIVA VELHOTE CORREIA
CO-SUPERVISOR: ORLANDO JOSÉ DOS REIS FRAZÃO
FEBRUARY, 2014

© ANA SOFIA MATOS SILVA: FEBRUARY, 2014

i
ABSTRACT
Wearable technologies introduced a refinement to personal signal
capturing by permitting a long-term on-person approach. The need for precise
training regimes, continuous monitoring and quantitative analysis of movement
has taken the athletes and patients out of the laboratory to their “natural
environments”, in order to improve their performance, monitor their evolution,
mitigate the risks of injuries and preventing the adoption of improper
strategies.
The system described hereby will provide a functional instrumented
wearable device that has the potential to be used in different applications, from
sports to rehabilitation, allowing the collection of data capable of quantitatively
describe performance and movements. To do so, the system was based on a
modular approach, where several sensor modules could be assembled and used
together to extract meaningful information. In parallel, a proof-of-concept
intensity-modulated fiber optic sensor was designed and characterized with the
purpose to measure human joint angles and that could ultimately be integrated
in the wearable system.
The experiences developed in swimming have demonstrated that inertial
sensors can provide meaningful information about swimmers’ performance
through the extraction of angular displacements and temporal parameters.
Moreover, different swimming styles can be differentiated by analyzing
acceleration profiles. In the field of rehabilitation, the system was used in post-
stroke subjects in order to establish methods to analyze upper-limb
performance during the reaching task, provide quantifiers to characterize the
movement and better understand specific motor mechanisms underlined the
task, such as the postural control.
Keywords: Inertial sensors, fiber optic sensors, swimming performance
analysis, stroke rehabilitation.


iii
RESUMO
As tecnologias denominadas wearable (vestíveis) introduziram um
refinamento na monitorização pessoal, ao permitir a aquisição centrada no
indivíduo e por longos períodos de tempo. A necessidade de obter regimes de
treino precisos, de monitorizar de forma contínua e de obter uma análise
quantitativa do movimento, conduziu ao afastamento dos atletas e pacientes de
laboratórios para o seu “meio natural”, de forma a melhorar o seu desempenho,
acompanhar a sua evolução, mitigar o risco de lesões e prevenir a adoção de
estratégias de movimento desadequadas.
O sistema apresentado nesta tese é um instrumento funcional wearable
que pode ser utilizado em diversas aplicações, desde o desporto à reabilitação, e
que permite a aquisição de dados quantitativos capazes de descrever
movimentos. Para isso, foi utilizado um conceito modular que permite a
integração e combinação de diversos módulos de sensores de forma a extrair
informação relevante. Em paralelo, foi criado e construído um sensor em fibra
ótica baseado no efeito de atenuação, com o objetivo de medir ângulos corporais
e ser integrado no sistema desenvolvido.
Os resultados da utilização do sistema na natação demonstraram que os
sensores inerciais têm potencial para analisar o desempenho do nadador,
através de parâmetros cinemáticos. Para além disso, permitem distinguir entre
diferentes técnicas de nado. Em reabilitação, o sistema foi utilizado em
indivíduos que sofreram um acidente vascular encefálico de forma a estabelecer
protocolos de aquisição do movimento do membro superior durante a tarefa de
alcance, fornecer quantificadores que caracterizam o movimento e
compreender melhor os mecanismos motores específicos da tarefa, tal como o
controlo postural.
Palavras-chave: Sensores inerciais, sensores em fibra ótica, análise do
desempenho na natação, reabilitação, acidente vascular encefálico.


v
ACKNOWLEDGMENTS
The number of people directly and indirectly involved in this
investigation was very wide. Therefore, to all who had contributed with
technical and scientific knowledge and have collaborated in some way for my
personal growth, I would like to give you my gratitude.
I would like to thank the Fundação para a Ciência e Tecnologia de
Portugal for the financial support through a PhD grant
(SFRH/BD/60929/2009). In addition, I would like to thank INESC Porto
(Instituto de Engenharia de Sistemas e Computadores do Porto) and my unit
UOSE (Unidade de Optoelectrónica e Sistemas Electrónicos) not only for the
administrative support as my host institution but also for presenting me with
the spirit of union, friendship and cooperation.
A special thank to my supervisor, Prof. Miguel, and co-supervisor, Prof.
Orlando, for the guidance during the investigation. I would also like to thank
Prof. João Paulo Vilas-Boas for being always available to share his knowledge
and advices.
I must thank to all my colleagues and friends at Lab I301 who shared my
achievements and anxieties and helped me when everything seemed “stuck”.
Last, but definitely not the least, I would like to thank Hugo. Thank you
for being my best friend, for the patience to deal with my frustrations, for
making me smile and most of all for your love.


To Hugo
There are no mistakes. The events we bring upon ourselves, no matter how
unpleasant, are necessary in order to learn what we need to learn; whatever steps we
take, they're necessary to reach the places we've chosen to go.
Richard Bach
“The Bridge Across Forever: A True Love Story”


ix
CONTENTS
ABSTRACT ............................................................................................................................................. i
RESUMO ............................................................................................................................................... iii
ACKNOWLEDGEMENTS ....................................................................................................................... v
LIST OF FIGURES ..............................................................................................................................xiii
LIST OF TABLES ............................................................................................................................... xix
LIST OF ABBREVIATIONS ................................................................................................................ xxi
CHAPTER 1 INTRODUCTION ................................................................................................... 1
1.1. Motivation ..................................................................................................................... 3
1.2. Thesis Objectives ........................................................................................................ 5
1.3. Work Description ....................................................................................................... 6
1.4. Main Contributions .................................................................................................... 9
1.5. Thesis Organisation .................................................................................................12
PART I WEARABLE SENSOR SYSTEMS ................................................................................ 15
Chapter 2 MEMS-based Inertial Sensors .....................................................................21
2.1. Accelerometers and Gyroscopes ........................................................................22
2.2. Inertial Systems Concepts .....................................................................................26
2.3. Wearable Applications of Inertial Systems ....................................................32
2.4. Inertial Measurement Units: WIMU and W2M2 ...........................................36
2.4.1. WIMU – Wearable Inertial Measurement Unit ..................................36

Contents
x
2.4.2. W2M2 – Wireless Wearable Modular Monitor .................................. 48
2.5. Summary ..................................................................................................................... 59
Chapter 3 Fiber Optic Sensors......................................................................................... 61
3.1. Fiber Optic Sensor Concepts ................................................................................ 63
3.1.1. Intensity-modulated Sensors ................................................................... 66
3.1.2. Wavelength-modulated Sensors ............................................................. 73
3.1.3. Phase-modulated Sensors ......................................................................... 78
3.2. Wearable Intensity-modulated Fiber Optic Sensor .................................... 83
Experimental Procedure ................................................................................... 84
Results and Discussion ....................................................................................... 87
3.3. Summary ..................................................................................................................... 91
PART II HUMAN MOTION ANALYSIS: SPORTS AND REHABILITATION .............................. 93
Chapter 4 Swimming Performance Analysis ............................................................. 95
4.1. Wearable Systems for Swimming Analysis .................................................... 97
4.2. Swimming Analysis through WIMU ............................................................... 102
Experimental Procedure ................................................................................ 105
Results and Discussion .................................................................................... 106
4.3. Summary .................................................................................................................. 110
Chapter 5 Post-Stroke Patients Movement Analysis ........................................... 113
5.1. Rehabilitation Protocols and Procedures .................................................... 114
5.2. Upper-Limb Movement Analysis during Reaching .................................. 117
5.2.1. Inertial Measurement Units Positioning ........................................... 119
Participants.......................................................................................................... 119
Experimental Procedure ................................................................................ 121

Wearable Sensor System for Human Motion Analysis
xi
Results and Discussion .................................................................................... 122
5.2.2. Compensatory Movements Detection in Post-Stroke Subjects 126
Participants .......................................................................................................... 126
Experimental Procedure ................................................................................. 126
Results and Discussion .................................................................................... 128
5.2.3. Analysis of Postural Control during Reaching in Healthy vs. Post-
Stroke Subjects through Inertial Data ...................................................................... 135
Participants .......................................................................................................... 135
Experimental Procedure ................................................................................. 137
Results and Discussion .................................................................................... 138
5.3. Summary ................................................................................................................... 141
CHAPTER 6 DISCUSSION, CONCLUSIONS AND FUTURE WORK ........................................ 143
6.1. Overall Discussion ................................................................................................. 145
6.2. Conclusions and Future Work .......................................................................... 149
REFERENCES ...................................................................................................................... 151
APPENDIXES .............................................................................................................................. I
Appendix A: Microcontroller Embedded Code ......................................................... III
Appendix C: Matlab Script ........................................................................................... XXIII
Appendix D: Experimental Protocol Approved by Ethics Committee (in
Portuguese) ............................................................................................................................. XXV


xiii
LIST OF FIGURES
Figure 1: Thesis description: main questions and challenges that led the
investigation. ........................................................................................................................ 8
Figure 2: Thesis structure. ........................................................................................................13
Figure 3: Wearable technology applications. ....................................................................18
Figure 4: Accelerometer model. .............................................................................................22
Figure 5: Gyroscope model. ......................................................................................................23
Figure 6: Motion capture implementation steps..............................................................27
Figure 7: Strapdown inertial navigation system. (Adapted from (Titterton,
2007)) ....................................................................................................................................29
Figure 8: Coordinate transformation from navigation frame to body frame. (a)
Yaw – rotation about the z-axis; (b) Roll - rotation about the x-axis and (c)
Pitch - rotation about the y-axis. .................................................................................30
Figure 9: Commercial inertial monitoring systems: (a) Xsens and (b) Animazoo
complete suits. ...................................................................................................................33
Figure 10: Gait analysis through IMUs: (a) experimental setup with IMUs
attached to subject joints and (b) mean angles and standard deviation of
ankle (top) and knee (bottom) in sagittal plane acquired with IMUs (red)
and video-based system (blue). (Adapted from (Bergmann et al., 2010)) .34
Figure 11: (a) Top and (b) bottom view of the system. .................................................37
Figure 12: WIMU components: (a) MMA7260QT accelerometer board; (b) IDG-
300 gyroscope board and (c) eZ430-RF2500 debugging board (left) and
target board (right). .........................................................................................................38
Figure 13: WIMU architecture.................................................................................................40

List of Figures
xiv
Figure 14: Code flowchart for the Application Point (remote station). .................. 41
Figure 15: Code flowchart for the End Device (sensor node). ................................... 43
Figure 16: Global diagram of the LabVIEW’s program for managing WIMU
acquisitions. ........................................................................................................................ 44
Figure 17: LabVIEW GUI for COM Port configuration and swimmer´s personal
data insertion. .................................................................................................................... 45
Figure 18: LabVIEW GUI with real-time graphs of the captured data. ................... 46
Figure 19: Walking and return with WIMU located at (a) right front lower leg
and (b) lower back. .......................................................................................................... 47
Figure 20: Component view of W2M2. ................................................................................ 49
Figure 21: W2M2 architecture. .............................................................................................. 50
Figure 22: Experimental procedure for the six-parameter calibration. ................. 53
Figure 23: Arduino Fio microcontroller program flowchart. ..................................... 56
Figure 24: W2M2 GUI developed in Processing. .............................................................. 57
Figure 25: W2M2 inertial data of three independent reach-press-return
movement: (a) subject without pathology and (b) subject with pathology.
.................................................................................................................................................. 58
Figure 26: Paper distribution under the 22nd International Conference on Fiber
Optic Sensors according to measurands of interest. ........................................... 62
Figure 27: Total internal reflection phenomenon: (a) reflection of some light
portion; (b) no refraction (critical angle) and (c).total reflection (Adapted
from (Krohn, 2000)). ....................................................................................................... 63
Figure 28: Fiber optic sensors. (Adapted from (Krohn, 2000)) ................................ 65
Figure 29: Schematic drawing of a microbending sensor. ........................................... 67
Figure 30: Schematic of different configurations used for intensity-modulated
fiber optic sensors: (a) single loops; (b) sinusoidal, (c) U-shape and (d)
figure-of-eight shape. ...................................................................................................... 68

Wearable Sensor System for Human Motion Analysis
xv
Figure 31: Respiratory abdominal movements recorded simultaneously by two
belts, one completely elastic (Belt #1) and other semi-elastic (Belt #2),
embedding a bending sensor, at (a) 1310 nm and (b) 1550 nm. (Adapted
from (Grillet et al., 2008)) ..............................................................................................70
Figure 32: Example of a side-polished POF cable loop. (Adapted from (Lomer et
al., 2007)) .............................................................................................................................71
Figure 33: Experimental setup to validate optical sensor for gait analysis: (a)
sensor attached to knee joint and video-based system for simultaneous
acquisition; (b) optical sensors and video’s knee angle of a complete gait
cycle. (Adapted from (L. Bilro et al., 2008)) ...........................................................72
Figure 34: (a) Photo of the sensing glove and (b) experimental data acquired
during hand waving. (Adapted from (Nishiyama & Watanabe, 2009)) .......73
Figure 35: Reflected spectrum of a standard FBG sensor. ...........................................74
Figure 36: Respiratory signal captured through a FBG sensor of (a) a normal
subject in sitting position and (b) a subject turning his arms. (Adapted
from (Wehrle et al., 2001)) ...........................................................................................76
Figure 37: FBG sensing glove. (a) FGB sensor positioning; (b) Real-time
monitoring of hand posture. (Adapted from (da Silva et al., 2011)) ............78
Figure 38: Fiber optic interferometers: (a) Mach-Zehnder configuration; (b)
Michelson interferometer; (c) Fabry-Perot scheme and (d) Sagnac
interferometer. (Adapted from (Krohn, 2000)) ....................................................79
Figure 39: Interferometer sensor for monitoring breathing. Top: sensor scheme;
Bottom Left: sensor integration on a medical device; Bottom Right: phase
shifts due to breathing pattern. (Adapted from (Mathew et al., 2012)) ......81
Figure 40: Fiber optic sensor: (a) customized piece of garment with different
sensor configurations; (b) optical fiber channel detail on the fabric. ..........84
Figure 41: Relationship between curvature radius and flexion angle. ....................85
Figure 42: Schematic of sensor configurations studied: (a) single loop, (b) two
loops, (c) three loops and (d) four loops. ................................................................86

List of Figures
xvi
Figure 43: (a) Experimental setup; (b) sensor at rest position (0º) and (c) sensor
at maximum elbow flexion (60º). ............................................................................... 87
Figure 44: Light output power variation with increasing elbow flexion angle for
(a) single loop, (b) two loops, (c) three loops and (d) four loops
configurations. ................................................................................................................... 88
Figure 45: Comparison of sensor response for the four configurations studied.90
Figure 46: Biomechanical relevance in swimming analysis. ....................................... 97
Figure 47: Multi-camera experimental setup used to determine to swimmer’s
instantaneous velocity (adapted from (Barbosa, Fernandes, Morouco, &
Vilas-boas, 2008)). ........................................................................................................... 98
Figure 48: Swimming analysis using accelerometers: (a) sensor placed on
swimmer’s goggles; (b) pitch and roll angles in front crawl swimming. . 101
Figure 49: Body coordinate system. Body balance and body rotation can be
estimated from the pitch and roll angles, respectively. .................................. 104
Figure 50: WIMU positioned at the upper back of the athlete. ............................... 105
Figure 51: Acceleration in all three axes (X-axis: green; Y-axis: red; Z-axis: blue)
for two laps crawl technique. .................................................................................... 106
Figure 52: Elapsed time between each stroke for two laps. The 10th stroke
corresponds to lap end, i.e. vertical turnaround. .............................................. 107
Figure 53: Equivalent lap section acceleration signals for each performed
technique. ......................................................................................................................... 108
Figure 54: Pitch angle for one lap crawl, butterfly and breaststroke techniques.
............................................................................................................................................... 109
Figure 55: Roll angle for one lap crawl, butterfly and breaststroke techniques.
............................................................................................................................................... 110
Figure 56: Reaching sub-phases according to postural control demands. ......... 118
Figure 57: Sensor positioning under consideration. ................................................... 122

Wearable Sensor System for Human Motion Analysis
xvii
Figure 58: Accelerometry data for Subject A and B for locations P1, P2, P3, P4
and P5. ................................................................................................................................ 123
Figure 59: Sensor positioning. ............................................................................................. 128
Figure 60: Accelerometry data for subject without pathology in positions P1, P2
and P3. ................................................................................................................................ 129
Figure 61: Accelerometry data for subject A in positions P1, P2 and P3. ........... 129
Figure 62: Accelerometry data for subject B in positions P1, P2 and P3. ........... 130
Figure 63: Accelerometry data for subject C in positions P1, P2 and P3. ............ 130
Figure 64: Accelerometry data for subject D in positions P1, P2 and P3. ........... 131
Figure 65: Sensor location for the study of postural control. .................................. 138
Figure 66: Movement duration for the ipsilesional and contralesional limbs of
post-stroke subjects and for the dominant limb of healthy subjects in the
(a) shoulder plane and (b) scapula plane. ............................................................ 139
Figure 67: Pitch variation for the ipsilesional and contralesional limbs of post-
stroke subjects and for the dominant limb of healthy subjects in the (a)
shoulder plane and (b) scapula plane. ................................................................... 139
Figure 68: Roll variation for the ipsilesional and contralesional limbs of post-
stroke subjects and for the dominant limb of healthy subjects in the (a)
shoulder plane and (b) scapula plane. ................................................................... 140


xix
LIST OF TABLES
Table 1: Relevant research on wearable monitoring systems. ...................................20
Table 2: Relevant healthcare and sports applications of MEMS-based inertial
sensors. .................................................................................................................................24
Table 3: Comparison between popular accelerometers, gyroscopes and inertial
measurement units. .........................................................................................................25
Table 4: MMA7260QT accelerometer dynamic ranges. ................................................38
Table 5: Scaling factors and zero-offset values for each module’s gyroscope. .....52
Table 6: Acceleration values for each accelerometers’ channels for the six
positions. ..............................................................................................................................53
Table 7: Gains and offsets for each accelerometer in each board calculated using
the six-parameter method. ............................................................................................55
Table 8: Sensitivity, standard deviation and R-squared values for each sensor
configuration. .....................................................................................................................90
Table 9: Some relevant performance parameters extracted from accelerometry
data for crawl technique. ............................................................................................ 107
Table 10: Demographic data and clinical scores of post-stroke subjects. ........... 120
Table 11: Sensitivity descriptive analysis of movement components for sensor
locations............................................................................................................................. 125
Table 12: Demographic data and clinical scores of post-stroke patients. ........... 127
Table 13: Summary of accelerometry profiles observations. .................................. 131
Table 14: Extracted quantifiers from accelerometry profiles. ................................ 134

List of Tables
xx
Table 15: Study sample characterization. ....................................................................... 136
Table 16: Post-stroke group characterization ............................................................... 137

xxi
LIST OF ABBREVIATIONS
AMA American Medical Association
AP Application Point
ADC Analog-to-Digital Converter
BMI Body Mass Index
BSN Body Sensor Network
CNS Central Nervous System
DCM Direction Cosine Matrix
DNA Deoxyribo-Nucleic Acid
ECG Electrocardiography
ED End Device
EMG Electromyography
FAB Functional Assessment of Biomechanics
FBG Fiber Bragg Grating
FMA Fugl-Meyer Motor Assessment
FOS Fiber Optic Sensors
GUI General User Interface
IDE Integrated Development Environment

List of Abbreviations
xxii
INS Inertial Navigation System
I2C Inter-Integrated Circuit
LED Light-Emitting Diode
LMCA Left Medial Cerebral Artery
LPG Long-Period Gratings
MCA Medial Cerebral Artery
MEMS Micro-Electro-Mechanical Systems
MMSE Mini-Mental State Examination
MRI Magnetic Resonance Imaging
OLE Optical Linear Encoder
OTDR Optical Time Domain Reflectometer
PASS Postural Assessment Scale for Stroke patient
PCB Printed Circuit Board
PCF Photonic Chrystal Fiber
POF Polymer Optical Fiber
PWM Pulse-Width Modulation
RF Radio-Frequency
RMA Rivermead Motor Assessment
RMCA Right Medial Cerebral Artery
RPS Reach Performance Scale
RSSI Received Signal Strength Indicator
sEMG Surface Electromyography
SMF Single-Mode Fiber
SPI Serial Peripheral Interface

Wearable Sensor System for Human Motion Analysis
xxiii
TIA Transient Ischemic Attack
UART Universal Asynchronous Receiver Transmitter
USB Universal Serial Bus
WIMU Wearable Inertial Measurement Unit
WSN Wireless Sensor Networks
WPAN Wearable Personal Area Network
W2M2 Wireless Wearable Modular Monitor


CHAPTER 1
INTRODUCTION


Wearable Sensor System for Human Motion Analysis
3
1.1. Motivation
In the wide field of human motion analysis, several different areas share
technological devices and methods. In the realm of clinical analysis,
professionals apply their knowledge for diagnosis and planning of treatments
protocols (orthotic or prosthetic prescription, surgical intervention or
medication). In rehabilitation, therapists must address the individual’s
impairment and challenge the motor system by integrating motion analysis
strategies to develop new methods to improve rehabilitation processes. With
respect to sports, coaches and athletes use motion analysis techniques to access
biomechanical data in order to improve athletes’ performance while avoiding
injuries.
In sports, namely in swimming, numerous devices and setups have been
implemented in order to assist on performance analysis. Many of these devices
and setups are based on video capturing and analysis (Thompson, MacLaren,
Lees, & Atkinson, 2004), while others make direct measurement and signal
capturing through awkward setups and apparatus (Pendergast, Termin, &
Zaharkin, 1999), generally uncomfortable for the athletes and thus affecting
their performance. Although this scenario is very frequent for the majority of
sports, there is a relatively reduced number of signal monitoring systems being
used for swimming performance analysis today (particularly when compared to
the number of wearable monitoring devices for healthcare or even for land
based sports), a shift on the approaches for swimming analysis is being noted.
Different strategies have been applied by the mentioned systems, however a
common element seem to be their dependence on inertial sensors, such as
accelerometers and gyroscopes.
At present, in the field of human motor rehabilitation, patient movement
analysis is primarily carried out in one of two methods: in a motion laboratory,
with full analysis of the motion of body segments using optical tracking sensors,
or in a clinical appointment with the physician or physiotherapist making visual
observations. The first method is expensive, requires highly qualified technical

Chapter 1 Introduction
4
skills and expertise, involves the maintenance of a dedicated motion laboratory,
and uses cumbersome equipment attached to the patient; but it produces well-
quantified and accurate results. The second method is less expensive and does
not require special equipment, but the results are qualitative, unreliable, and
difficult to compare across multiple appointments (Dobkin, 2004; Knorr et al.,
2005).
There is a need for an alternative analysis method that is capable of
providing quantitative and repeatable results over extended time periods.
Wearable monitoring systems represent a group of technologies that
have changed the way biomechanical and physiological data are acquired,
allowing long-term on-site monitoring that do not necessarily occur within
controlled environments.
Advances in sensors, namely in the field of MEMS-based devices, allowed
for a shift in the way human motion data is captured, changing from in-lab
environments to the natural daily contexts, from short-time acquisition to long-
period monitoring. MEMS inertial sensing is a highly mature technology in
terms of both commercial viability and reliability (Rocha, 2010). Beyond the
well-known use cases in mobile devices and gaming, significantly more
challenging needs exist in the medical and industrial fields. Accelerometers and
gyroscopes became common resources to capture human movement and to
estimate kinematic parameters; however, these systems still introduce some
drawbacks, such as ergonomy, electric insulation or lack of accuracy when
estimating segments position (Esfandyari, Bendiscioli, & Xu, 2011). Commercial
inertial systems still have a niche market due to the high cost, particularly for
multiple module systems. In addition, although providing a good level of
performance in terms of accuracy, solutions provided by these commercial
systems are closed and many times do not allow for further research besides
their own.
A fairly new concept that is proving popular is the use of fiber optic
sensors (FOS) to measure body segments displacements. Besides the
advantages of small size, weight and electromagnetic immunity, fiber optic

Wearable Sensor System for Human Motion Analysis
5
sensors have high sensibility, accuracy and allow the measurement of different
variables in a single fiber (i.e. multiplexing capabilities) (Krohn, 2000).
The combination of different wearable sensors will allow the
investigation of new quantitative biomechanical models capable of describing
movement, which will aid swimmers, coaches, patients and physiotherapists
improving their performance, either by optimizing techniques and preventing
injuries or by assisting with their recovery and clinical reasoning processes.
1.2. Thesis Objectives
The main objective of this thesis is to conceive, design and develop an
electronic wearable prototype with embedded sensors for the assessment of
human motion parameters. The idea is to create a new device that overcomes
some of the limitations of current acquisition systems, presented in the section
above, and that is based on a modular approach, which allows the integration of
different sensors according to the requirements of each particular application.
Therefore, the main outcomes expected from this research will be the
integration of electrical inertial sensors, and ultimately fiber optic sensors, in a
functional wearable device and its proof-of-concept and implementation in
different applications for the analysis, classification and extraction of
meaningful kinematic parameters through proposed algorithms.
In this thesis, the applications chosen for analysis were sports and
rehabilitation since both represent major areas of interest in motion analysis,
sharing some similarities such as monitoring subject’s performance, keeping
them healthy and preventing future injuries.
In this manner, the development of the proposed wearable devices will
allow the estimation of performance and kinematic parameters that could be
used in:
swimming to characterize swimmer’s movements, allowing for
the comparison of different experience level swimmers and to
differentiate between swimming techniques; and

Chapter 1 Introduction
6
rehabilitation as an alternative tool for rehabilitation monitoring,
by giving means to quantitatively assess the upper-limb
movement of post-stroke patients and by providing timely
feedback.
1.3. Work Description
The first approach to accomplish the proposed goals was the utilization
of a MEMS-based inertial unit (usually known as IMU) for linear acceleration
and position and orientation estimation, and its integration with a transmitting
and data-logging sections. This device was named as WIMU – Wearable Inertial
Measurement Unit. With the knowledge provided during the design and
utilization of the first prototype, a new wearable device based on a modular
approach was developed, called W2M2 – Wireless Wearable Modular Monitor.
The modular feature allows the integration of different analog and digital
sensors, from touch sensors to surface electrodes. In parallel with the inertial
measurement units, a new fiber optic sensor was developed and tested, as a
proof-of-concept, for the measurement of body segments angular
displacements. The ultimate goal will be the integration and combination of
both systems, electrical and optical.
The WIMU and the W2M2 were used to monitor swimming athletes
during training and to quantify upper-limb movement of stroke patients.
Naturally several questions arise from the implementation of the system, both
in swimming and rehabilitation:
In swimming:
o Evaluate swimmers performance through kinematical
variables;
o Characterize swimmers movement;
o Differentiate between swimming techniques.

Wearable Sensor System for Human Motion Analysis
7
In rehabilitation:
o Monitor upper-limb movement of stroke patients;
o Extraction of meaningful variables to characterize the
movement;
o Identify compensatory strategies while performing functional
tasks.
The diagram presented in Figure 1 shows this thesis’ roadmap and the
main research questions that led the investigation.

Chapter 1 Introduction
8
Swimming Analysis
Are inertial sensors a good alternative for video-based systems?
Can IMUs provide a viable solution for “usable-time” quantititative analysis of swimming performance?
Can swimmer’s performance be improved using feedback from IMUs?
Wearable
Technology
Rehabilitation
Identification of compensatory strategies of stroke survivors during reaching.
Can IMUs provide quantitative indicators of stroke survivors recovery status?
Can IMUs complement current methods for stroke survivors rehabilitation?
APPLICATIONSSYSTEM
Sensor Integration
In-system integration of sensors.
Investigation of novel sensors for motion analysis.
Figure 1: Thesis description: main questions and challenges that led the investigation.

Wearable Sensor System for Human Motion Analysis
9
1.4. Main Contributions
The research work completed under this thesis yielded the following
outcomes:
Design and development of wearable inertial measurement units,
the first named as WIMU, for swimming performance analysis and
the second, based on a modular approach, designated W2M2, for
human motion analysis. The modular approach introduced
functionality and versatility, since it allowed different sensor
modules to be connected to the device and its application in
several areas from sports to rehabilitation;
Design and characterization of a novel fiber optic sensor to
measure elbow flexion. The sensing principle was based on
macrobending effect, and a customized piece of garment was
specifically designed and built to integrate the optical fiber as the
sensing element;
Method for quantification of swimming athletes’ performance
parameters, such as stroke frequency, stroke duration, number of
laps and lap-time, from accelerometry data, obtained by using the
WIMU;
Characterization of different swimming techniques from pitch and
roll angles estimation;
Method for data collection and analysis of upper-limb movement
of healthy or impaired subjects during specific functional tasks
using the W2M2;
Identification of upper-limb compensatory strategies adopted by
post-stroke patients while performing reaching functional task;

Chapter 1 Introduction
10
In addition, during the research work several outcomes were submitted
to scientific evaluation with success and published:
Journal articles:
Salazar, A. J., Silva, A. S., Silva, C., Borges, C. M., Correia, M. V., Santos, R. S., &
Vilas-Boas, J. P. (2014). Low-cost wearable data acquisition for stroke
rehabilitation: a proof of concept study on accelerometry for functional
task assessment. Topics in Stroke Rehabilitation, 21(1), 12-22.
Silva, A. S., Catarino, A., Correia, M. V., & Frazão, O. (2013). Design and
characterization of a wearable macrobending fiber optic sensor for human
joint angle determination. Optical Engineering, 52(12), 126106-126106.
Silva, A. S., Salazar, A. J., Borges, C. M., & Correia, M. V. (2013) Wearable
Monitoring Unit for Swimming Performance Analysis. Vol. 273. CCIS
Lecture Notes in Computer Science (pp. 80-93). Heidelberg: Springer.
Silva, C., Silva, A., Sousa, A., Pinheiro, R., Bourlinova, C., Silva, A. S., A. J. Salazar, C.
M. Borges, C. Crasto, M. V. Correia, J. P. Vilas-Boas & Santos, R. S. (2014).
Co-Activation Study of Upper Limb Muscles During Reaching in Post-
Stroke Subjects: an Analysis of Ipsilesional vs Contralesional Limb. Journal
of Electromyography and Kinesiology. (accepted)
Conference papers:
Silva, A. S., Casanova, O. E., Zambrano, A., Borges, C. M., & Salazar, A. J. (2012).
Experiencias en Tecnología Portable para Comunicacíon y Monitoreo
Personal de Bajo Costo. Paper presented at the IV Congreso Venezolano de
Bioingeniería (BIOVEN 2012), San Cristobal, Venezuela.
Salazar, A. J., Silva, A. S., Silva, C., Borges, C. M., Correia, M. V., Santos, R. S., &
Vilas-Boas, J. P. (2012). W2M2: Wireless wearable modular monitor. A
multifunctional monitoring system for rehabilitation. Paper presented at
the International Conference on Biomedical Electronics and Devices
(BIODEVICES2012), Vilamoura, Portugal.

Wearable Sensor System for Human Motion Analysis
11
Borges, C. M., Silva, C., Salazar, A. J., Silva, A. S., Correia, M. V., Santos, R. S., &
Vilas-Boas, J. P. (2012). Compensatory movement detection through
inertial sensor positioning for post-stroke rehabilitation. Paper presented
at the International Conference on Bio-inspired Systems and Signal
Processing (BIOSIGNALS2012), Vilamoura. Portugal.
Borges, C. M., Salazar, A. J., Silva, A. S., Bravo, R. J., & Correia, M. V. (2012).
Estudio de factibilidad del uso de acelerometría para Análisis de
Movimientos Compensatorios del Miembro Superior en Pacientes Post
ACV. Paper presented at the 8th International Seminar on Medical
Information Processing and Analysis (SIPAIM 2012), San Cristobal,
Venezuela.
Silva, A. S., Salazar, A. J., Borges, C. M., & Correia, M. V. (2011). WIMU: Wearable
Inertial Mmonitoring Unit - A MEMS-based device for swimming
performance analysis. Paper presented at the International Conference on
Biomedical Electronics and Devices (BIODEVICES 2011), Rome, Italy.
Salazar, A. J., Silva, A. S., Borges, C. M., & Correia, M. V. (2010). An initial
experience in wearable monitoring sport systems. Paper presented at the
10th IEEE International Conference on Information Technology and
Applications in Biomedicine (ITAB).
Conference abstracts:
Salazar, A. J., Silva, A. S., & Correia, M. V. (2011). Sensor characterization for
portable and wearable applications. Paper presented at the 17th edition of
the Portuguese Conference on Pattern Recognition (RecPad2011), Porto,
Portugal.
Silva, C., Borges, C. M., Salazar, A. J., Silva, A. S., Correia, M. V., & Santos, R. S.
(2011). Post-stroke patients functional task characterization through
accelerometry data for rehabilitation intervention and monitoring. Paper
presented at the 17th edition of the Portuguese Conference on Pattern
Recognition (RecPad2011), Porto, Portugal.

Chapter 1 Introduction
12
1.5. Thesis Organisation
This thesis is organised in six chapters and two main parts. After this
introductory chapter, Part I is dedicated to wearable sensor systems, with
chapters 2 and 3, and Part II, with chapters 4 and 5, focus on the applications of
wearable systems to quantitatively assess human movements. Chapter 6 closes
the thesis.
Part I – Wearable Sensor System, starting in Chapter 2, presents inertial
systems, its main concepts and the state-of-the-art on the application of these
systems as wearable devices. In addition, the design and the main features of
the wearable inertial units referred to as WIMU and W2M2 is reported. Chapter
3 will focus on fiber optic sensors. The main concepts behind fiber optic
technology and its application for wearable purposes will be discussed.
Additionally, the development and outcomes of a new intensity-modulated fiber
optic sensor for the measurement of human joint angles is presented.
Part II – Human Motion Analysis: sports and rehabilitation, initiates with
a chapter dedicated to swimming performance analysis (Chapter 4). The main
features and results obtained from WIMU are presented and discussed. Chapter
5 focus on the analysis of stroke survivor movements during the performance of
specific functional tasks. Three different studies on the analysis of upper-limb
movement during reaching, either in post-stroke and healthy subjects, are
presented.
The final chapter includes an overall discussion of the developed
wearable systems, the challenges and difficulties experienced and the main
outcomes of the application of such systems in sports and rehabilitation.
Moreover, the main conclusions, final remarks and future work provide the
closure for this thesis.
Figure 2 shows a schematic that illustrates this thesis structure. The
reader interested in technological features related with the wearable system
will find all the details in chapters 2 and 3, whether its interest is in inertial
sensors or fiber optic sensors, respectively. The reader most interested in sports

Wearable Sensor System for Human Motion Analysis
13
analysis, namely swimming performance analysis, can consult the outcomes
provided by the WIMU for the analysis of swimming techniques in Chapter 4,
while the reader concerned with post-stroke rehabilitation matters can focus on
Chapter 5 in which the results of using inertial systems to quantify upper-limb
movement performance during reaching are described.
Chapter 1 Introduction
MotivationObjectivesProject descriptionContributions
Part IWearable Sensor System
Chapter 2MEMS sensors
Chapter 3Fiber optic sensors
ConceptsState-of-the-artWIMUW2M2
ConceptsState-of-the-artIntensity FOS
Part IIHuman Motion Analysis
Chapter 4Swimming analysis
Chapter 5Rehabilitation
State-of-the-artPerformance analysis through accelerometry
State-of-the-artAnalysis of upper-limb movement of stroke survivors
Chapter 6Discussion Conclusions
Overall discussionConclusionsFuture work
Figure 2: Thesis structure.


PART I
WEARABLE SENSOR SYSTEM


Wearable Sensor System for Human Motion Analysis
17
Primarily influenced by healthcare monitoring and supported by recent
advances in microtechnologies, sensor miniaturization and smart fabrics, the
evolution on wearable systems will progressively influence the landscape of
human motion monitoring by allowing continuous evaluation of individual’s
status.
Concepts such as wearable technology and wireless sensor networks
(WSN) have become well established in the scientific community and industry
as well. Wireless sensor network, textile integrated circuitry and other
achievements have allowed for designs that require less energy and remain on-
site for longer periods of time.
Consisting of various devices and components, ranging from sensors and
actuators to multimedia devices, these systems support complex monitoring
applications and enable low-cost wearable, non-invasive alternatives for
monitoring of health, activity and mobility, both indoors and outdoors. The area
of personal monitoring is witnessing a set of paradigms shifts:
the single moment data capture is being replace by continuous
long-term data gathering: instead of a punctual
measurement/appointment, individuals’ data can be gathered for
days or weeks;
the laboratory or controlled environments is being replaced by
real-life scenarios: individuals can interact with their everyday
surroundings;
offline database analysis is being replaced by real-time analysis:
data gathering can change an individual’s performance.
Wearable technology, in general, can serve four main areas: Sports,
Healthcare, Entertainment and Science and Industry. Most of them share some

Wearable Sensor System
18
purposes, such as performance analysis, sports assistance, injury prevention or
control applications (see Figure 3).
Sports
Healthcare
Science and Industry
Entertainment
Figure 3: Wearable technology applications.
For monitoring a wide range of physiological, biomechanical and
chemical parameters, wearable systems include an extensive variety of
components, including sensors, actuators, smart fabrics, power supplies,
memory storage, wireless communication protocols and networks, processing
units, software and data algorithms for data capture and decision support. An
ideal sensor-system would be able to continuously measure, process, transmit
wirelessly to a remote station or provide immediate feedback; it would not
constrain or affect in any way and it would need few maintenance. Until now,
complete systems like these are still not a reality, since one or more than one
requirement might be absent or not fully optimized. Nevertheless, taking into
account the technological advances of the last decades it seems clear that in the
not too distant future complete systems like those will be feasible.

Wearable Sensor System for Human Motion Analysis
19
As mentioned before wearable systems are designed to be minimally
invasive and based on flexible and smart technologies conformable to the
human body. Typically, these systems may be distinguished in two different
categories: non-textile wearable systems and intelligent bio-clothing. The first
group includes wearable systems which integrate sensors (electrical, chemical,
optical, etc.) in a functional piece of garment; the second one consists of truly
smart fabrics, where the textile works itself as the sensor (Lymberis & Dittmar,
2007). Most of the research is today focused on developing textile sensors,
taking advantage of certain properties of fabrics to measure physiological
variables. Textile dry electrodes or piezoresistive fabrics are some examples of
such sensors (Chan, Estève, Fourniols, Escriba, & Campo, 2012). Currently, there
is a variety of wearable systems developed for healthcare applications. Projects
such as Wealthy (Paradiso, Belloc, Loriga, & Taccini, 2005), VTAMN (Noury et
al., 2004), MagIC (Rienzo et al., 2005), SmartVest (Pandian et al., 2008), MyHeart
(Luprano, Sola, Dasen, Koller, & Chetelat, 2006), BIOTEX (Coyle et al., 2010) and
more recently PROLIMB (Zambrano et al., 2012) are just some examples where
textile sensors were used to remotely monitor health parameters like
electrocardiography (ECG), electromyography (EMG), respiration and physical
activity. In the field of sports, some projects exist focused on developing
wearable systems to monitor athlete’s performance, such as the BIOSWIM (A. S.
Silva, Salazar, Borges, & Correia, 2012) and the ClimBSN (Pansiot, King,
McIlwraith, Lo, & Guang-Zhong, 2008). Table 1 presents the most relevant
research made in wearable systems in the last decade.
This first part of the thesis will focus on presenting the state-of-the-art
and concepts behind wearable systems, specifically those related with inertial
sensors and fiber optic sensors. Additionally, the features and outcomes of the
wearable system proposed hereby will be presented and discussed, namely the
inertial measurement units developed and the fiber optic sensor designed.

Wearable Sensor System
20
Table 1: Relevant research on wearable monitoring systems.
Project Application Purpose Sensor Elements Sensor
Location Feature
Extraction Reference
WEALTHY Physiological monitoring
Monitoring ECG and respiration during daily activities
Strain fabric sensors (piezoresistive yarns)
Torso and arms
ECG, respiration, upper-limb activity.
(Paradiso et al., 2005)
VTAMN Physiological monitoring
Ambulatory remote monitoring of physiological parameters
Fabric sensors Torso Cardiac frequency,
breathing, temperature
(Noury et al., 2004)
SmartVest Physiological monitoring
Remote monitoring of soldiers’ physiological parameters
Silicon rubber + silver
electrodes, PPG sensor, platinum thermistor, Ag-AgCl
electrodes
Torso and ear
ECG, blood pressure, heart rate, PPG,
temperature, galvanic skin
response
(Pandian et al., 2008)
PROLIMB Lower-limb monitoring
Electronic sensing for the prophylaxis of lower-limb
pathologies
Textile electrodes, 3-axis accelerometers and
gyroscopes Lower-limbs EMG, activity
(Zambrano et al., 2012)
OFSETH MRI scanning Assessment of vital parameters of
sedated patients MRI exams Silica and polymer optical
fibers; Fiber Bragg gratings Torso Respiration
(De Jonckheere et al., 2009)
MagIC Physiological monitoring
Vital signs monitoring during daily life activities
Textile electrodes, conductive fibers
Torso ECG, respiration (Rienzo et al., 2005)
BIOTEX Physiological monitoring
Health monitoring through textile technology for medical and sports
physiology
Textile sensors and electrodes, gold electrodes,
humidity sensor, pulse oximeters
Waist and chest
pH, sodium concentration,
conductivity, sweat rate, oximetry, ECG,
respiration
(Coyle et al., 2010)
BIOSWIM Swimming
analysis Wearable integrated monitorization
of swimmers’ performance
3-axis accelerometer, 2-axis gyroscope, textile electrodes,
textile pressure sensor
Torso, lower-limbs, hands
EMG, activity, heart rate, pressure
(A. S. Silva et al., 2012)
VitalJacket Physiological monitoring
Vital signs monitor for cardiology and sports
Textile electrodes and sensors, 3-axis accelerometers
Torso ECG, respiration,
activity (Cunha et al., 2010)
ClimBSN Climbing Assess climbing performance during
training 3-axis accelerometers Ears
Motion fluidity, endurance
(Pansiot et al., 2008)

Wearable Sensor System for Human Motion Analysis
21
Chapter 2
MEMS-BASED INERTIAL SENSORS
Micro-Electro-Mechanical-Systems can be defined as “mechanical devices
that have a characteristic in length of less than 1 mm but more than 1 μm,
combining electric and mechanical components” (Maluf, 2004). The name itself
establishes a dimensional scale (Micro), suggests either electricity or electronics
(Electro) and moving parts (Mechanical). The transduction mechanisms behind
these sensors have different sources: mechanical effects (piezoresistivity,
piezoelectricity, capacitive techniques), thermal effects (Seebeck, Peltier and
Thomson effects) and magnetic effects (Hall effect, magnetoresistivity) (Rocha,
2010); hence the large number of applications of such devices, ranging from inertial
to pressure and microfluidics sensors.
Micro-machined inertial sensors are a very versatile group of MEMS-based
sensors with applications in many areas. Primarily, the use of medium to high
performance inertial sensors was restricted to areas in which the cost was not a
critical aspect, such as military and aerospace systems. Nowadays, the development
of miniaturized low-power accelerometers and gyroscopes allowed the successful
application of these systems in cost-sensitive areas, from rehabilitation to sports,
entertainment and automotive industries, either in laboratory environments or
daily-life activities, sports events, interactive games, consumer electronics, etc.
The typical inertial sensors used for human tracking are accelerometers, for
linear acceleration, and gyroscopes, that measure angular velocity. The information
from those sensors can be combined and correlated in order to evaluate human
movement and/or posture.

Chapter 2 MEMS-based Inertial Sensors
22
2.1. Accelerometers and Gyroscopes
MEMS accelerometers have become an attractive tool for use in wearable
systems for detecting and measuring aspects of human movement. To extract
the acceleration value, typically the accelerometer has a movable mass which is
connected to a fixed frame via spring structures
(see Figure 4). An external acceleration will
displace the mass from its rest position. The
magnitude of this displacement is proportional
to the magnitude of the acceleration and
inversely proportional to the stiffness of the
spring structures.
The principle for converting the
displacement of the proof mass into an electrical
signal can be fulfilled by different mechanisms, such as capacitive,
piezoresistive, piezoelectric, optical or tunnelling current (Maluf, 2004). The
most commonly used and versatile operation mode is the differential capacitive
measurement. Measuring capacitance changes caused by displacement provides
a large output signal, good steady-state response, and better sensitivity due to
low noise performance. The main drawback is that capacitive sensors are
susceptible to electromagnetic fields. The principle of operation is based on two
parallel capacitor plates that are fixed while the third one in the middle moves.
This movement will increase one capacitance and will decrease the other.
Differential capacitors provide a signal that is zero at the balance point and
carries a sign which indicates the direction of motion.
Accelerometers are gravity sensitive. This means that their orientation
affects their output. If they are oriented with the active element perpendicular
to the axis of gravity, they will register the effect of gravity on the mass mounted
on the beam and so give an accelerometer reading of 9.81 m/s2 or 1 g. If the
accelerometer is rotated 90º, the axis of gravity will run parallel to the mass and
so it will not deform the beam on which it is mounted. In this case the
accelerometer will give an output reading of 0 g. The accelerometer output then
Figure 4: Accelerometer model.

Wearable Sensor System for Human Motion Analysis
23
represents the vector sum of the gravity (static) and kinematic (dynamic)
accelerations of self-movement.
Micro-machined gyroscopes usually rely on a mechanical structure that
is driven into resonance and excites a secondary oscillation in either the same
structure or in a second one, due to the Coriolis force. The amplitude of this
secondary oscillation is directly proportional to the angular rate signal to be
measured. The Coriolis force is a virtual force that depends on the inertial frame
of the observer. The effect of this force is the apparent deflection of moving
objects from a straight path when they are viewed from a rotating frame
reference (Maluf, 2004).
A model of a micro-machined gyroscope is illustrated in Figure 5. The
proof mass is excited to oscillate along the x-
axis with a constant amplitude and frequency.
Rotation about the z-axis couples energy into
an oscillation along the y-axis whose
amplitude is proportional to the rotational
velocity. Any motion along the sense axis is
measured and a force is applied to
counterbalance this sense motion. The
magnitude of the required force is then a
measure of the angular rate signal. Thus, the
Coriolis force induces a motion in a third direction, perpendicular to both the
direction of rotation and the driven motion (Lapadatu, 2009).
There are some problems concerning the fabrication of those structures.
For example, the amplitude of the Coriolis is very small which results in a small
displacement. It is also very difficult to design structures for an exact resonant
frequency, and since these structures need to be continuously excited the power
consumption is usually higher than other micro-machined devices. Also,
gyroscopes can present some drift problems, which means they do not return to
zero-rate when rotation stops. (Baluta, 2009) Nevertheless, micro-machined
gyroscopes are still one of the best commercially available solutions for angular
Figure 5: Gyroscope model.

Chapter 2 MEMS-based Inertial Sensors
24
rate measurements and combined with other inertial sensors present a viable
solution to monitor displacement rates.
These inertial sensors detect and measure motion, with minimal power
and size, and are valuable to nearly any application where movement is
involved. Table 2 outlines some of the basic pertinent healthcare and sports
applications by motion type.
Table 2: Relevant healthcare and sports applications of MEMS-based inertial sensors.
Motion Type
Acceleration/ Position
Tilt Angular
Rate/ Angle Vibration Sensor Fusion
He
alt
hca
re
CPR Assist Bed-patient Positioning
Scanning Instruments
Tremor Control
Precision Surgical
Navigation
Activity Monitors
Blood Pressure Monitors
Basic Surgical
Tools
Remote Diagnostics
Biofeedback Monitors
Imaging Equipment
Prosthetics Rehabilitation
Assistance
Gait Analysis
Sp
ort
s
Activity Monitors
Control Applications
Rate Monitors
Referee Assistance
Biofeedback
Equipment Accessories
Pedometers Performance Improvement
Injury
Prevention
Table 3 presents a comparison between some popular MEMS-based
accelerometers, gyroscopes and inertial measurement units currently used as
wearable monitoring sensors.

Wearable Sensor System for Human Motion Analysis
25
Table 3: Comparison between popular accelerometers, gyroscopes and inertial measurement units.
Manufacturer Sensing Axes
Output Type
Dynamic Range
Sensitivity Operating
Voltage Current
Consumption
Acc
ele
rom
ete
rs
MMA7361 Freescale
Semiconductor 3-axis Analog ± 1.5/6g
from 200 mV/g
2.2V – 3.6V 400 µA
BMA180 Bosch 3-axis Digital
(4-Wire, SPI, I2C)
±1/1.5/2/3/4/8/16 g
from 512 LSB/g
1.6V – 3.6V 650 µA
ADXL345 Analog Devices 3-axis Digital
(SPI, I2C) ± 2/4/8/16 g
from 256 LSB/g
1.7V – 2.75V 145 µA
Gy
rosc
op
es IDG300 InvenSense 2-axis (x,y) Analog ± 500 º/s 2 mV/º/s 3V – 3.3V Not Specified
ITG3200 InvenSense 3-axis Digital (I2C)
± 2000 º/s 14.375
LSB/º/s 2.1V – 3.6V 6.5 mA
ADXRS450 Analog Devices 3-axis Digital (SPI)
± 300 º/s 80 LSB/º/s 3V – 5.25V 6 mA
Se
nso
r F
usi
on
SCC1300 muRata 3-axis acc
3-axis gyro Digital (SPI)
± 6g ± 300 º/s
650 LSB/g 18 LSB/º/s
3V – 3.6V 10 mA
MPU9150 InvenSense 3-axis acc
3-axis gyro 3-axis compass
Digital (I2C)
±2/4/8/16g ±250/500/
1000/2000 º/s ± 1200 µT
from 2048 LSB/g
16.4 LSB/º/s 0.3 µT/LSB
2.4V – 3.6V 4 mA
ADIS16300 Analog Devices 3-axis acc
3-axis gyro Digital (SPI)
± 3g ± 300º/s
0.6 mg/LSB 0.05 º/s/LSB
4.75V – 5.3V 42 mA

Chapter 2 MEMS-based Inertial Sensors
26
2.2. Inertial Systems Concepts
While simple motion detection (linear movement along one axis, for
example) is valuable to a number of applications, such as detecting whether an
elderly person has fallen, a majority of applications involve multiple types and
multiple axes of motion. Being able to capture this complex, multi-dimensional
motion can enable new benefits while maintaining accuracy in the most critical
of environments.
In many cases, it is necessary to combine multiple sensor types – linear
and rotational, for instance – in order to precisely determine the motion an
object has experienced. As an example, accelerometers are sensitive to the
Earth’s gravity, so they can be used to determine inclination angle. As a MEMS
accelerometer is rotated through a 1 g field (90º), it is able to translate that
motion into an angle representation. However, the accelerometer cannot
distinguish static acceleration (gravity) from dynamic acceleration. In the last
case, an accelerometer can be combined with a gyroscope and post-processing
of both devices can discern the linear acceleration from the tilt, based upon
known motion dynamics models. This process of sensor fusion obviously
becomes more complex as the system dynamics (number of axes of motion,
types, and degrees of freedom of motion) also increases complexity.
The two primary challenges found in any high-performance motion
capture implementation are the conversion of raw sensor data to calibrated and
stable sensor data, and the translation of precision sensor data into actual
position/tracking information, as depicted in Figure 6. Overcoming the first
hurdle involves motion calibration, which is based on intimate knowledge of
motion dynamics. The second hurdle requires merging an understanding of
motion dynamics with a deep knowledge of the peculiarities of the application
at hand. Fortunately, many of the principles required for solving these
challenges are based on proven approaches from classical industrial navigation
problems, including sensor calibration, fusion and processing techniques.

Wearable Sensor System for Human Motion Analysis
27
Figure 6: Motion capture implementation steps.
Analysis of accelerometer and gyroscope data to determine position,
velocity and attitude, can be derived from inertial navigation systems (INS). In
an inertial navigation system the principle is to determine navigation
parameters through acceleration and velocity integrations. The first integration
provides velocity and the second gives displacement with respect to an initial
point. To determine the navigation parameters in a certain frame, the
acceleration projections on that frame must be provided. In addition,
gyroscopes are needed to reference the sensitive axes of the accelerometers
with a certain reference frame. Usually, the algorithm used to perform such
operations is called strapdown inertial navigation system and uses both
information of accelerometers and gyroscopes to estimate position and velocity
(Salychev, 2004).
A strapdown navigation system usually contains three accelerometers
and three gyroscopes (or three-axis versions of them), which measure the
projections of acceleration and angular velocity on their sensitive axes. In order
to re-calculate the above projections into the navigation frame, the direction
cosine matrix (DCM) between the body (b) and the navigation (n) frame is
needed (Titterton, 2007):
(1)

Chapter 2 MEMS-based Inertial Sensors
28
where an and ab are the acceleration projections in n-frame and b-frame,
respectively, and is a 3x3 matrix which defines the attitude of the body frame
with respect to the n-frame.
The direction cosine matrix, , may be calculated from the angular rate
measurements provided by the gyroscopes using the following differential
equation (Titterton, 2007):
(2)
where is the skew symmetric matrix (Titterton, 2007):
(3)
where is the vector which represents the angular rate of
the body as measured by the gyroscopes.
The diagram shown in Figure 7 presents the main functions to be
implemented within a strapdown inertial system. The processing of the rate
measurements to generate body attitude, the resolution of the accelerations into
the inertial reference frame, gravity compensation and the integration of the
resulting acceleration, are the steps to estimate velocity and position.

Wearable Sensor System for Human Motion Analysis
29
Figure 7: Strapdown inertial navigation system. (Adapted from (Titterton, 2007))
In order to start the computation, the initial coincidence between the
accelerometer sensitive axes and the reference frame is needed; this is called
alignment of the INS. In a strapdown INS this procedure is done to estimate the
initial value of the direction cosine matrix. DCM is usually computed through the
Euler angles. These angles are three independent quantities able of defining the
position of one coordinate frame with respect to another. Let’s coincide xn yn zn
coordinate frame with xb yb zb coordinate frame and consider three right-
handed rotations on the Euler angles (see Figure 8):
yaw (ψ), rotation about the z-axis;
roll (φ), rotation about the x-axis;
pitch (θ), rotation about the y-axis.

Chapter 2 MEMS-based Inertial Sensors
30
Figure 8: Coordinate transformation from navigation frame to body frame. (a) Yaw – rotation about the z-axis; (b) Roll - rotation about the x-axis and (c) Pitch - rotation about the y-axis.
The first rotation is made about the z-axis by angle ψ. A position vector in
the new system can be expressed in terms of the original coordinates as:
(4)
Or, in matrix form:
(5)

Wearable Sensor System for Human Motion Analysis
31
Similarly, the transformation due to second rotation, around x-axis can
be described as:
(6)
And finally, third rotation about the y-axis has a transformation in the
form:
(7)
The total transformation matrix can be defined using multiplication of C3,
C2 and C1 matrices. Thus the transformation due to all three rotations, from
navigation frame to body frame is given by:
(8)
There is no standardized definition of the Euler angles, thus if the order
of the rotations is interchanged, different direction cosine matrix is defined. So,
it is important to define right at the beginning the rotation order.
The direction cosine matrix is an orthogonal matrix, which means C-1=CT.
This is an important property since it makes easy the transformation from one
coordinate system to another and backwards (Titterton, 2007). Following the
example above, the transformation matrix from body frame to navigation frame
is given by:
(9)

Chapter 2 MEMS-based Inertial Sensors
32
After the coordinate transformation, the position and velocity of the body
can be estimated.
2.3. Wearable Applications of Inertial Systems
A very promising frontier for wearable and reliable motion capture
systems is based on inertial measurement units (IMUs) that can be used
virtually anywhere. In the last few years, the use of MEMS-based inertial sensors
has noticed an exponential growth, especially due to the perception of their
potential compared with traditional monitoring systems, such as video-based
systems, and more competitive costs. From simple accelerometers and
gyroscopes modules to complete sensor networks, IMUs have become widely
accepted for the analysis of human motion.
Commercial systems have also recently been introduced, such as Xsens
modules1, Biosyn FAB (Functional Assessment of Biomechanics)2, or the
Animazoo series3 (Figure 9). The main limitations of commercial systems are
related to the size and weight of the single module. In addition, these solutions
require a long calibration routine, which may not be possible for individuals
who have difficulty moving. Commercial systems, although providing a high
level of performance in terms of accuracy, still have only a niche market due to
the high cost, particularly for multiple module systems. Many research centers
have developed prototypes that have sought to reduce the main limitations of
commercial systems, particularly in terms of size and weight (Pansiot et al.,
2008; Zhou, Stone, Hu, & Harris, 2008). Other researchers have tried to
customize the design to specific applications by integrating, for example, the
sensors in shoes (Morris, 2004; Scapellato, Cavallo, Martelloni, & Sabatini,
2005), or by developing miniaturized solutions for specific joints (Brigante,
Abbate, Basile, Faulisi, & Sessa, 2011; Minami et al., 2010).
1 http://www.xsens.com/ 2 http://www.biosynsystems.net/ 3 http://www.animazoo.com/

Wearable Sensor System for Human Motion Analysis
33
Figure 9: Commercial inertial monitoring systems: (a) Xsens and (b) Animazoo complete suits.
In the gaming industry, the market trend is toward active gaming
platforms, where a smart wearable motion capture suite could expand the
capability of this type of game and open total virtual reality scenarios, at the
edge of the augmented reality. Efforts are being made in order to improve
inertial sensing of specific human segments, such as head pitch and roll angles
(Keir, Hann, Chase, & Chen, 2007) or hands movement (Oh et al., 2004), in a
highly dynamic environment using minimal numbers of low-cost sensors. In
parallel, improved algorithms are appearing that compensate for indoor
positioning errors, which is one of the major challenges of inertial tracking for
augmented reality applications (Esfandyari et al., 2011; Esfandyari, Mascotto, &
Xu, 2010).
In medical applications one of the major topics of interest for researches
is the use of inertial measurement units for gait analysis. Gait analysis is the
study of the biomechanics of human movement aimed at quantifying factors
governing the functionality of the lower extremities. This is crucial for the
detection of gait disorders, identification of balance factors, and assessment of
clinical gait interventions and rehabilitation programs.

Chapter 2 MEMS-based Inertial Sensors
34
Many of the existing works in the field utilize accelerometers as
inclinometers to measure knee angles. Often, the operational space is simplified,
and movements are only examined in a 2D sagittal plane (Bamberg, Benbasat,
Scarborough, Krebs, & Paradiso, 2008). For slow motions, the acceleration
contributed by the subject’s motion is assumed to be negligible compared to
gravity. Trigonometry is applied to the acceleration signal to obtain the tilt of
the accelerometer. Bergmann et al. (2010) used accelerometers in this manner
to obtain the tilt of the knee and ankle. They showed that this algorithm
produces comparable accuracy to joint angles determined by a motion capture
system (Figure 10). However, when the motion is fast, it is difficult to determine
which component of the acceleration is caused by motion, and which is caused
by gravity.
Figure 10: Gait analysis through IMUs: (a) experimental setup with IMUs attached to subject joints and (b) mean angles and standard deviation of ankle (top) and knee (bottom) in sagittal plane acquired with IMUs (red) and video-based system (blue).
(Adapted from (Bergmann et al., 2010))

Wearable Sensor System for Human Motion Analysis
35
Other researches use inertial measurement units in gait analysis to
differentiate between typical and pathological gait patterns (Lai, Begg, &
Palaniswami, 2009; Sant'Anna, Wickstro, x, & m, 2009). Clinical gait disorders
may appear from different sources, such as Parkinson’s disease (Shancang, Jue,
& Xinheng, 2010; Titterton, 2007), Huntington’s disease (Dalton et al., 2013) or
stroke (Mizuike, Ohgi, & Morita, 2009; Yang, Zhang, Novak, Brouwer, & Li,
2013), and IMUs have proven to be a good alternative to conventional video-
based systems for detecting abnormal gait parameters.
Also for healthcare purposes, tracking systems are being used in order to
build remote monitoring networks for patients and the elderly in hospitals and
in their own homes (Bae & Tomizuka, 2013). In the field of rehabilitation,
inertial measurement units can also be used as a complementary tool which can
guide physiotherapists in their clinical reasoning process. (Lin & Kulić, 2012; H.
R. Silva et al., 2007; Veluvolu & Ang, 2011; Zhou, Hu, & Tao, 2006).
In the field of sports one has noticed an increasing number of
commercially available wearable sensors that assist athletes. The most well-
known wearable sport systems are probably the heart rate monitors widely
used in many sports, either by highly-trained athletes and amateurs, such as the
Polar®4 or the Suunto®5 products. Performance analysis and enhancement has
traditionally been performed in the laboratory where the required
instrumentation is available and environmental conditions can be easily
controlled. In this environment dynamic characteristics of athletes are assessed
using treadmills, rowing and cycling machines and even flumes for swimmers.
In general these machines allow for the monitoring of athletes using
instrumentation that cannot be used in the training environment but instead
requires the athlete to remain quasi-static thus enabling a constant field of view
for optical devices and relatively constant proximity for tethered electronic
sensors, breath gas analysis, etc. Today however by taking advantage of the
advances in inertial sensors it is possible to build instrumentation that is small
4 Polar, http://www.polar.fi 5 Suunto, http://www.suunto.com

Chapter 2 MEMS-based Inertial Sensors
36
enough to be unobtrusive for a number of sporting applications (D. A. James,
Davey, & Rice, 2004).
2.4. Inertial Measurement Units: WIMU and W2M2
The first inertial measurement unit developed under this thesis was the
WIMU – Wearable Inertial Measurement Unit. This unit was firstly intended to
analyse swimmers’ performance, but its characteristics made it also suitable for
other applications rather than sports. Some of the challenges and difficulties
experienced with the WIMU led to the development of a more robust inertial
unit, called the W2M2 (Wireless Wearable Modular Monitor). This unit is based
on a modular approach, which allows the customisation of the device according
to the specifications of any particular application.
The design considerations, either hardware and software, and overall
functioning of these two inertial units will be presented and discussed in the
next sections dedicated to WIMU and W2M2.
2.4.1. WIMU – Wearable Inertial Measurement Unit
The WIMU - Wearable Inertial Measurement Unit - was designed as a
MEMS-based wearable device for assessing biomechanical parameters of a
swimming athlete. The inertial unit comprises a tri-axial accelerometer for
linear acceleration and a bi-axial gyroscope for angular velocity measurements;
managed by a microcontroller for signal acquisition and wireless transmission.
A picture of the system can be observed in Figure 11.

Wearable Sensor System for Human Motion Analysis
37
Figure 11: (a) Top and (b) bottom view of the system.
The mechanical structure of the WIMU consists of a double-sided printed
circuit board (PCB) and a battery case. The top side of the PCB comprises the
microcontroller with RF transmitter and the gyroscope board while the bottom
side contains the accelerometer evaluation board. The WIMU weights
approximately 65.6 grams and measures 57x90.5x24 mm. The data collection
was achieved at distances of up to 20 meters. Two standard alkaline AA
batteries insured the system can operate continuously during approximately
one day without any noticeable degradation in performance or signal intensity
loss.
Commercially available evaluations boards were used to integrate the
MEMS sensors into the WIMU. The accelerometer evaluation board consists of a
small setup intended for evaluating the MMA7260QT Freescale Semiconductor
accelerometer (see Figure 12 (a)), adequate for fast prototype developing
without the need of custom printed circuit boards designs. It also provides
means for understanding the best mounting position and location of this
accelerometer.

Chapter 2 MEMS-based Inertial Sensors
38
Figure 12: WIMU components: (a) MMA7260QT accelerometer board; (b) IDG-300 gyroscope board and (c) eZ430-RF2500 debugging board (left) and target board (right).
The MMA7260QT is a capacitive micromachined accelerometer with on-
chip signal conditioning, temperature compensation and g-select pins which
allow the selection of four different dynamic ranges (Table 4) ("±1.5g - 6g Three
Axis Low-g Micromachined Accelerometer ", 2008).
Table 4: MMA7260QT accelerometer dynamic ranges.
Dynamic Range Sensitivity
± 1.5 g 800 mV/g
± 2 g 600 mV/g
± 4 g 300 mV/g
± 6 g 200 mV/g
Similarly, the IDG-300 Invensense gyroscope can be found integrated in
an evaluation board (see Figure 12 (b)) along with the components necessary
for application-ready functionality. The IDG-300 gyro uses two sensor elements
with a vibrating dual-mass bulk silicon configuration that sense the rate of
rotation about the X- and Y-axis ("IDG-300 Dual-Axis Gyroscope Evaluation
Board Specification ", 2007).
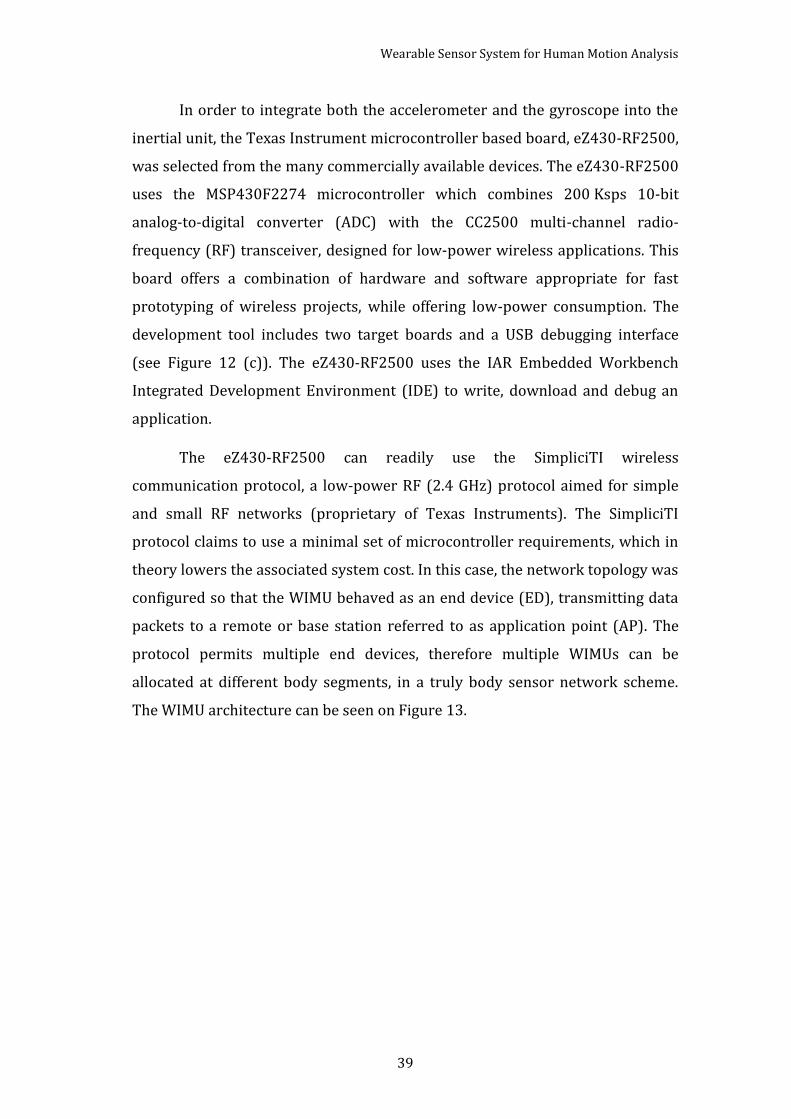
Wearable Sensor System for Human Motion Analysis
39
In order to integrate both the accelerometer and the gyroscope into the
inertial unit, the Texas Instrument microcontroller based board, eZ430-RF2500,
was selected from the many commercially available devices. The eZ430-RF2500
uses the MSP430F2274 microcontroller which combines 200 Ksps 10-bit
analog-to-digital converter (ADC) with the CC2500 multi-channel radio-
frequency (RF) transceiver, designed for low-power wireless applications. This
board offers a combination of hardware and software appropriate for fast
prototyping of wireless projects, while offering low-power consumption. The
development tool includes two target boards and a USB debugging interface
(see Figure 12 (c)). The eZ430-RF2500 uses the IAR Embedded Workbench
Integrated Development Environment (IDE) to write, download and debug an
application.
The eZ430-RF2500 can readily use the SimpliciTI wireless
communication protocol, a low-power RF (2.4 GHz) protocol aimed for simple
and small RF networks (proprietary of Texas Instruments). The SimpliciTI
protocol claims to use a minimal set of microcontroller requirements, which in
theory lowers the associated system cost. In this case, the network topology was
configured so that the WIMU behaved as an end device (ED), transmitting data
packets to a remote or base station referred to as application point (AP). The
protocol permits multiple end devices, therefore multiple WIMUs can be
allocated at different body segments, in a truly body sensor network scheme.
The WIMU architecture can be seen on Figure 13.

Chapter 2 MEMS-based Inertial Sensors
40
Figure 13: WIMU architecture.
On the WIMU side, minimal pre-processing of the gathered data occurs,
just enough to prepare the data for adequate transmission. The microcontroller
embedded code performs no complex algorithms: the acceleration and angular
velocity signals are acquired and converted sequentially by the 10-bit ADC
integrated in the MSP430F2274 micro-controller at a sampling rate of
approximately 50 Ksps. The ADC is kept in a continuous loop, converting
sequentially all sensor inputs. A simple broadcasting scheme was used for the
data gathering: the WIMU acquires and transmits while the receiver station
behaves unique as a listener. Although this strategy introduces reduced timing
errors and is not applicable for faster transmission rates or for multi-location
sensors synchronization, it proved to be effective during the experimental
acquisitions stages, providing a modest rate of approximately 7 packets/sec.
Additional data processing operations at the WIMU level were left for post-
processing analysis, in order to alleviate microcontroller resources and speed
up the communication process.

Wearable Sensor System for Human Motion Analysis
41
Figure 14 shows the flowchart of the application developed for the AP,
i.e., the remote base station. The first thing the AP does is to initialize both the
communication between the MSP430 and the CC2500 radio and the LEDs on the
board that are to be used. After initialization, a random 4-byte address is
created and written in flash memory for reuse on system reset.
Initialize Radio
Address is written on
FLASH?
Retrieve address from FLASH
Create random address and
write on FLASH
NoYes
Initialize MSP430
Initialize network
sJoinSem, sSelfMeasureSem or
sPeerFrameSem
Listen for a linksNumCurrentPeers
++Decrement sJoinSem
Read Temperature and
VoltageFormat into a msg
Transmit msg to PC
For (i=0; i < sNumCurrentPeers;
i++)
Define input msg buffer
Retrieve RSSI from sender
Msg received?
Transmit RSSI and msg to PCYes
sSelfMeasureSem
sPeerFrameSem No
i==sNumCurrentPeers
sJoinSem
Figure 14: Code flowchart for the Application Point (remote station).
The MSP430 is then initialized: the main clock is set to run at 8 MHz and
the UART (Universal Asynchronous Receiver Transmitter) is initialized to
communicate with the PC COM port with Baud Rate of 9600 bits/second. Once

Chapter 2 MEMS-based Inertial Sensors
42
the hardware is initialize, the AP enters in a while loop waiting for three
different events to occur. The events are identified by three semaphores:
sJoinSem: this semaphore is set when an ED request a network
join. This is actually a side effect of an ED initialization procedure.
On a successful link creation, the sJoinSem increases the number
of devices that the AP recognizes as part of the network;
sPeerFrameSem: this semaphore is incremented every time the AP
receives a message from an ED. In this case, the AP first defines a
message buffer to store the incoming frame and then searches for
messages until it has processed all waiting frames. The messages
are formatted containing the sensors data, the ED identification
(its address) and the Received Signal Strength Indicator (RSSI)
value, and are transmitted to the PC via COM Port;
sSelfMeasureSem: it is an AP specific semaphore that is set at a
defined time interval and executes a particular routine. This
routine uses the temperature sensor integrated in the ADC to
measure self-temperature and transmits it to the PC.
The ED (sensing node) code flowchart is depicted in Figure 15. The
initialization procedure is similar to the one AP uses. Once ED’s hardware is
initialized, a join is requested and the link to the AP is created. The ED enters
then in a loop dedicated for converting sensors data and transmits messages to
the AP. All the five sensor inputs (three accelerations, Ax, Ay and Az, and two
angular velocities, Vx and Vy) are acquired and converted sequentially. After
correct conversion an ADC flag is triggered indicating the end of conversion. The
time-stamp is then retrieved from TIMER A and all the data is ready to be
formatted into a message and to be transmitted to the AP. The complete
microcontroller code either for the AP and ED is found in Appendix A.

Wearable Sensor System for Human Motion Analysis
43
Initialize Radio
Address is written on
FLASH?
Retrieve address from FLASH
Create random address and write on
FLASH
NoYes
Initialize MSP430
Initialize network
Link to Access Point
Timer A(Real Time Clock)
Convert all analogical sensor inputs sequentially
Retrieve time-stamp
Format sensor data and time-stamp into a msg for
transmission
Transmit msg to Access Point
Conversion Completed
Figure 15: Code flowchart for the End Device (sensor node).
A custom software application for the acquisition, processing and
visualisation of the sensor packets coming from the WIMU was developed using
National Instruments´ LabVIEW platform for the computer interface. The
programing was based on a single state-machine architecture, which allows the
program to change the way it executes based on user inputs/actions and results
of the application, i.e., it responds intelligently to a stimulus. A diagram of the
global software architecture is shown in Figure 16.
The LabVIEW’s general user interfaces (GUI) for the configuration stage
and data visualisation are shown in Figure 17 and Figure 18, respectively.

Chapter 2 MEMS-based Inertial Sensors
44
START
IDLE
Configure COM Port
Configure Personal Data
Process Data
Read from File
CLOSE SESSION
Figure 16: Global diagram of the LabVIEW’s program for managing WIMU acquisitions.
The user can either start an experimental acquisition or perform an
offline analysis by reading saved data from a previous measurement. The
acquisition routine starts with COM port parameters configuration and
swimmer’s personal information retrieval (the application allows this
information to be store in a database). During the acquisition itself, the program
enters a producer/consumer loop, which enhances data sharing between loops
running at different rates. The data produced in one loop can be buffered for
posterior processing in the consumer loop by creating queues, ensuring that no
message received from the WIMU is lost during the processing stage. The
consumer loop is responsible for extracting data from the sensor packet,
convert it to a proper format and display it in real-time graphs.

Wearable Sensor System for Human Motion Analysis
45
Figure 17: LabVIEW GUI for COM Port configuration and swimmer´s personal data insertion.

Chapter 2 MEMS-based Inertial Sensors
46
Figure 18: LabVIEW GUI with real-time graphs of the captured data.

Wearable Sensor System for Human Motion Analysis
47
The WIMU was firstly intended for swimming performance analysis.
Nonetheless, due to its architecture, small size and weight it can be placed in
different parts of the human body and used for a variety of applications. Two
examples of data collected at different body segments, namely at right frontal
leg and lower-back, during walking is presented in Figure 19 (a) and (b),
respectively.
Figure 19: Walking and return with WIMU located at (a) right front lower leg and (b) lower back.

Chapter 2 MEMS-based Inertial Sensors
48
The X-axis can be considered vertical and together with the Y axis forms
the frontal plane of the subject; while the Z-axis points forward, for the lower
back location (same as for the lower leg case), with respect to the direction of
movement.. Although the data does not produce the traditional analysis graphs,
such as for gait analysis, they do provide insight in the local and global actions
and reactions of the site were the WIMU was located.
2.4.2. W2M2 – Wireless Wearable Modular Monitor
Following the initial tests and acquisitions with the WIMU, a new simple
wearable monitoring device named W2M2 – Wireless Wearable Modular
Monitoring, was design and implemented for inertial data capturing and to
overcome some of the gaps introduced by the first inertial measurement unit.
Similar to WIMU, this device was based on commercially available
components that could be assembled in a fast manner, without extensive
knowledge of electronics. The system is based on a modular approach which
means different sensor modules can be added to the main component (control
unit) according to the application specifications. By default, the W2M2 is
composed by a main control unit (MCU) with an accelerometer and different
sensor modules connected through I2C, namely an accelerometer board (Acc
Board), a combined gyroscope and accelerometer board (COMBO Board), and a
magnetometer board, as seen on Figure 20. The MCU unit weights 77 grams and
measures 9 x 5.8 x 2.3 cm; the sensor boards are encased in 5.5 x 3 x 2.5 cm
standard project boxes which weight 16 grams each.

Wearable Sensor System for Human Motion Analysis
49
Figure 20: Component view of W2M2.
The MCU’s main component, Arduino FIO6, is accessible at low-cost and
can be used with a reduced learning curve. Arduino is an open-source
electronics prototyping platform based on flexible, easy-to-use hardware and
software and proved to be an extremely powerful tool to create devices for a
numerous type of applications. The Arduino Fio is a microcontroller board
based on the ATmega328P and runs at 3.3 V and 8 MHz. It has 14 digital
input/output pins (of which 6 can be used as PWM outputs), 8 analog inputs
and reset button, among other features. It has connections for a lithium polymer
battery and includes a charge circuit over USB. The Arduino Fio is intended for
wireless applications since an XBee7 socket is available on the top of the board
and a large number of open-source resources are available to easily integrate
the wireless communication with the microcontroller. XBee devices are a series
of embedded RF modules based on ZigBee communication protocol. The
technology defined by the ZigBee specification is intended to be simpler and less
expensive than other wireless personal area networks (WPAN), such as
Bluetooth or Wi-Fi. The XBee modules operate within the 2.4 GHz frequency
band and ensure serial data rates between 1200 and 250 Kbps. A retry and
acknowledgment based approaches guarantee a reliable packet delivery. The
6 http://www.arduino.cc/ 7 http://www.digi.com/xbee/

Chapter 2 MEMS-based Inertial Sensors
50
W2M2 unit can capture data at a frequency ranging from approximately 100 Hz
to 500 Hz, depending on which modules are connected to the MCU.
For the acquisitions made under this thesis research, namely for
rehabilitation purposes, two Analog Devices ADXL345 3-axis accelerometer
break-out boards were used for acceleration detection. In addition, a combined
accelerometer (ADXL345) plus gyroscope (InvenSense ITG-3200) board and the
InvenSense MPU-6050 breakout board were used as sensing nodes. The MPU-
6050 combines a 3-axis gyroscope and a 3-axis accelerometer on the same
silicon die together with an onboard Digital Motion Processor™ capable of
processing motion fusion algorithms. In order to sense touch (to indicate start
of movement, for instance) the Freescale Semiconductor MPR121 capacitive
sensor was used. This chip can control up to twelve individual electrodes. The
complete system architecture can be seen in Figure 21.
Figure 21: W2M2 architecture.

Wearable Sensor System for Human Motion Analysis
51
The sensors on each module of the W2M2 device were properly
calibrated in order to compensate for alignment errors during the assembling
process. To avoid misinterpretations, the ADXL345 accelerometer present in the
main control unit was designated simply as MCU Board, whereas the same
sensor which was added as a module to the system was designated as Acc
Board.
The original factory calibration for the gyroscopes was taken as the
scaling factor (S) to determine angular rate from the anlog-to-digital converter
(ADC) output. In addition to this parameter, a zero-offset value was calculated
during the experiments. The scaling factor S varies between sensors and
different configurations of a single sensor, since:
rS
n2 (10)
where, n is the ADC resolution in bits and r represents the dynamic range of the
sensor.
Therefore, the angular velocity for each channel in units of degrees per
second (º/s) can be obtained using the following equation:
OS
xADC (11)
where ω is the effective angular rate, xADC and O are the ADC integer output
value and offset, respectively, and S is the sensor scaling factor.
The zero-offset parameter was estimated by reading ADC outputs in a
stationary condition. The scaling factors and offsets values for each gyroscope
board utilized in this project are presented in Table 5.

Chapter 2 MEMS-based Inertial Sensors
52
Table 5: Scaling factors and zero-offset values for each module’s gyroscope.
Scaling Factor
(S)
Zero-Offset (º/s)
x-channel y-channel z-channel
COMBO Board 131.072 -43 11 12
MPU Board 16.384 475 55 201
The factory accelerometer calibration however can become less accurate
once the accelerometer is soldered onto a circuit board, either due to
misalignments and thermal stress during soldering (Pedley, 2013). Therefore, a
recalibration procedure might be necessary to compensate for such errors.
The standard model used for calibration of a digital accelerometer
relates the calibrated accelerometer output SAcc (in units of bit counts) to the
outputs of the internal ADC using a simple linear model with a total of six
parameters, comprising new three-channel gains S’x, S’y and S’z and three zero-g
offsets O’x, O’y and O’z (Pedley, 2013):
(12)
As mentioned before, the scaling factor differs from sensor; for a
particular case of an accelerometer operating in a ±2 g full-scale with a 14-bits
resolution ADC, S = 4096.
A minimum of two-measurement orientations (in opposite directions)
for each channel, giving a total of six measured data points, are required to solve
Equation 12. A simple approach to perform the measurements is to have the
circuit boards on a structure with faces at right angles to each other and make
the six measurements with the structure aligned on its top (Position 1), bottom
(Position 2), front (Position 3), back (Position 4), left (Position 5) and right
(Position 6) faces (see Figure 22). This leads to 1 g and -1 g in each channel and
zero in the other channels, as presented in Table 6.

Wearable Sensor System for Human Motion Analysis
53
Figure 22: Experimental procedure for the six-parameter calibration.
Table 6: Acceleration values for each accelerometers’ channels for the six positions.
Position 1 2 3 4 5 6
MC
U
Bo
ard
X 0 0 0 0 +1 g -1 g
Y 0 0 +1 g -1 g 0 0
Z -1 g +1 g 0 0 0 0
Acc
Bo
ard
X 0 0 0 0 -1 g +1 g
Y 0 0 -1 g +1 g 0 0
Z -1 g +1 g 0 0 0 0
CO
MB
O
Bo
ard
X 0 0 0 0 +1 g -1 g
Y 0 0 -1 g +1 g 0 0
Z +1 g -1 g 0 0 0 0
MP
U6
05
0
Bo
ard
X 0 0 -1 g +1 g 0 0
Y 0 0 0 0 +1 g -1 g
Z +1 g -1 g 0 0 0 0

Chapter 2 MEMS-based Inertial Sensors
54
For the case of the x-channel, if is the first measurement when
aligned for +1 g and is the second measurement when aligned for -1 g,
then Equation 12 gives:
(13)
Solving the above equations, the gain and offset for x-channel can be
easily obtained:
(14)
The y and z-channel calibration parameters are similarly given as:
(15)
(16)
These six-parameter computed with this method can then be applied to
the accelerometer output using Equation 12.
This calibration method was applied for each accelerometer on each
board utilized during the experimental acquisitions. The correspondent gains
and offsets for each board’s accelerometers are presented in Table 7.

Wearable Sensor System for Human Motion Analysis
55
Table 7: Gains and offsets for each accelerometer in each board calculated using the six-parameter method.
Gain, S’ Offset, O’ (bits)
x-channel y-channel z-channel x-channel y-channel z-channel
MCU Board
-29.037 -28.621 -1.018 -3590.203 -3664.015 -3.253
Acc Board -0.979 -0.968 -1.019 12.691 0.476 -4.887
COMBO Board
-0.981 -0.976 -1.001 1.103 -0.762 -8.767
MPU6050 Board
-1.000 -0.994 0.985 107.742 377.565 516.155
The microcontroller on the Arduino Fio board (MCU board) was
programmed using the Arduino programming language (based on Wiring8). The
control unit is responsible for initializing all modules and communications.
Afterwards, the microcontroller enters in an idle mode where it waits for user
commands. There are four commands available:
Start Acquisition: this command initiates data sending, by reading
all sensor outputs and format sensor packet to be wirelessly
transmitted;
Stop Acquisition: the program interrupts data sending and returns
to idle mode;
Data Format Raw: the data from sensor outputs is kept in units
per bits count;
Data Format Scaled: data from sensors outputs is converted to
proper units according to the measure being read.
The Arduino Fio code flowchart is depicted in Figure 23. The complete
microcontroller code is found in Appendix A.
8 http://wiring.org.co/

Chapter 2 MEMS-based Inertial Sensors
56
Start
Initialize SPI communications
Configure MCU Accelerometer
Initialize I2C communications
Wait for user’s command
Check which sensor boards are
connect and configure them Start Acquisition
Data Format Raw
Data Format Scaled
Stop Acquisition
3
2
4
1Check touch
sensorsRead sensor
outputsRetrieve
time-stampTransmit
msg to XBee
Read raw data from sensor
Perform scaling operations
Figure 23: Arduino Fio microcontroller program flowchart.
To handle data coming from the W2M2 a simple and easy-to-use GUI was
developed in Processing9. Processing is an open-source programming language
and integrated development environment (IDE) built for the electronic arts and
visual design communities. It uses simplified syntax and graphics programming
model, and it has more than one hundred libraries. As mentioned before, the
concept behind the W2M2 was to make a functional device where no relevant
expertise in electronics and programming is necessary in order to use it and
perform acquisitions. This feature is crucial given the potential users of such
device, i.e., physicians, patients, athletes or coaches. The user interface
developed using Processing was created in line with this principle.
9 http://processing.org
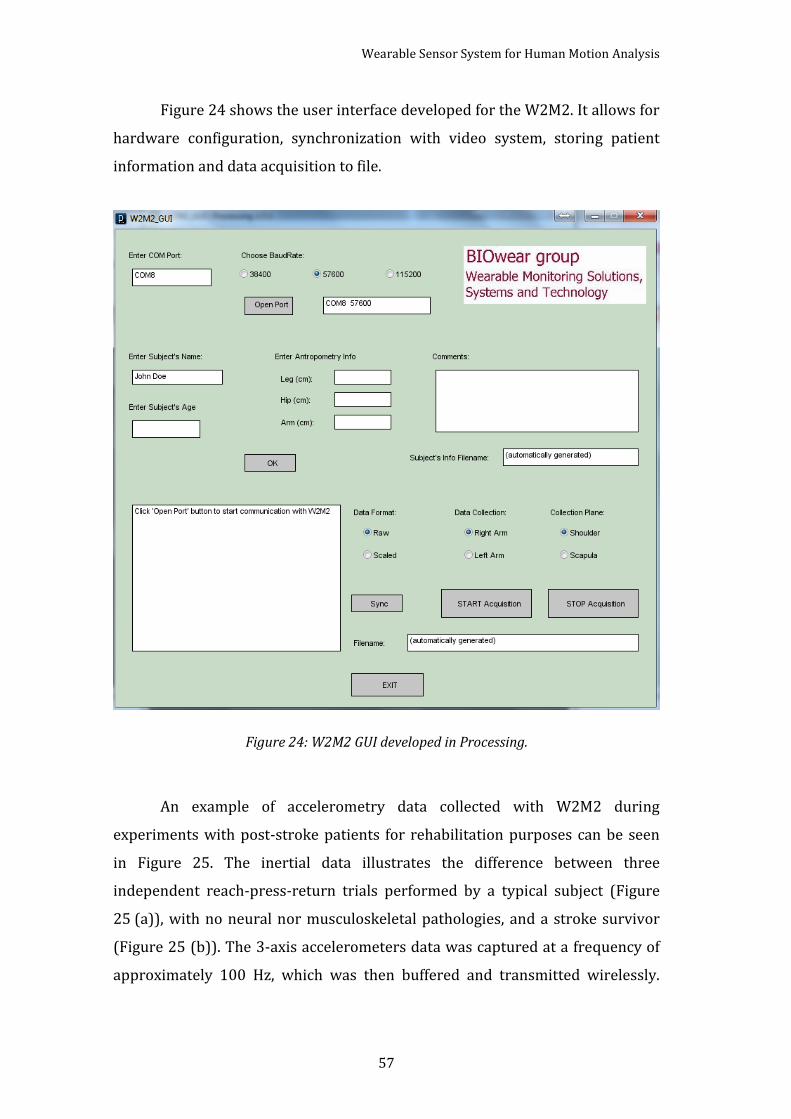
Wearable Sensor System for Human Motion Analysis
57
Figure 24 shows the user interface developed for the W2M2. It allows for
hardware configuration, synchronization with video system, storing patient
information and data acquisition to file.
Figure 24: W2M2 GUI developed in Processing.
An example of accelerometry data collected with W2M2 during
experiments with post-stroke patients for rehabilitation purposes can be seen
in Figure 25. The inertial data illustrates the difference between three
independent reach-press-return trials performed by a typical subject (Figure
25 (a)), with no neural nor musculoskeletal pathologies, and a stroke survivor
(Figure 25 (b)). The 3-axis accelerometers data was captured at a frequency of
approximately 100 Hz, which was then buffered and transmitted wirelessly.

Chapter 2 MEMS-based Inertial Sensors
58
After package format verification, the data was processed in Matlab10 by
applying a simple moving average smoothing filter.
Figure 25: W2M2 inertial data of three independent reach-press-return movement: (a) subject without pathology and (b) subject with pathology.
10 http://www.mathworks.com/

Wearable Sensor System for Human Motion Analysis
59
Looking at these figures, clear differences are observed between
movement path of typical vs. post-stroke individuals, namely the smoothness
and the consistency of the reach and return movements.
2.5. Summary
Recent advances in MEMS-based sensors, such as miniaturization and
power consumption, have allowed their presence in today’s wearable solutions.
Accelerometers and gyroscopes dominate the movement/position category and
are becoming each day more accessible for numerous research opportunities.
The first inertial prototype developed under this thesis was called WIMU,
and was primarily intended for swimming performance analysis. It comprised
an accelerometer and a gyroscope as sensing elements, a microcontroller for
data packaging and wireless transmission. The experimental tests made with
this system revealed some drawbacks: it provided a low packet transmission
rate, did not allowed for sensor expansion and integration with other
acquisition systems and lacked of memory storage for measurements in which
wireless transmission could not be possible.
The W2M2 was based on a modular approach, where several sensor
modules can be assembled and used together to extract meaningful information
according to the application requirements. Instead of a complex sensor system,
the key aspect of this system was to combine functionality and usability in a
simple wearable solution. Along with simplicity comes small size and weight,
which are crucial features when referring to wearable technology and sensor
integration.
The biggest improvement of W2M2 with respect to WIMU was the
concept of modular device: multiple modules, connected through digital
communication (although analog connection could be also possible), which
could be linked to the processing unit, transforming the device into a multi-
purpose monitoring system. The W2M2 allows the interconnection of
accelerometer, magnetometer and gyroscope boards, electrodes for surface

Chapter 2 MEMS-based Inertial Sensors
60
electromyography (sEMG) and also On/Off sensor; nonetheless the use of
standard communication protocols such as I2C and SPI allow interconnecting to
a wide variety of commercially available sensors which may be added to
address particular purposes. In addition, data transmission rate was
significantly improved, from roughly 10 packets/s with the WIMU device to a
maximum of 500 packets/s with the W2M2.

Wearable Sensor System for Human Motion Analysis
61
Chapter 3
FIBER OPTIC SENSORS
Fiber optic technology emerged in the 60s with the description of an
optical waveguide fiber (Snitzer, 1961) and was later boosted by the demands
on optical communications. Since then, a rapid evolution on optical devices and
fibers technology has been noticed, especially concerning fiber fusion splicing
devices, fiber coupling and intensity losses measuring equipments, such as the
Optical Time Domain Reflectomer (OTDR) (Frazao, 2009). In parallel, an
increasing interest on using optical fibers in different areas rather than
communications has triggered the fiber optic sensor technology. The initial idea
of using these fibers only for communication purposes was replaced by the
perception that the optical fiber could also be used as a sensing element to
monitor several physical and chemical quantities. Later, the concept of using
fibers as both sensing element and communication channel has demonstrated
the huge potential of fiber optic sensors which made them a strong competitor
among sensors technology. Even so, fiber optic sensors (FOS) still remain apart
from most engineers and researches, perhaps due to the more conventional use
of non-optical (mostly electrical) technologies and also given the limited
number of available turn-key solutions.
FOS represent a technology base that can be applied to a multitude of
sensing applications, since most physical properties can be sensed optically
with fibers. Light intensity, displacement, temperature, pressure, strain or flow
are just some of the phenomena that can be measured (Krohn, 2000).
Nowadays, technology can challenge traditional sensors in a large number of
innovative applications. Figure 26 shows the distribution of papers presented at
the 22nd International Conference on Optical Fiber Sensors in 2012 according to

Chapter 3 Fiber Optic Sensors
62
measurands of interest. This conference is a major event in the field of fiber
optic sensors. The most highly reported developments are found in the field of
chemical and gas sensors, followed by strain and temperature optical fiber
sensors. Biosensors have suffered a substantial growth compared with past
conferences (from 2.4% to 12.63%) (Lee, 2003).
Figure 26: Paper distribution under the 22nd International Conference on Fiber Optic Sensors (2012) according to measurands of interest.
A huge number of fiber optic sensors for biomedical applications has
been reported in the last years. The most referenced optical sensing devices are
for biomechanical, biological and physiological measurands. In the field of
biomechanics, FOS based on different sensing principles are described to
measure force and pressure (Roriz, Frazão, Lobo-Ribeiro, Santos, & Simões,
2013), as well as to monitor different joint angle (Kwang Yong et al., 2008). For
biological purposes, several optical devices have been developed to target cells
and proteins (Velasco-Garcia, 2009), identify DNA (Deoxyribo-Nucleic Acid)
markers (Leung, Shankar, & Mutharasan, 2007) or to measure
humidity/moisture (Yeo, Sun, & Grattan, 2008). In addition, physiological

Wearable Sensor System for Human Motion Analysis
63
parameters such as temperature, pH (Shao, Yin, Tam, & Albert, 2012) or heart
beat (Kreber, 2013) can be sensed with fiber optic devices.
3.1. Fiber Optic Sensor Concepts
Light propagation inside fibers is due to the phenomenon of total internal
reflection. It is common sense that refraction occurs when light passes from one
homogeneous medium to another, according to the Snell’s Law:
2211 sinsin nn (17)
where n1 and n2 are the refractive indices of the two mediums and θ1 and θ2 are
the angles of the incident and refractive light rays, respectively.
Therefore, when the light passes from a high-index of refraction medium
to a lower-index medium, a certain portion of the incident light is reflected
(Figure 27 (a)). If the incident ray hits the boundary with an angle equal to the
angle between the refracted ray and the normal to the interface, no refraction
will occur (Figure 27 (b)). This angle is known as the critical angle. Incident ray
with angles greater than the critical angle will be entirely reflected at the
interface and no refraction takes place (Figure 27 (c)). This is the total internal
reflection phenomenon.
Figure 27: Total internal reflection phenomenon: (a) reflection of some light portion; (b) no refraction (critical angle) and (c).total reflection (Adapted from (Krohn, 2000)).

Chapter 3 Fiber Optic Sensors
64
Traditionally, optical fibers have been used for telecommunications, due
to their intrinsic properties of integrity (low attenuation when compared with
electrical cables) and transmission rate. Now, their use has been spreading and
optical fibers are more often being reported by their sensing capabilities.
Some of the advantages of fiber optics that make their use attractive as
sensors are: small size and weight; no electrical hazard; remotable; easy to
install; immune to radio-frequency interference and electromagnetic
interference; high accuracy; high sensitivity; multiplexing capabilities (Krohn,
2000).
The simplest partition of optical sensors is into so called intrinsic devices,
where the interaction occurs actually within an element of the optical fiber
itself, and extrinsic devices, where the optical fiber is used to couple light,
usually to and from the region where the light beam is influenced by the
quantity being measured (Z. Zhang & Grattan, 1998).
Traditionally, fiber optic sensors can be divided into three basic
categories (Davis, 1995): intensity-modulated, phase-modulated and wavelength-
modulated sensors. Figure 28 shows three different examples of such sensors.
Intensity-modulated sensors are generally associated with displacement
or some other disturbance that interacts with the fiber causing a change in
received light intensity, which is a function of the variable being measured. The
light loss can be associated with transmission or reflection, and the attenuation
mechanisms can be based on microbending, macrobending, or other
phenomena such as absorption or scattering which can be incorporated in the
fiber (Krohn, 2000).

Wearable Sensor System for Human Motion Analysis
65
Figure 28: Fiber optic sensors. (Adapted from (Krohn, 2000))
Wavelength-modulated sensors, as the name indicates, use changes in
wavelength to implement the sensing function. The wavelength modulation can
be a result of fluorescence; however, the broad concept is accomplished with
Bragg gratings. The Bragg grating has a resonance condition at a specific
wavelength, in which incident light is reflected. If a change in strain or
temperature occurs, a perturbation in the grating will cause a wavelength shift
in the reflected light, which is a direct function of the change in strain and/or
temperature (Raman, 2010). Bragg grating sensors have several advantages: the
wavelength shift is independent on the light source intensity; high accuracy and
sensitivity; and multiplexing capabilities (Mishra, Singh, Tiwari, & Kapur, 2011),
just to mention a few.

Chapter 3 Fiber Optic Sensors
66
Phase-modulated sensors compare the phase of the light in a sensing
fiber to a reference fiber known as interferometer. The sensors are much more
accurate than intensity-modulated sensors and can be used in a larger dynamic
range. However, they are often more expensive and less appropriated to be
integrated in a wearable piece of garment, since they are much more complex
than simple intensity-modulated sensors (Krohn, 2000; Rantala, Hannikainen, &
Vanhala, 2011). Generally, the sensors employ a coherent laser light source and
two fibers in which previously splitted light is injected; if the environment
perturbs one fiber relative to the other, a phase shift occurs that can be detected
very precisely by an interferometer (Grattan & Sun, 2000). All interferometers
have a sensing fiber and an isolated reference fiber. There are four basic
interferometric techniques: the Mach-Zehnder, the Michelson, the Fabry-Perot
and the Sagnac. The interferometric techniques are generally used to detect
physical parameters with high resolution.
The sensing principle and examples how these fiber optic sensors
(intensity, wavelength and phase -modulated sensors) can be used to detect
position, displacement, relative rotation for human motion analysis and other
biomedical applications will be discussed in detail in subsequent sections.
3.1.1. Intensity-modulated Sensors
As introduced before, concepts associated with intensity-modulated
sensors include transmission, reflection, microbending and macrobending. For
the purpose of motion analysis the most popular and attractive sensors are
transmission sensors based on the microbending and macrobending
phenomena (Krohn, 2000). If a fiber is bent, small amounts of light are lost
through the wall of the fiber. If a transducer bends the fiber due a change in a
physical property, the amount of received light is related to the value of this
physical property. The attenuation, or intensity loss, is defined by the following
equation (Krohn, 2000):
(18)

Wearable Sensor System for Human Motion Analysis
67
where A is the attenuation and Pi and Po are the input power and output power,
respectively. The negative sign arises from the convention that attenuation is
negative (Krohn, 2000). Attenuation is measured in decibels (dB) per unit of
length.
Microbending sensors are inherently very similar to macrobending
sensors, difference lies in the sensor geometry and bending scale. Microbending
sensors are used in applications where the measurands such as strain, pressure,
force, position or acceleration, can be mechanically coupled to a device
movement that deforms the fiber (Xuejin, Yuanlong, Yongqin, Xinyi, & Jingxian,
2008). To activate the microbending loss in the sensing applications, the fiber is
usually placed in between teeth-like deformers (Figure 29). As the selected
measurand is sensed by the sensing head, the distance between the upper and
the lower teeth is reduced and causes a series of bending along the fiber
(Gardner, 1975). Continuous movement of the deformer is linearly dependent
on the light-intensity measured at the end of the fiber (Zawawi, O'Keefe, &
Lewis, 2013).
Figure 29: Schematic drawing of a microbending sensor.
Microbending losses in the fiber leads present a problem only if the leads
move while the sensor is in operation. Studies made with different cable
coatings revealed that the sensitivity of the leads to bending loss can be reduced
if a protective cable surrounds the fiber (Krohn, 2000).
Macrobending sensors can be considered one of the simplest in terms of
operating principle and instrumentation (Zawawi et al., 2013). Macrobending
sensors are both accurate and low cost, and, since they have a closed optical

Chapter 3 Fiber Optic Sensors
68
path, they are immune to dirty environments (Krohn, 2000). As compared to
microbending, these sensors do not require any deformers to cause changes in
the light output. Instead, different fiber geometry configurations are used to
allow light attenuation. Usually, the fiber is placed onto elastic elements and as
the fabric is stretched the bending radius of the fiber changes and causes
attenuation in light output (Zawawi et al., 2013). Several approaches have been
described using different fiber bending configurations, including single loops, U-
shape, sinusoidal and figure-of-eight shapes, as can be seen in Figure 30.
Figure 30: Schematic of different configurations used for intensity-modulated fiber optic sensors: (a) single loops; (b) sinusoidal, (c) U-shape and (d) figure-of-eight shape.
Fiber bending losses due to sinusoidal shapes have some limitations,
such as uneven force distribution along the curves, which may cause a light
attenuation not directly dependent on the number of curves and bending radius
(Zendehnam, Mirzaei, Farashiani, & Farahani, 2010). To overcome this hurdle,
the figure-of-eight scheme has been proposed as a different fiber geometry
(Augousti, Maletras, & Mason, 2005).
Most of the intensity-modulated sensors are analog and problems
associated with variations in light source intensity can affect the sensor output,

Wearable Sensor System for Human Motion Analysis
69
as well as microbending in the leads to and from the sensing region. Typically,
the light source is a light-emitting diode (LED) which can vary in intensity; to
resolve this problem, a reference can be used that detects the intensity
variations and corrects the LED output (Krohn, 2000).
The bending effect can be used in the biomedical field to monitor a
variety of physical and physiological variables. Some classic examples are the
use of simple silica fibers to recognize breathing movements (D'Angelo et al.,
2008) and to determine angular movements of human joints (Munoz, Leija,
Diaz, & Alvarez, 1995). A project supported by the EU under FP6 and called
Optical Fiber Sensors Embedded into Technical Textiles for Healthcare (OFSETH)
was launched with the goal of taking advantage of pure optical sensing
technologies for wearable health monitoring, especially in magnetic resonance
imaging (MRI) environments (Grillet et al., 2008). For many applications where
electromagnetic immunity is needed, optical fibers have proven advantages
compared with standard technologies. By analysing attenuation of the ray
which is driven in the optical fiber, placed at the patient’s upper body, when it is
bend, it was possible to recognize the breathing movements of the subject.
However, when using bending loss sensors attention must be given to its
placement and configuration. Within the OFSETH project, researches have
analysed different configurations in order to investigate the optimal sensor
which maximizes sensitivity. The best results accomplished were with
distributed fibers placed at the thorax in a sinewave configuration, with a 6 mm
radius. In addition, a two times better detection was achieved using a belt with
one part elastic (correspondent to the sensor area) and the rest non-elastic
(D'Angelo et al., 2008). Some of the results obtained so far under the OFSETH
project are shown in Figure 31.

Chapter 3 Fiber Optic Sensors
70
Figure 31: Respiratory abdominal movements recorded simultaneously by two belts, one completely elastic (Belt #1) and other semi-elastic (Belt #2), embedding a bending sensor,
at (a) 1310 nm and (b) 1550 nm. (Adapted from (Grillet et al., 2008))
A different application of an optical sensor that uses the microbending
concept is the case of a plantar pressure monitor device, used to control and
prevent the plant ulcers (that can lead to infection and subsequent amputation)
associated with complications caused by diabetes disease. In this study, a fiber
optic sensor array was built, which consists of an array of optical fibers lying in
perpendicular rows and columns separated by elastomeric pads. Intensity
attenuation is caused by the physical deformation of two adjacent perpendicular
fibers (Wang, Ledoux, Sangeorzan, & Reinall, 2005). Nonetheless, this new
sensor still lacks calibration optimization, especially for fibers located near the
periphery of the array, and needs improvements related to repeatability.
When considering silica fibers as the tool to build bend-loss sensors, one
issue that immediately appears is the problem of fiber breakage. If no special
attention is given to the bending limit of the fiber, the sensor functionality can
be compromised. In order to overcome such limitation, polymer-based optical
fibers, also known as POF, can be used. Besides the advantages of elasticity and
easy-handling, this type of fibers suffer from higher attenuation and distortion
compared with traditional silica fibers; where this represents a drawback for
telecommunication purposes, it also means increased detection capabilities
when considering macrobending sensors. In addition, since POF usually have
larger diameters, they permit the use of plastic connectors with lower precision.

Wearable Sensor System for Human Motion Analysis
71
POF macrobending sensors have been reported for monitoring seated spinal
posture (Dunne, Walsh, Smyth, & Caulfield, 2006) and for monitoring rescuers’
heart rate and respiratory rate wearing a smart fabric suitable to be used in
high-risk and complex environments (i-Protect project) (Witt, Krebber, Demuth,
& Sasek, 2011). These sensors have also been utilized to detect the flexion
angles of finger joints for commercial sensing gloves (Zimmerman & Lanier,
1987). Still, POF sensors alone have low sensitivity and there are some error
sources in power losses measurements (Kyoobin & Dong-Soo, 2001). One
method that improves the sensitivity of a bent optical fiber based sensor is side-
polishing (L. Bilro, Pinto, Oliveira, & Nogueira, 2008; Lomer, Quintela, López-
Amo, Zubia, & López-Higuera, 2007). The side-polishing is accomplished by
removing a portion of the jacket, cladding and core of the fiber, bringing a
polished elliptical surface out into the open. This polished region of the fiber
core is in direct contact with the external medium, with a specific refraction
index. If one combines this method with a loop configuration, a sensor with
twice the sensitivity is obtained (see Figure 32). In this case, the input rays
suffer refraction from the curved region and a subsequent refraction due to the
polishing area (Lúcia Bilro, Alberto, Pinto, & Nogueira, 2012).
Figure 32: Example of a side-polished POF cable loop. (Adapted from (Lomer et al., 2007))

Chapter 3 Fiber Optic Sensors
72
This sensor configuration was proposed as a liquid-level sensor, using
the changes of the refraction index in the sensing area to promote variations in
the optical power (Lomer et al., 2007). Also similar sensor configurations have
been reported for gait analysis, by measuring human joints angles, with good
results when compared with simultaneous video analysis (see Figure 33)(L.
Bilro et al., 2008).
Figure 33: Experimental setup to validate optical sensor for gait analysis: (a) sensor attached to knee joint and video-based system for simultaneous acquisition; (b) optical
sensors and video’s knee angle of a complete gait cycle. (Adapted from (L. Bilro et al., 2008))
Another referred concept, based on macrobending losses, that has
intrinsically more sensitivity than silica fibers to measure intensity variations is
the use of hetero-core fiber optic sensors. Hetero-core optical fibers are
fabricated by inserting a small portion of fiber with a smaller core diameter into
two identical fibers with larger core diameters. The cladding diameters of the
fibers should be the same. Hetero-core fiber optic sensors have large sensitivity
because of the power coupling that takes place at the interface, which makes
leakage easier when an external deformation occurs (Efendioglu, Sahin,
Yildirim, & Fidanboylu, 2011). This way, hetero-core sensors have been found to
have highly sensitive and reproducible performance in response to
macrobending based on optical intensity variations and, additionally, are
unaffected by temperature fluctuations (Nishiyama, Sasaki, & Watanabe, 2006).

Wearable Sensor System for Human Motion Analysis
73
Some researchers have developed a wearable sensing glove with embedded
hetero-core fiber-optic sensors capable of detecting finger flexion for hand
motion monitoring (see Figure 34) (Nishiyama & Watanabe, 2009). However,
the sensors used in the glove cannot discriminate between different joint
flexion, and different sensors are needed to detect each particular joint
movement. Another study reports the use of sensing clothes with embedded
hetero-core fibers to measure a joint angle ranging from 0-90º during human
walking (Nishijima, Sasaki, & Watanabe, 2007).
Figure 34: (a) Photo of the sensing glove and (b) experimental data acquired during hand waving. (Adapted from (Nishiyama & Watanabe, 2009))
3.1.2. Wavelength-modulated Sensors
Fiber Bragg Gratings (FBG) are truly wavelength-modulated sensors. The
parameter being measured is a direct function of the wavelength shift
associated with the Bragg resonance condition (Krohn, 2000). Bragg grating
sensors have several advantages: high sensitivity and accuracy, and because
they are small, they are excellent point sensors, which means a single fiber may
have several sensors written in sequence, each at a different wavelength
(multiplexing capabilities), measuring different physical variables (multi-
parameter sensor). Bragg gratings are intrinsic elements of a fiber where the

Chapter 3 Fiber Optic Sensors
74
index of refraction in the fiber core is periodically modulated after illuminating
it with ultraviolet light. As light propagates through the modulated region, some
with a specific wavelength (resonant Bragg grating wavelength, λ) will be
reflected. The resonant Bragg grating wavelength depends on the refraction
index, n, and the spacing between grating periods, Λ, as follows (Krohn, 2000):
(19)
At wavelengths that do not satisfy the Bragg condition, the light passes
through without being affected; however, at the Bragg wavelength, the signal is
reflected. An example of a reflection spectrum of a standard FBG sensor is
shown in Figure 35.
Figure 35: Reflected spectrum of a standard FBG sensor.
The Bragg grating responds to both strain and temperature. Strain effects
the elongation of the fiber, changing the grating spacing, and thus affecting the
transmitted wavelength. Also, the index of refraction is affected due to Poisson’s
effect (photoelasticity). Temperature causes thermal expansion, which also
changes the grating spacing. The refractive index itself is temperature
dependent. Usually, to discriminate temperature from strain effects, a reference
grating is used in the sensing head.

Wearable Sensor System for Human Motion Analysis
75
Another grating approach uses long-period gratings (LPG): when the
grating spacing is in the 500 µm range (typically ten times larger than FBGs) the
resonant condition couples light from the core to the cladding (Krohn, 2000).
LPGs have specific properties that make them possible to differentiate between
strain and temperature, twist and bending (Raman, 2010).
As both FBGs and LPGs can directly sense variations in temperature and
strain and, indirectly, a variety of physical properties such as pressure, rotation
and curvature, they can be useful for many applications in the field of healthcare
and, more specifically, human motion analysis.
An embedded array of FBGs can be used for pressure mapping at
different human segments and joints. A temperature independent grating with
the proper configuration can be used as pressure sensor for biomechanics or
rehabilitation. The EU FP7 IASiS project addresses pressure ulcer incidence and
treatment and aims to develop and demonstrate an Intelligent Adaptable
Surface for serving as the skin/machine interface in therapy beds and
wheelchair seating systems (Pleros, Kanellos, & Papaioannou, 2009). The
system integrates FBG sensor arrays in a 2D mesh structure, providing an
effective way of monitoring pressure and strain along the entire surface.
Another similar system was built that monitors the patient continuously,
registering the amount and frequency of movement over a given time,
generating a report that alerts the nursing staff if the patient stays unmoved for
a long period of time (Hao et al., 2010).
Chest strain can be used for monitoring patients, as breathing is difficult
to monitor. A temperature independent FBG can be designed for monitoring
ventilator movements and to determine the respiratory frequency spectrum. In
(Wehrle, Nohama, Kalinowski, Torres, & Valente, 2001), a FBG was attached to
an elastic belt, which was held in position just above the breast. As the patient
breathes, the thorax cage distends and deflates rhythmically. In addition, the
frequency of the signal can be used to trigger corrective action should the
patient be under stress. Figure 36 shows two respiratory signals recorded with
this system: the first reveals a normal inhaling and exhaling movement of a 26

Chapter 3 Fiber Optic Sensors
76
year old man, in sitting position; the second represents the respiratory
movement when the subject is turning his arms.
Figure 36: Respiratory signal captured through a FBG sensor of (a) a normal subject in sitting position and (b) a subject turning his arms. (Adapted from (Wehrle et al., 2001))
Using the same concept and taking advantage of the FBG linear
sensitivity to longitudinal mechanical stress, a system comprising a FBG sensor
was developed to investigate the capabilities of optical sensors for healthcare
monitoring in magnetic resonance imaging (MRI) environments (De Jonckheere
et al., 2010; De Jonckheere et al., 2009). Due to the well-known immunity of
fiber optics against electromagnetic radiations, FBG sensors are suitable for MRI
environments. The sensors were placed at abdominal and thoracic levels to
continuously monitor ventilation motion. Detecting these movements can be
useful to monitor anaesthetized patients during MRI scans, especially for infants
who are susceptible to the Sudden Infant Death Syndrome (De Jonckheere et al.,
2010). The developed system was able to precisely detect respiratory
movements; however, due to the variability of age, size and weight of the
patients, this wearable solution needs to be adapted to different groups.
There are many other different examples of using FBG and LPG sensors
to monitor respiration (Allsop et al., 2007; Allsop et al., 2005; Xiaobin, Chunxi,
Kun Mean, Hao, & Xunming, 2008). All these systems are based in the same
sensing principle described above and differ in the specific purpose for which
they were built.
Wearable Sensor System for Human Motion Analysis
77
For a proof-of-concept demonstration, an FBG sensor was placed in a
vibrating membrane of a subwoofer. Using recordings of various heartbeat
sounds, the vibrations felt by the membrane would induce stretching and/or
contraction of the FBG. Some relevant features such as strength of the heartbeat
or heart rate can be extracted from the wavelength signal. The researchers
predicted that in real-life scenario a FBG sensor could be used as a simple
stethoscope (Gurkan, Starodubov, & Xiaojing, 2005). Another example of how to
use an FBG sensor to measure cardiac activity was proposed by Witt et al.
(2011). The sensor was placed at the wrist of the patient and the small
elongations produced by heartbeat were detected by means of wavelength
shifts.
FBG sensors can also be used in biomechanics to measure human joint
angles. The system proposed in (da Silva, Goncalves, Mendes, & Correia, 2011) is
a simple sensing glove which uses FBGs to measure the angle between the finger
phalanges. The method consists in measuring the elongation of the upper side of
the finger joints when stretching out or in the finger. Since the purpose is to
detect the flexion/extension of the finger, sensor positioning and disposition is
crucial. The sensors must be placed in order to maximize elongation and
minimize wrinkles that could lead to fiber breakage. In this system, the fiber
was positioned in a curvilinear layout and a sensor was placed over each
phalanx joint, performing a total of 14 FBGs sensors in the glove (see Figure 37).
Due to FBGs multiplexing capabilities and high sensitivity, a single fiber is
enough to accurately measure the angles. The sensing glove revealed a linear
response while the hand was opening and closing, and a good agreement with
real angles was achieved. However, the integration of the fiber into the textiles
revealed some problems and the systems lacks portability.

Chapter 3 Fiber Optic Sensors
78
Figure 37: FBG sensing glove. (a) FGB sensor positioning; (b) Real-time monitoring of hand posture. (Adapted from (da Silva et al., 2011))
3.1.3. Phase-modulated Sensors
The use of interferometers in optical measurement has been well
established for many decades. Because of their extreme sensitivity, phase-
modulated sensors are the most publicized of all fiber optic sensors (Krohn,
2000). Typically, these sensors use a coherent laser lightsource and two single-
mode fibers. The light is split and injected in each fiber. Therefore, if the
environment perturbs one fiber relative to the other, a phase shift occurs that
can be detected very precisely (Krohn, 2000). This phase shift is detected by an
interferometer. As mentioned before, there are four interferometric
configurations: the Mach-Zehnder, the Michelson, the Fabry-Perot and the
Sagnac.
The Mach-Zehnder interferometer configuration can be seen in Figure
38 (a). It uses a laser beam that is split using a 3 dB coupler, which means 50%
of the light is injected into the sensing fiber and 50% into the reference fiber.
The light beams are recombined using another 3 dB coupler and the phase shift
is measured. This shift results from changes in the length and the refractive
index of the sensing fiber (Krohn, 2000).

Wearable Sensor System for Human Motion Analysis
79
Lightsource
Detector
3 dB
Lightsource
Detector
3 dB Sensing Fiber
Reference Fiber
Transducer
Mirrored Fiber End
Mirrored Fiber End
Lightsource Detector
Signal Processor
Transducer
Reference Fiber
Sensing Fiber3 dB 3 dB
Lightsource Detector
Mirror Mirror
Transducer
(a)
(b)
(c)
(d)
Figure 38: Fiber optic interferometers: (a) Mach-Zehnder configuration; (b) Michelson interferometer; (c) Fabry-Perot scheme and (d) Sagnac interferometer. (Adapted from
(Krohn, 2000))
The Michelson interferometer approach is depicted in Figure 38 (b). It
employs a configuration very similar to the Mach-Zehnder interferometer, but it
uses back reflection due to the fibers having mirrors at its ends. The initial beam
is split and injected in the reference and sensing fibers. Since both fibers have
end mirrors, the light is reflected and re-coupled to a shift detector. The
sensitivity of such configuration is higher but it has the disadvantage of feeding
light both into the detector and the laser, which causes noise (Krohn, 2000).

Chapter 3 Fiber Optic Sensors
80
Fabry-Perot interferometers are different from the ones mentioned so
far, since they do not require a reference fiber. Instead, the interference results
from successive reflections of the initial beam (see Figure 38 (c)). The multiple
passes along the fiber will magnify the phase shifts, which results in high
sensitivity (Krohn, 2000).
Finally, the Sagnac configuration is shown in Figure 38 (d). This
approach requires a coupler that injects light into two ends of a single-mode
fiber in a coiled configuration. The injection of light is such that light propagates
in both clockwise and counter-clockwise directions. In this case, both fibers
work as sensing fibers. If the coil rotates, one propagation time will be longer
than the other and when recombined the beams will be out of phase (Krohn,
2000). These sensors do not require a change in refraction index or length to
originate a phase shift. Devices of this type have been developed and applied
principally, but not exclusively, to develop fiber optic gyroscopes (Grattan &
Sun, 2000).
As mentioned before, due to its characteristics, fiber optic
interferometers are used to sense measurands with high resolution and
sensitivity. For biomedical purposes, the majority of these sensors are utilized
to measure physiological and biological parameters.
Recent studies describe the use of fiber-based interferometers breathing
sensors. In the study developed by Favero et al (2012) the device sensing head
consisted of a simple photonic crystal fiber (PCF) which was fusion spliced at
the distal end of a standard single mode fiber. The reflection spectrum of the
device exhibited a sinusoidal interference pattern that instantly shifted when
water molecules, present in exhaled air, were adsorbed on or desorbed from the
PCF surface. This way, the device could be used to monitor a person's breathing
whatever the respiration rate (see Figure 39). Similarly, another study reported
an interferometric sensor which detected the variation in relative humidity that
occurs between inhaled and exhaled breath, making possible the determination
of breath rate and status (Mathew, Semenova, & Farrell, 2012). Several other
sensors have been described to detect physiological parameters. The

Wearable Sensor System for Human Motion Analysis
81
mechanical and acoustic activity of cardiac muscle and respiration reflects in the
interferometric signal which enables the monitoring of heartbeat and
respiration (Podbreznik, Đonlagić, Lešnik, Cigale, & Zazula, 2013; Sprager &
Zazula, 2012).
Figure 39: Interferometer sensor for monitoring breathing. Top: sensor scheme; Bottom Left: sensor integration on a medical device; Bottom Right: phase shifts due to breathing
pattern. (Adapted from (Mathew et al., 2012))
For biological applications, the most common interferometric sensors
are based on integrated optical waveguide structures with Mach-Zehnder,
Fabry-Perot (Y. Zhang, Shibru, Cooper, & Wang, 2005) or Young (Schmitt,
Schirmer, Hoffmann, Brandenburg, & Meyrueis, 2007; Ymeti, Subramaniam,
Beumer, & Kanger, 2007) interferometer configurations. Usually, these sensors
are used to detect specific molecules which bind to the optical path resulting in
a phase shift (Davé, 2009). Interferometers can also be used to monitor
biochemical parameters, such as pH and other chemical substances (Gu, Yin,
Zhang, Qian, & He, 2009; T. Zhang et al., 2010).

Chapter 3 Fiber Optic Sensors
82
For biomechanical purposes, namely for measuring human joint angles, a
variety of other fiber-optic-based devices are described in the literature, based
on operation principles different from those presented in the above sections.
Optical linear encoders (OLE) can be used to substitute electrogoniometers.
Electrogoniometers are used to measure joint angles, but they need careful
sensor alignment and may restrict movements if many of them are used. An OLE
has already been described as a distance-measurement device: the emitter light
is reflected off a reflective code strip; the encoder counts the number of lines
that have passed upon the strip and which can be converted to travel distance
with direction index (Kim Doang, Chen, Zhiqiang, Song Huat, & Duh, 2011).
Nevertheless, similarly to electrogoniometers, these sensors still lack of
ergonomy. Recently, a fiber optic sensor based on polarization effects was
described as an optical goniometer (Donno, Palange, Di Nicola, Bucci, &
Ciancetta, 2008). The sensor uses a single mode fiber with two polarizers and
three paddles: when a relative rotation of the paddles planes occurs, a change in
the polarization of the light is achieved; since the polarizers allow the
determination on the initial polarization status, it is possible to estimate the real
rotation of the joint. Finally, a device utilizing the light refraction characteristics
of optical fibers was built in order to measure angular displacement of the
human joints (Jeong-Whan et al., 2006). An asymmetric beam profile was done
by cutting one end of the fiber tips at a certain angle and, as the angle between
the optical fiber tip and the phototransistor changes, the collector voltage varies
accordingly. Thus the sensed signal represents an indirect measure of the
curvature angle. The results showed that asymmetrical beam profile provide
wider linear relationship than the symmetrical one.

Wearable Sensor System for Human Motion Analysis
83
3.2. Wearable Intensity-modulated Fiber Optic Sensor
A simple intensity-modulated fiber optic sensor was designed and
characterized with the purpose to measure elbow flexion. The ultimate goal of
this device was to be integrated in the wearable system and combined with the
inertial units described in the previous sections.
The standard method to determine human joint angles is based on
electrogoniometers. These devices are commonly used by physiotherapists to
evaluate and score the performance of their patients while doing typical
functional tasks, such as the reach movement. The elbow flexion is the primary
phase of the reach sequence (Paten et al., 2010), thus one can understand the
great amount of interest devoted to its analysis, since a crucial aspect guiding
physiotherapist's clinical reasoning, and thus design of rehabilitation
intervention, is the assessment of patients’ motor performance. The typical
functional range of motion of elbow flexion on an adult is between 10º and 130º
(Morrey, Askew, & Chao, 1981). For the reach functional task, with the subject
seated at a height corresponding to the alignment of the iliac crests and next to a
table aligned with the distal border of the subject's thigh (so as not to interfere
with the arm trajectory), the typical range of motion varies from 15º to 60º
(Salazar et al., 2014). Despite its wide spread usage, electrogoniometers need
careful sensor alignment, still lack of ergonomy and may restrict movements
(Shiratsu & Coury, 2003).
According to the American Medical Association (AMA), the mean error
limit accepted for the evaluation of movement impairments in clinical contexts,
to consider a measurement as reliable, is established as 5 degrees (Nitschke,
Nattrass, Disler, Chou, & Ooi, 1999). Standard commercial electrogoniometers
used for these purposes stand below, or are equal, to this limit (Shiratsu &
Coury, 2003). However, when it comes to sensitivity, research studies report
fiber optic sensors as better alternatives to standard devices, since they are
more sensitive to angular changes. Moreover, these sensors can provide
repeatable results and allow to simultaneously measure multiple joints and
store them directly in a database (Bell & Stigant, 2008; Wise et al., 1990).

Chapter 3 Fiber Optic Sensors
84
Therefore, in order to overcome some of the hurdles of standard
measure devices, a fiber optic sensor based on macrobending design was
characterized and integrated in a customized piece of garment specifically
designed and built to integrate the optical fiber as sensing element (Figure
40 (a)).
Figure 40: Fiber optic sensor: (a) customized piece of garment with different sensor configurations; (b) optical fiber channel detail on the fabric.
Experimental Procedure
A MBS seamless knitting machine model from MERZ company11 was used
to fabricate the piece of garment, mounted with a single needles system in a
cylinder. The disk comprises transferring jacks, knives and springs which allow
the control of the yarn in terms of going in or out the knitting zone. This
machine is also a jacquard machine, with which it is possible to obtain complex
structures with localized variations. These features have been used to produce a
particularly voluminous structure at the area used for the optical fiber channels
(see Figure 40 (b)). In this way, the channels protrude from the rest of the
fabric, making simple the integration of the fiber onto the garment. Also, the
feeding head of the machine comprising seven yarn guides allows to produce a
customized fabric tube, with different compression effects and drawings based
on the yarns characteristics.
11 http://www.merz-maschinenfabrik.de/

Wearable Sensor System for Human Motion Analysis
85
The optical sensing device consists of a simple intensity-modulated
sensor in which the light loss is associated with transmission and occurs due to
bending effect, namely through the decrease of the curvature radius. As the
flexion angle increases the loops radius decrease accordingly and hence the
light loss inside the fiber for a single-mode fiber (SMF) is usually obtained by
(Zendehnam et al., 2010):
leL 2log10 (20)
where L is the bending light loss, l is the fiber length and α is the bending loss
coefficient, which is a function of bending radius, light wavelength and also
optical fiber material and structure. Initial experimental results obtained from
the optical fiber sensor with a single loop revealed an almost linear relationship
between the curvature radius of the fiber and the flexion angle, as depicted in
Figure 41.
Figure 41: Relationship between curvature radius and flexion angle.
A standard single-mode fiber (SMF 28) was introduced in the specifically
designed optical fiber channels with curvature radius with approximately 7 mm
and 10 mm distance separated. The optical fiber coating and its integration into
the fabric channels provides the fibers protection and stability, and,

Chapter 3 Fiber Optic Sensors
86
consequently, increases sensor lifetime. Four different configurations were
tested in order to investigate the sensor behaviour in terms of sensitivity and
repeatability with increasing number of turns. The schemes studied covered
sensors with a single, two, three and four loops (Figure 42).
Figure 42: Schematic of sensor configurations studied: (a) single loop, (b) two loops, (c) three loops and (d) four loops.
The first scheme studied, shown in Figure 42 (a), has only one curvature
and the light input and output are on the same side, while in the second case
(Figure 42 (b)) the sensor has two curvatures and the light input and output are
opposite to each other. Figure 42 (c) represents a situation similar to the single
loop configuration and Figure 42 (d) is analogous to the two loops
configurations; in both cases the number of loops increases relatively to the
previous case.
Figure 43 (a) presents the experimental setup used to measure flexion
angle. Light from a broadband source centered at 1550 nm and with width
100 µm was guided into the fiber. A photodetector (Agilent Technologies 8163B
Lightwave Multimeter) in the telecommunications window of 1550 nm was

Wearable Sensor System for Human Motion Analysis
87
used to measure the optical power at a sample frequency of approximately
10 Hz. A Matlab script was used to acquire and visualize the output signal in
real-time (the complete code can be found in Appendix C. For each sensor
configuration, ten repetitions were performed at a fixed angle. The flexion angle
ranged from 0º, equivalent to rest position (Figure 43 (b)), to 60º, which
corresponded to the maximum elbow flexion (Figure 43 (c)), with increments of
3 degrees. As mentioned before, the range chosen for the flexion angle was
based on the typical range of motion observed while performing the reach task,
which is one of the most important upper-limb functional tasks that are in the
basis of most daily-life routines. During the experiments, no degradation in-use
of the fiber was observed.
Figure 43: (a) Experimental setup; (b) sensor at rest position (0º) and (c) sensor at maximum elbow flexion (60º).
Results and Discussion
The results of the measurements for each sensor configuration are
shown in Figure 44.
Each graph shows the output light power for all ten measurements
(small circles) for a given angle, the corresponding average (large circles) and
standard deviation, as well as a linear fit (shown in red) between the light
power and the flexion angle.

Chapter 3 Fiber Optic Sensors
88
Figure 44: Light output power variation with increasing elbow flexion angle for (a) single loop, (b) two loops, (c) three loops and (d) four loops configurations.
Overall, all configurations show losses in optical power as the angle
increases, as expected. Concerning sensor response, the way the optical fiber
behaved inside the channels on the fabric as the flexion angle increased changed
between configurations and, consequently, influenced the sensitivity of the
sensor device. For the single loop scheme, the sensitivity is dictated by the
decrease on the curvature radius of the only loop present and, as one can see on
Figure 44 (a) the light losses due to bending do not change uniformly as the
flexion angle increases. In fact, it is possible to note that the sensitivity is smaller
for smaller angles (until approximately 15º) and likewise the variability

Wearable Sensor System for Human Motion Analysis
89
between repetitions increases. One can also observe a lack of resolution on the
sensor response; however this limitation is caused by the resolution of the
acquisition equipment used for this experiment.
For the second case, i.e., two loops configuration, the sensor response is a
consequence of a symmetric decrease of both curvature radius. Thus, the
sensitivity of this configuration is approximately the double of the single loop
scheme. It should be noted the high variability between samples for this sensor
(see Figure 44 (b)).
Concerning the three loops scheme, shown on Figure 44 (c), one should
assume a higher sensitivity when compared with the two loops configuration. In
fact, there is a slight increase of the sensitivity, but the difference is not as high
as it should, theoretically, be expected. This behaviour can be explained by the
way the curvature radius decreased as the flexion angle increased: the inner
loop (referred as number 2 in Figure 42 (c)) has a different behavior from the
outer loops (1 and 3), which translates into a behaviour similar to the one seen
on the two loops configuration. Therefore, the sensitivity of this scheme is very
close to the two loops sensor. However, the dispersion between the ten
repetitions for this configuration is smaller than the previous case.
Finally, during the experiments with the four loops scheme (Figure
44 (d)) it was possible to see that the decrease on the curvature radius of the
outer loops (referred as numbers 1 and 4 of Figure 42 (d)) and the inner loops
(2 and 4) was different from each other, which reflected in an increase of the
sensitivity of approximately the triple of the sensor with a single loop.
Additionally, this configuration provided the best approximation to a linear
response.
A comparison between the sensitivity of all configurations is shown in
Figure 45. Table 8 presents the values of sensitivity, correspondent standard
deviation and R-squared of the linear fit for all configurations.

Chapter 3 Fiber Optic Sensors
90
Figure 45: Comparison of sensor response for the four configurations studied.
Table 8: Sensitivity, standard deviation and R-squared values for each sensor configuration.
Sensor Scheme
Sensitivity (dBm/degree)
Standard Deviation
R-squared
1 Loop 0.197 0.008 0.963
2 Loops 0.42 0.01 0.985
3 Loops 0.46 0.01 0.982
4 Loops 0.64 0.01 0.989
Looking at these values it is clear that the configuration that assures a
higher sensitivity, i.e. 0.64 dBm/degree, is the one with four loops, as expected.
In fact, this sensor has a sensitivity 3 times higher than the single loop
configuration and almost 1.5 times higher than the two and three loops
schemes. Additionally, this configuration provided the best approximation to a
linear response.

Wearable Sensor System for Human Motion Analysis
91
3.3. Summary
Fiber optic sensors are a relatively new concept for the measurement of
biomechanical variables. Besides the advantages of small size and weight,
electromagnetism and radio-frequency immunity, these sensors have high
sensitivity and accuracy which makes them a good alternative for conventional
electrical sensors.
In the previous section a simple intensity-modulated fiber optic sensor
was designed and characterized to determine elbow flexion. This movement is
the first phase of the reach task and one of the most important features
physiotherapist evaluate in order to score stroke survivors performance.
A customized piece of garment was specifically designed to integrate the
optical fiber sensor making it truly wearable. Different sensor configurations
were studied and light loss resulting from bending was measured with an elbow
angle ranging from 0º to 60º. Results showed that, when compared to other
sensor configurations, the four loops scheme had a good sensor response in
what concerns linearity, sensitivity and repeatability. The sensitivity for this
configuration (0.64 dBm/degree) was 3 times higher than the single loop
scheme and approximately 1.5 times higher than the three loops configuration.
This wearable sensor has demonstrated a good response to elbow flexion and,
when compared with traditional sensors, such as electrogoniometers, it can
overcome some hurdles such as sensor alignment and ergonomy, and can also
provide automatic means for monitoring human movement without the
dependency on therapists or other end-users.
Since the proposed system revealed good performance for the
determination of elbow flexion, it is simple to handle and comfortable for the
user, it has a great potential for rehabilitation, especially to monitor upper-limb
intervention progress of stroke patients, identify relevant compensatory
movement strategies and help physicians with their clinical reasoning process.
For swimming analysis, the proposed sensor represents a breakthrough for
determining human segments angles in real-time, although some efforts need to

Chapter 3 Fiber Optic Sensors
92
be done in order to insulate the electrical part of the system (light emitter,
photodetector, etc.).

PART II
HUMAN MOTION ANALYSIS
SPORTS AND REHABILITATION


Wearable Sensor System for Human Motion Analysis
95
Chapter 4
SWIMMING PERFORMANCE ANALYSIS
Swimming is a technically challenging sport. The forward displacement
during swimming results from the ratio between propulsive and resistive
forces. From the biomechanical point of view, swimming performance depends
on the mechanical interaction between water and the dynamical actions of a
swimmer’s body.
Swimmer’s propulsion results from angular movements of the superior
and inferior limbs and their synchronization. The mechanics behind propulsion
were first considered as an application of Newton’s Third Law: the hand and the
forearm push dense masses of water backwards in a straight line to propel the
swimmer’s body (Lauer, Figueiredo, Vilas-Boas, Fernandes, & Rouard, 2013). In
fact, to generate high propulsive forces, a swimmer must perform a complex
cyclic motion. However, swimmer’s body and movements do not generate
exclusively propulsive forces. In truth, it is well-known that body orientation
and volume contribute significantly for motion resistance. Whereas some
factors are more difficult to be changed in order to reduce resistance forces,
since they are intrinsic to body characteristics or swimming style, other factors
such as body orientation in the water or angular adjustments of specific
segments can be easily improved to reduce some of the resistance forces and
the production of waves. Several studies report that the angle formed between
the swimmer’s body and the horizontal plays and important role in swimmers’
forward displacement: if the legs are deep into the water than the drag
coefficient increases (Bächlin, Förster, & Tröster, 2009). Also, the body and head
rotations contribute to increase resistive forces. It can be said that the

Chapter 4 Swimming Performance Analysis
96
generation of resistance forces is inherent to self-body locomotion inside the
water.
At a constant speed, the total body drag, representing the resistive force,
is equal to the propulsive force. If the swimmer needs to increase speed, i.e.
accelerate, then propulsive forces need to be greater than the total drag. Speed
fluctuations are quite visible in breaststroke technique, due to the intermittent
propulsive movement of the limbs and the drag of the underwater recovery
movements. Less evident speed fluctuations occur in butterfly technique, since
the over-water arm recovery eliminates the drag caused by the underwater
recovery in the conventional breaststroke, and the wave-like movement
provides more or less a continuous propulsion. A more constant body speed is
observed in the crawl technique because the limbs operate to generate
propulsion forces throughout the total stroke cycle (Soares, 2000).
In the field of swimming, specifically when considering high level
swimmers, the analysis of swimmers performance plays a crucial role.
Monitoring physiological and biomechanical parameters of athletes during
training allows analyzing and describing phenomena through which is possible
to establish explanations for some movements and postures and thus
hydrodynamic consequences. Moreover, the analysis of such parameters can
allow the optimization of swimmers technique in order to increase their
performance and decrease the risk of injuries. The relevance of biomechanical
swimming performance analysis is systematized in the diagram shown in Figure
46.
Commonly used assessment techniques can be separated into different
areas, such as performance, kinematics and physiology, although there is
considerable overlap between them. Performance monitoring contains
measurable movements of the swimmer during the monitoring period and
typically times related to their movement. Kinematic monitoring, a detailed part
of performance analysis, uses direct and indirect measurement methods to
quantify the movement of the swimmer, often to map them to theoretical
models. Physiological investigations mainly look at the energy systems of the

Wearable Sensor System for Human Motion Analysis
97
athlete during training, competition and recovery (Daniel A. James, Burkett, &
Thiel, 2011).
AnalyseDescribeExplain
ModelSimulate
TransformOptimize
PerformanceMovementsTechniques
Prevent Injuries
EquipmentMaterialsMethods
To
To
Figure 46: Biomechanical relevance in swimming analysis.
4.1. Wearable Systems for Swimming Analysis
Nowadays we know more about the best and most efficient swim
techniques than several years ago, but the swimming performance evaluation
methods are still basic the same. There are three main observation
methods (Bächlin & Tröster, 2011):
Self-perception: the swimmer ‘‘feels the water’’ and can react to
perceived forces;
Supervision by the coach: is the most frequently used observation
method. The coach can give direct instructions to the swimmer
but he can only observe one swimmer at a time. Observation by
the coach also has its limitations, as movements below the water
surface are difficult to observe;

Chapter 4 Swimming Performance Analysis
98
Video analysis: is the most objective evaluation method. However,
video analysis can only be done offline, it is time-consuming, and
the swimmer cannot correct his errors instantly.
Analysis of swimmers’ kinematics through video-based systems is a
challenging problem because of the difficult experimental conditions that affect
the cameras setup. 2D analyses require a single camera; points of interest are
digitized on each video and analysis of movement on the sagittal plane is
performed (Holthe & McLean, 2001). Since the motion in front-crawl swimming
occurs on different planes (Schleihauf, Gray, & DeRose, 1983), for a descriptive
analysis of three-dimensional (3D) motion a multi-camera setup is needed,
which requires not only calibration, but also synchronization of the cameras
(Figure 47).
Figure 47: Multi-camera experimental setup used to determine to swimmer’s instantaneous velocity (adapted from (Barbosa, Fernandes, Morouco, & Vilas-boas,
2008)).
These procedures are hindered by the underwater experimental
environment: refraction of light rays causes image deformations, yielding to
lower accuracy, and the equipment must comply with safety regulations
(Gourgoulis et al., 2008). Furthermore, videos are analyzed by manual
digitization of feature points on all images, which may correspond to either
visual markers drawn on the subject or crucial points, such as joint centers,
identified by the operator. This procedure has two main drawbacks: it is time-
consuming and can easily lead to misidentification of features, especially when a

Wearable Sensor System for Human Motion Analysis
99
large number of points are involved. The adoption of markers constituted of
LEDs has allowed to automate the tracking process, but investigation so far has
mainly regarded identification of areas instead of single points, and motion on
the sagittal plane (Slawson, Conway, Justham, & West, 2010). Recently,
markerless analysis of swimming performance has been introduced (Aguiló,
Martinez, Buades, Perales, & Gonzaléz, 2004). This approach uses a semi-
automatic method to synthesize underwater motion by adjusting a ‘‘virtual
human’’ model to the morphology of the subject. Nevertheless, no
biomechanical validation of the model has been carried out. The approach
proposed by Ceseracciu et al. (2011) adapted the markerless video method
described by Corazza et al. (2010) to determine arms movement during crawl
swimming. Nevertheless, information from out-of-water cameras could not be
easily integrated with the underwater views because of the issues related to the
water–air interface, such as waves and foam.
For swimmers there are only a few commercial swim-timer devices
available, which can be used to measure lane times and to count the number of
lanes swum. There are devices to be placed on the pool wall, e.g. the Finis Lap
Track 512 or worn on the swimmers finger, e.g. SportCount Chrono13. They are
based on push buttons and displays.
In-stroke variations of swimming velocity is an important feature for
athletes and coaches. Traditionally, swimming velocity is estimated using video-
based systems (Takagi, Nishijima, Sugimoto, & Wilson, 2004; Tella et al., 2008)
or tethered methods (Geiser, 1999). Dopsaj et al. (2000) used tethered methods
to determine swimming force and velocity while Mouroço et al. (2006)
developed a cable speedometer to investigate butterfly swimming techniques
through changes of velocity profiles. Tethered methods have some drawbacks
due to its complicated setup and the cabling attached to the swimmer (Khoo,
Lee, Senanayake, & Wilson, 2009).
12 http://www.finisinc.com/ 13 http://sportcount.com/

Chapter 4 Swimming Performance Analysis
100
In 2008, Justham et al. published a critical evaluation of existing analysis
techniques in swimming, and concluded that more thorough feedback could be
provided through the use of inertial sensor technology (Ride, Ringuet,
Rowlands, Lee, & James, 2013).
The last decade has noticed an increasingly number of inertial-based
systems for swimming performance analysis. Estimation of velocity is one of the
most investigated feature of swimming. Most of the existing systems use offline
post-processing algorithms to determine velocity and acceleration profiles of
different swimming techniques (Seifert, Chollet, & Bardy, 2004; Siirtola,
Laurinen, Roning, & Kinnunen, 2011; Stamm, Thiel, Burkett, & James, 2011).
Ohgi (2002) described a wrist-mounted tri-axial accelerometer that was used to
discriminate stroke phases in front crawl and breaststroke techniques. Khoo et
al. (2009) used a combined system of underwater cameras and head-mounted
accelerometers to compare left and right handed stroke acceleration values. Le
Sage et al. (2010) proclaimed a system comprising vision analysis with real-time
image processing, a Body Sensor Network (BSN) of inertial units and force
transducers at the end of the pool for real-time monitoring of swimmers’
performance. So far, the results have allowed to extract in real-time the stroke
rate, stroke duration and lap count. Pansiot & Guang-Zhong (2010) used a
modified ear-worn activity recognition (e-AR) sensor mounted on swimmer’s
goggles to analyse stroke phases in front crawl (see Figure 48).

Wearable Sensor System for Human Motion Analysis
101
Figure 48: Swimming analysis using accelerometers: (a) sensor placed on swimmer’s goggles; (b) pitch and roll angles in front crawl swimming.
Several comparison studies between video-based systems and inertial
wearable technology have been reported (Daukantas, Marozas, Lukosevicius,
Jegelevicius, & Kybartas, 2011; Davey, Anderson, & James, 2008). These studies
focus on validating inertial measurement units as reliable instruments to
analyse swimming performance. Results have shown that accelerometer-
derived features can be as good as or even better than collected video data
(Davey et al., 2008).
One aspect that is crucial in swimming analysis is feedback. Video-based
systems fail to provide swimming features in a time-frame that is useful for
athletes and their coaches. Real-time feedback can be delivered through
wearable technology, specifically inertial units, since important swimming
characteristic can be extracted with embedded algorithms and be wirelessly

Chapter 4 Swimming Performance Analysis
102
transmitted to a remote station for visualisation. Nevertheless, wireless
transmission is not as trivial as it seems at the beginning. The water-air
interface represents a barrier which is difficult to overcome using standard
wireless protocols, such as ZigBee or Bluetooth. In fact, studies have
demonstrated that significant data can be lost if air transmission path
overcomes 1 meter distance (Hagem, Thiel, O'Keefe, Wixted, & Fickenscher,
2011; Daniel A. James, Galehar, & Thiel, 2010). As an alternative, transmission
antennas operating in different frequency bands can be used, but its size and
limited data rate are prohibitive (Abbosh, James, & Thiel, 2010). Different
strategies for providing feedback to swimmers can be adopted, as the one
described by Hagema et al. (2013) which consists of a wrist-mounted
accelerometer which calculates time difference between strokes and activates a
LED which makes swimmer react according to light colour.
4.2. Swimming Analysis through WIMU
In swimming analysis some of the most important parameters to be
monitored can be divided in two groups:
Performance parameters:
Time and distance;
Average velocity;
Number of laps;
Number of strokes, stroke length and frequency.
Kinematic parameters:
Angular positions of body segments;
Linear velocity and acceleration profiles;
Angular velocities.
The above mentioned parameters can be obtained through inertial
sensors, either directly from sensors outputs or indirectly by applying the
principles described in Chapter 2. The estimation of such parameters can be
used to characterize swimmer’s movements and allow for the comparison of

Wearable Sensor System for Human Motion Analysis
103
different experience level swimmers and to differentiate between swimming
styles.
When analyzing swimmer’s performance through accelerometers, some
of the equations presented in Chapter 2 for angles estimation can be simplified.
This is because of the nature of swimming movements. Typically, the inertial
units are placed at the upper back or at the lower back, which is expected to
better correspond to the center of mass of the swimmer. The upper back
location is often preferable since it is more accurate when detecting strokes,
turns and styles (Siirtola et al., 2011). Movements at this region are very slow
and body (dynamic) acceleration is small when compared with gravity (static
acceleration). Thus, swimmer’s movements can be considered as non-
accelerated movements and a quasi-static condition can be adopted. The
application of this assumption has revealed very good results when compared
with video-based systems (Bächlin & Tröster, 2011; Daukantas et al., 2011;
Pansiot et al., 2010). In this case the extraction of some angular positions can be
done using only the information given by the accelerometer. The acceleration
measured by the accelerometer, ab, depends on the actual acceleration of the
system, an, the orientation (given by the Direction Cosine Matrix, Equation 8 of
Chapter 2) and gravity, g:
(21)
Considering that , Equation 21 can be simplified to estimate:
(22)
Therefore, the pitch and roll angles can be derived from the measured
acceleration as follows:

Chapter 4 Swimming Performance Analysis
104
(23)
(24)
The estimation of such angles can give information about alignment of
the body. Vertical alignment, also referred to as body balance, is associated with
the angle between the swimmer’s body and the water surface (pitch angle);
Horizontal alignment, or body rotation, refers to the swimmer’s body rotation
along his own longitudinal body axis (roll angle) (see Figure 49).
Figure 49: Body coordinate system. Body balance and body rotation can be estimated from the pitch and roll angles, respectively.
A good body balance is important for efficient swimming as drag forces
are reduced. There are several possible reasons for a bad body balance, for
example weak leg kicks, a weak body tension or a bad posture of the head due to
looking upwards instead of aligning spine and head. Body rotation is efficient in
crawl and backstroke swimming because the stroke length can be increased and
the side-lying gliding position is the body position with the least water
resistance. The body rotation can be initiated by the leg kicks. The upper and
the lower body part should rotate together, because a synchronized rotation
leads to a fluent motion (Bächlin, Förster, & Tröster, 2009). The roll angle
information is also useful for breathing studies and to determine the number of
strokes (Siirtola et al., 2011).

Wearable Sensor System for Human Motion Analysis
105
The study described in this section presents the main outcomes
accomplished with the inertial measurement unit referred to as WIMU in the
first part of this thesis, to measure the performance of a swimming athlete.
Experimental Procedure
During the experimental tests the WIMU was located at the dorsal zone
of the coronal plane of the swimmer, within the vertebral region at the inferior
scapular section, as can be seen on Figure 50. This location was chosen in order
to measure, in addition to the accelerations on the three axes, the longitudinal
rotation of the trunk and body balance. As mentioned before, these parameters
can be considered a useful factor when evaluating swimming performance, due
to its correlation to the displacement velocity. Another important consideration
was the comfort of the swimmer and avoiding restricting or modifying their
average sequence of movements.
Figure 50: WIMU positioned at the upper back of the athlete.
A female athlete in her late teens served as the main tester. Before
entering the pool, the swimmer was required to perform a number of flexibility
related routines, in order to determine movement constraints. Once in the pool,
she was asked to swim, submerge and perform various movements in order to
determine if the WIMU’s presence represented an obstruction to her
movements. In both cases (outside and inside the pool) the swimmer reported
that the unit did not affect her movements. Finally, the swimmer was told to

Chapter 4 Swimming Performance Analysis
106
complete several sets of laps using the crawl technique, then a number of laps
with, butterfly and finally breaststroke. For all styles indicated, the turn at the
end of the pool was perform through a vertical turnaround (i.e., stop-touch wall
turnaround), reversing direction without flipping under water.
Although data gathering for the crawl techniques laps did not required
signal compensation strategies, the butterfly and breaststroke techniques did
present some data gaps. The recorded data was later processed applying
compensation techniques (interpolation).
Results and Discussion
The acceleration signals (in units of g’s) for two laps crawl technique are
shown in Figure 51. Considering these signals, the X-axis points opposite to the
direction of displacement and together with the Y-axis form the coronal plane of
the subject; while the Z-axis is pointing inwards to the subject, forming the
sagittal plane with the X-axis and the transversal plane with the Y-axis.
Figure 51: Acceleration in all three axes (X-axis: green; Y-axis: red; Z-axis: blue) for two laps crawl technique.
As mentioned before, performance parameters such as the number of
strokes, number of laps or start/end of lap can be directly taken from the
accelerometry profiles. As expected for crawl technique, higher acceleration
amplitudes occur in the Y-axis, which relates to rotation movements around the

Wearable Sensor System for Human Motion Analysis
107
X-axis, corresponding to arms strokes. A direct analysis also allows to quantify
the time between each arm stroke and its evolution along each lap, as shown in
Figure 52.
Figure 52: Elapsed time between each stroke for two laps. The 10th stroke corresponds to lap end, i.e. vertical turnaround.
Table 9 summarizes some relevant performance features extracted from
the accelerometry profile.
Table 9: Some relevant performance parameters extracted from accelerometry data for crawl technique.
Lap 1 Lap 2
Duration (s) 24.16 23.84
Number of strokes 9 10
Stroke frequency (Hz) 2.68 2.38
Average stroke duration (s) 2.41±0.33 2.38±0.24
Equivalent lap sections acceleration signals (in units of g’s) for different
swimming techniques are presented in Figure 53.

Chapter 4 Swimming Performance Analysis
108
Figure 53: Equivalent lap section acceleration signals for each performed technique.
Crawl, butterfly and breaststroke styles were evaluated for each
movement axis. Observing the graphs concerning each swimming technique, it
was possible to differentiate between styles. For example, crawl technique can
be readily distinguish from breaststroke and butterfly by the signal provided by

Wearable Sensor System for Human Motion Analysis
109
the accelerometer in Y-axis. This signal presents large variations for the crawl
technique, while for the other styles these variations are comparatively small.
Alternatively, the butterfly and breaststroke technique can be differentiated
from each other from the data produced by the accelerometers in the X-axis, or
the longitudinal axis.
As mentioned in the beginning of this section, pitch and roll angles can be
estimated from acceleration signals. These values provide a better
understanding about the swimmer’s movements to progress in the water and to
minimize drag.
The pitch angle, which is related with the angle formed with the
horizontal, for one lap crawl, butterfly and breaststroke techniques is presented
in Figure 54.
Figure 54: Pitch angle for one lap crawl, butterfly and breaststroke techniques.
As expected, variations in the pitch angle for the butterfly technique are
higher when compared with the other styles. In addition, it is clear to observe
double-bell shapes of this signal, each corresponding to a single stroke. This
behaviour is strongly related with this swimming technique pattern, which is
characterized by two leg movements (the first when entering the water and the
second at water exit) in each cycle or stroke (Soares, 2000).

Chapter 4 Swimming Performance Analysis
110
The roll angle for all the evaluated techniques, i.e. crawl, butterfly and
breaststroke, is shown in Figure 55. As one should deduce, the crawl technique
exhibits roll angles with a higher amplitude, due to the swimmers’ rotation
along the longitudinal axis. It is expected that both butterfly and breaststroke
techniques have small body rotations.
Figure 55: Roll angle for one lap crawl, butterfly and breaststroke techniques.
4.3. Summary
The leading method for swimming analysis is based on image processing
of video data. Nonetheless, there are some hurdles to overcome due to time-
consuming setup and data processing procedures and also due to water
interference at the air-water interface (waves and bubbles, for instance). The
use of wearable technology, such as inertial measurement units, allow the
extraction of meaningful features that can be transmitted to the swimmer or
coach, providing real-time feedback of swimmer’s performance. In addition, the
information from these systems can be combined with other systems in order to
overcome some of the obstacles mentioned before.
In this chapter, results from accelerometry data acquired with the WIMU
device are presented. The WIMU was placed at swimmers’ backs and

Wearable Sensor System for Human Motion Analysis
111
movements were acquired for different swimming techniques. It was possible to
obtain acceleration profiles for each style, allowing the identification of the
number of laps swam, lap turnaround, number of strokes, stroke frequency and
duration. The pitch and roll angles for each swimming technique were
estimated and differences between each technique were identified from these
profiles.


Wearable Sensor System for Human Motion Analysis
113
Chapter 5
POST-STROKE PATIENTS MOVEMENT ANALYSIS
Stroke is defined as an acute neurological dysfunction of vascular origin
with rapid onset of signs and symptoms according to the committed areas of the
brain (World Health Organization, 2011). Generically, it can be understood as an
acute interruption of blood flow caused by vessel blockage (thrombosis, arterial
embolism), or a rupture on the blood artery (A. O. Silva, 2007).
Strokes can be classified into two major categories: ischemic and
hemorrhagic. Ischemic strokes are those that are caused by interruption of the
blood supply, while hemorrhagic strokes are the ones which result from rupture
of a blood vessel or an abnormal vascular structure (A. O. Silva, 2007). About
87% of strokes are caused by ischemia, and the remainder by hemorrhage
(World Health Organization, 2011).
Risk factors for stroke include old age, high blood pressure, previous
stroke or transient ischemic attack (TIA), diabetes, high cholesterol, tobacco
smoking and atrial fibrillation. High blood pressure is the most important
modifiable risk factor of stroke.
In post-stroke subjects, the ability to efficiently perform functional tasks
can be substantially modified (Achache et al., 2010; Milot, Nadeau, Gravel, &
Requiao, 2006). Difficulties in these functional tasks are mainly attributed to
impairments resulting from central nervous system (CNS) lesion, being the
middle cerebral artery (MCA) territory the most common affected area after
stroke (Ng, Stein, Ning, & Black-Schaffer, 2007). Neuro-motor dysfunctions after
MCA stroke affect predominantly the upper-limb and face, and less the lower-
limb (Shelton & Reding, 2001).

Chapter 5 Stroke Patients Movement Analysis
114
Considering that stroke is the most important cause of morbidity and
long-term disability in Europe, this clinical condition represents a major burden
on healthcare system.
5.1. Rehabilitation Protocols and Procedures
An in depth understanding of the human body in everyday scenarios and
advanced skills in physical assessment, allow physiotherapists to manage a
broad range of conditions, with the fundamental goal of promoting wellness,
mobility and independent function (Tate, 2006). Despite these well stated skills,
most current evaluation procedures still lack some objectiveness since they rely
mostly in clinical assessment scales, which, although very useful, are influenced
by a certain degree of subjectivity. The development and implementation of
objective measures within rehabilitation evaluation procedures may contribute
to enhance clinical reasoning and potentiate rehabilitation efficiency.
Modern technological developments for rehabilitation must consider
low-cost adaptable solutions, which can be integrated in everyday scenarios as
opposed to rigid strategies meant for limited usability. Rehabilitation
interventions should specifically address the individual's impairment; present
sufficient difficult as to challenge the motor system and integrate strategies to
develop transfer of performance gains from the training situation to everyday
life (Strong, Mathers, & Bonita, 2007). Post-stroke rehabilitation reality is far
from being ideal, from both a clinical and economical points of view.
Considering that there were an estimated 10.3 million first-ever stroke
survivors worldwide in 2005 (Strong, Mathers, & Bonita, 2007) and stroke is
projected to remain a leading cause of disability-adjusted life years through
2030 (Lopez, Mathers, Ezzati, Jamison & Murray, 2006), stroke care represents
a major burden on global healthcare expenditures, representing about 3% of
healthcare costs (Evers et al., 2004). Despite the elevated related cost, there is a
general agreement on the importance of addressing the sequels of stroke.
Although there are well establish beneficial effects of timely and continuous

Wearable Sensor System for Human Motion Analysis
115
managed rehabilitation (Tate, 2006), there is a clear need to improve its
quantity, quality and overall effectiveness.
A crucial aspect guiding physiotherapist's clinical reasoning, and thus
design of rehabilitation intervention, is the assessment of motor performance.
According to some authors (Evers et al., 2004), implementing therapeutical
programs requires accurate clinical and field measurements based on motor
pattern identification not readily available from traditional tools. Standardized
clinical motor assessments rely on physiotherapists observational skills, which
as necessary as it may be considered, remains insufficient for reliable
measurement of certain quantitative features (e.g., intersegment coordination,
quality of movement and smoothness). Moreover, observation-based
assessment is subject to observer error and personal bias and is limited to the
human visual perception, just to mention some of the most common handicaps.
The Rivermead Motor Assessment (RMA) (Adams, Pickering, Ashburn, &
Lincoln, 1997), Fugl-Meyer Motor Assessment (FMA) (Fugl-Meyer, Jaasko,
Leyman, Olsson, & Steglind, 1975), Postural Assessment Scale for Stroke patient
(PASS) (Benaim, Pérennou, Villy, Rousseaux, & Pelissier, 1999) and Reaching
Performance Scale (RPS) (Levin, Desrosiers, Beauchemin, Bergeron, &
Roschette, 2004) are examples of viable and considered reliable instruments
commonly used in physiotherapy.
The FMA evaluates 33 items related to movements of the proximal and
distal parts of the arm and the total score ranges from 0 to 66. A maximum score
of 66 corresponds to typical motor function and clinical subdivision; while cases
that score between 50–63 correspond to mild-to-moderate motor impairment;
between 46-50 to a moderate (gross and some fine movement) to severe (gross
motor function only) motor impairment (Fugl-Meyer et al., 1975). The RPS
focuses on visual assessment of compensatory movements used during the
transport phase of reaching, defined as the beginning of the movement until the
object is grasped (Levin et al., 2004). Each component can be scored between 0
and 3, where 0 refers to maximum compensation and 3 to complete absence of
compensation. The scores of the trunk displacement, movement smoothness,
shoulder movements, elbow movements and quality of prehension components

Chapter 5 Stroke Patients Movement Analysis
116
allow for the identification of deficiencies in aspects specific to movement and
these scores in conjunction with a global score can be added for a total score
that can vary from 0 to 18, for each of the subcategories: close target and far
target (Levin et al., 2004).
In what refers to evaluation instrumentation encountered in the
laboratory environment, relevant to the field at hand, one can refer to
electromyography scans, force platforms and complex image/video analysis
systems, that introduce a degree of objectivity in the interpretation of events,
augmenting the therapist/physician perspectives in what refers to functional
and motor characterization (Gilmore & Spaulding, 2007; Lucca, 2009; Paten et
al., 2010). However, such resources accessibility in clinical environment is
scarce or null, restricting their routinely usage from clinical rehabilitation
practices.
Physiotherapists clinical practice reality, concerning data gathering and
recording, is far from being optimally effective, despite the World Confederation
for Physical Therapy guidelines and other established protocols (Bury, 2003). In
fact, this important step of the overall rehabilitation process is sometimes
neglected and when present tends to be mainly subjective and qualitative, based
on the therapist opinions and patient's provided information regarding
movement restoration and overall progress (Bury, 2003). Such record-keeping
varies from institution to institution, from therapist to therapist, and are not
necessarily updated at each session; therefore a progressive evaluation based
on such records remains subjective to the experience and interpretation of the
reader, which clearly contributes to compromise results, both in progress and
outcomes. Quantitative data records provide means for efficient and expedient
analysis of the effectiveness of a therapy on a patient's progress, which provide
a safeguard from negative activities that can go unnoted and unrecorded. Such
an approach strengthens and streamlines internal technological platforms,
expanding their coverage and added value and promoting the formulation of
standards and protocols for monitoring patient progress, thus augmenting
current guidelines.

Wearable Sensor System for Human Motion Analysis
117
5.2. Upper-Limb Movement Analysis during Reaching
The reaching gesture constitutes the most evident example of upper-
limb’s ability to organize itself in space, with specific goals, always related with
a motor concretization (Shumway-Cook et al., 2007a; Shumway-Cook et al.,
2007b). In fact, numerous daily-living activities require the coordinated action
of the upper-limb segments, in order to successfully reach the target (Bernhardt
et al., 1998; de los Reyes-Guzman et al., 2010). It is clear the importance of this
functional tasks for post-stroke patients, for restoring independence and
autonomy.
Commonly, reaching is divided in two components, the transport phase,
which involves the translation of the hand from a starting position to the
desired location; and the grasp phase, which involves hand shaping and the
manipulation of the target, according to its characteristics (Jeannerod, 1984).
Some researchers have divided the reaching movement according to postural
control demands, as follows (see Figure 56) (Cláudia Silva et al., 2014):
the first sub-phase, named as the elbow flexion phase, which
includes the period since movement initiation till the maximum of
elbow flexion; this phase requires a highly demanding proximal
postural control; and
the second sub-phase, here named as the shoulder flexion phase,
starts when the elbow reaches its maximum flexion and ends
when the target is reached; this phase is predominantly
movement demanding, especially in the shoulder joint.

Chapter 5 Stroke Patients Movement Analysis
118
Figure 56: Reaching sub-phases according to postural control demands.
The upper-limb analysis is becoming an increasingly topic of interest
among scientists and physiotherapists. Although most of the studies rely on
image-based data acquisition and analysis systems (Mendonça, Santos, & López-
Moliner, 2011; Teasell, Foley, Bhogal, & Speechley, 2003; Vandenberghe, Levin,
De Schutter, Swinnen, & Jonkers, 2010), several research is starting to be
conducted based on wearable sensors, more specifically through inertial
measurement units (Paten et al., 2010; Pérez et al., 2010; Zhou et al., 2008).
Some studies report classification algorithms of upper-limb performance (Patel
et al., 2010; Zhe, Qiang, & Ferry, 2011) while others are focus on estimating
qualitative scales scores, such as the FMA score, from accelerometry data (Del
Din, Patel, Cobelli, & Bonato, 2011).
The analysis of the reaching movement in post-stroke patients and in
healthy subjects was performed with the wearable system described previously
as W2M2. Several studies were performed in order to establish a systematic
protocol for the acquisition of inertial data and more important, to understand
the mechanisms underlined in the execution of the reaching movement, both for
post-stroke and healthy subjects. Therefore, the next sub-sections describe the
experimental procedures and results achieved in these studies. All the
participants of the studies were informed of the experimental procedures and
provided written consent in accordance with policies of the institution’s Ethics

Wearable Sensor System for Human Motion Analysis
119
Committee (see the Experimental Protocol approved by Ethics Committee in
Appendix D).
5.2.1. Inertial Measurement Units Positioning
The presence of compensatory strategies is often observed in post-stroke
subjects when attempting to reach an object. Although some controversy
remains regarding the functional benefits of compensatory movements as a way
of accomplishing a given task, studies suggest that such maladaptive strategies
may limit the plasticity of the nervous system to enhance neuro-motor recovery.
The study presented in the current section intends to aid in the development of
a system for compensatory movement detection in post-stroke patients through
accelerometry data, by analyzing the best sensor positioning for the
identification of such strategies.
Participants
The sample was composed by two post-stroke patients receiving
physiotherapy care at a rehabilitation center. Participants had to meet the
following inclusion criteria:
Confirmatory neuroimaging results of a single, unilateral stroke in
the Medial Cerebral Artery (MCA) territory, sustained at least 3
months prior;
Absence of hemispatial neglect;
Absence of major visual, perceptual or cognitive deficits,
confirmed by the mini-mental state examination (MMSE);
Active range of motion in the compromised arm of at least 15 in
the shoulder (flexion/extension; abduction/adduction and
internal/external rotation) and elbow (flexion/extension)
(Sveistrup, 2004).

Chapter 5 Stroke Patients Movement Analysis
120
Explicit exclusion criteria included cerebellar or brain stem lesions and
pain/sub-luxation in the upper-limb. Arm motor impairment was evaluated
prior to measurements, as seen on Table 10, with the arm subsection of the
Fugl-Meyer scale and the Reach Performance Scale (close target). This clinical
evaluation was performed by a team of three experienced physiotherapists with
more than 10 years of clinical practice in neurological field.
At the time of the experiment, the post-stroke patients were following
the conventional rehabilitation procedures associated with their condition,
based on the Bobath Concept principles (Raine, 2009). This is a problem-solving
approach for the assessment and treatment of individuals with disturbances of
function, movement and postural control due to a lesion of the central nervous
system (Raine, 2009) Although sitting balance was not measured directly, all
subjects were ambulatory without aids and had no difficulty in maintaining a
stable sitting posture during data collection.
Table 10: Demographic data and clinical scores of post-stroke subjects.
Subjects
A B
Age 49 47
Gender Male Female
Location of lesion LMCA RMCA
Months post-stroke 66 20
RPS score 5/18 12/18
FMA (shoulder, elbow, forearm)
4/36 20/36
FMA (wrist) 0/10 2/10
FMA (hand) 2/14 12/14
FMA (coordination) 0/6 3/6
LMCA/RMCA: Left/Right Medial Cerebral Artery RPS: Reach Performance Scale FMA: Fugl-Meyer Motor Assessment

Wearable Sensor System for Human Motion Analysis
121
Experimental Procedure
Each subject was assessed in the sitting position, with a table placed in
front of him/her, at a height corresponding to the alignment of the iliac crests.
The proximal table limit was coincident with the distal border of the subject's
knees, so as not to interfere with the arm trajectory. The subjects started the
task with approximately 0º of flexion/extension/internal rotation at the
shoulder; approximately 100º of flexion at the elbow with forearm in pronation
and the palm of the hand resting on the thigh. The subjects were instructed to
reach a target placed ipsilaterally to the upper-limb in study, in groups of three
repetitions (as to avoid variations due to fatigue) separated by one minute rest
period.
The target's placement reference was the anatomical reaching distance of
the hand, using the measured distance from the acromion to the
metacarpophalangeal joint of the thumb (Vandenberghe et al., 2010). The
individual was instructed, after verbal command, to perform reaching.
Performance was video recorded for posterior visual cross-reference.
In order to insure sensor placement repeatability, precise bone
landmarks were required. After a physiological study of the target area and
experimental trial of sensor positioning for assured subject upper-limb mobility
and comfort, the following positions were considered (see Figure 57):
P1, placed under the acromion, following the line that connects
the lateral epicondyle and the acromion;
P2, placed on the middle point between lateral epicondyle and the
acromion;
P3, immediately above lateral epicondyle, in alignment with
acromion;
P4, immediately below the lateral epicondyle, after elbow
articulation;
P5 in the trunk over the T12 vertebra.

Chapter 5 Stroke Patients Movement Analysis
122
Figure 57: Sensor positioning under consideration.
Results and Discussion
A set of accelerometry data for subjects A and P is presented in Figure 58.
The different colors represent a set of three different trials performed.
The inherent difference in acceleration amplitudes shown especially in X-
axis between subjects is related to the fact they present opposite compromise
limbs (LMCA vs. RMCA). The discussion that follows is based on the multiple
data collected from both subjects and their correspondent video records.
In relation with sensor position P1, post-stroke patients present on the
collected data, elevation and abduction of the shoulder, at the initial phase of the
movement, corroborating the visual analysis.
Position P2 exhibits an increased displacement in the anterior direction
(X-axis) when compared with P1; however there is a lack of marked differences
observed on the global pattern of the movement. Such could suggest that P2
offers more movement detection sensitivity when compared to P1. In reference
to the Y-axis, the opposite seems to occur, i.e., there is a reduced sensitivity for
such detection when compared with P1, in both cases.

Wearable Sensor System for Human Motion Analysis
123
Figure 58: Accelerometry data for Subject A and B for locations P1, P2, P3, P4 and P5.

Chapter 5 Stroke Patients Movement Analysis
124
Sensor position P3 shows some variability among the patients. The
movement in the anterior direction (X-axis), performed by subject A is more
pronounced when compared with P1; in turn, for subject B this movement is
better detected when compared to both P1 and P2. A similar situation occurs in
the remaining movements, i.e. superior direction (Y-axis) and lateral direction
(Z-axis). Subject B presents no pronounced differences among the sensor
position P1, P2 and P3 for the lateral direction. This could be explained by lack
of evident movement component recruitment as compensation during the
functional task.
Given the localization of position P4, there exists a need for redefining
the detected movement components by each of the axis. Thus, the movement in
the anterior-posterior direction is now captured by the Y-axis, and the superior-
inferior direction by the X-axis, remaining the Z-axis capturing the lateral
movements. Subject A, does not present a significant elevation component (X-
axis), which could be related with the deficit to enlist selective flexion of the
elbow. Subject B presents an increase elevation component, resulting from an
improved shoulder-elbow interjoint coordination, being able to perform
selective flexion of the elbow as an integrating part of the movement pattern.
Some evidences exist thus, that sensor position P1 presents increased
commitment between movement detection in the superior direction
(identification of shoulder elevation as compensation) and an inter-patient
variability; however a larger number of measurements and varied sample size
would be required for such validation.
Finally, as for sensor position P5, one verifies that such position offers
increased reproducibility among trials, while presenting reduced acceleration
variations (less than 0.1 g in most cases), translating into a reduced movement
of the trunk, especially in the superior-inferior direction (Y-axis). Some
anterior-posterior movement (Z-axis) and rotation (X-axis) are present, which
behave as compensations, given the reduced capacity of enlisting shoulder
flexion with elbow extension (extensor synergy); implying a displacement of the
trunk as attempting to reach the target. Subject B presents increased anterior-

Wearable Sensor System for Human Motion Analysis
125
posterior displacement of the trunk when compared to subject A. The presence
of a larger compensation at this level, in a clinically less affected individual,
could be related to its fully completion of the functional task.
Data analysis seems to suggest that the P1 position is advantageous for
compensatory movement detection at the shoulder level, being however
necessary to complement with information provided by P5, in order to
discriminate between shoulder or trunk elevation. The information provided by
sensor locations P2 and P3 do not seem to add relevant knowledge to that
provided by sensor position P1. The P4 position seems the most appropriate for
detecting the abduction component of the limb; however, in relation with the
superior-inferior movement, this particular sensor position is insufficient for
determination of the corporal segment where the elevation occurs
(shoulder/elbow/trunk), limiting its reliability for compensatory movement
identification in this direction. Finally, sensor position P5 presents a good
sensitivity for anterior-posterior movement and rotation detection. Table 11
summarizes the sensitivity of each position for the detection of compensatory
movements: anterior-posterior (A-P), superior-inferior (S-I) and medial-lateral
(M-L). A growing sensitivity scale ranging from 1 to 3 was used for the
characterization by a team of physiotherapists.
Table 11: Sensitivity descriptive analysis of movement components for sensor locations.
Subject A Subject B
A-P S-I M-L A-P S-I M-L
P1 1 3 1 1 3 2
P2 2 1 1 2 2 2
P3 2 2 2 2 2 2
P4 2 2 3 2 2 3
P5 3 3 3 3 3 3
A-P: Anterior-Posterior; S-I: Superior-Inferior; M-L: Medial-Lateral

Chapter 5 Stroke Patients Movement Analysis
126
5.2.2. Compensatory Movements Detection in Post-Stroke
Subjects
Following the initial results described above, an in-depth analysis of
upper-limb movement of post-stroke patients during reaching was performed,
in order to identify compensatory strategies and to extract quantitative
parameters that allow describing the behaviour of such movements.
Participants
The sample was composed by four post-stroke patients receiving
physiotherapy care at a rehabilitation center. Participants had to meet the same
inclusion criteria as the ones described in the previous study. In addition,
exclusion criteria included cerebellar or brain stem lesions and pain/sub-
luxation in the upper-limb.
Arm motor impairment was evaluated prior to measurements, as seen on
Table 12, with the arm subsection of the Fugl-Meyer scale and the Reach
Performance Scale (close target).
Experimental Procedure
The experimental procedure followed the protocol described in the
previous study: each subject was assessed in the sitting position, with a table
placed in front of them; the table limit was coincident with the distal border of
the subject's thigh, so as not to interfere with the arm trajectory. The individual
was instructed, after verbal command, to perform the functional task.

Wearable Sensor System for Human Motion Analysis
127
Table 12: Demographic data and clinical scores of post-stroke patients.
Subjects
A B C D
Age 64 47 53 49
Gender Male Female Female Male
Location of lesion LMCA RMCA LMCA LMCA
Months post-stroke 19 20 34 66
RPS score 7/18 12/18 8/18 5/18
FMA (shoulder, elbow, forearm)
8/36 20/36 17/36 4/36
FMA (wrist) 1/10 2/10 2/10 0/10
FMA (hand) 6/14 12/14 10/14 2/14
FMA (coordination) 1/6 3/6 4/6 0/6
LMCA/RMCA: Left/Right Medial Cerebral Artery RPS: Reach Performance Scale FMA: Fugl-Meyer Motor Assessment
Following the results described in the previous study, the positions
chosen for the present study were as follows (Figure 59):
P1, placed under the acromion, following the line that connects
the lateral epicondyle and the acromion;
P2, immediately below the lateral epicondyle, after elbow
articulation;
P3, in the trunk over the T12 vertebra.

Chapter 5 Stroke Patients Movement Analysis
128
Figure 59: Sensor positioning.
Results and Discussion
The data collected from the inertial units was post-processed using a 50-
point symmetrical moving average filter in order to attenuate dynamic
acceleration and artifacts. The generated accelerometry profile provided a
visual representation of the completed functional task, which can be associated
with angular displacement using the same principles defined for swimming
performance analysis (Section 4.2), i.e. assuming a low-acceleration patterns.
A set of signals from the accelerometers positioned at positions P1, P2,
and P3 for a reference subject are presented in Figure 60. Similarly,
accelerometry data were recorded from post-stroke patients referred to as A
(Figure 61), B (Figure 62), C (Figure 63), and D (Figure 64) for all mentioned
positions. In Figures 60-64, the solid lines represent the processed signal, the
black dashed lines represent the plus/minus envelope signals, and the gray
dashed lines represent the maximum, minimum, and mean values of the
processed signal. Each position has its corresponding acceleration graphs
(measured in g) presenting information for all 3 axes. In general, the subjects
present a proximal to distal sequence of muscular requirement, varying degrees
of deficit of elbow extension, and trunk recruitment for task completion.

Wearable Sensor System for Human Motion Analysis
129
Figure 60: Accelerometry data for subject without pathology in positions P1, P2 and P3.
Figure 61: Accelerometry data for subject A in positions P1, P2 and P3.

Chapter 5 Stroke Patients Movement Analysis
130
Figure 62: Accelerometry data for subject B in positions P1, P2 and P3.
Figure 63: Accelerometry data for subject C in positions P1, P2 and P3.

Wearable Sensor System for Human Motion Analysis
131
Figure 64: Accelerometry data for subject D in positions P1, P2 and P3.
Table 13 summarizes the observations extracted from the data collected,
direct observation, and corresponding video records.
Table 13: Summary of accelerometry profiles observations.
X-axis Y-axis Z-axis Movement
Compensations
P1
Shoulder angular
displacement on the anterior/
posterior direction
Shoulder angular
displacement on the superior/
inferior direction
Shoulder angular
displacement on the
medial/lateral direction
Shoulder abduction and
elevation*
P2
Forearm angular
displacement information on the superior-
inferior direction
Forearm angular
displacement information on
the anterior-posterior direction
Forearm angular
displacement information
lateral movement
Lack of elbow extension and
shoulder abduction
P3 Trunk rotation
Trunk angular displacement on
the superior/ inferior
direction
Trunk angular displacement on
the anterior/ posterior direction
Forward dislocation and trunk rotation
* Needs confirmation with additional information from P3

Chapter 5 Stroke Patients Movement Analysis
132
For instance, trunk compensation, either through forward displacement
or rotation, can be well detected by data collected from accelerometers at
position P3. At this location, the reference subject’s accelerometry data reveal
small variations during the entire movement, caused by small shifts in the
center of mass. In contrast, stroke patients show a perceived displacement of
the trunk: an upper movement to assist with the forearm elevation and a
forward displacement and rotation to compensate for lack of full elbow
extension.
In general, the differences observed in the accelerometry profiles can be
related to the presence of compensatory movements. For instance, stroke
survivor subjects’ Y-axis profiles at position P1 (which are clearly dissimilar
from the corresponding reference profile because of the presence of a double
bell shape for subjects A, B, and C and an asymmetrical bell shape for subject D)
can be attributed to a shoulder and possible trunk compensatory elevation. Care
must be taken when extracting quantifiers, because they could ignore specific
maladaptive behaviors. For instance, subject B presented a strong tremor when
approaching the press target, which can be observed by a noticeable pseudo-
envelope deviation near the 40% mark for the X- and Z-axes of position P2. Such
tremor is indicative of a lack of proper muscular organization to complete the
task and can be monitored by measuring the magnitude of the deviation.
Table 14 summarizes some quantifiers extracted from the generated
accelerometry profiles, including variations on the different axes (relatable to
maximum angular displacement), mean comparability factor, repeatability
factor, and average execution time.
The mean comparability factor was obtained, for position P1 and P2,
through a standard normalized zero-lag cross-correlation between a reference
vector and vectors generated by the grouping of centered (offset removed)
accelerometry data of all axes. Because of the reduced variations of the signals
for position P3, the offset removal was not performed prior to the cross-
correlation calculation.

Wearable Sensor System for Human Motion Analysis
133
The repeatability factor, presented in Table 14, represents a measure of
consistency of the subject’s movement components while performing the
functional task. This measure was calculated based on a repeatability index
applied in gait analysis (Bravo, Salazar, Basso, & Borges, 2012), analogous to the
American National Standards Institute procedure for obtaining a repeatability
index for industrial robots (Jeswiet & Helferty, 1995). Equation 28 was used for
the factor calculation where n = 100 (representing the length of the data that
was time normalized) and i = 3 (representing the number of repetitions), for the
present cases.
zyx
k
niki
iki dllFlF
n
,,2
0minmax
1ityRepeatabil (28)
where i
kF is the k component of the ith repetition and k ∈ {x, y, z}.
Overall analysis of the acceleration variations shows that for certain
scenarios, post-stroke subjects recruit additional degrees of freedom for task
completion when compared with the reference signals. For instance, the Y-axis
delta values at P1 and Z-axis delta values at P2 are consistent with observed
excessive elevation and abduction of the shoulder performed by the patients.
The mean comparability and repeatability factors for P1 are consistent with the
FMA and RPS overall scores; however, positions P2 and P3 are more sensitive to
the specific recruited strategies of each individual and permit some insight on
the performance of the elbow and trunk regions, respectively.
As with most indicators, the presented quantifiers should be analyzed in
context, because the data obtained from a subject could be misconstrued as
being associated with a process of motor refinement when, in reality, it may
represent a maladaptive behavior. A particular case occurred for subject D.
Although his FMA and RPS scores showed that subject D was the most impaired
patient, he presented high comparability and consistency compared with the
rest of the group. A possible explanation is the extension of his post-stroke
period (the patient experienced his stroke almost 6 years before study) and his
severe biomechanical impairments at the arm’s joints and at soft tissues levels,

Chapter 5 Stroke Patients Movement Analysis
134
which compromised his ability to successfully accomplish the task. The
anticipation of task failure had accustomed the patient to avoid recruiting
additional degrees of freedom (observed on the delta information for positions
P1 and P2), thus forcing him to incorporate a maladaptive behavior to his
reaching approach (which with time has become consistent).
Table 14: Extracted quantifiers from accelerometry profiles.
Subjects
A B C D Ref
P1
Avg. ΔX-axis (g) 0.39 0.17 0.21 0.14 0.21
Avg. ΔY-axis (g) 0.42 0.25 0.20 0.26 0.22
Avg. ΔZ-axis (g) 0.42 0.24 0.20 0.25 0.28
Mean Comparability Factor
0.13 0.27 0.26 0.72 0.98
Repeatability Factor
13.89 3.63 6.54 3.83 2.47
P2
Avg. ΔX-axis (g) 0.23 0.45 0.32 0.17 0.23
Avg. ΔY-axis (g) 0.50 0.62 0.35 0.31 0.57
Avg. ΔZ-axis (g) 0.53 0.37 0.45 0.45 0.33
Mean Comparability Factor
0.47 0.60 0.34 0.69 0.98
Repeatability Factor
5.85 10.65 11.36 6.34 6.34
P3
Avg. ΔX-axis (g) 0.09 0.08 0.11 0.09 0.04
Avg. ΔY-axis (g) 0.03 0.02 0.17 0.02 0.01
Avg. ΔZ-axis (g) 0.23 0.22 0.23 0.09 0.01
Mean Comparability Factor
0.99 0.99 0.96 0.99 0.99
Repeatability Factor
4.76 5.57 2.59 1.83 1.27
Average Time (sec) 12.60 5.62 7.02 3.15 3.56

Wearable Sensor System for Human Motion Analysis
135
5.2.3. Analysis of Postural Control during Reaching in Healthy vs.
Post-Stroke Subjects through Inertial Data
For a proper performance during the reaching task, it is crucial to have
an adequate trunk stability in order to ensure a proper control and coordination
all the segments involved in the task. Therefore, it is of paramount importance
to understand the biomechanical mechanisms behind the trunk motor control,
since a good relationship between postural control and movement control leads
to a smooth interaction among all the segments (Bartolo, Don, Ranavolo, Serrao,
& Sandrini, 2009). During the reaching task, and when the target is properly
distant from the subject, it is expected that the trunk does not contribute with
additional degrees of freedom to accomplish the task with success
(Archambault, Pigeon, Feldman, & Levin, 1999). After a lesion of the MCA not
only the movement of the subject might be affect but also the postural control
can be compromised (Robertson & Roby-Brami, 2011).
In order to study the trunk behaviour during the reaching task, the
W2M2 system was used to perform a quantitative comparison of trunk
movement between healthy subjects and post-stroke patients. Kinematic
parameters were extracted from accelerometry data, namely movement
duration and trunk displacement, both the anterior-posterior and the medial-
lateral movements. These parameters were chosen following the results
obtained in the previous studies, specifically the compensatory strategies at
trunk level, observed in stroke survivors when executing the reaching task.
Participants
The sample was composed by a group of eight post-stroke patients
receiving physiotherapy care at a rehabilitation center and a group of ten
healthy subjects. For the healthy group inclusion, subjects were above 45 years
old. Exclusion criteria comprised musculoskeletal pathology, neck and/or
upper-limb pain, cerebellar, basal ganglia or brain stem lesions, and a Mini
Mental State Examination score below 25. The sample characterization is shown
in Table 15.

Chapter 5 Stroke Patients Movement Analysis
136
Table 15: Study sample characterization.
Healthy Subjects
Post-Stroke Subjects
n Female 5 4
Male 5 4
Average Age 49.30±4.24 55.38±4.63
Average Body Mass Index
24.6±3.62 26.52±3.52
Post-stroke patients had to meet the following inclusion criteria:
Confirmatory neuroimaging results of a single, unilateral stroke in
the MCA territory, sustained at least 6 months prior;
Absence of hemispatial neglect;
Score between 30 and 50 of the Fugl-Meyer Assessment Scale
(moderately impaired) (Scheidt & Stoeckmann, 2007);
Absence of major visual, perceptual or cognitive deficits,
confirmed by the mini-mental state examination (MMSE);
Active range of motion in the compromised arm of at least 15 in
the shoulder (flexion/extension; abduction/adduction and
internal/external rotation) and elbow (flexion/extension)
(Sveistrup, 2004).
Explicit exclusion criteria included cerebellar or brain stem lesions and
pain/sub-luxation in the upper-limb. Post-stroke group characterization,
namely age, gender, body mass index (BMI) location of lesion and FMA score,
can be seen on Table 16.

Wearable Sensor System for Human Motion Analysis
137
Table 16: Post-stroke group characterization
Subjects Age/
Gender BMI
Location of lesion
FMA score
A 57/Female 19.48 RMCA 32
B 54/Male 23.81 LMCA 32
C 55/Female 27.41 LMCA 35
D 54/Male 30.12 LMCA 45
F 66/Male 28.37 LMCA 32
G 53/Male 25.28 LMCA 42
H 53/Female 28.91 LMCA 43
I 51/Female 28.80 RMCA 45
BMI: Body Mass Index LMCA/RMCA: Left/Right Medial Cerebral Artery FMA: Fugl-Meyer Motor Assessment
Experimental Procedure
The acquisition method followed the protocol described in the previous
studies: each subject was assessed in the sitting position, with a table placed in
front of them; the table limit was coincident with the distal border of the
subject's thigh, so as not to interfere with the arm trajectory (see Figure 65).
The individual was instructed, after verbal command, to perform the functional
task.
In order to investigate the upper-trunk movement, the W2M2 device was
placed over the T3 vertebra. At this point, trunk displacements, either in the
anterior-posterior or medial-lateral directions are maximized (Lima, 2013).
Both contralesional and ipsilesional movements were studied in comparison
with the performance of typical subjects, since there are evidences that lesions
of the MCA at sub-cortical levels can interfere bilaterally (A. Silva et al., 2012; C.
Silva et al., 2014). Moreover, the movement was investigated in two different

Chapter 5 Stroke Patients Movement Analysis
138
movement planes, namely in the shoulder plane and the scapula plane, as both
planes represent the typical scenarios for the reaching task to occur in daily-life
activities (C. Silva et al., 2014).
A module with a capacitive touch sensor module was added to the W2M2
device, in order to determine automatically the movement duration: one touch
pad was placed at the subject’s thigh while the other was located at the target.
Figure 65: Sensor location for the study of postural control.
Results and Discussion
The data collected from the inertial unit was post-processed using a 50-
point symmetrical moving average filter in order to attenuate dynamic
acceleration and artifacts. The movement duration for post-stroke subjects,
both for the ipsilesional and contralesional limbs, and for healthy subjects,
specifically for the dominant limb, on the two planes of movement studied, is
present in Figure 66.
As expected, post-stroke subjects perform a longer reaching movement
with the contralesional limb when compared with the dominant limb of healthy
subjects, both in the shoulder and scapula planes. Moreover, the movement time
of the ipsilesional side was also longer than the dominant side, suggesting
poorer performance.

Wearable Sensor System for Human Motion Analysis
139
Figure 66: Movement duration for the ipsilesional and contralesional limbs of post-stroke subjects and for the dominant limb of healthy subjects in the (a) shoulder plane and (b)
scapula plane.
According to the reference frame presented in Figure 65, the angular
displacements around the Y-axis, representing the pitch angle, correspond to
medial-lateral movements of the trunk. The results of pitch variation during the
reaching movement for post-stroke subjects (ipsilesional and contralesional
limbs) and healthy subjects (dominant limb) on the shoulder and scapula planes
are shown in Figure 67.
Figure 67: Pitch variation for the ipsilesional and contralesional limbs of post-stroke subjects and for the dominant limb of healthy subjects in the (a) shoulder plane and (b)
scapula plane.

Chapter 5 Stroke Patients Movement Analysis
140
It can be clearly seen that in post-stroke subjects the trunk displacement
in the medial-lateral direction is higher when the movement is performed with
the contralesional limb, as other studies report (Michaelsen, Luta, Roby-Brami,
& Levin, 2001; Robertson & Roby-Brami, 2011). In addition, the movement
variability is significantly higher in post-stroke subjects than in healthy subjects.
It should be mentioned that the movement at this location (upper-trunk) is also
associated with shoulder elevation. In fact, the differences shown in Figure 67
reveal the excessive trunk and shoulder movements performed by the post-
stroke subjects when attempting to reach the target, which is directly related
with strategies adopted by the patients to compensate the lack of movement,
specially the elbow extension. It can also be noted that, similarly to the results
presented above, the ipsilesional limb shows a higher trunk movement when
compared to healthy subjects. This reinforces the hypothesis that this limb
might be also compromised in terms of performance.
The information about the roll angle (around the X-axis) can be
associated with movements in the anterior-posterior direction. The variations
of the roll angle during the reaching movement for post-stroke subjects
(ipsilesional and contralesional limbs) and healthy subjects (dominant limb) on
the shoulder and scapula planes are shown in Figure 68.
Figure 68: Roll variation for the ipsilesional and contralesional limbs of post-stroke subjects and for the dominant limb of healthy subjects in the (a) shoulder plane and (b)
scapula plane.

Wearable Sensor System for Human Motion Analysis
141
The trunk displacement in the anterior-posterior direction is higher in
post-stroke subjects than healthy subjects. Nevertheless, this difference is not as
higher when compared to the medial-lateral displacement. In fact, although
post-stroke subjects exhibit a higher variability than healthy subjects, the
amplitude of movement is not significantly different. This can might be related
with some sloppiness showed by healthy subjects when performing the task. In
truth, the called “healthy” subjects sometimes also demonstrate a poor postural
control and post-stroke subjects can sometimes reveal better trunk stabilization
(especially those moderately impaired) than healthy subjects due to their
rehabilitation intervention.
When looking at the two planes of movement studied, it can be seen that
there is an increased trunk displacement, both in the medial-lateral and
anterior-posterior directions, when the movement is performed in the shoulder
plane. This indicates that in this plane, the demands in terms of postural control
represent a higher challenge for the subjects.
At this point, it seems pertinent to question the pre-conceived idea that
only the contralesional limb of post-stroke subjects is affected by the lesion. The
results seem to reveal that the performance of the ipsilesional limb is worst
when compared to the dominant limb of healthy subjects. Some recent studies
have reported results that corroborate this hypothesis, either for the upper-
limb movement or lower-limb movement (A. Silva et al., 2012; C. Silva et al.,
2014).
5.3. Summary
The leading method for the acquisition and analysis of motor behavior of
post-stroke subjects, namely through kinematic parameters, is based on video
systems. Nevertheless, the need for a portable, easy-to-use and functional
device that allows for a continuous monitoring of human movement has placed
wearable inertial sensors at the top of the solutions.

Chapter 5 Stroke Patients Movement Analysis
142
The use of wearable systems allowed to bring together physiotherapist,
engineers and technology. Currently, these devices can be relatively easy to
incorporate in physiotherapists’ activities and helping them with their clinical
reasoning process. In this way, an objective quantitative analysis can be done
about the motor performance of post-stroke subjects and their evolution.
In order to create new quantitative scales, it is important to understand
how the information from inertial sensors can be useful. The studies described
in the previous sections attempted to establish methods to analyze upper-limb
performance during the reaching task, provide quantifiers to characterize the
movement and better understand specific behaviors of post-stroke subjects,
namely the study of their postural control.
The results of the first study allowed the definition of a method/protocol
for the acquisition and analysis of upper-limb movement during reaching,
specifically the optimal placement of sensor units for the identification of
compensatory movements. With this previous knowledge, it was possible to
identify compensatory strategies adopted by post-stroke subjects that allowed
them to accomplish the task. In addition, movement quantifiers, such as
repeatability and comparability factor, were extracted from accelerometry
profiles. Finally, it was possible to compare the postural control of post-stroke
subjects with healthy subjects by studying the trunk displacement during the
reaching task. The excessive trunk displacement observed is post-stroke
subjects can be associated with a compensation for the lack of their motor
functions resulting from the lesion, such as elbow extension. Moreover, it could
be noted that also the ipsilesional limb of post-stroke subjects showed
evidences of a poorer performance when compared with healthy subjects,
suggesting that the ipsilesional side might also be affected. Nevertheless, it
should be taken into account that the studies described in the previous sections
are limited by the small number of participants. Given the deviations found for
some movement parameters, it would be desirable to have studies with a larger
sample, or perform a higher number of repetitions among each subject, since
variability among post-stroke subjects is expected to be large.

CHAPTER 6
DISCUSSION, CONCLUSIONS AND
FUTURE WORK


Wearable Sensor System for Human Motion Analysis
145
6.1. Overall Discussion
Until recent years most research involving the capture and analysis of
biomechanical or physiological signals have been limited to a laboratory or
otherwise controlled environment. Wearable technologies introduced a
refinement to personal signal capturing by permitting a long-term on-person
approach. Long-term, objective measurements under daily-life unsupervised
conditions are the key benefits of wearable sensor systems.
Inertial sensors are suitable sensors for wearable systems since current
enhancements in MEMS technology have made possible the manufacture of
miniaturized, low power, low cost devices which are useful for logging human
motion data for long periods of time in uncontrolled environments. Therefore,
wearable systems comprising inertial sensors can clearly introduce a very good
trade-off between mobility and ease-of-use in terms of power consumption,
autonomy, placement, patient compliance and data analysis. The ultimate
wearable system proposed hereby, named W2M2, was based on a modular
approach, where several sensor modules can be assembled and used together to
extract meaningful information according to the application requirements.
Instead of a complex sensor system, the key aspect of this system was to
combine functionality and usability in a simple wearable solution. Along with
simplicity comes small size and weight, which are crucial features when
referring to wearable technology and sensor integration. This system has
introduced a significant improvement with respect to the first one, called WIMU.
In fact, its versatility, robustness and higher sampling rate have allowed to
overcome some hurdles experienced during the acquisitions with the WIMU
prototype.
With respect to fiber optic sensors, at the moment, very few research and
scarce industrial efforts were found on wearable applications of fiber optic
components, whereas wearable electronics have been studied for some years
and some industry is developing. Through a development of all the components
required for fiber optic sensor systems, some of sensors could become more

Chapter 6 Discussion, Conclusions and Future Work
146
suitable for wearable applications. Especially, size and weight of the
components could be reduced and connection methods improved. In the
simplest example, a macrobending sensor should sense straight bending of a
fabric, and in this case, it could be easily integrated into fabric. The proof-of-
concept study on fiber optic sensor based on macrobending effect presented in
this thesis has introduced a new thinking about wearable sensors and their
functionality. Tough it might be an initial prototype, it has revealed the
potentialities of such sensors to monitor human motion in real-time by means of
angular displacements. The extraction of this direct measure could represent an
important contribution for data fusion algorithms, since it can be combined with
the information retrieved from inertial sensors, for instance, to optimize their
readings and reduce inherent drift errors. There are a couple of fabric
manufacturing processes compatible with optical fibers. However, the special
strategy adopted for the integration of the macrobending sensor into the fabric
has ensured a controlled movement for the optical fiber, improving reliability,
repeatability and functionality of the sensor.
An increasingly important aspect of a wearable system is to have an
intelligent monitoring device capable of providing real-time (or “valuable-time”)
processing and feedback to patients, clinicians, athletes and healthy subjects.
However, there are a number of obstacles that must be overcome to fully
implement such wearable systems, including high-costs for end-users, energy
consumption, sensors integration and connectivity, autonomy, reliability,
security and, ultimately, ethics, laws and privacy issues.
Wearability and power consumption are fundamental parameters to take
into account in the design. A low-power design becomes relevant in order to
obtain sufficient battery life and to reduce both battery size and weight.
Wireless connectivity represents a significant improvement on wearability, but
it would also represent a significant increase in power consumption. Even so,
the ZigBee protocol used in this research has proven to provide a reliable low-
power connection with a great deal of flexibility in network connection.
Although low-power strategies should be adopted, the design of the device
should not be a reflection of obsessive power consumption pursue, but instead

Wearable Sensor System for Human Motion Analysis
147
should represent a good compromise between functionality, size, usability and
autonomy.
The leading method for swimming analysis is based on image processing
of video data. Nonetheless, there are some hurdles to overcome due to time-
consuming setup and data processing procedures and also due to water
interference at the air-water interface. The wearable system proposed here can
be the solution for such drawbacks. The experiences developed with swimming
athletes have demonstrated that inertial sensors can provide meaningful
information about swimmers’ performance through the extraction of angular
displacements (pitch and roll) and temporal parameters (lap time, stroke
duration and frequency). Moreover, different swimming styles can be
differentiated by analyzing acceleration profiles.
Nonetheless, the system and algorithms for the extraction of
biomechanical parameters in swimming can be improved in order to overcome
some of the difficulties encountered. Specifically, when referring to feedback for
the swimmer, it is of paramount importance that the system is capable of
providing noteworthy information in “valuable-time” that permits the athlete to
correct or maintain chosen strategies. In addition, the ability to obtain
performance measures for every training session, creating an electronic training
diary, could be used to assess training loads or the effectiveness of an
intervention. This has significant potential benefits for athletes where detailed
performance assessment may be restricted because of distance, cost, or
resource accessibility.
While fiber optic sensors are being reported as sensing tools in
healthcare, namely to measure human joint angles and physiological
parameters, no literature exists regarding its use in swimming analysis.
Curiously, the underwater environment, with its special conditions, is one of the
scenarios where the use of optical sensors would have more advantages.
Post-stroke rehabilitation is dictated by subjective analysis based on the
therapist’s personal experience and patients’ needs, leading to a biased and
sometimes incomplete perception. During the rehabilitation process, therapists

Chapter 6 Discussion, Conclusions and Future Work
148
analyze patient’s movements, motor learning processes and evaluate motor-
control neurophysiology. Such is achieved through visual observation, patient
provided information and personal handling capabilities, which can introduce
misreading and affect the patient’s potential for recovering. Qualitative scales
can be replaced by quantifiable measurements, which can be stored, shared and
processed, in order to extend the current understanding of human response and
adaptation to physical compromise.
The use of wearable systems such as the one proposed in this thesis can
allow the extraction of key parameters that can help therapists and physicians
with their clinical reasoning process. The pilot-studies described in the previous
chapter have introduced systematic means for the assessment of such
measures. The information extracted from inertial sensors can in fact be used to
create new quantitative scales, based on objective kinematic measures.
Moreover, the capability to identify compensatory movements performed by
post-stroke patients is of paramount importance for the therapist to understand
the strategies adopted by their patients.
Wearable systems may not only be used to aid directly in the
rehabilitation process. In fact, the information retrieved from inertial sensors
can be used by academics to unveil and clarify some hypothesis concerning
stroke survivors’ movements. For instance, it has been hypothesized by some
researches (A. Silva et al., 2012; C. Silva et al., 2014) that post-stroke subjects
present a postural control dysfunction also in the ipsilesional body side. The results
of accelerometry data of the study presented in the previous chapter have
strengthened this hypothesis.
However, it is still early to establish a simple and straightforward
comparison between accelerometry profiles, because a large number of
subjects, both pathological as nonpathological, would need to be assessed
before proper validation is achieved. Despite this, it is important to be aware that
gathering a sample as homogeneous as possible within post-stroke population is
clearly a challenge. Moreover, a larger sample might not solve the large deviations,
since variability is a common feature of post-stroke population. Nevertheless, the
data extracted from the wearable system revealed the potential to

Wearable Sensor System for Human Motion Analysis
149
quantitatively characterize the functional movement and establish parameters
that complement observations from physiotherapists to determine
compensatory behavior and proper behavioral progression.
6.2. Conclusions and Future Work
Wearable sensors are an integral part of future pervasive, ubiquitous and
individual-centered motion analysis.
The inertial wearable system proposed in this research was based on a
modular approach, which allows the integration of multiple sensors, both
electrical and optical, in a truly functional device. Although this system was
primarily used for swimming performance analysis and post-stroke upper-limb
rehabilitation monitoring, its flexibility and adaptability allow its usage in a
number of monitoring purposes. The development of a new fiber optic sensor
based on macrobending effect has introduced a breakthrough in wearable
sensor technology. The initial results have demonstrated its potential to
complement, and even replace, traditional electrical sensors with a more robust
solution. Not only the fiber optic sensor could be used as a sensing element, but
it could also serve as data transmission channel.
The results obtained during the experiments in swimming and
rehabilitation have demonstrated that this system represents a good alternative
to conventional motion acquisition systems. Moreover, in applications where
traditional methods, such as video-based systems, are not able to provide exact
and reliable data (due to markers loss or interferences, for instance) this
wearable systems can act as a complement to fill such gaps.
Though some advances may take place in the field of sensors technology
(textile, electrical or optical) and actuators, future challenges include the
integration of wearable systems into sensor-enhanced information systems and
evaluation studies involving measures of patients/athletes acceptance.
In the field of swimming performance analysis, the outcomes achieved
during the research initiated a new era of movement analysis based on

Chapter 6 Discussion, Conclusions and Future Work
150
wearable inertial data acquisition. Nonetheless, there is room for future
expansion in the wearable system proposed, given the transmission losses due
to water interference. In fact, wireless transmission could be improved by
adopting strategies such as new antennas operating at different frequency
bands or floating transmission modules. In addition, feedback strategies can be
introduced in the wearable system to assist swimmers to define proper
movements.
The presented accelerometry profiles and quantifiers obtained for post-
stroke patients will facilitate establishing quantifiable methodologies and
protocols to assess patients’ evolution and status. In addition, the data gathering
outside clinical environment can give therapists useful information for their
clinical reasoning process. In this manner, the wearable system could be used as
a part of a home-based rehabilitation monitoring platform, assisting therapists
to establish effective and efficient rehabilitation methodologies.
As with most thesis, the research work seems to never end and, although
the wide scope of this investigation demands for a large number of topics to be
studied, there are main key aspects that are relevant to highlight as future work:
Development of data fusion algorithms to integrate data from
fiber optic sensors;
Feedback system, either through visual markers or auditive
signals, about performance status and progression;
Method to automatically differentiate between swimming
athletes’ level and swimming techniques;
Definition of a typical pattern of the reaching functional task;
Development of quantitative scales based on the quantifiers
extracted from the wearable system to characterize post-stroke
subjects’ motor performance.

REFERENCES


Wearable Sensor System for Human Motion Analysis
153
. ±1.5g - 6g Three Axis Low-g Micromachined Accelerometer (2008). In F. S. Inc. (Ed.), (pp. 8).
Abbosh, A. M., James, D., & Thiel, D. V. (2010, 11-17 July 2010). Compact UHF antenna in aquatic environments for mobile sporting applications. Paper presented at the IEEE Antennas and Propagation Society International Symposium (APSURSI).
Achache, V., Mazevet, D., Iglesias, C., Lackmy, A., Nielsen, J. B., Katz, R., & Marchand-Pauvert, V. (2010). Enhanced spinal excitation from ankle flexors to knee extensors during walking in stroke patients. Clin Neurophysiol, 121(6), 930-938. doi: 10.1016/j.clinph.2009.12.037
Adams, S. A., Pickering, R. M., Ashburn, A., & Lincoln, N. B. (1997). The scalability of the Rivermead Motor Assessment in nonacute stroke patients. Clin Rehabil, 11(1), 52-59.
Aguiló, A., Martinez, P., Buades, J. M., Perales, F. J., & Gonzaléz, M. (2004). Human motion analysis and synthesis using graphical biomechanics models applied to disable swimming people. Paper presented at the 3rd International Workshop on Virtual Rehabilitation, Lausanne, Switzerland.
Allsop, T., Carroll, K., Lloyd, G., Webb, D. J., Miller, M., & Bennion, I. (2007). Application of long-period-grating sensors to respiratory plethysmography. J. Biomed Opt, 12(6).
Allsop, T., Reeves, R., Webb, D. J., Bennion, I., Earthrowl, T., Jones, B., & Miller, M. (2005). Respiratory monitoring using fibre long period grating sensors. Paper presented at the Proc. SPIE
Archambault, P., Pigeon, P., Feldman, A. G., & Levin, M. F. (1999). Recruitment and sequencing of different degrees of freedom during pointing movements involving the trunk in healthy and hemiparetic subjects. Exp Brain Res, 126(1), 55-67.
Augousti, A. T., Maletras, F.-X., & Mason, J. (2005). The use of a figure-of-eight coil for fibre optic respiratory plethysmography: geometrical analysis and experimental characterisation. Optical Fiber Technology, 11(4), 246-360.
Bächlin, M., Förster, K., & Tröster, G. (2009). SwimMaster: a wearable assistant for swimmer. Paper presented at the 11th International Conference on Ubiquitous Computing, Orlando, USA.
Bächlin, M., & Tröster, G. (2011). Swimming performance and technique evaluation with wearable acceleration sensors. Pervasive and Mobile Computing. doi: 10.1016/j.pmcj.2011.05.003
Bae, J., & Tomizuka, M. (2013). A tele-monitoring system for gait rehabilitation with an inertial measurement unit and a shoe-type ground reaction force sensor. Mechatronics, 23(6), 646-651. doi: http://dx.doi.org/10.1016/ j.mechatronics.2013.06.007

References
154
Baluta, S. (2009). A Guide to using IMU (Accelerometer and Gyroscope Devices) in Embedded Applications. 2011, from http://www.starlino.com/ imu_guide.html
Bamberg, S. M., Benbasat, A. Y., Scarborough, D. M., Krebs, D. E., & Paradiso, J. A. (2008). Gait Analysis Using a Shoe-Integrated Wireless Sensor System. IEEE Transactions on Information Technology in Biomedicine, 12(4), 413-423. doi: 10.1109/titb.2007.899493
Barbosa, T., Fernandes, R., Morouco, P., & Vilas-boas, J. (2008). Predicting the intra-cyclic variation of the velocity of the centre of mass from segmental velocities in butterfly stroke: a pilot study. Journal of Sports Science & Medicine, 7, 201-209.
Bartolo, M., Don, R., Ranavolo, A., Serrao, M., & Sandrini, G. (2009). Kinematic and neurophysiological models: future applications in neurorehabilitation. J Rehabil Med, 41(12), 986-987. doi: 10.2340/16501977-0413
Bell, J. A., & Stigant, M. (2008). Validation of a fibre-optic goniometer system to investigate the relationship between sedentary work and low back pain. International Journal of Industrial Ergonomics, 38(11–12), 934-941. doi: http://dx.doi.org/10.1016/j.ergon.2008.02.005
Benaim, C., Pérennou, D. A., Villy, J., Rousseaux, M., & Pelissier, J. Y. (1999). Validation of a Standardized Assessment of Postural Control in Stroke Patients: The Postural Assessment Scale for Stroke Patients (PASS). Stroke, 30(9), 1862-1868. doi: 10.1161/01.str.30.9.1862
Bergmann, J. H. M., Mayagoitia, R. E., & Smith, I. C. H. (2010). A portable system for collecting anatomical joint angles during stair ascent: a comparison with an optical tracking device. Journal for the motion-capture community, (1).
Bilro, L., Alberto, N., Pinto, J. L., & Nogueira, R. (2012). Optical Sensors Based on Plastic Fibers. Sensors, 12(9), 12184-12207.
Bilro, L., Pinto, J. L., Oliveira, J., & Nogueira, R. (2008, 26-29 Oct. 2008). Gait monitoring with a wearable plastic optical sensor. Paper presented at the 2008 IEEE Sensors.
Bravo, R. J., Salazar, A. J., Basso, D. M., & Borges, C. M. (2012). Propuesta preliminary de un índice de consistencia para patrones de cinemática de marcha humana. Paper presented at the Cong. Vzla. Bioeng. BIOVEN, Venezuela.
Brigante, C. M. N., Abbate, N., Basile, A., Faulisi, A. C., & Sessa, S. (2011). Towards Miniaturization of a MEMS-Based Wearable Motion Capture System. IEEE Transactions on Industrial Electronics, 58(8), 3234-3241.
Bury, T. (2003). Primary Health Care and Comunity Based Rehabilitation (pp. 12-16): World Confederation for Physical Therapy.

Wearable Sensor System for Human Motion Analysis
155
Ceseracciu, E., Sawacha, Z., Fantozzi, S., Cortesi, M., Gatta, G., Corazza, S., & Cobelli, C. (2011). Markerless analysis of front crawl swimming. Journal of Biomechanics, 44(12), 2236-2242. doi: 10.1016/j.jbiomech. 2011.06.003
Chan, M., Estève, D., Fourniols, J.-Y., Escriba, C., & Campo, E. (2012). Smart wearable systems: Current status and future challenges. Artificial Intelligence in Medicine, 56(3), 137-156. doi: http://dx.doi.org/ 10.1016/j.artmed.2012.09.003
Corazza, S., Gambaretto, E., Mundermann, L., & Andriacchi, T. P. (2010). Automatic Generation of a Subject-Specific Model for Accurate Markerless Motion Capture and Biomechanical Applications. Biomedical Engineering, IEEE Transactions on, 57(4), 806-812. doi: 10.1109/TBME.2008.2002103
Coyle, S., King-Tong, L., Moyna, N., O'Gorman, D., Diamond, D., Di Francesco, F., . . . Bini, C. (2010). BIOTEX: Biosensing Textiles for Personalised Healthcare Management. IEEE Transactions on Information Technology in Biomedicine, 14(2), 364-370.
Cunha, J. P. S., Cunha, B., Pereira, A. S., Xavier, W., Ferreira, N., & Meireles, L. (2010, 22-25 March 2010). Vital-Jacket<sup>®</sup>: A wearable wireless vital signs monitor for patients' mobility in cardiology and sports. Paper presented at the 4th International Conference on Pervasive Computing Technologies for Healthcare.
D'Angelo, L. T., Weber, S., Honda, Y., Thiel, T., Narbonneau, F., & Luth, T. C. (2008, 20-25 Aug. 2008). A system for respiratory motion detection using optical fibers embedded into textiles. Paper presented at the 30th Annual International Conference of the IEEE Engineering in Medicine and Biology Society, EMBS 2008.
da Silva, A. F., Goncalves, A. F., Mendes, P. M., & Correia, J. H. (2011). FBG Sensing Glove for Monitoring Hand Posture. IEEE Sensors Journal, 11(10), 2442-2448.
Dalton, A., Khalil, H., Busse, M., Rosser, A., van Deursen, R., & ÓLaighin, G. (2013). Analysis of gait and balance through a single triaxial accelerometer in presymptomatic and symptomatic Huntington's disease. Gait & Posture, 37(1), 49-54. doi: http://dx.doi.org/10.1016/j.gaitpost.2012.05.028
Daukantas, S., Marozas, V., Lukosevicius, A., Jegelevicius, D., & Kybartas, D. (2011, 15-17 Sept. 2011). Video and inertial sensors based estimation of kinematical parameters in swimming sport. Paper presented at the IEEE 6th International Conference on Intelligent Data Acquisition and Advanced Computing Systems (IDAACS).
Davé, D. (2009). Phase Sensitive Interferometry for Biosensing Applications. In A. Rasooly & K. Herold (Eds.), Biosensors and Biodetection (Vol. 503, pp. 179-187): Humana Press.

References
156
Davey, N., Anderson, M., & James, D. A. (2008). Validation trial of an accelerometer-based sensor platform for swimming. Sports Technology, 1(4-5), 202-207.
Davis, C. M. (1995). Fiber Optic Sensing: An Overview. SPIE MS108, 12-16.
De Jonckheere, J., Narbonneau, F., D'Angelo, L. T., Witt, J., Paquet, B., Kinet, D., . . . Logier, R. (2010, 1-3 July 2010). FBG-based smart textiles for continuous monitoring of respiratory movements for healthcare applications. Paper presented at the 12th IEEE International Conference on e-Health Networking Applications and Services (Healthcom).
De Jonckheere, J., Narbonneau, F., Jeanne, M., Kinet, D., Witt, J., Krebber, K., . . . Logier, R. (2009, 3-6 Sept. 2009). OFSETH: Smart medical textile for continuous monitoring of respiratory motions under magnetic resonance imaging. Paper presented at the Annual International Conference of the IEEE Engineering in Medicine and Biology Society, EMBC 2009.
Del Din, S., Patel, S., Cobelli, C., & Bonato, P. (2011). Estimating Fugl-Meyer clinical scores in stroke survivors using wearable sensors. Conf Proc IEEE Eng Med Biol Soc, 2011, 5839-5842. doi: 10.1109/iembs.2011.6091444
Dobkin, B. (2004). Strategies for stroke rehabilitation. Lancet Neurol, 3, 528-536.
Donno, M., Palange, E., Di Nicola, F., Bucci, G., & Ciancetta, F. (2008). A New Flexible Optical Fiber Goniometer for Dynamic Angular Measurements: Application to Human Joint Movement Monitoring. IEEE Transactions on Instrumentation and Measurement, 57(8), 1614-1620.
Dopsaj, M., Matkovic, I., & Zdravkovic, I. (2000). The relationship between 50m-freestyle results and characteristics of tethered forces in male sprint swimmers: a new approach to tethered swimming test. Physical Education and Sport, 1(7), 15-22.
Dunne, L. E., Walsh, P., Smyth, B., & Caulfield, B. (2006, 11-14 Oct. 2006). Design and Evaluation of a Wearable Optical Sensor for Monitoring Seated Spinal Posture. Paper presented at the 10th IEEE International Symposium on Wearable Computers.
Efendioglu, H. S., Sahin, A. K., Yildirim, T., & Fidanboylu, K. (2011, 15-18 June 2011). Design of a hetero-core smart fiber optic microbend sensor. Paper presented at the International Symposium on Innovations in Intelligent Systems and Applications (INISTA).
Esfandyari, J., Bendiscioli, P., & Xu, G. (2011). MEMS sensors for advance mobile applications - An overview. Communications DesignLine.
Esfandyari, J., Mascotto, M., & Xu, G. (2010). MEMS Pressure Sensors in Pedestrian Navigation. Sensors.
Evers, S. M., Struijs, J. N., Ament, A. J., van Genugten, M. L., Jager, J. H., & van den Bos, G. A. (2004). International comparison of stroke cost studies. Stroke, 35(5), 1209-1215. doi: 10.1161/01.str.0000125860.48180.48

Wearable Sensor System for Human Motion Analysis
157
Favero, F. C., Villatoro, J., & Pruneri, V. (2012). Microstructured optical fiber interferometric breathing sensor. Journal of Biomedical Optics, 17(3), 0370061-0370065. doi: 10.1117/1.JBO.17.3.037006
Frazao, O. (2009). Sensores em Fibra Óptica Baseados em Interferometria e Efeitos Não-Lineares. (PhD), Universidade do Porto, Porto.
Fugl-Meyer, A. R., Jaasko, L., Leyman, I., Olsson, S., & Steglind, S. (1975). The post-stroke hemiplegic patient. A method for evaluation of physical performance. . Scand J Rehab Med, 7, 13-31.
Gardner, W. B. (1975). Microbending loss in optical fibers The Bell System Technical Journal, 54(2), 457-465.
Geiser, W. P. (1999). USA Patent No. Free Patents Online.
Gilmore, P., & Spaulding, S. (2007). Motor learning and the use of videotape feedback after stroke. Top stroke rehabil, 14(5), 28-36.
Gourgoulis, V., Aggeloussis, N., Kasimatis, P., Vezos, N., Boli, A., & Mavromatis, G. (2008). Reconstruction accuracy in underwater three-dimensional kinematic analysis. J Sci Med Sport, 11(2), 90-95. doi: 10.1016/j.jsams.2007.02.010
Grattan, K. T. V., & Sun, T. (2000). Fiber optic sensor technology: an overview. Sensors and Actuators A: Physical, 82(1–3), 40-61. doi: http://dx.doi.org/10.1016/S0924-4247(99)00368-4
Grillet, A., Kinet, D., Witt, J., Schukar, M., Krebber, K., Pirotte, F., & Depre, A. (2008). Optical Fiber Sensors Embedded Into Medical Textiles for Healthcare Monitoring. IEEE Sensors Journal, 8(7), 1215-1222.
Gu, B., Yin, M.-J., Zhang, A. P., Qian, J.-W., & He, S. (2009). Low-cost high-performance fiber-optic pH sensor based on thin-core fiber modal interferometer. Optics Express, 17(25), 22296-22302. doi: 10.1364/OE.17.022296
Gurkan, D., Starodubov, D., & Xiaojing, Y. (2005, Oct. 30 2005-Nov. 3 2005). Monitoring of the heartbeat sounds using an optical fiber Bragg grating sensor. Paper presented at the IEEE Sensors Journal.
Hagem, R. M., Thiel, D. V., O'Keefe, S. G., Wixted, A., & Fickenscher, T. (2011, 28-31 Oct. 2011). Low-cost short -range wireless optical FSK modem for swimmers feedback. Paper presented at the 2011 IEEE Sensors.
Hagema, R. M., Haelsig, T., O’Keefe, S. G., Stamm, A., Fickenscher, T., & Thiel, D. V. (2013). Second Generation Swimming Feedback Device Using a Wearable Data Processing System based on Underwater Visible Light Communication. Procedia Engineering, 60(0), 34-39. doi: http://dx.doi.org/10.1016/j.proeng.2013.07.065
Hao, J., Jayachandran, M., Kng, P., Foo, S., Aung Aung, P., & Cai, Z. (2010). FBG-based smart bed system for healthcare applications. Frontiers of Optoelectronics in China, 3(1), 78-83. doi: 10.1007/s12200-009-0066-0

References
158
Holthe, M. J., & McLean, S. P. (2001). Kinematic comparison of grab and track starts in swimming. Paper presented at the XIX International Society of Biomechanics in Sport Symposium, San Francisco, USA.
. IDG-300 Dual-Axis Gyroscope Evaluation Board Specification (2007). In I. InvenSense (Ed.).
James, D. A., Burkett, B., & Thiel, D. V. (2011). An unobtrusive swimming monitoring system for recreational and elite performance monitoring. Procedia Engineering, 13(0), 113-119. doi: 10.1016/j.proeng.2011.05.060
James, D. A., Davey, N., & Rice, T. (2004). An accelerometer based sensor platform for insitu elite athlete performance analysis. Paper presented at the Proceedings of IEEE Sensors, 2004.
James, D. A., Galehar, A., & Thiel, D. V. (2010). Mobile sensor communications in aquatic environments for sporting applications. Procedia Engineering, 2(2), 3017-3022. doi: 10.1016/j.proeng.2010.04.104
Jeannerod, M. (1984). The timing of natural prehension movements. J Mot Behav, 16(3), 235-254.
Jeong-Whan, L., Lee-Yon, H., Jae-Hoon, J., Kang-Hwi, L., Kyeong-Seop, K., Dong-Jun, K., & Kyung-Ho, K. (2006). A Simple Optical Angular Sensors to Measure the Human Joint Angle. Paper presented at the International Joint Conference SICE-ICASE.
Jeswiet, J., & Helferty, R. (1995). Measuring robot repeatability an application of ISO and ANSI standards. Advanced Robotics, 10(5), 503-520.
Keir, M. S., Hann, C. E., Chase, J. G., & Chen, X. Q. (2007). A New Approach to Accelerometer-based Head Tracking for Augmented Reality. Paper presented at the IEEE International Conference on Automation Science and Engineering, CASE 2007.
Khoo, B. H., Lee, B. K. J., Senanayake, S. M. N. A., & Wilson, B. D. (2009, 14-17 July 2009). System for determining within-stroke variations of speed in swimming (SWiSS). Paper presented at the IEEE/ASME International Conference on Advanced Intelligent Mechatronics 2009.
Kim Doang, N., Chen, I. M., Zhiqiang, L., Song Huat, Y., & Duh, H. B. L. (2011). A Wearable Sensing System for Tracking and Monitoring of Functional Arm Movement. IEEE/ASME Transactions on Mechatronics, 16(2), 213-220.
Knorr, B., Hughes, R., Sherrill, D., Stein, J., Akay, M., & Bonato, P. (2005). Quantitative Measures of Functional Upper Limb Movement in Persons after Stroke. Paper presented at the 2nd International IEEE EMBS Conference on Neural Engineering.
Kreber, K. (2013). Smart Technical Textiles Based on Fiber Optic Sensors. In S. W. Harun & H. Arof (Eds.), Current Developments in Optical Fiber Technology (pp. 319-344).
Krohn, D. A. (2000). Fiber Optic Sensors: Fundamentals and Applications (Third ed.). USA: Instrument Society of America.

Wearable Sensor System for Human Motion Analysis
159
Kwang Yong, L., Goh, F. Y. K., Wei, D., Kim Doang, N., Chen, I. M., Song Huat, Y., . . . Chung Gon, K. (2008, 19-23 May 2008). A wearable, self-calibrating, wireless sensor network for body motion processing. Paper presented at the IEEE International Conference on Robotics and Automation, ICRA 2008.
Kyoobin, L., & Dong-Soo, K. (2001, 2001). Wearable master device using optical fiber curvature sensors for the disabled. Paper presented at the Proceedings of the IEEE International Conference on Robotics and Automation.
Lai, D. T. H., Begg, R. K., & Palaniswami, M. (2009). Computational Intelligence in Gait Research: A Perspective on Current Applications and Future Challenges. IEEE Transactions on Information Technology in Biomedicine, 13(5), 687-702.
Lapadatu, D. (2009). Microsensors. Paper presented at the Third STIMESI Workshop on MEMS and Microsystems, Prague, Czech Republic.
Lauer, J., Figueiredo, P., Vilas-Boas, J. P., Fernandes, R. J., & Rouard, A. H. (2013). Phase-dependence of elbow muscle coactivation in front crawl swimming. Journal of Electromyography and Kinesiology, 23(4), 820-825.
Le Sage, T., Bindel, A., Conway, P., Justham, L., Slawson, S., & West, A. (2010). Development of a real time system for monitoring of swimming performance. Procedia Engineering, 2(2), 2707-2712. doi: 10.1016/j.proeng.2010.04.055
Lee, B. (2003). Review of the present status of optical fiber sensors. Optical Fiber Technology, 9(2), 57-79. doi: http://dx.doi.org/10.1016/S1068-5200(02)00527-8
Leung, A., Shankar, P. M., & Mutharasan, R. (2007). A review of fiber-optic biosensors. Sensors and Actuators B: Chemical, 125(2), 688-703. doi: http://dx.doi.org/10.1016/j.snb.2007.03.010
Levin, M. F., Desrosiers, J., Beauchemin, D., Bergeron, N., & Roschette, A. (2004). Development and Validation of a Scale for Rating Motor Compensations Used for Reaching Patients With Hemiparesis: The Reaching Performance Scale. Physical Therapy, 84(1), 8-22.
Lima, S. O. (2013). Controlo postural do tronco durante o gesto de alcance - análise do deslocamento tri-dimensional em indivíduos saudáveis e pós-AVE. (Master Thesis), Instituto Politécnico do Porto, Porto.
Lin, J. F. S., & Kulić, D. (2012). Human pose recovery using wireless inertial measurement units. Physiological Measurement, 33(12), 2099.
Lomer, M., Quintela, A., López-Amo, M., Zubia, J., & López-Higuera, J. M. (2007). A quasi-distributed level sensor based on a bent side-polished plastic optical fibre cable. Measurement Science and Technology, 18, 2261-2267.

References
160
Lopez, A. D., Mathers, C. D., Ezzati, M., Jamison, D. T., & Murray, C. J. (2006). Global and regional burden of disease and risk factors, 2001: systematic analysis of population health data. Lancet, 367(9524), 1747-1757. doi: 10.1016/s0140-6736(06)68770-9
Lucca, L. (2009). Virtual reality and motor rehabilitation of the upper limb after stroke: a generation of progress? J Rehabili Med, 41, 1003-1006.
Luprano, J., Sola, J., Dasen, S., Koller, J. M., & Chetelat, O. (2006). Combination of body sensor networks and on-body signal processing algorithms: the practical case of MyHeart project. Paper presented at the International Workshop on Wearable and Implantable Body Sensor Networks, BSN 2006.
Lymberis, A., & Dittmar, A. (2007). Advanced Wearable Health Systems and Applications - Research and Development Efforts in the European Union. IEEE Engineering in Medicine and Biology Magazine, 26(3), 29-33.
Maluf, N. (2004). An Introduction to Microelectromechanical Systems Engineering. Norwood, USA: Artech House, Inc.
Mathew, J., Semenova, Y., & Farrell, G. (2012). A miniature optical breathing sensor. Biomedical Optics Express, 3(12), 3325-3331.
Mendonça, C., Santos, J., & López-Moliner, J. (2011). The benefit of multisensory integration with biological motion signals. Experimental Brain Research, 213(2-3), 185-192. doi: 10.1007/s00221-011-2620-4
Michaelsen, S. A., Luta, A., Roby-Brami, A., & Levin, M. F. (2001). Effect of trunk restraint on the recovery of reaching movements in hemiparetic patients. Stroke, 32, 1875-1883.
Milot, M. H., Nadeau, S., Gravel, D., & Requiao, L. F. (2006). Bilateral level of effort of the plantar flexors, hip flexors, and extensors during gait in hemiparetic and healthy individuals. Stroke, 37(8), 2070-2075. doi: 10.1161/01.STR.0000229900.88186.1a
Minami, A., Horikawa, T., Ohkubo, T., Kobayashi, K., Watanabe, K., & Kurihara, Y. (2010, 18-21 Aug. 2010). A study on gait analysis by measuring axis rotation based on 3D magnetic and acceleration sensors. Paper presented at the Proceedings of SICE Annual Conference 2010.
Mishra, V., Singh, N., Tiwari, U., & Kapur, P. (2011). Fiber grating sensors in medicine: Current and emerging applications. Sensors and Actuators A: Physical, 167(2), 279-290. doi: 10.1016/j.sna.2011.02.045
Mizuike, C., Ohgi, S., & Morita, S. (2009). Analysis of stroke patient walking dynamics using a tri-axial accelerometer. Gait & Posture, 30(1), 60-64. doi: http://dx.doi.org/10.1016/j.gaitpost.2009.02.017
Morouço, P., Lima, A. B., Semblano, P., Fernandes, D., Sousa, F., Fernandes, R., Vilas-Boas, J. P. (2006). Validation of a cable speedometer for butterfly evaluation. Revista Portuguesa de Ciências do Desporto, 6, 236-239.

Wearable Sensor System for Human Motion Analysis
161
Morrey, B. F., Askew, L. J., & Chao, E. Y. (1981). A biomechanical study of normal functional elbow motion. The Journal of Bone & Joint Surgery, 63(6), 872-877.
Morris, S. J. (2004). A Shoe-Integrated Sensor System for Wireless Gait Analysis and Real-Time Therapeutic Feedback. (Doctor of Science in Medical Engineering), Massachussetts Institute of Technology (MIT).
Munoz, R., Leija, L., Diaz, F., & Alvarez, J. (1995, 20-23 Sep 1995). 3D continuous monitoring system for localization of upper limb based on optical fiber. Paper presented at the IEEE 17th Annual Conference Engineering in Medicine and Biology Society.
Ng, Y. S., Stein, J., Ning, M., & Black-Schaffer, R. M. (2007). Comparison of Clinical Characteristics and Functional Outcomes of Ischemic Stroke in Different Vascular Territories. Stroke, 38(8), 2309-2314. doi: 10.1161/strokeaha.106.475483
Nishijima, M., Sasaki, H., & Watanabe, K. (2007). Restraint-free wearable sensing clothes using a hetero-core optic fiber for measurements of arm motion and walking action. Paper presented at the Sensors and Smart Structures Technologies for Civil, Mechanical, and Aerospace Systems, San Diego, California.
Nishiyama, M., Sasaki, H., & Watanabe, K. (2006, 22-25 Oct. 2006). Wearable Sensing Clothes Embedding a Hetero-core Optic Fiber for Recognizing Arm Segment Posture and Motion. Paper presented at the 5th IEEE Conference on Sensors.
Nishiyama, M., & Watanabe, K. (2009). Wearable Sensing Glove With Embedded Hetero-Core Fiber-Optic Nerves for Unconstrained Hand Motion Capture. IEEE Transactions on Instrumentation and Measurement, 58(12), 3995-4000.
Nitschke, J. E., Nattrass, C. L., Disler, P. B., Chou, M. J., & Ooi, K. T. (1999). Reliability of the American Medical Association guides' model for measuring spinal range of motion. Its implication for whole-person impairment rating. Spine (Phila Pa 1976), 24(3), 262-268.
Noury, N., Dittmar, A., Corroy, C., Baghai, R., Weber, J. L., Blanc, D., . . . Comet, B. (2004). VTAMN - A Smart Clothe for Ambulatory Remote Monitoring of Physiological Parameters and Activity. Paper presented at the Engineering in Medicine and Biology Society, 2004. IEMBS '04. 26th Annual International Conference of the IEEE.
Oh, J. K., Sung-Jung, C., Won-Chul, B., Wook, C., Eunseok, C., Jing, Y., . . . Dong Yoon, K. (2004). Inertial sensor based recognition of 3-D character gestures with an ensemble classifiers. Paper presented at the Ninth International Workshop on Frontiers in Handwriting Recognition.
Ohgi, Y. (2002, 2002). Microcomputer-based acceleration sensor device for sports biomechanics -stroke evaluation by using swimmer's wrist acceleration. Paper presented at the Proceedings of IEEE Sensors.

References
162
Pandian, P. S., Mohanavelu, K., Safeer, K. P., Kotresh, T. M., Shakunthala, D. T., Gopal, P., & Padaki, V. C. (2008). Smart Vest: Wearable multi-parameter remote physiological monitoring system. Medical Engineering & Physics, 30(4), 466-477.
Pansiot, J., King, R. C., McIlwraith, D. G., Lo, B., & Guang-Zhong, Y. (2008, 1-3 June 2008). ClimBSN: Climber performance monitoring with BSN. Paper presented at the Medical Devices and Biosensors, 2008. ISSS-MDBS 2008. 5th International Summer School and Symposium on.
Pansiot, J., Lo, B., & Guang-Zhong, Y. (2010, 7-9 June 2010). Swimming Stroke Kinematic Analysis with BSN. Paper presented at the International Conference on Body Sensor Networks (BSN).
Paradiso, R., Belloc, C., Loriga, G., & Taccini, N. (2005). Wearable HealthCare Systems: New Frontiers of e-Textile. Studies in Health Technology and Informatics, 117, 9-16.
Patel, S., Hughes, R., Hester, T., Stein, J., Akay, M., Dy, J. G., & Bonato, P. (2010). A Novel Approach to Monitor Rehabilitation Outcomes in Stroke Survivors Using Wearable Technology. Proceedings of the IEEE, 98(3), 450-461. doi: 10.1109/JPROC.2009.2038727
Paten, S., Hughes, R., Hester, T., Stein, J., Akay, M., Dy, J., & Bonato, P. (2010). Tracking Motor Recovery in Stroke Survivors Undergoing Rehabilitation Using Wearable Technology. Paper presented at the 32nd Annual International Conference of the IEEE EMBS, Buenos Aires, Argentina.
Pedley, M. (2013). High Precision Calibration of a Three-Axis Accelerometer (pp. 4-15): Freescale Semiconductor.
Pendergast, D., Termin, A., & Zaharkin, J. (1999). USA Patent No. Free patents online: WIPO.
Pérez, R., Costa, Ú., Torrent, M., Solana, J., Opisso, E., Cáceres, C., . . . Gómez, E. J. (2010). Upper Limb Portable Motion Analysis System Based on Inertial Technology for Neurorehabilitation Purposes. Sensors, 10(12), 10733-10751.
Pleros, N., Kanellos, G. T., & Papaioannou, G. (2009, 4-7 Nov. 2009). Optical fiber sensors in orthopedic biomechanics and rehabilitation. Paper presented at the 9th International Conference on Information Technology and Applications in Biomedicine, ITAB 2009.
Podbreznik, P., Đonlagić, D., Lešnik, D., Cigale, B., & Zazula, D. (2013). Cost-efficient speckle interferometry with plastic optical fiber for unobtrusive monitoring of human vital signs. Journal of Biomedical Optics, 18(10), 107001-107001. doi: 10.1117/1.JBO.18.10.107001
Raine, S. (2009). The Bobath concept: developments and current theoretical underpinning. In Raine, Meadows & Lynch-Ellerington (Eds.), Bobath Concept – Theory and clinical practice in neurological rehabilitation: Wiley-Blackwell.

Wearable Sensor System for Human Motion Analysis
163
Raman, K. (2010). Chapter 10 - Principles of Optical Fiber Grating Sensors Fiber Bragg Gratings (Second Edition) (pp. 441-502). Boston: Academic Press.
Rantala, J., Hannikainen, J., & Vanhala, J. (2011). Fiber optic sensors for wearable applications. Personal Ubiquitous Comput., 15(1), 85-96. doi: 10.1007/s00779-010-0303-y
Ride, J., Ringuet, C., Rowlands, D., Lee, J., & James, D. (2013). A Sports Technology Needs Assessment for Performance Monitoring in Swimming. Procedia Engineering, 60(0), 442-447. doi: http://dx.doi.org/10.1016/ j.proeng.2013.07.072
Rienzo, M. D., Rizzo, F., Parati, G., Brambilla, G., Ferratini, M., & Castiglioni, P. (2005). MagIC System: a New Textile-Based Wearable Device for Biological Signal Monitoring. Applicability in Daily Life and Clinical Setting. Paper presented at the 27th Annual International Conference of the Engineering in Medicine and Biology Society, IEEE-EMBS 2005.
Robertson, J. V., & Roby-Brami, A. (2011). The trunk as a part of the kinematic chain for reaching movements in healthy subjects and hemiparetic patients. Brain Res, 1382, 137-146. doi: 10.1016/j.brainres.2011.01.043
Rocha, L. A. (2010). MEMS Sensors and Actuators: Silicon Transduction Techniques (pp. 79). Porto, Portugal: Faculdade de Engenharia, Universidade do Porto.
Roriz, P., Frazão, O., Lobo-Ribeiro, A. B., Santos, J. L., & Simões, J. A. (2013). Review of fiber-optic pressure sensors for biomedical and biomechanical applications. Journal of Biomedical Optics, 18(5), 050903-050903. doi: 10.1117/1.JBO.18.5.050903
Salazar, A. J., Silva, A. S., Silva, C., Borges, C. M., Correia, M. V., Santos, R. S., & Vilas-Boas, J. P. (2014). Low-cost wearable data acquisition for stroke rehabilitation: a proof of concept study on accelerometry for functional task assessment. Topics in Stroke Rehabilitation, 21(1), 12-22.
Salychev, O. S. (2004). Applied Inertial Navigation: Problems and Solutions. Moscow, Russia: BMSTU Press.
Sant'Anna, A., Wickstro, x, & m, N. (2009, 1-3 April 2009). Developing a motion language: Gait analysis from accelerometer sensor systems. Paper presented at the 3rd International Conference on Pervasive Computing Technologies for Healthcare.
Scapellato, S., Cavallo, F., Martelloni, C., & Sabatini, A. M. (2005). In-use calibration of body-mounted gyroscopes for applications in gait analysis. Sensors and Actuators A: Physical, 123-124, 418-422. doi: 10.1016/j.sna.2005.03.052
Scheidt, R. A., & Stoeckmann, T. (2007). Reach adaptation and final position control amid environmental uncertainty after stroke. J Neurophysiol, 97(4), 2824-2836. doi: 10.1152/jn.00870.2006

References
164
Schleihauf, R. E., Gray, L., & DeRose, J. (1983). Three-dimensional analysis of hand propulsion in the sprint front crawl stroke. In A. P. Hollander, P. A. Huijing & G. De Groot (Eds.), Biomechanics and medicine in swimming (pp. 173-183). Campaign: Human Kinetics Publishers.
Schmitt, K., Schirmer, B., Hoffmann, C., Brandenburg, A., & Meyrueis, P. (2007). Interferometric biosensor based on planar optical waveguide sensor chips for label-free detection of surface bound bioreactions. Biosensors and Bioelectronics, 22(11), 2591-2597. doi: http://dx.doi.org/10.1016/j.bios.2006.10.016
Seifert, L., Chollet, D., & Bardy, B. G. (2004). Effect of swimming velocity on arm coordination in the front crawl: a dynamic analysis. Journal of Sports Sciences, 22(7), 651-660. doi: 10.1080/02640410310001655787
Shancang, L., Jue, W., & Xinheng, W. (2010, 6-10 Dec. 2010). A novel gait recognition analysis system based on body sensor networks for patients with parkinson's disease. Paper presented at the GLOBECOM Workshops (GC Wkshps), 2010 IEEE.
Shao, L. Y., Yin, M. J., Tam, H. Y., & Albert, J. (2012). Fiber optic pH sensor with self-assembled multilayer nanocoatings on tilted FBG.
Shelton, F. N., & Reding, M. J. (2001). Effect of lesion location on upper limb motor recovery after stroke. Stroke, 32(1), 107-112.
Shiratsu, A., & Coury, H. J. C. G. (2003). Reliability and accuracy of different sensors of a flexible electrogoniometer. Clinical Biomechanics, 18(7), 682-684. doi: http://dx.doi.org/10.1016/S0268-0033(03)00110-4
Siirtola, P., Laurinen, P., Roning, J., & Kinnunen, H. (2011, 11-15 April 2011). Efficient accelerometer-based swimming exercise tracking. Paper presented at the 2011 IEEE Symposium on Computational Intelligence and Data Mining (CIDM).
Silva, A., Sousa, A. S., Pinheiro, R., Tavares, J. M., Santos, R., & Sousa, F. (2012). Soleus activity in post-stroke subjects: movement sequence from standing to sitting. Somatosens Mot Res, 29(3), 71-76. doi: 10.3109/08990220.2012.686935
Silva, A. O. (2007). AVC. In Cofina (Ed.), O essencial da saúde (Vol. 10, pp. 5-10). Porto: Faculdade de Medicina da Universidade do Porto.
Silva, A. S., Salazar, A. J., Borges, C. M., & Correia, M. V. (2012) Wearable Monitoring Unit for Swimming Performance Analysis. Vol. 273. CCIS Lecture Notes in Computer Science (pp. 80-93). Heidelberg: Springer.
Silva, C., Silva, A., Sousa, A., Pinheiro, R., Bourlinova, C., Silva, A. S., . . . Santos, R. (2014). Co-Activation Study of Upper-Limb Muscles During Reaching in Post-Stroke Subjects. Journal of Electromyography and Kinesiology.
Silva, C., Silva, A., Sousa, A., Pinheiro, R., Bourlinova, C., Silva, A. S., . . . Santos, R. S. (2014). Co-Activation Study of Upper Limb Muscles During Reaching in Post-Stroke Subjects: an Analysis of Ipsilesional vs Contralesional Limb. Journal of Electromyography and Kinesiology. (in press)

Wearable Sensor System for Human Motion Analysis
165
Silva, H. R., Afonso, J. A., Morim, P. C., Oliveira, P. M., Correia, J. H., & Rocha, L. A. (2007). Wireless Hydrotherapy Smart-Suit Network for Posture Monitoring. Paper presented at the IEEE International Symposium on Industrial Electronics.
Slawson, S. E., Conway, P. P., Justham, L. M., & West, A. A. (2010). The development of an inexpensive passive marker system for the analysis of starts and turns in swimming. Procedia Engineering, 2(2), 2727-2733. doi: http://dx.doi.org/10.1016/j.proeng.2010.04.058
Snitzer, E. (1961). Cylindrical Dielectric Waveguide Modes. Journal of the Optical Society of America, 51(5), 491-498. doi: 10.1364/JOSA.51.000491
Soares, S. (2000). Natação. In F.-U. CMP (Ed.), Educação Física no 1º Ciclo (pp. 154-173).
Sprager, S., & Zazula, D. (2012). Heartbeat and Respiration Detection From Optical Interferometric Signals by Using a Multimethod Approach. Biomedical Engineering, IEEE Transactions on, 59(10), 2922-2929. doi: 10.1109/TBME.2012.2213302
Stamm, A., Thiel, D. V., Burkett, B., & James, D. A. (2011). Towards determining absolute velocity of freestyle swimming using 3-axis accelerometers. Procedia Engineering, 13(0), 120-125. doi: 10.1016/ j.proeng.2011.05.061
Strong, K., Mathers, C., & Bonita, R. (2007). Preventing stroke: saving lives around the world. Lancet Neurol, 6(2), 182-187. doi: 10.1016/s1474-4422(07)70031-5
Sveistrup, H. (2004). Motor rehabilitation using virtual reality. Journal of NeuroEngineering and Rehabilitation, 1(10), 1-8.
Takagi, H., Nishijima, N., Sugimoto, S., & Wilson, B. (2004). Differences in Stroke Phases, Arm-Leg Coordination and Velocity Fluctuation due to Event, Gender and Performance level in Breaststroke. Sports Biomechanics, 3(1), 15-27.
Tate, D. (2006). The state of rehabilitation research:art or science? Arch Phys Med Rehabil, 87, 160-166.
Teasell, R., Foley, N. C., Bhogal, S. K., & Speechley, M. R. ( 2003). An evidence-based review of stroke rehabilitation. Top stroke rehabil, 10(1), 29-58.
Tella, V., Toca-Herrera, J. L., Gallach, J. E., Benavent, J., González, L. M., & Arellano, R. (2008). Effect of fatigue on the intra-cycle acceleration in front crawl swimming: A time-frequency analysis. Journal of Biomechanics, 41(1), 86-92.
Thompson, K. G., MacLaren, D. P. M., Lees, A., & Atkinson, G. (2004). The effects of changing pace on metabolism and stroke characteristics during high-speed breaststroke swimming. Journal of Sports Sciences, 22(2), 149-157. doi: 10.1080/02640410310001641467

References
166
Titterton, D. H. (2007). Basic Principles of Strapdown Inertial Navegation Systems. In J. L. Weston (Ed.), Strapdown inertial navigation technology (pp. 17-57): Stevenage: Institution of Electrical Engineers.
Vandenberghe, A., Levin, O., De Schutter, D., Swinnen, S., & Jonkers, I. (2010). Three-dimensional reaching tasks: effect of reaching height and width on upper limb kinematics and muscle activity. Gait \& Posture, 32(4), 500-507.
Velasco-Garcia, M. N. (2009). Optical biosensors for probing at the cellular level: A review of recent progress and future prospects. Seminars in Cell & Developmental Biology, 20(1), 27-33. doi: http://dx.doi.org/ 10.1016/j.semcdb.2009.01.013
Veluvolu, K. C., & Ang, W. T. (2011). Estimation of Physiological Tremor from Accelerometers for Real-Time Applications. Sensors, 11(3), 3020-3036.
Wang, W.-C., Ledoux, W. R., Sangeorzan, B. J., & Reinall, P. G. (2005). A shear and plantar pressure sensor based on fiber-optic bend loss. Journal of Rehabilitation Research and Development, 42(3), 315-326.
Wehrle, G., Nohama, P., Kalinowski, H., Torres, P., & Valente, L. (2001). A fibre optic Bragg grating strain sensor for monitoring ventilatory movements. Measurement Science and Technology, 12, 805-809.
Wise, S., Gardner, W., Sabelman, E., Valainis, E., Wong, Y., Glass, K., . . . Rose, J. M. (1990). Evaluation of a fiber optic glove for semi-automated goniometer measurements. Journal of Rehabilitation Research and Development, 27(4), 411-424.
Witt, J., Krebber, K., Demuth, J., & Sasek, L. (2011, 8-10 June 2011). Fiber optic heart rate sensor for integration into personal protective equipment. Paper presented at the 2011 International Workshop on BioPhotonics.
World Health Organization. (2011). Stroke, Cerebrovascular accident. from http://www.who.int/topics/cerebrovascular_accident/en/
Xiaobin, X., Chunxi, Z., Kun Mean, H., Hao, D., & Xunming, D. (2008, 5-7 Nov. 2008). A New Wireless Fiber Optic Sensor for Monitoring Breath Motion. Paper presented at the New Technologies, Mobility and Security, 2008. NTMS '08.
Xuejin, L., Yuanlong, D., Yongqin, Y., Xinyi, W., & Jingxian, L. (2008). Microbending optical fiber sensors and their applications. Paper presented at the International Conference on Advanced Infocomm Technology, New York, USA.
Yang, S., Zhang, J.-T., Novak, A. C., Brouwer, B., & Li, Q. (2013). Estimation of spatio-temporal parameters for post-stroke hemiparetic gait using inertial sensors. Gait & Posture, 37(3), 354-358. doi: http://dx.doi.org/10.1016/j.gaitpost.2012.07.032
Yeo, T. L., Sun, T., & Grattan, K. T. V. (2008). Fibre-optic sensor technologies for humidity and moisture measurement. Sensors and Actuators A: Physical, 144(2), 280-295. doi: http://dx.doi.org/10.1016/j.sna.2008.01.017

Wearable Sensor System for Human Motion Analysis
167
Ymeti, A., Subramaniam, V., Beumer, T. A. M., & Kanger, J. S. (2007). An ultrasensitive Young interferometer handheld sensor for rapid virus detection. Expert Review of Medical Devices, 4(4), 447-454. doi: 10.1586/17434440.4.4.447
Zambrano, A., Derogarian, F., Dias, R., Abreu, M. J., Catarino, A., Rocha, A. M., . . . Velhote Correia, M. (2012). A wearable sensor network for human locomotion data capture. Stud Health Technol Inform, 177, 216-223.
Zawawi, M. A., O'Keefe, S. G., & Lewis, E. (2013). Intensity-modulated fiber optic sensor for health monitoring applications: a comparative review. Sensor Review, 33(1), 57-67.
Zendehnam, A., Mirzaei, M., Farashiani, A., & Farahani, L. H. (2010). Investigation of bending loss in a single-mode optical fibre. PRAMANA - Journal of Physics, 74(4), 591-603.
Zhang, T., Talla, S., Gong, Z., Karandikar, S., Giorno, R., & Que, L. (2010). Biochemical sensing with a polymer-based micromachined Fabry-Perot sensor. Optics Express, 18(17), 18394-18400. doi: 10.1364/OE.18.018394
Zhang, Y., Shibru, H., Cooper, K. L., & Wang, A. (2005). Miniature fiber-optic multicavity Fabry-Perot interferometric biosensor. Optics Letters, 30(9), 1021-1023. doi: 10.1364/OL.30.001021
Zhang, Z., & Grattan, K. T. V. (1998). Survey of U.S. patent activity in optical fibre sensors.
Zhe, Z., Qiang, F., & Ferry, F. (2011, 7-10 Nov. 2011). Upper limb motion capturing and classification for unsupervised stroke rehabilitation. Paper presented at the IECON 2011 - 37th Annual Conference on IEEE Industrial Electronics Society.
Zhou, H., Hu, H., & Tao, Y. (2006). Inertial measurements of upper limb motion. Medical and Biological Engineering and Computing, 44(6), 479-487. doi: 10.1007/s11517-006-0063-z
Zhou, H., Stone, T., Hu, H., & Harris, N. (2008). Use of multiple wearable inertial sensors in upper limb motion tracking. Medical Engineering & Physics, 30(1), 123-133. doi: http://dx.doi.org/10.1016/j.medengphy. 2006.11.010
Zimmerman, T. G., & Lanier, J. (1987). A hand gesture interface device. Proc. Human Factors Comput. Syst. Graph. Interface, 189–192.


APPENDIXES


Wearable Sensor System for Human Motion Analysis
III
Appendix A: Microcontroller Embedded Code
WIMU AP Board
//********************************************** // eZ430-RF2500 Sensor Access Point // // Description: This is the Access Point software for the eZ430-2500RF Sensing // //********************************************** #include "bsp.h" #include "mrfi.h" #include "bsp_leds.h" #include "bsp_buttons.h" #include "nwk_types.h" #include "nwk_api.h" #include "nwk_frame.h" #include "nwk.h" #include "msp430x22x4.h" #include "vlo_rand.h" #define MESSAGE_LENGTH 9 void TXString( char* string, int length ); void MCU_Init(void); void transmitData(int addr, signed char rssi, char msg[MESSAGE_LENGTH] ); void createRandomAddress(); // Temperature offset set at production __no_init volatile int tempOffset @ 0x10F4; // Flash address set randomly __no_init volatile char Flash_Addr[4] @ 0x10F0; //reserve space for the maximum possible peer Link IDs static linkID_t sLID[NUM_CONNECTIONS]; static uint8_t sNumCurrentPeers; // callback handler static uint8_t sCB(linkID_t); // work loop semaphores static uint8_t sPeerFrameSem; static uint8_t sJoinSem; static uint8_t sSelfMeasureSem; void main (void) { addr_t lAddr; bspIState_t intState; // Stop WDT WDTCTL = WDTPW + WDTHOLD; {
// delay loop to ensure proper startup before SimpliciTI increases DCO // This is typically tailored to the power supply used, and in this case // is overkill for safety due to wide distribution. volatile int i; for(i = 0; i < 0xFFFF; i++){} } if( CALBC1_8MHZ == 0xFF ) // Do not run if cal values are erased { volatile int i; P1DIR |= 0x03; BSP_TURN_ON_LED1(); BSP_TURN_OFF_LED2(); while(1) { for(i = 0; i < 0x5FFF; i++){} BSP_TOGGLE_LED2(); BSP_TOGGLE_LED1(); } } BSP_Init(); if( Flash_Addr[0] == 0xFF && Flash_Addr[1] == 0xFF && Flash_Addr[2] == 0xFF && Flash_Addr[3] == 0xFF ) { createRandomAddress(); // set Random device address at initial startup } lAddr.addr[0]=Flash_Addr[0]; lAddr.addr[1]=Flash_Addr[1]; lAddr.addr[2]=Flash_Addr[2]; lAddr.addr[3]=Flash_Addr[3]; SMPL_Ioctl(IOCTL_OBJ_ADDR, IOCTL_ACT_SET, &lAddr); MCU_Init(); //Transmit splash screen and network init notification // TXString( (char*)splash, sizeof splash); TXString( "\r\nInitializing Network....", 26 ); SMPL_Init(sCB); // network initialized TXString( "Done\r\n", 6); // main work loop while (1) {

Appendix A: Microcontroller Embedded Code
IV
// Wait for the Join semaphore to be set by the receipt of a Join frame from a // device that supports and End Device. if (sJoinSem && (sNumCurrentPeers < NUM_CONNECTIONS)) { // listen for a new connection SMPL_LinkListen(&sLID[sNumCurrentPeers]); sNumCurrentPeers++; BSP_ENTER_CRITICAL_SECTION(intState); if (sJoinSem) { sJoinSem--; } BSP_EXIT_CRITICAL_SECTION(intState); } // if it is time to measure our own temperature... if(sSelfMeasureSem) { char msg [6]; char addr[] = {"HUB0"}; int degC, volt; volatile long temp; int results[2]; ADC10CTL1 = INCH_10 + ADC10DIV_4; // Temp Sensor ADC10CLK/5 ADC10CTL0 = SREF_1 + ADC10SHT_3 + REFON + ADC10ON + ADC10IE + ADC10SR; for( degC = 240; degC > 0; degC-- ); // delay to allow reference to settle ADC10CTL0 |= ENC + ADC10SC; // Sampling and conversion start __bis_SR_register(CPUOFF + GIE); // LPM0 with interrupts enabled results[0] = ADC10MEM; ADC10CTL0 &= ~ENC; ADC10CTL1 = INCH_11; // AVcc/2 ADC10CTL0 = SREF_1 + ADC10SHT_2 + REFON + ADC10ON + ADC10IE + REF2_5V; for( degC = 240; degC > 0; degC-- ); // delay to allow reference to settle ADC10CTL0 |= ENC + ADC10SC; // Sampling and conversion start __bis_SR_register(CPUOFF + GIE); // LPM0 with interrupts enabled results[1] = ADC10MEM; ADC10CTL0 &= ~ENC; ADC10CTL0 &= ~(REFON + ADC10ON); // turn off A/D to save power // oC = ((A10/1024)*1500mV)-986mV)*1/3.55mV = A10*423/1024 - 278 // the temperature is transmitted as an integer where 32.1 = 321 // hence 4230 instead of 423 temp = results[0]; degC = (((temp - 673) * 4230) / 1024); if( tempOffset != 0xFFFF )
{ degC += tempOffset; } temp = results[1]; volt = (temp*25)/512; msg[0] = degC&0xFF; msg[1] = (degC>>8)&0xFF; msg[2] = volt; char temp_string[] = {" XX.XC"}; int aux = msg[0] + (msg[1]<<8); if( aux < 0 ) { temp_string[0] = '-'; aux = aux * -1; } else if( ((aux/1000)%10) != 0 ) { temp_string[0] = '0'+((aux/1000)%10); } temp_string[4] = '0'+(aux%10); temp_string[2] = '0'+((aux/10)%10); temp_string[1] = '0'+((aux/100)%10); char output_temperature[] = {"\r\nNode:XXXX,Temp:-XX.XC,Battery:X.XV"}; output_temperature[17] = temp_string[0]; output_temperature[18] = temp_string[1]; output_temperature[19] = temp_string[2]; output_temperature[20] = temp_string[3]; output_temperature[21] = temp_string[4]; output_temperature[22] = temp_string[5]; output_temperature[32] = '0'+(msg[2]/10)%10; output_temperature[34] = '0'+(msg[2]%10); output_temperature[7] = addr[0]; output_temperature[8] = addr[1]; output_temperature[9] = addr[2]; output_temperature[10] = addr[3]; TXString(output_temperature, sizeof output_temperature ); BSP_TOGGLE_LED1(); sSelfMeasureSem = 0; } // Have we received a frame on one of the ED connections? // No critical section -- it doesn't really matter much if we miss a poll if (sPeerFrameSem) { uint8_t msg[MAX_APP_PAYLOAD], len, i; // process all frames waiting for (i=0; i<sNumCurrentPeers; ++i) { if (SMPL_Receive(sLID[i], msg, &len) == SMPL_SUCCESS) {

Wearable Sensor System for Human Motion Analysis
V
ioctlRadioSiginfo_t sigInfo; sigInfo.lid = sLID[i]; SMPL_Ioctl(IOCTL_OBJ_RADIO, IOCTL_ACT_RADIO_SIGINFO, (void *)&sigInfo); transmitData( i, (signed char)sigInfo.sigInfo[0], (char*)msg ); BSP_TOGGLE_LED2(); BSP_ENTER_CRITICAL_SECTION(intState); sPeerFrameSem--; BSP_EXIT_CRITICAL_SECTION(intState); } } } } } /*--------------------------------------------------------*/ void createRandomAddress() { unsigned int rand, rand2; do { rand = TI_getRandomIntegerFromVLO(); // first byte can not be 0x00 of 0xFF } while( (rand & 0xFF00)==0xFF00 || (rand & 0xFF00)==0x0000 ); rand2 = TI_getRandomIntegerFromVLO(); BCSCTL1 = CALBC1_1MHZ; // Set DCO to 1MHz DCOCTL = CALDCO_1MHZ; FCTL2 = FWKEY + FSSEL0 + FN1; // MCLK/3 for Flash Timing Generator FCTL3 = FWKEY + LOCKA; // Clear LOCK & LOCKA bits FCTL1 = FWKEY + WRT; // Set WRT bit for write operation Flash_Addr[0]=(rand>>8) & 0xFF; Flash_Addr[1]=rand & 0xFF; Flash_Addr[2]=(rand2>>8) & 0xFF; Flash_Addr[3]=rand2 & 0xFF; FCTL1 = FWKEY; // Clear WRT bit FCTL3 = FWKEY + LOCKA + LOCK; // Set LOCK & LOCKA bit } /*------------------------------------------------------*/ void transmitData(int addr, signed char rssi, char msg[MESSAGE_LENGTH] ) { char addrString[4]; char rssiString[3]; volatile signed int rssi_int; addrString[0] = '0'; addrString[1] = '0'; addrString[2] = '0'+(((addr+1)/10)%10); addrString[3] = '0'+((addr+1)%10); rssi_int = (signed int) rssi; rssi_int = rssi_int+128;
rssi_int = (rssi_int*100)/256; rssiString[0] = '0'+(rssi_int%10); rssiString[1] = '0'+((rssi_int/10)%10); rssiString[2] = '0'+((rssi_int/100)%10); int AccX = msg[0]; int AccY = msg[1]; int AccZ = msg[2]; int VelX = msg[3]; int VelY = msg[4]; char output[] = {"\r\nNode:XXXX, AccX:x.xxV, AccY:x.xxV, AccZ:x.xxV, VelX:x.xxV, VelY:x.xxV, Time:00:00:00:000, Strength:XXX%"}; output[7] = addrString[0]; output[8] = addrString[1]; output[9] = addrString[2]; output[10] = addrString[3]; output[18] = '0' + (AccX/100)%10; output[20] = '0' + (AccX/10)%10; output[21] = '0' + (AccX%10); output[30] = '0' + (AccY/100)%10; output[32] = '0' + (AccY/10)%10; output[33] = '0' + (AccY%10); output[42] = '0' + (AccZ/100)%10; output[44] = '0' + (AccZ/10)%10; output[45] = '0' + (AccZ%10); output[54] = '0' + (VelX/100)%10; output[56] = '0' + (VelX/10)%10; output[57] = '0' + (VelX%10); output[66] = '0' + (VelY/100)%10; output[68] = '0' + (VelY/10)%10; output[69] = '0' + (VelY%10); output[78] = '0'+(msg[5]/10)%10; output[79] = '0'+(msg[5]%10); output[81] = '0'+(msg[6]/10)%10; output[82] = '0'+(msg[6]%10); output[84] = '0'+(msg[7]/10)%10; output[85] = '0'+(msg[7]%10); output[87] = '0'+(msg[8]/100)%10; output[88] = '0'+(msg[8]/10)%10; output[89] = '0'+(msg[8]%10); output[101] = rssiString[2]; output[102] = rssiString[1]; output[103] = rssiString[0]; TXString(output, sizeof output ); } /*--------------------------------------------------*/ void TXString( char* string, int length ) { int pointer; for( pointer = 0; pointer < length; pointer++) {

Appendix A: Microcontroller Embedded Code
VI
volatile int i; UCA0TXBUF = string[pointer]; while (!(IFG2&UCA0TXIFG)); // USCI_A0 TX buffer ready? } } /*------------------------------------------------------*/ void MCU_Init() { BCSCTL1 = CALBC1_8MHZ; // Set DCO DCOCTL = CALDCO_8MHZ; BCSCTL3 |= LFXT1S_2; // LFXT1 = VLO TACCTL0 = CCIE; // TACCR0 interrupt enabled TACCR0 = 65000; // ~5 sec TACTL = TASSEL_1 + MC_1; // ACLK, upmode P3SEL |= 0x30; // P3.4,5 = USCI_A0 TXD/RXD UCA0CTL1 = UCSSEL_2; // SMCLK UCA0BR0 = 0x41; // 9600 from 8Mhz UCA0BR1 = 0x3; UCA0MCTL = UCBRS_2; UCA0CTL1 &= ~UCSWRST; // **Initialize USCI state machine** IE2 |= UCA0RXIE; // Enable USCI_A0 RX interrupt __enable_interrupt(); } /*------------------------------------------------------------ * Runs in ISR context. Reading the frame should be done in the application thread not in the ISR thread. ----------------*/
static uint8_t sCB(linkID_t lid) { if (lid) { sPeerFrameSem++; } else { sJoinSem++; } // leave frame to be read by application. return 0; } /*------------------------------------------------------------------ADC10 interrupt service routine------------*/ #pragma vector=ADC10_VECTOR __interrupt void ADC10_ISR(void) { __bic_SR_register_on_exit(CPUOFF); // Clear CPUOFF bit from 0(SR) } /*------------------------------------------------------------ ---Timer A0 interrupt service routine----------*/ #pragma vector=TIMERA0_VECTOR __interrupt void Timer_A (void) { sSelfMeasureSem = 1; } /*------------------------------------------------------------ --------USCIA interrupt service routine--------*/ #pragma vector=USCIAB0RX_VECTOR __interrupt void USCI0RX_ISR(void) { }

Wearable Sensor System for Human Motion Analysis
VII
WIMU ED Board
//****************************************************************************** // eZ430-RF2500 Sensor End Device // // Description: End Device software for the WIMU // // A. Silva // Version 1.00 // FEUP // July 2010 // // // Sensor output | ez430-RF2500TG pins | Analog input | Flash Address // Ax P4 A1 206h // Ay P3 A0 208h // Az P6 A3 202h // Vx P5 A2 204h // Vy P7 A4 200h // //****************************************************************************** #include "bsp.h" #include "mrfi.h" #include "nwk_types.h" #include "nwk_api.h" #include "bsp_leds.h" #include "bsp_buttons.h" #include "vlo_rand.h" void linkTo(void); void ADC_Init(void); void createRandomAddress(); int increment_mseconds(void); int increment_seconds(void); int increment_minuts(void); int increment_hour(void); int msecond, second, minut, hour; __no_init volatile int tempOffset @ 0x10F4; // Temperature offset set at production __no_init volatile char Flash_Addr[4] @ 0x10F0; // Flash address set randomly __no_init volatile int result_A4 @ 0x200; __no_init volatile int result_A3 @ 0x202; __no_init volatile int result_A2 @ 0x204; __no_init volatile int result_A1 @ 0x206; __no_init volatile int result_A0 @ 0x208; void main (void) { addr_t lAddr;
WDTCTL = WDTPW + WDTHOLD; // Stop WDT { // delay loop to ensure proper startup before SimpliciTI increases DCO // This is typically tailored to the power supply used, and in this case // is overkill for safety due to wide distribution. volatile int i; for(i = 0; i < 0xFFFF; i++){} } if( CALBC1_8MHZ == 0xFF ) // Do not run if cal values are erased { volatile int i; P1DIR |= 0x03; BSP_TURN_ON_LED1(); BSP_TURN_OFF_LED2(); while(1) { for(i = 0; i < 0x5FFF; i++){} BSP_TOGGLE_LED2(); BSP_TOGGLE_LED1(); } } // SimpliciTI will change port pin settings as well P1DIR = 0xFF; P1OUT = 0x00; P2DIR = 0x27; P2OUT = 0x00; P3DIR = 0xC0; P3OUT = 0x00; P4DIR = 0xFF; P4OUT = 0x00; BSP_Init(); if( Flash_Addr[0] == 0xFF && Flash_Addr[1] == 0xFF && Flash_Addr[2] == 0xFF && Flash_Addr[3] == 0xFF ) { createRandomAddress(); // set Random device address at initial startup } lAddr.addr[0]=Flash_Addr[0]; lAddr.addr[1]=Flash_Addr[1]; lAddr.addr[2]=Flash_Addr[2]; lAddr.addr[3]=Flash_Addr[3]; SMPL_Ioctl(IOCTL_OBJ_ADDR, IOCTL_ACT_SET, &lAddr); //CLK system configuration BCSCTL1 = CALBC1_16MHZ; // Set DCO after random function

Appendix A: Microcontroller Embedded Code
VIII
DCOCTL = CALDCO_16MHZ; //Timer B configuration BCSCTL3 |= LFXT1S_2; // LFXT1 = VLO TBCCTL0 = CCIE; // TBCCR0 interrupt enabled TBCCR0 = 12; // ~ 1 msec TBCTL = TBSSEL_1 + MC_1; // ACLK, upmode msecond=0; second = 0; minut = 0; hour = 0; //ADC configuration ADC10AE0 |= 0x1F; ADC10CTL1 = INCH_4 + ADC10SSEL_3 + CONSEQ_1; ADC10CTL0 = SREF_1 + ADC10SHT_1 + REF2_5V + REFON + ADC10ON + MSC + ADC10IE; ADC10DTC1 = 0x05; // keep trying to join until successful. toggle LEDS to indicate that // joining has not occurred. LED3 is red but labeled LED 4 on the EXP // board silkscreen. LED1 is green. while (SMPL_NO_JOIN == SMPL_Init((uint8_t (*)(linkID_t))0)) { BSP_TOGGLE_LED1(); BSP_TOGGLE_LED2();; //__bis_SR_register(LPM3_bits + GIE); // LPM3 with interrupts enabled } // unconditional link to AP which is listening due to successful join. linkTo(); } //***************************************************************************** void linkTo() { linkID_t linkID1; uint8_t msg[9]; // keep trying to link... while (SMPL_SUCCESS != SMPL_Link(&linkID1)) { //__bis_SR_register(LPM3_bits + GIE); // LPM3 with interrupts enabled BSP_TOGGLE_LED1(); BSP_TOGGLE_LED2(); } // Turn off all LEDs
if (BSP_LED1_IS_ON()) { BSP_TOGGLE_LED1(); } if (BSP_LED2_IS_ON()) { BSP_TOGGLE_LED2(); } while (1) { SMPL_Ioctl( IOCTL_OBJ_RADIO, IOCTL_ACT_RADIO_SLEEP, "" ); //__bis_SR_register(LPM3_bits+GIE); // LPM3 with interrupts enabled SMPL_Ioctl( IOCTL_OBJ_RADIO, IOCTL_ACT_RADIO_AWAKE, "" ); ADC10CTL0 &= ~ENC; ADC10SA = 0x200; ADC10CTL0 |= ENC + ADC10SC; // Sampling and conversion start //__bis_SR_register(CPUOFF + GIE); // LPM0 with interrupts enabled float value4 = ((float) result_A4 * 2.5)/1023; int A4 = value4 * 100; float value3 = ((float) result_A3 * 2.5)/1023; int A3 = value3 * 100; float value2 = ((float) result_A2 * 2.5)/1023; int A2 = value2 * 100; float value1 = ((float) result_A1 * 2.5)/1023; int A1 = value1 * 100; float value0 = ((float) result_A0 * 2.5)/1023; int A0 = value0 * 100; /*message format, UB = upper Byte, LB = lower Byte ------------------------------- |degC LB | degC UB | volt LB | ------------------------------- 0 1 2 */ msg[0] = A1; msg[1] = A0; msg[2] = A3; msg[3] = A2; msg[4] = A4; msg[5] = hour; msg[6] = minut; msg[7] = second; msg[8] = msecond; if (SMPL_SUCCESS == SMPL_Send(linkID1, msg, sizeof(msg))) { BSP_TOGGLE_LED2(); } else

Wearable Sensor System for Human Motion Analysis
IX
{ BSP_TOGGLE_LED2(); BSP_TOGGLE_LED1(); } } } //***************************************************************************** void createRandomAddress() { unsigned int rand, rand2; do { rand = TI_getRandomIntegerFromVLO(); // first byte can not be 0x00 of 0xFF } while( (rand & 0xFF00)==0xFF00 || (rand & 0xFF00)==0x0000 ); rand2 = TI_getRandomIntegerFromVLO(); BCSCTL1 = CALBC1_1MHZ; // Set DCO to 1MHz DCOCTL = CALDCO_1MHZ; FCTL2 = FWKEY + FSSEL0 + FN1; // MCLK/3 for Flash Timing Generator FCTL3 = FWKEY + LOCKA; // Clear LOCK & LOCKA bits FCTL1 = FWKEY + WRT; // Set WRT bit for write operation Flash_Addr[0]=(rand>>8) & 0xFF; Flash_Addr[1]=rand & 0xFF; Flash_Addr[2]=(rand2>>8) & 0xFF; Flash_Addr[3]=rand2 & 0xFF; FCTL1 = FWKEY; // Clear WRT bit FCTL3 = FWKEY + LOCKA + LOCK; // Set LOCK & LOCKA bit } /*------------------------------------------------------------------* ADC10 interrupt service routine----*/ #pragma vector=ADC10_VECTOR __interrupt void ADC10_ISR(void) { } /*-------------------------------------------------------------------*Tmer B0 interrupt service routine-------*/ #pragma vector=TIMERB0_VECTOR __interrupt void Timer_B (void) {
increment_mseconds(); } int increment_mseconds(void) { if (msecond < 999) { msecond = msecond + 1; } else { msecond = 0; increment_seconds (); } } int increment_seconds(void) { if (second < 59) { second = second + 1; } else { second = 0; increment_minuts (); } } int increment_minuts(void) { if (minut < 59) { minut = minut + 1; } else { minut = 0; increment_hour(); } } int increment_hour(void) { if (hour < 23) { hour = hour + 1; } else { hour = 0; } }

Appendix A: Microcontroller Embedded Code
X
W2M2 MCU Board
// Project: Arduino FIO + ADXL345 MCU + ADXL345 remote board + COMBO Board // + HMC5883 Magnetometer // Author: Ana S. Silva // Date: 03/05/2012 // Description: The system performs simple monitoring of all sensor boards. //Sample frequencies min=50Hz max=500Hz // Version control: v1 03/05/2012 based on example code:teste_allADXL345_itg3200_HMC5883.ino //***** LIBRYRIES and VARIABLES ******* #include <Wire.h> #include <ADXL345.h> #include <SPI.h> #include <HMC5883L.h> #include <mpr121.h> #include "MPU6050.h" #include "I2Cdev.h" // I2C 7bit address of ADXL345 Board(SDO->VDD:0x1D ; SDO->GND:0x53) #define ADXLBoardAddress 0x1D // I2C 7bit address of ADXL345 COMBO #define ADXLCOMBO 0x53 // I2C 7bit address of ITG3200 COMBO char itgAddress = 0x68; // class default I2C address is 0x68 // specific I2C addresses may be passed as a parameter here // AD0 low = 0x68 (default for InvenSense evaluation board) // AD0 high = 0x69 MPU6050 accelgyro(0x69); int16_t ax, ay, az; int16_t gx, gy, gz; int irqpin = 2; // Digital 2 for capacitive sensor interrupt boolean touchStates[3]; //to keep track of the previous touch states // Declare global instances of the accelerometer boards. ADXL345 accel_board; ADXL345 accel_combo; // Store our compass as a variable. HMC5883L compass; //Assign the Chip Select signal to pin 10. int CS=10;
//variables for commands int inByte = 0; // a variable to read incoming serial data into int loopans = 0; // acknowledgement response to receive command from PC boolean datasend = false; //boolean calibration = false; boolean format_raw = true; // Reading format: 1 = raw; 0= scaled; (default:raw) char onsd[6] = "01010"; // Start char offsd[6] = "02020"; // Stop //char syncsd[6] = "03030"; // Synchronization char rawd[6] = "03030"; // Format raw char scaled[6] = "04040"; // Format scaled //unsigned long SyncTime[2]; //This buffer will hold values read from the ADXL345 MCU registers. char valuesMCU[10]; //These variables will be used to hold the x,y and z axis accelerometer values from MCU. int rawX_MCU, rawY_MCU, rawZ_MCU; float scaledX_MCU, scaledY_MCU, scaledZ_MCU; //Create variables to hold the output rates. int xRate, yRate, zRate; //Time-stamp unsigned long time; //This is a list of registers in the ITG-3200. Registers are parameters that determine how the sensor will behave, or they can hold data that represent the //sensors current status. //To learn more about the registers on the ITG-3200, download and read the datasheet. char WHO_AM_I = 0x00; char SMPLRT_DIV= 0x15; char DLPF_FS = 0x16; char GYRO_XOUT_H = 0x1D; char GYRO_XOUT_L = 0x1E; char GYRO_YOUT_H = 0x1F; char GYRO_YOUT_L = 0x20; char GYRO_ZOUT_H = 0x21; char GYRO_ZOUT_L = 0x22; //This is a list of settings that can be loaded into the registers. //DLPF, Full Scale Register Bits //FS_SEL must be set to 3 for proper operation //Set DLPF_CFG to 3 for 1kHz Fint and 42 Hz Low Pass Filter char DLPF_CFG_0 = 1<<0; char DLPF_CFG_1 = 1<<1; char DLPF_CFG_2 = 1<<2; char DLPF_FS_SEL_0 = 1<<3;

Wearable Sensor System for Human Motion Analysis
XI
char DLPF_FS_SEL_1 = 1<<4; //connection status variables int ADXL345Board = 0; int ComboBoard = 0; int HMC5883Board = 0; int MPU6050Board = 0; int Configuration = 0; //************ SETUP****************** void setup(){ //Initiate an SPI communication instance. SPI.begin(); //Configure the SPI connection for the ADXL345 MCU board. SPI.setDataMode(SPI_MODE3); //Create a serial connection to display the data on the terminal. Serial.begin(57600); //Set up the Chip Select pin to be an output from the Arduino. pinMode(CS, OUTPUT); //Before communication starts, the Chip Select pin needs to be set high. digitalWrite(CS, HIGH); //Put the ADXL345 into +/- 4G range by writing the value 0x01 to the DATA_FORMAT register. writeRegister(Register_DataFormat, 0x01); //Put the ADXL345 into Measurement Mode by writing 0x08 to the POWER_CTL register. writeRegister(Register_PowerControl, 0x08); //Measurement mode // Start the I2C Wire library so we can use I2C to talk to the accelerometer board. Wire.begin(); //Set up capacitive sensor pinMode(irqpin, INPUT); digitalWrite(irqpin, HIGH); //enable pullup resistor mpr121_setup(); // Create an instance of each accelerometer on the given addresses accel_board = ADXL345(ADXLBoardAddress); accel_combo = ADXL345(ADXLCOMBO); // Construct a new HMC5883 compass on the default addresss. compass = HMC5883L(); // Check which boards are infact connected. if(accel_board.EnsureConnected()) { Serial.println("Connected to ADXL345 Board."); ADXL345Board = true; // Set the range of the accelerometer ADXL345 Board 4G. accel_board.SetRange(4, false);
// Tell the accelerometer to start taking measurements. accel_board.EnableMeasurements(); } else { Serial.println("ADXL345 Board not present."); } if(accel_combo.EnsureConnected()) { Serial.println("Connected to COMBO Board."); ComboBoard = true; // Set the range of the accelerometer ADXL345 COMBO 4G. accel_combo.SetRange(4, false); // Tell the accelerometer to start taking measurements. accel_combo.EnableMeasurements(); //Configure the gyroscope //Set the gyroscope scale for the outputs to +/-2000 degrees per second itgWrite(itgAddress, DLPF_FS, (DLPF_FS_SEL_0|DLPF_FS_SEL_1|DLPF_CFG_0)); //Set the sample rate to 100 hz itgWrite(itgAddress, SMPLRT_DIV, 9); } else { Serial.println("COMBO Board not present."); } if(compass.EnsureConnected()) { Serial.println("Connected to HMC5883L magnetometer."); HMC5883Board = true; // Set the scale of the compass. compass.SetScale(1.3); // Set the measurement mode to Continuous compass.SetMeasurementMode(Measurement_Continuous); } else { Serial.println("HMC5883L magnetometer not present."); } accelgyro.initialize(); if (accelgyro.testConnection()) { Serial.println("Connected to MPU6050 Board."); MPU6050Board = true; } //tell about BSN configuration (which sensors are connected) if (ADXL345Board && ComboBoard && HMC5883Board) { Configuration = 7;

Appendix A: Microcontroller Embedded Code
XII
} else if (ADXL345Board && ComboBoard && !HMC5883Board) { Configuration = 6; } else if (ADXL345Board && !ComboBoard && HMC5883Board) { Configuration = 5; } else if (ADXL345Board && !ComboBoard && !HMC5883Board) { Configuration = 4; } else if (!ADXL345Board && ComboBoard && HMC5883Board) { Configuration = 3; } else if (!ADXL345Board && ComboBoard && !HMC5883Board) { Configuration = 2; } else if (!ADXL345Board && !ComboBoard && HMC5883Board) { Configuration = 1; } else { Configuration = 0; } Serial.print("Configuration Code:"); Serial.println(Configuration); } //******* MAIN FUNCTION ******************** void loop() { if (Serial.available() > 0) { inByte = Serial.read(); if (inByte == 35) { loopans= ackresp(); if (loopans == 1){ Serial.println("Ack Start"); datasend = true; } else if (loopans == 2) { Serial.println("Ack Stop"); datasend = false; } else if (loopans == 3){ Serial.println("Ack Data Format Raw"); format_raw = true; } else if (loopans == 4){ Serial.println("Ack Data Format Scaled"); format_raw = false; } else { Serial.println("Ack "+ loopans); } } else {} } else if (datasend) { readData(); //delay(1000); } else {} } //********* DECLARED FUNCTIONS ****** //This function will verified command received by serial and return int based on confirmation // 0 = unknown, 1 for Ack 1 (start sending data) and 2 (stop sending data) //Parameters: NONE int ackresp() {
delay(50); char mess[6]; int bufread = Serial.available(); if (bufread>5) { for(int i=0; i<5; i++) { mess[i] = Serial.read(); } mess[5] = 0; if (strcmp(onsd,mess) == 0) { //strcmp(x,y) function looks for x parameter in string y return 1; } else if (strcmp(offsd,mess) == 0) { return 2; } else if (strcmp(rawd,mess) == 0) { return 3; } else if (strcmp(scaled,mess) == 0) { return 4; } else { return 0; } } else { return 0; } } void readData() { //check if any change occured in capacitive sensor and if so process data if(!checkInterrupt()){ //read the touch state from the MPR121 Wire.requestFrom(0x5A,2); byte LSB = Wire.read(); byte MSB = Wire.read(); uint16_t touched = ((MSB << 8) | LSB); //16bits that make up the touch states for (int i=0; i < 3; i++){ // Check what electrodes were pressed if(touched & (1<<i)){ if(touchStates[i] == 0){ //pin i was just touched Serial.print(i); Serial.print(" T:"); // T: touched Serial.println(millis()); // Serial.print("pin "); // Serial.print(i); // Serial.println(" was just touched"); }else if(touchStates[i] == 1){ //pin i is still being touched } touchStates[i] = 1; } else{ if(touchStates[i] == 1){ Serial.print(i); Serial.print(" NLT:"); // NLT: no longer touching Serial.println(millis());

Wearable Sensor System for Human Motion Analysis
XIII
//pin i is no longer being touched } touchStates[i] = 0; } } } if (format_raw) { //Reading 6 bytes of data starting at register DATAX0 will retrieve the x,y and z acceleration //The results of the read operation will get stored to the valuesMCU[] buffer. readRegister(Register_DataX, 6, valuesMCU); rawX_MCU = ((int)valuesMCU[1]<<8)|(int)valuesMCU[0]; rawY_MCU = ((int)valuesMCU[3]<<8)|(int)valuesMCU[2]; rawZ_MCU = ((int)valuesMCU[5]<<8)|(int)valuesMCU[4]; //data from ADXL345 MCU //Serial.print("ADXL345 MCU:\t"); Serial.print(rawX_MCU); Serial.print("\t"); Serial.print(rawY_MCU); Serial.print("\t"); Serial.print(rawZ_MCU); Serial.print("\t"); if(ADXL345Board) { //Read accelerometer data from ADXL345 Board and scales it AccelerometerRaw raw_board = accel_board.ReadRawAxis(); // raw data from the ADXL345 board //Serial.print(" \tADXL345 Board:\t"); Serial.print(raw_board.XAxis); Serial.print("\t"); Serial.print(raw_board.YAxis); Serial.print("\t"); Serial.print(raw_board.ZAxis); Serial.print("\t"); } if(ComboBoard) { //Read raw data from accelerometer COMBO board AccelerometerRaw raw_combo = accel_combo.ReadRawAxis(); //Read the x,y and z output rates from the gyroscope. xRate = readX(); yRate = readY(); zRate = readZ(); //data from the ADXL345 combo //Serial.print(" \tADXL345 COMBO:\t"); Serial.print(raw_combo.XAxis); Serial.print("\t"); Serial.print(raw_combo.YAxis);
Serial.print("\t"); Serial.print(raw_combo.ZAxis); Serial.print("\t"); //Print the output rates to the terminal, seperated by a TAB character. //Serial.print(" \tITG3200:\t"); Serial.print(xRate); Serial.print("\t"); Serial.print(yRate); Serial.print("\t"); Serial.print(zRate); Serial.print("\t"); } if(HMC5883Board) { MagnetometerRaw raw_compass = compass.ReadRawAxis(); Serial.print(raw_compass.XAxis); Serial.print("\t"); Serial.print(raw_compass.YAxis); Serial.print("\t"); Serial.print(raw_compass.ZAxis); Serial.print("\t"); } if(MPU6050Board) { accelgyro.getMotion6(&ax, &ay, &az, &gx, &gy, &gz); Serial.print(ax); Serial.print("\t"); Serial.print(ay); Serial.print("\t"); Serial.print(az); Serial.print("\t"); Serial.print(gx); Serial.print("\t"); Serial.print(gy); Serial.print("\t"); Serial.print(gz); Serial.print("\t"); } //Retrieve time-stamp time = millis(); // Time-stamp //Serial.print(" \tTime:\t"); Serial.println(time); } else { //Reading 6 bytes of data starting at register DATAX0 will retrieve the x,y and z acceleration //The results of the read operation will get stored to the valuesMCU[] buffer. readRegister(Register_DataX, 6, valuesMCU); rawX_MCU = ((int)valuesMCU[1]<<8)|(int)valuesMCU[0]; rawY_MCU = ((int)valuesMCU[3]<<8)|(int)valuesMCU[2]; rawZ_MCU = ((int)valuesMCU[5]<<8)|(int)valuesMCU[4]; scaledX_MCU = rawX_MCU * ScaleFor4G; scaledY_MCU = rawY_MCU * ScaleFor4G; scaledZ_MCU = rawZ_MCU * ScaleFor4G; //data from ADXL345 MCU //Serial.print("ADXL345 MCU:\t"); Serial.print(scaledX_MCU);

Appendix A: Microcontroller Embedded Code
XIV
Serial.print("\t"); Serial.print(scaledY_MCU); Serial.print("\t"); Serial.print(scaledZ_MCU); Serial.print("\t"); if(ADXL345Board) { //Read accelerometer data from ADXL345 Board and scales it AccelerometerScaled scaled_board = accel_board.ReadScaledAxis(); // Scaled data from the ADXL345 board //Serial.print(" \tADXL345 Board:\t"); Serial.print(scaled_board.XAxis); Serial.print("\t"); Serial.print(scaled_board.YAxis); Serial.print("\t"); Serial.print(scaled_board.ZAxis); Serial.print("\t"); } if(ComboBoard) { //Read raw data from accelerometer COMBO board AccelerometerScaled scaled_combo = accel_combo.ReadScaledAxis(); // scaledX_combo = raw_combo.XAxis * ScaleFor4G; // scaledY_combo = raw_combo.YAxis * ScaleFor4G; // scaledZ_combo = raw_combo.ZAxis * ScaleFor4G; //Read the x,y and z output rates from the gyroscope. xRate = readX(); yRate = readY(); zRate = readZ(); //data from the ADXL345 combo //Serial.print(" \tADXL345 COMBO:\t"); Serial.print(scaled_combo.XAxis); Serial.print("\t"); Serial.print(scaled_combo.YAxis); Serial.print("\t"); Serial.print(scaled_combo.ZAxis); Serial.print("\t"); //Print the output rates to the terminal, seperated by a TAB character. //Serial.print(" \tITG3200:\t"); Serial.print(xRate); Serial.print("\t"); Serial.print(yRate); Serial.print("\t"); Serial.print(zRate); Serial.print("\t"); } if(HMC5883Board) {
MagnetometerScaled scaled_compass = compass.ReadScaledAxis(); Serial.print(scaled_compass.XAxis); Serial.print("\t"); Serial.print(scaled_compass.YAxis); Serial.print("\t"); Serial.print(scaled_compass.ZAxis); Serial.print("\t"); } //Retrieve time-stamp time = millis(); // Time-stamp //Serial.print(" \tTime:\t"); Serial.println(time); } } //This function will write a value to a register on the ADXL345. void writeRegister(char registerAddress, char value){ //Set Chip Select pin low to signal the beginning of an SPI packet. digitalWrite(CS, LOW); //Transfer the register address over SPI. SPI.transfer(registerAddress); //Transfer the desired register value over SPI. SPI.transfer(value); //Set the Chip Select pin high to signal the end of an SPI packet. digitalWrite(CS, HIGH); } //This function will read a certain number of registers starting from a specified // address and store their values in a buffer. void readRegister(char registerAddress, int numBytes, char * values) { //Since we're performing a read operation, the most significant bit of the register address should be set. char address = 0x80 | registerAddress; //If we're doing a multi-byte read, bit 6 needs to be set as well. if(numBytes > 1)address = address | 0x40; //Set the Chip select pin low to start an SPI packet. digitalWrite(CS, LOW); //Transfer the starting register address that needs to be read. SPI.transfer(address); //Continue to read registers until we've read the number specified, storing the results to the input buffer. for(int i=0; i<numBytes; i++){ values[i] = SPI.transfer(0x00); } //Set the Chips Select pin high to end the SPI packet. digitalWrite(CS, HIGH); }

Wearable Sensor System for Human Motion Analysis
XV
//This function will write a value to a register on the itg-3200. //Parameters: // char address: The I2C address of the sensor. For the ITG-3200 breakout the address is 0x69. // char registerAddress: The address of the register on the sensor that should be written to. // char data: The value to be written to the specified register. void itgWrite(char address, char registerAddress, char data) { //Initiate a communication sequence with the desired i2c device Wire.beginTransmission(address); //Tell the I2C address which register we are writing to Wire.write(registerAddress); //Send the value to write to the specified register Wire.write(data); //End the communication sequence Wire.endTransmission(); } //This function will read the data from a specified register on the ITG-3200 and return the value. //Parameters: // char address: The I2C address of the sensor. For the ITG-3200 breakout the address is 0x69. // char registerAddress: The address of the register on the sensor that should be read //Return: // unsigned char: The value currently residing in the specified register unsigned char itgRead(char address, char registerAddress) { //This variable will hold the contents read from the i2c device. unsigned char data=0; //Send the register address to be read. Wire.beginTransmission(address); //Send the Register Address Wire.write(registerAddress); //End the communication sequence. Wire.endTransmission(); //Ask the I2C device for data Wire.beginTransmission(address); Wire.requestFrom(address, 1); //Wait for a response from the I2C device if(Wire.available()){ //Save the data sent from the I2C device data = Wire.read(); } //End the communication sequence. Wire.endTransmission(); //Return the data read during the operation return data;
} //This function is used to read the X-Axis rate of the gyroscope. The function returns the ADC value from the Gyroscope //NOTE: This value is NOT in degrees per second. //Usage: int xRate = readX(); int readX(void) { int data=0; data = itgRead(itgAddress, GYRO_XOUT_H)<<8; data |= itgRead(itgAddress, GYRO_XOUT_L); return data; } //This function is used to read the Y-Axis rate of the gyroscope. The function returns the ADC value from the Gyroscope //NOTE: This value is NOT in degrees per second. //Usage: int yRate = readY(); int readY(void) { int data=0; data = itgRead(itgAddress, GYRO_YOUT_H)<<8; data |= itgRead(itgAddress, GYRO_YOUT_L); return data; } //This function is used to read the Z-Axis rate of the gyroscope. The function returns the ADC value from the Gyroscope //NOTE: This value is NOT in degrees per second. //Usage: int zRate = readZ(); int readZ(void) { int data=0; data = itgRead(itgAddress, GYRO_ZOUT_H)<<8; data |= itgRead(itgAddress, GYRO_ZOUT_L); return data; } void mpr121_setup(void){ set_register(0x5A, ELE_CFG, 0x00); // Section A - Controls filtering when data is > baseline. set_register(0x5A, MHD_R, 0x01); set_register(0x5A, NHD_R, 0x01); set_register(0x5A, NCL_R, 0x00); set_register(0x5A, FDL_R, 0x00); // Section B - Controls filtering when data is < baseline. set_register(0x5A, MHD_F, 0x01); set_register(0x5A, NHD_F, 0x01); set_register(0x5A, NCL_F, 0xFF); set_register(0x5A, FDL_F, 0x02);

Appendix A: Microcontroller Embedded Code
XVI
// Section C - Sets touch and release thresholds for each electrode set_register(0x5A, ELE0_T, TOU_THRESH); set_register(0x5A, ELE0_R, REL_THRESH); set_register(0x5A, ELE1_T, TOU_THRESH); set_register(0x5A, ELE1_R, REL_THRESH); set_register(0x5A, ELE2_T, TOU_THRESH); set_register(0x5A, ELE2_R, REL_THRESH); set_register(0x5A, ELE3_T, TOU_THRESH); set_register(0x5A, ELE3_R, REL_THRESH); set_register(0x5A, ELE4_T, TOU_THRESH); set_register(0x5A, ELE4_R, REL_THRESH); set_register(0x5A, ELE5_T, TOU_THRESH); set_register(0x5A, ELE5_R, REL_THRESH); set_register(0x5A, ELE6_T, TOU_THRESH); set_register(0x5A, ELE6_R, REL_THRESH); set_register(0x5A, ELE7_T, TOU_THRESH); set_register(0x5A, ELE7_R, REL_THRESH); set_register(0x5A, ELE8_T, TOU_THRESH); set_register(0x5A, ELE8_R, REL_THRESH); set_register(0x5A, ELE9_T, TOU_THRESH); set_register(0x5A, ELE9_R, REL_THRESH); set_register(0x5A, ELE10_T, TOU_THRESH); set_register(0x5A, ELE10_R, REL_THRESH); set_register(0x5A, ELE11_T, TOU_THRESH); set_register(0x5A, ELE11_R, REL_THRESH); // Section D // Set the Filter Configuration // Set ESI2 set_register(0x5A, FIL_CFG, 0x04); // Section E // Electrode Configuration // Set ELE_CFG to 0x00 to return to standby mode set_register(0x5A, ELE_CFG, 0x0C); // Enables all 12 Electrodes // Section F // Enable Auto Config and auto Reconfig /*set_register(0x5A, ATO_CFG0, 0x0B); set_register(0x5A, ATO_CFGU, 0xC9); // USL = (Vdd-0.7)/vdd*256 = 0xC9 @3.3V set_register(0x5A, ATO_CFGL, 0x82); // LSL = 0.65*USL = 0x82 @3.3V set_register(0x5A, ATO_CFGT, 0xB5);*/ // Target = 0.9*USL = 0xB5 @3.3V set_register(0x5A, ELE_CFG, 0x0C); } boolean checkInterrupt(void){
return digitalRead(irqpin); } void set_register(int address, unsigned char r, unsigned char v){ Wire.beginTransmission(address); Wire.write(r); Wire.write(v); Wire.endTransmission(); }

Wearable Sensor System for Human Motion Analysis
XVII
Appendix B: PROCESSING Code
------READ DATA FROM W2M2--------- // Need G4P library import guicomponents.*; import processing.serial.*; PFont myFont; PFont g_font; Serial myPort; // The serial port PrintWriter output_data, Subject_data, SyncTimes; int open_port = 0; int start_acquisition = 0; int trial = 1; int BaudRate = 57600; String inBuffer, inBufferIntro, data_filename, Info_filename, sync_filename, Subject_name, Subject_age, Subject_arm; String Subject_hip, Subject_leg, observations, COMPORT; String arm = "Right"; String plane = "Shoulder"; void setup(){ size(770, 680); createGUI(); customGUI(); } void draw(){ background(200,220,200); if (open_port == 1){ while (myPort.available() > 0) { inBufferIntro = myPort.readString(); if (inBufferIntro != null) { print(inBufferIntro); //txtData.setText(inBufferIntro); } } open_port = 0; } else if (start_acquisition == 1) { while (myPort.available() > 0 ) { inBuffer = myPort.readString(); if (inBuffer != null) { print(inBuffer); txtData.setText(inBuffer); output_data.print(inBuffer);
} } } else { } } // Use this method to add additional statements // to customise the GUI controls void customGUI(){ // btnStop.setFont("Verdana-16.vlw", 20); // btnStop.setColorScheme(122); } -------------GENERAL USER INTERFACE--------- void eventData(GTextField textfield) { //_CODE_:txtData:316170: println("txtData - GTextField event occured " + System.currentTimeMillis()%10000000 ); } //_CODE_:txtData:316170: void eventStartAcq(GButton button) { //_CODE_:btnStart:605144: println("btnStart - GButton event occured " + System.currentTimeMillis()%10000000 ); myPort.clear(); myPort.write("#01010" + 13); start_acquisition = 1; data_filename = Subject_name + "_" + arm + "_" + plane + "_Trial " + trial + ".txt"; output_data = createWriter(data_filename); sync_filename = Subject_name + "_" + arm + "_" + plane + "_Trial " + trial + "_SyncTimes.txt"; SyncTimes = createWriter(sync_filename); //output_data.print(inBufferIntro); SyncTimes.print("Starting Time: "); SyncTimes.println(System.currentTimeMillis()); txtDataFile.setText(data_filename); trial++; } //_CODE_:btnStart:605144: void eventStopAcq(GButton button) { //_CODE_:btnStop:992317: println("btnStop - GButton event occured " + System.currentTimeMillis()%10000000 ); myPort.write("#02020" + 13); //send STOP command output_data.flush(); // Write the remaining data

Appendix B: PROCESSING Code
XVIII
output_data.close(); // Finish the file SyncTimes.close(); start_acquisition = 0; } //_CODE_:btnStop:992317: void eventSerialPort(GTextField textfield) { //_CODE_:txtSerialPort:637799: println("txtSerialPort - GTextField event occured " + System.currentTimeMillis()%10000000 ); } //_CODE_:txtSerialPort:637799: void eventFilename(GTextField textfield) { //_CODE_:txtDataFile:887671: println("txtDataFile - GTextField event occured " + System.currentTimeMillis()%10000000 ); } //_CODE_:txtDataFile:887671: void eventImgBiowear(GImageButton imagebutton) { //_CODE_:btnImgBiowear:981398: println("imgButton1 - GImageButton event occured " + System.currentTimeMillis()%10000000 ); link("http://paginas.fe.up.pt/~biowear/"); } //_CODE_:btnImgBiowear:981398: void eventExit(GButton button) { //_CODE_:btnExit:750263: println("btnExit - GButton event occured " + System.currentTimeMillis()%10000000 ); myPort.clear(); myPort.stop(); exit(); } //_CODE_:btnExit:750263: void eventOpenPort(GButton button) { //_CODE_:btnOpenPort:414558: println("btnOpenPort - GButton event occured " + System.currentTimeMillis()%10000000 ); COMPORT = TextComPort.getText(); myPort = new Serial(this, COMPORT, BaudRate); txtSerialPort.setText(COMPORT + " " + BaudRate); open_port = 1; } //_CODE_:btnOpenPort:414558: void rawData_Click1(GOption opt_selected, GOption opt_deselected) { //_CODE_:Raw:938014: println("Raw - GOption event occured " + System.currentTimeMillis()%10000000 ); myPort.write("#04040" + 13); } //_CODE_:Raw:938014: void ScaledData_Click1(GOption opt_selected, GOption opt_deselected) { //_CODE_:Scaled:861742: println("Scaled - GOption event occured " + System.currentTimeMillis()%10000000 ); myPort.write("#05050" + 13); } //_CODE_:Scaled:861742:
void SubjectName_Enter1(GTextField textfield) { //_CODE_:SubjectName:680835: println("SubjectName - GTextField event occured " + System.currentTimeMillis()%10000000 ); } //_CODE_:SubjectName:680835: void Age_Enter1(GTextField textfield) { //_CODE_:SubjectAge:575600: println("SubjectAge - GTextField event occured " + System.currentTimeMillis()%10000000 ); } //_CODE_:SubjectAge:575600: void SubjectInfo_Click1(GButton button) { //_CODE_:SubmitData:315676: println("SubmitData - GButton event occured " + System.currentTimeMillis()%10000000 ); Subject_name = SubjectName.getText(); Subject_age = SubjectAge.getText(); Subject_arm = ArmMeasure.getText(); Subject_hip = HipMeasure.getText(); Subject_leg = LegMeasure.getText(); observations = Comments.getText(); Info_filename = "Info_" + Subject_name + ".txt"; Subject_data = createWriter(Info_filename); Subject_data.println("Subject Name: " + Subject_name); Subject_data.println("Subject Age: " + Subject_age); Subject_data.println("Subject Antropometry: "); Subject_data.println(" Arm: " + Subject_arm); Subject_data.println(" Hip: " + Subject_hip); Subject_data.println(" Leg: " + Subject_leg); Subject_data.println("Additional Comments: "); Subject_data.println(observations); Subject_data.close(); // Finish the file InfoFilename.setText(Info_filename); } //_CODE_:SubmitData:315676: void arm_Enter1(GTextField textfield) { //_CODE_:ArmMeasure:217156: println("ArmMeasure - GTextField event occured " + System.currentTimeMillis()%10000000 ); } //_CODE_:ArmMeasure:217156: void hip_Enter2(GTextField textfield) { //_CODE_:HipMeasure:263978: println("HipMeasure - GTextField event occured " + System.currentTimeMillis()%10000000 ); } //_CODE_:HipMeasure:263978: void leg_Enter3(GTextField textfield) { //_CODE_:LegMeasure:421167: println("LegMeasure - GTextField event occured " + System.currentTimeMillis()%10000000 ); } //_CODE_:LegMeasure:421167: void InfoFilename_Enter1(GTextField textfield) { //_CODE_:InfoFilename:899478:

Wearable Sensor System for Human Motion Analysis
XIX
println("InfoFilename - GTextField event occured " + System.currentTimeMillis()%10000000 ); } //_CODE_:InfoFilename:899478: void RightArm_Click1(GOption opt_selected, GOption opt_deselected) { //_CODE_:RightArm:465554: println("RightArm - GOption event occured " + System.currentTimeMillis()%10000000 ); arm = "Right"; } //_CODE_:RightArm:465554: void LeftArm_Click1(GOption opt_selected, GOption opt_deselected) { //_CODE_:LeftArm:960881: println("LeftArm - GOption event occured " + System.currentTimeMillis()%10000000 ); arm = "Left"; } //_CODE_:LeftArm:960881: void shoulder_Click1(GOption opt_selected, GOption opt_deselected) { //_CODE_:Shoulder:613941: println("option1 - GOption event occured " + System.currentTimeMillis()%10000000 ); plane = "Shoulder"; } //_CODE_:Shoulder:613941: void Scapula_Click1(GOption opt_selected, GOption opt_deselected) { //_CODE_:Scapula:338226: println("option2 - GOption event occured " + System.currentTimeMillis()%10000000 ); plane = "Scapula"; } //_CODE_:Scapula:338226: void comments_Enter1(GTextField textfield) { //_CODE_:Comments:211458: println("Comments - GTextField event occured " + System.currentTimeMillis()%10000000 ); } //_CODE_:Comments:211458: void COMPort_Enter1(GTextField textfield) { //_CODE_:TextComPort:584961: println("TextComPort - GTextField event occured " + System.currentTimeMillis()%10000000 ); } //_CODE_:TextComPort:584961: void BD38400_Click1(GOption opt_selected, GOption opt_deselected) { //_CODE_:BD38400:916242: println("option1 - GOption event occured " + System.currentTimeMillis()%10000000 ); BaudRate = 38400; } //_CODE_:BD38400:916242: void BD57600_Click1(GOption opt_selected, GOption opt_deselected) { //_CODE_:BD57600:885488: println("option2 - GOption event occured " + System.currentTimeMillis()%10000000 ); BaudRate = 57600; } //_CODE_:BD57600:885488:
void BD115200_Click1(GOption opt_selected, GOption opt_deselected) { //_CODE_:BD115200:416920: println("option3 - GOption event occured " + System.currentTimeMillis()%10000000 ); BaudRate = 115200; } //_CODE_:BD115200:416920: void SyncQualysis_Click1(GButton button) { //_CODE_:SyncQualysis:598017: println("button1 - GButton event occured " + System.currentTimeMillis()%10000000 ); SyncTimes.println(System.currentTimeMillis()); //myPort.write("#03030" + 13); } //_CODE_:SyncQualysis:598017: void resettrial_Click1(GButton button) { //_CODE_:ResetButton:293685: println("ResetButton - GButton event occured " + System.currentTimeMillis()%10000000 ); trial = 1; } //_CODE_:ResetButton:293685: void MCUGraphs(GWinApplet appc, GWinData data) { //_CODE_:MCUBoard:860613: appc.background(200,220,200); } //_CODE_:MCUBoard:860613: void AccBoardGraphs(GWinApplet appc, GWinData data) { //_CODE_:AccBoard:225894: appc.background(200,220,200); } //_CODE_:AccBoard:225894: void ComboBoardGraphs(GWinApplet appc, GWinData data) { //_CODE_:ComboBoard:896781: appc.background(200,220,200); } //_CODE_:ComboBoard:896781: // Create all the GUI controls. // autogenerated do not edit void createGUI(){ G4P.setColorScheme(this, GCScheme.GREY_SCHEME); G4P.messagesEnabled(false); txtData = new GTextField(this, "Click 'Open Port' button to start communication with W2M2", 24, 392, 296, 208, true); txtData.addEventHandler(this, "eventData"); btnStart = new GButton(this, "START Acquisition", 464, 512, 128, 40); btnStart.setTextAlign(GAlign.CENTER | GAlign.MIDDLE); btnStart.addEventHandler(this, "eventStartAcq"); btnStop = new GButton(this, "STOP Acquisition", 616, 512, 128, 40); btnStop.setTextAlign(GAlign.CENTER | GAlign.MIDDLE);

Appendix B: PROCESSING Code
XX
btnStop.addEventHandler(this, "eventStopAcq"); txtSerialPort = new GTextField(this, "", 296, 96, 152, 24, false); txtSerialPort.addEventHandler(this, "eventSerialPort"); txtDataFile = new GTextField(this, "(automatically generated)", 416, 576, 328, 24, false); txtDataFile.addEventHandler(this, "eventFilename"); btnImgBiowear = new GImageButton(this, null, "BIOwear_small.jpg", 1, 496, 24); btnImgBiowear.addEventHandler(this, "eventImgBiowear"); btnExit = new GButton(this, "EXIT", 336, 632, 102, 32); btnExit.setTextAlign(GAlign.CENTER | GAlign.MIDDLE); btnExit.addEventHandler(this, "eventExit"); btnOpenPort = new GButton(this, "Open Port", 184, 96, 68, 25); btnOpenPort.setTextAlign(GAlign.CENTER | GAlign.TOP); btnOpenPort.addEventHandler(this, "eventOpenPort"); optGroup1 = new GOptionGroup(); Raw = new GOption(this, "Raw", 352, 424, 95); optGroup1.addOption(Raw); Raw.setSelected(true); Raw.addEventHandler(this, "rawData_Click1"); Scaled = new GOption(this, "Scaled", 352, 456, 96); optGroup1.addOption(Scaled); Scaled.addEventHandler(this, "ScaledData_Click1"); DataFormat = new GLabel(this, "Data Format:", 336, 392, 79, 20); filename = new GLabel(this, "Filename:", 336, 576, 80, 24); Name = new GLabel(this, "Enter Subject's Name:", 16, 168, 168, 24); SubjectName = new GTextField(this, "John Doe", 24, 200, 128, 20, false); SubjectName.addEventHandler(this, "SubjectName_Enter1"); Age = new GLabel(this, "Enter Subject's Age", 16, 240, 168, 24); SubjectAge = new GTextField(this, "", 24, 272, 96, 24, false); SubjectAge.addEventHandler(this, "Age_Enter1"); SubmitData = new GButton(this, "OK", 184, 320, 72, 24); SubmitData.setTextAlign(GAlign.CENTER | GAlign.MIDDLE); SubmitData.addEventHandler(this, "SubjectInfo_Click1"); Antropometry = new GLabel(this, "Enter Antropometry Info", 224, 168, 192, 24); Leg = new GLabel(this, "Leg (cm):", 232, 200, 64, 24); hip = new GLabel(this, "Hip (cm):", 232, 232, 64, 20);
Arm = new GLabel(this, "Arm (cm):", 232, 264, 64, 20); ArmMeasure = new GTextField(this, "", 312, 264, 80, 20, false); ArmMeasure.addEventHandler(this, "arm_Enter1"); HipMeasure = new GTextField(this, "", 312, 232, 80, 20, false); HipMeasure.addEventHandler(this, "hip_Enter2"); LegMeasure = new GTextField(this, "", 312, 200, 80, 20, false); LegMeasure.addEventHandler(this, "leg_Enter3"); SubInfoFilename = new GLabel(this, "Subject's Info Filename:", 416, 312, 136, 24); InfoFilename = new GTextField(this, "(automatically generated)", 552, 312, 192, 24, false); InfoFilename.addEventHandler(this, "InfoFilename_Enter1"); ArmAnalysis = new GLabel(this, "Data Collection:", 480, 392, 80, 20); optGroup2 = new GOptionGroup(); RightArm = new GOption(this, "Right Arm", 496, 424, 90); optGroup2.addOption(RightArm); RightArm.setSelected(true); RightArm.addEventHandler(this, "RightArm_Click1"); LeftArm = new GOption(this, "Left Arm", 496, 456, 90); optGroup2.addOption(LeftArm); LeftArm.addEventHandler(this, "LeftArm_Click1"); CollectionPlane = new GLabel(this, "Collection Plane:", 616, 392, 80, 20); optGroup3 = new GOptionGroup(); Shoulder = new GOption(this, "Shoulder", 632, 424, 90); optGroup3.addOption(Shoulder); Shoulder.setSelected(true); Shoulder.addEventHandler(this, "shoulder_Click1"); Scapula = new GOption(this, "Scapula", 632, 456, 90); optGroup3.addOption(Scapula); Scapula.addEventHandler(this, "Scapula_Click1"); Observations = new GLabel(this, "Comments:", 448, 168, 80, 24); Comments = new GTextField(this, "", 456, 200, 288, 88, true); Comments.addEventHandler(this, "comments_Enter1"); COMPort = new GLabel(this, "Enter COM Port:", 16, 24, 88, 24); TextComPort = new GTextField(this, "COM8", 24, 56, 112, 24, false); TextComPort.addEventHandler(this, "COMPort_Enter1"); BD = new GLabel(this, "Choose BaudRate:", 176, 24, 104, 24); optGroup4 = new GOptionGroup();

Wearable Sensor System for Human Motion Analysis
XXI
BD38400 = new GOption(this, "38400", 176, 56, 90); optGroup4.addOption(BD38400); BD38400.addEventHandler(this, "BD38400_Click1"); BD57600 = new GOption(this, "57600", 280, 56, 90); optGroup4.addOption(BD57600); BD57600.setSelected(true); BD57600.addEventHandler(this, "BD57600_Click1"); BD115200 = new GOption(this, "115200", 384, 56, 90); optGroup4.addOption(BD115200); BD115200.addEventHandler(this, "BD115200_Click1"); SyncQualysis = new GButton(this, "Sync", 336, 520, 72, 24); SyncQualysis.setTextAlign(GAlign.CENTER | GAlign.MIDDLE); SyncQualysis.addEventHandler(this, "SyncQualysis_Click1"); ResetButton = new GButton(this, "Reset Trial", 688, 608, 56, 23); ResetButton.setTextAlign(GAlign.CENTER | GAlign.MIDDLE); ResetButton.addEventHandler(this, "resettrial_Click1"); MCUBoard = new GWindow(this, "MCU Gaphs", 0, 0, 430, 270, false, JAVA2D); MCUBoard.addDrawHandler(this, "MCUGraphs"); AccBoard = new GWindow(this, "Accelerometer Board Graphs", 0, 0, 430, 270, false, JAVA2D); AccBoard.addDrawHandler(this, "AccBoardGraphs"); ComboBoard = new GWindow(this, "Combo Board Graphs", 0, 0, 430, 300, false, JAVA2D); ComboBoard.addDrawHandler(this, "ComboBoardGraphs"); } // Variable declarations // autogenerated do not edit GTextField txtData; GButton btnStart; GButton btnStop; GTextField txtSerialPort; GTextField txtDataFile; GImageButton btnImgBiowear; GButton btnExit; GButton btnOpenPort; GOptionGroup optGroup1; GOption Raw; GOption Scaled; GLabel DataFormat; GLabel filename; GLabel Name; GTextField SubjectName; GLabel Age; GTextField SubjectAge; GButton SubmitData; GLabel Antropometry; GLabel Leg; GLabel hip;
GLabel Arm; GTextField ArmMeasure; GTextField HipMeasure; GTextField LegMeasure; GLabel SubInfoFilename; GTextField InfoFilename; GLabel ArmAnalysis; GOptionGroup optGroup2; GOption RightArm; GOption LeftArm; GLabel CollectionPlane; GOptionGroup optGroup3; GOption Shoulder; GOption Scapula; GLabel Observations; GTextField Comments; GLabel COMPort; GTextField TextComPort; GLabel BD; GOptionGroup optGroup4; GOption BD38400; GOption BD57600; GOption BD115200; GButton SyncQualysis; GButton ResetButton; GWindow MCUBoard; GWindow AccBoard; GWindow ComboBoard;


Wearable Sensor System for Human Motion Analysis
XXIII
Appendix C: Matlab Script
FOS Data Acquisition and Processing
------READ POWERMETER--------- clc; clear all; close all; Path='C:\Users\asilva\Documents\Doutoramento\Fiber optic sensor\Data acquisition\'; Desired_Name='FOS_FourLoops'; File=[Path Desired_Name '.csv']; gpib_h=gpib_usb_prologix_open('COM4'); set_gpib_addr(gpib_h,20); %20 clc Slot=1; Channel=1; n_amostra=1100; P=zeros(1,n_amostra); sec=zeros(1,n_amostra); min=zeros(1,n_amostra); disp('i=') for i=1:n_amostra [power unit]=power_meter_8163_read(gpib_h,Slot,Channel); P(i)=power; fprintf('%d\n',i) T1=clock; min(i)=T1(5); sec(i)=T1(6); plot(i,P(i),'o'); hold on; end fclose(gpib_h); %csvwrite(File,[P' min' sec']); dlmwrite(File, [ min' sec' P' ],'delimiter',','); save([File(1:end-4) '.mat'],'min','sec', 'P'); figure plot(min+sec/60,P) %hold on; ----- function gpib_h=gpib_usb_prologix_open( COM) gpib_h=serial(COM); gpib_h.BaudRate=115200; gpib_h.InputBufferSize=16384*16; gpib_h.FlowControl='Hardware'; fopen(gpib_h);
----- function set_gpib_addr(gpib_h, ADDR) fprintf(gpib_h,['++addr ' num2str(ADDR)]); fprintf(gpib_h,'++addr'); pause(0.2) disp(fgetl(gpib_h)) ----- function [power unit]=power_meter_8163_read (gpib_h,Slot,CH) if(gpib_h.BytesAvailable) fread(gpib_h,gpib_h.BytesAvailable); end fprintf(gpib_h,['READ' num2str(Slot) ':CHAN' num2str(CH) ':POW?']); pause(0.05); %0.25 str=fgetl(gpib_h); power=str2num(str); if(power>1E38) power=NaN; end fprintf(gpib_h, ['SENS' num2str(Slot) ':CHAN' num2str(CH) ':POW:UNIT?']); %pause(0.05); %0.25 if(str2num(fgetl(gpib_h))==1) unit='W'; else unit='dBm'; end ------ function gpib_close(osa_h) fclose(osa_h); ------PROCESS DATA--------- clc; clear all; fileList = getAllFiles('C:\Users\asilva\Documents\Doutoramento\Fiber optic sensor\Data acquisition\sensor characterization\Loop Configurations\four loops\'); angles = [0 3 6 9 12 15 18 21 24 27 30 33 36 39 42 45 48 51 54 57 60]; for i=1:length(fileList) str = fileList{i,1} if all(str(end-3:end) == '.mat') %verifica se é um ficheiro .mat com os dados

Appendix C: Matlab Script
XXIV
signal = importdata(str); power = signal.P(); plot(power) for j=1:length(angles) inicio = input('inicio \n'); fim = input('fim \n'); stage(j) = mean(power(:,inicio:fim)); end PowerValues (i,1:j) = stage(:,:); end end boxplot(PowerValues)

Wearable Sensor System for Human Motion Analysis
XXV
Appendix D: Experimental Protocol Approved by Ethics
Committee (in Portuguese)
FOLHA DE ROSTO DO ESTUDO DE INVESTIGAÇÃO E DESENHO DO
PROJECTO
UTILIZAÇÃO OBRIGATÓRIA.
TÍTULO
O BIOFEEDBACK COMO FERRAMENTA DE TREINO/REABILITAÇÃO EM INDIVÍDUOS COM ALTERAÇÃO DA FUNÇÃO DO MEMBRO SUPERIOR
CLASSIFICAÇÃO
Trabalho Académico de Investigação
Não conferidor de grau Conferidor de grau (Licenciatura
Mestrado Doutoramento ) Projecto de Investigação Ensaio Clínico (Medicamentos Dispositivos médicos )
Outro Qual?
VERSÃO
Novo Modificação / Adenda Prolongamento
CALENDARIZAÇÃO Data início: 01/2012 Data conclusão: 12/2013 PRAZO A CUMPRIR: 2 anos
INVESTIGADORES
É FUNDAMENTAL O E-MAIL, JÁ QUE ESTE CONSTITUIRÁ A FORMA PREFERENCIAL DE CONTACTO COM OS INVESTIGADORES.
Investigador Principal (Nome, Instituição, Serviço, Grupo profissional) Contactos (e-mail, telefone e telemóvel).
CLÁUDIA ISABEL COSTA DA SILVA, ESTSP, ÁREA TÉCNICO-CIENTÍFICA DA FISIOTERAPIA E-MAIL: [email protected], TEL: 938674365
Investigador Responsável na ESTSP (Nome, Serviço, Grupo profissional) (Contactos: e-mail, telefone e telemóvel).
Assinale aqui se for idêntico ao Investigador Principal □ Indique o Investigador Responsável no CHP quando o Investigador Principal não pertencer à Instituição.
MANUEL RUBIM SILVA SANTOS, ESTSP, ÁREA CIENTÍFICA DA FÍSICA, DOUTORAMENTO E-MAIL: [email protected], TEL: 962644773

Appendix D: Experimental Protocol Approved by Ethics Committee
XXVI
Outros Investigadores (Nome, Instituição, Serviço, Grupo profissional.) Indique os restantes elementos da Equipa de Investigação.
ANTÓNIO SALAZAR, FEUP, ENGENHARIA ELECTROTÉC NICA E DE COMPUTADORES, INESCPORTO E-MAIL: [email protected], TEL: 967401514 ANA SOFIA SILVA, FEUP, ENGENHARIA ELECTROTÉC NICA E DE COMPUTADORES, INESCPORTO E-MAIL: [email protected], TEL: 938237830 CARLA BORGES, FEUP, ENGENHARIA ELECTROTÉC NICA E DE COMPUTADORES, INESCPORTO E-MAIL: [email protected], TEL: 969494521 MIGUEL VELHOTE CORREIA, FEUP, ENGENHARIA ELECTROTÉC NICA E DE COMPUTADORES, INESCPORTO E-MAIL: [email protected], TEL: 22 508 1888 JOÃO PAULO VILAS-BOAS, FADE-UP, LABORATÓRIO DE BIOMECÂNICA DO PORTO E-MAIL: [email protected], TEL: 225074790
ALUNOS E ORIENTADORES É FUNDAMENTAL O E-MAIL, JÁ QUE ESTE CONSTITUIRÁ A FORMA PREFERENCIAL DE CONTACTO COM OS INVESTIGADORES.
Aluno Nome; Instituição (Universidade / Faculdade ou Escola); Curso e Ano; (Contactos: e-mail, telefone e telemóvel).
NÃO SE APLICA
Orientador / Elo de ligação da Instituição de Ensino Nome; Instituição (Universidade / Faculdade ou Escola); Grupo e Categoria Profissional; Grau Académico; (Contactos: e-mail, telefone e telemóvel).
MANUEL RUBIM SILVA SANTOS, ESTSP, ÁREA CIENTÍFICA DA FÍSICA, DOUTORAMENTO E-MAIL: [email protected], TEL: 962644773
Orientador / Elo de ligação na ESTSP (Nome, Serviço, Grupo profissional) (Contactos: e-mail, telefone e telemóvel). Assinale aqui se for idêntico ao Orientador / Supervisor da Instituição de Ensino □ Indique o Orientador / Supervisor no CHP quando o Orientador / Supervisor da Instituição de Ensino não pertencer à Instituição.
MANUEL RUBIM SILVA SANTOS, ESTSP, ÁREA CIENTÍFICA DA FÍSICA, DOUTORAMENTO E-MAIL: [email protected], TEL: 962644773
INSTITUIÇÕES E SERVIÇOS
Unidades, Departamentos e Serviço da ESTSP (de entre as indicadas, mencione qual é a proponente)
Área técnico-cientifica de fisioterapia
Outras Instituições intervenientes (Indique outras Instituições, Unidades, Departamentos e Serviços)
Faculdade de Desporto – Universidade do Porto (laboratório de Biomecânica)

Wearable Sensor System for Human Motion Analysis
XXVII
CARACTERÍSTICAS DO ESTUDO
1. FUNDAMENTAÇÃO TEÓRICA
Perante situações de alteração da função do membro superior, o objectivo da reabilitação é proporcionar um melhor desempenho nas actividades de vida diária ou no gesto desportivo, de forma a garantir uma melhor performance motora. Tal, tem por base a necessidade de desenvolver oportunidades para que a especificidade de determinada tarefa ou experiência seja repetida, com um significado funcional, através da criação de um contexto motivador e num ambiente que ofereça diferentes modalidades sensoriais (Sveistrup, 2004), e que sobretudo possibilite um adequado feedback da performance. Tal, é de extrema relevância, dado o conhecimento da importância do feedback (quer em tempo real – concomitante à execução da tarefa, ou imediatamente após – “conhecimento de resultados”) no processo de aprendizagem motora (Holden, 2005).
Assim, um dos grandes objectivos actualmente consiste no desenvolvimento de sistemas que permitam, com recurso a tecnologia relativamente simples, ao indivíduo em processo de reabilitação, estabelecer uma interacção desafiante, mas segura, num contexto ambiental próprio, com controlo dos vários parâmetros relacionados com as suas necessidades específicas aliado á possibilidade de receber um feedback “aumentativo” e portanto mais eficaz, possibilitando em última instância, um pormenorizado follow-up individual, bem como o desenvolvimento de técnicas de análise standard e protocolos de reabilitação / treino padronizados.
Ainda outra vantagem importante associada ao uso desta tecnologia, é a possibilidade de permitir um aumento na intensidade da prática sem necessitar da presença ou supervisão do terapeuta ou treinador (Dobkin, 2004).
Face ao exposto, o desenvolvimento de sistemas que ofereçam as possibilidades acima referidas, revela-se de total pertinencia. O Wireless Wearable Modular Monitoring (W2M2) constitui um sistema desenvolvido especificamente para dar resposta às necessidades expressas no campo da reabilitação, tendo surgido a partir da criação de uma pareceria entre a ESTSP, faculdade de Desporto e faculdade de Engenharia da Universidade do Porto, no âmbito do doutoramento da investigadora. Trata-se de um equipamento constituído por sistemas modulares contendo acelerómetros e giroscópios que permitem a aquisição de sinais relevantes para a caracterização do movimento. Pretende constituir uma alternativa aos actuais sistemas de aquisição, pela seu baixo custo, aliado à pouca complexidade, eprmitindo assim o seu uso dessiminado, ao invês de confinar a sua aplicabilidade a centros de investigação.
2. OBJECTIVOS
Este estudo tem como objectivo melhorar os conhecimentos sobre o controlo motor associado à função do membro superior, nomadamente na tarefa de alcançar (reach), bem como aprofundar conhecimentos sobre o efeito do biofeedback e a sua relação com as teorias de aprendizagem motora ,a fim de possibilitar uma melhor intervenção na reabilitação de atletas pós lesão desportiva e em indivíduos pós lesão do SNC (AVE), usando tecnologia simple, acessível e de baixo custo. Pretende-se com este trabalho: -Caracterizar em termos de acelerometria o gesto humano de alcançar; - Detectar eventuais erros na performance (de deslocamento, orientação, velocidade angular ou linear, smoothness) e compensações no padrão de moviemento nos casos pós lesão; -Testar o equipamento desenvolvido (W2M2) no que se refere à sua aplicabilidade como ferramenta de biofeedback, que possibilite ao utilizador, no seu póprio ambiente, a percepção do “erro”, aquando da execução do padrão de movimento pretendido.

Appendix D: Experimental Protocol Approved by Ethics Committee
XXVIII
3. METODOLOGIA 3.1. Participantes, tipo de estudo, amostra e procedimentos
TIPO DE ESTUDO: Prevê-se realizar um estudo observacional. PARTICIPANTES: Será constituída uma amostra de individuos voluntários constituída por sujeitos com diagnóstico de Acidente Vascular Encefálico e sujeitos saudáveis (estudantes e funcionários da ESTSP). O investigador contactará individualmente cada individuo convidando-o a participar no estudo A identificação de cada participante será codificada e será garantido o anonimato. CRITÉRIOS DE SELECÇÃO - Critérios de inclusão do grupo de individuos saudáveis: Serão incluídos indivíduos com idade igual ou superior a 18 anos, que não apresentem patologia do foro neuro-músculo-esquelético, nomeadamente ao nível da coluna cervical e ombro, e que concordam em assinar a folha de consentimento informado. - Critérios de inclusão do grupo de individuos com AVE: confirmação imagiológica de diagnóstico de AVE único e unilateral no território da artéria cerebral média, há pelo menos 3 meses; aus~encia de neglect; ausência de alterações visuais, perceptivas ou cognitivas e capacidade de realizar movimento activo no membro superior predominantemente afectado de pelo menos 15º no ombro e cotovelo. - Critérios de exclusão: Serão excluídos os indivíduos que apresentem AVE do tronco encefálico ou cerebelo e presença de dor ao nível dos membros superiores. As informações serão recolhidas através de um questionário elaborado para esse efeito. PROCEDIMENTOS: Cada indivíduo será sentado numa marquesa hidráulica a uma altura equivalente à distância medida da interlinha articular do joelho até ao chão (correspondente ao comprimento da perna), com 75% do comprimento da coxa (medido desde o grande trocânter até à interlinha articular da articulação do joelho) assente e de pés descalços em total contacto com o chão, ou num degrau de madeira. Será colocada uma mesa à frente de cada indivíduo, a uma altura correspondente ao alinhamento das cristas ilíacas, sendo o bordo deste foi alinhado com o limite inferior das coxas do indivíduo, de modo a não interferir com o movimento da mão. A colocação do objecto-alvo na mesa, teve como referência a avaliação no limite anatómico da distância de alcance funcional da mão, usando-se a distância medida desde o acrómio até à interlinha articular da articulação metacarpofalângica do polegar. O indivíduo será instruído, após comando verbal, a executar a tarefa funcional de alcançar o objecto-alvo, e retomar a posição inicial. O sistema de aquisição dos dados inerciais (acelerometria) - W2M2, constituídos por 3 módulos, será colocado a cada um dos individuos, nos segmentos braço, antebraço e tronco. Este é um sistema não invasivo, que pretende exlusivamente monitorizar parametros relacionados com o movimento funcional, sendo colocado em cada um dos segmentos referidos através do uso de velcros, permitindo a sua correcta fixação. Dado o objectivo deste equipamento, os individuos não necessitam de ser sujeitos a qualquer tipo de preparação prévia, não acarretando por isso quelaquer risco. Os dados obtidos permitirão comparar a performance motora de individuos com AVE vs individuos saudáveis.
3.2. Instrumentos de recolha de dados Wireless Wearable Modular Monitoring (W2M2)

Wearable Sensor System for Human Motion Analysis
XXIX
3.3 Cronograma
2012-13 2013-14
Revisão bibliográfica e elaboração de protocolos
Teste piloto dos protocolos de avaliação e ensaios dos protocolos de intervenção
Selecção da amostra Recolha de dados
Tratamento estatístico dos dados
Redacção da tese