weather instruments & weather forecast weather instruments & weather forecast lalu nayak...
TRANSCRIPT

Weather instruments &
Weather forecast
Weather instruments &
Weather forecast
Lalu Nayak Class-XI (arts)
Lalu Nayak Class-XI (arts)
Guided by-A.K. Mishra
Guided by-A.K. Mishra

OBJECTIVES:OBJECTIVES:
• This project is a part of project work given in geography.
• It explains about weather interpretation.
• It also provide idea the work we have under taken during our project.
• This project is a part of project work given in geography.
• It explains about weather interpretation.
• It also provide idea the work we have under taken during our project.
CONTENTS CONTENTS
1.Maximum minimum
thermometer 2.Wet & dry bal thermometer 3.Raingaurge 4.Special activities 5.Important links 6.Acknowledgement
1.Maximum minimum
thermometer 2.Wet & dry bal thermometer 3.Raingaurge 4.Special activities 5.Important links 6.Acknowledgement

Maximum minimum thermometerMaximum minimum thermometer
• This thermometer is to measure the maximum & minimum temperature
of the day.• It must important for day to day life to
know the temperature & humidity of the day.
• DEFERENT PART OF THE THERMOMETER –Maximum Thermometer and Minimum Thermometer
• Maximum Thermometer and minimum thermometer is consisting of a U-shaped tube with mercury at its base.
• One part of it measure maximum temperature where other part measure minimum temperature.
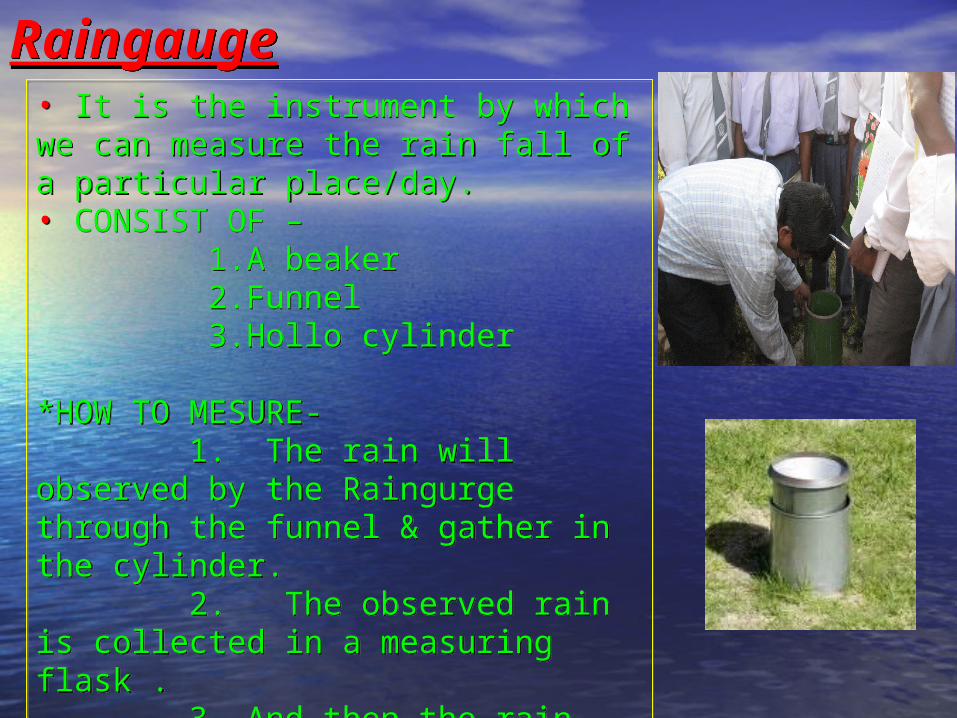
RaingaugeRaingauge• It is the instrument by which we can measure the rain fall of a particular place/day.• CONSIST OF – 1.A beaker 2.Funnel 3.Hollo cylinder *HOW TO MESURE- 1. The rain will observed by the Raingurge through the funnel & gather in the cylinder. 2. The observed rain is collected in a measuring flask . 3. And then the rain data is collected & recorded.
• It is the instrument by which we can measure the rain fall of a particular place/day.• CONSIST OF – 1.A beaker 2.Funnel 3.Hollo cylinder *HOW TO MESURE- 1. The rain will observed by the Raingurge through the funnel & gather in the cylinder. 2. The observed rain is collected in a measuring flask . 3. And then the rain data is collected & recorded.
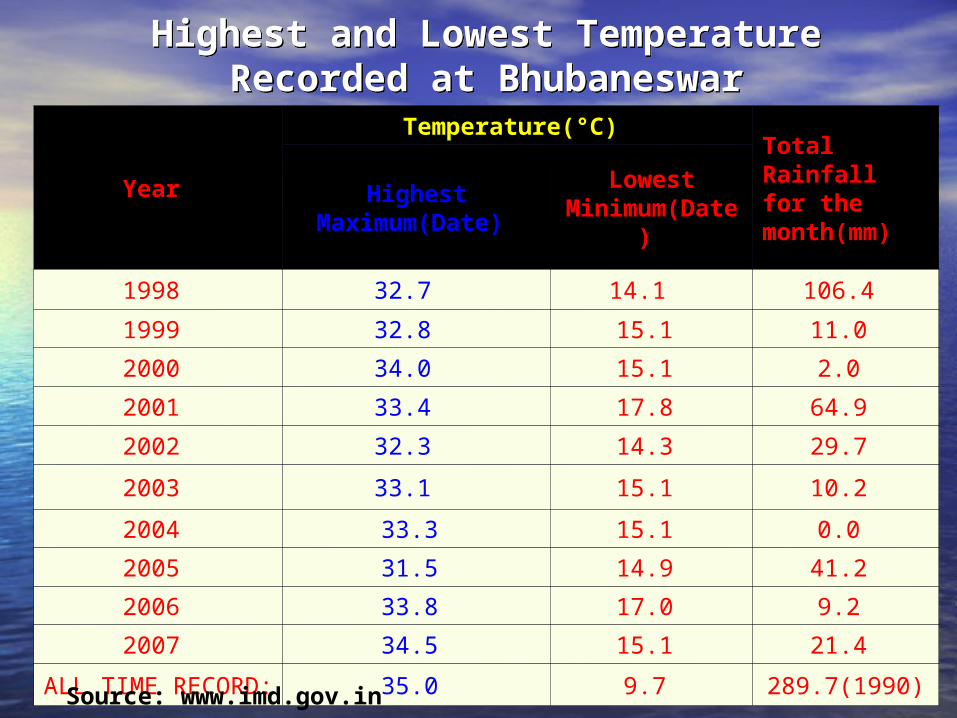
Year
Temperature(°C) Total Rainfall for the month(mm)
Highest Maximum(Date)
Lowest Minimum(Dat
e)
1998 32.7 14.1 106.4
1999 32.8 15.1 11.0
2000 34.0 15.1 2.0
2001 33.4 17.8 64.9
2002 32.3 14.3 29.7
2003 33.1 15.1 10.2
2004 33.3 15.1 0.0
2005 31.5 14.9 41.2
2006 33.8 17.0 9.2
2007 34.5 15.1 21.4
ALL TIME RECORD: 35.0 9.7 289.7(1990)
Highest and Lowest Temperature Recorded at Bhubaneswar
Highest and Lowest Temperature Recorded at Bhubaneswar
Source: www.imd.gov.in

Wet & dry ball thermometerWet & dry ball thermometer
•It is to measure relative humidity.•It is consisting of two thermometer.•Out of which one is a normal It is consisting of two thermometer.•thermometer and the bulb of another is cover with a piece of cloth which is connected with container of water.•The reading in the both thermometer taken daily and matching it with a table to derive the relative humidity.•The relative humidity can also be derived by putting the value of wet bulb temperature and dry bulb temperature in the readymade web site can also calculate the relative humidity easily. i.e.
•It is to measure relative humidity.•It is consisting of two thermometer.•Out of which one is a normal It is consisting of two thermometer.•thermometer and the bulb of another is cover with a piece of cloth which is connected with container of water.•The reading in the both thermometer taken daily and matching it with a table to derive the relative humidity.•The relative humidity can also be derived by putting the value of wet bulb temperature and dry bulb temperature in the readymade web site can also calculate the relative humidity easily. i.e.
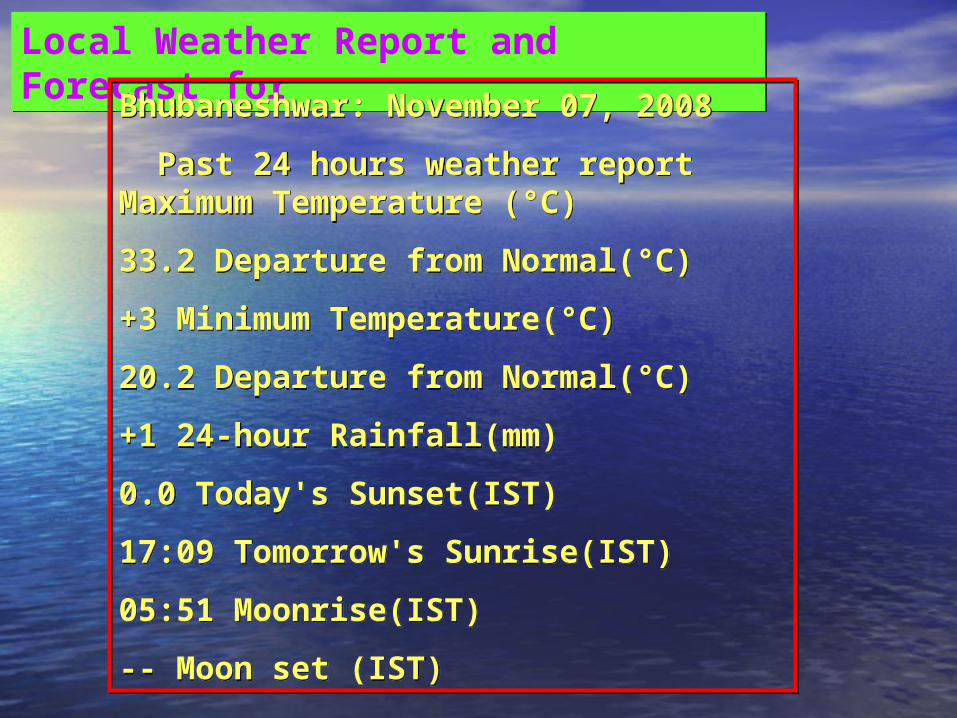
Local Weather Report and Forecast forLocal Weather Report and Forecast for
Bhubaneshwar: November 07, 2008
Past 24 hours weather report Maximum Temperature (°C)
33.2 Departure from Normal(°C)
+3 Minimum Temperature(°C)
20.2 Departure from Normal(°C)
+1 24-hour Rainfall(mm)
0.0 Today's Sunset(IST)
17:09 Tomorrow's Sunrise(IST)
05:51 Moonrise(IST)
-- Moon set (IST)
Bhubaneshwar: November 07, 2008
Past 24 hours weather report Maximum Temperature (°C)
33.2 Departure from Normal(°C)
+3 Minimum Temperature(°C)
20.2 Departure from Normal(°C)
+1 24-hour Rainfall(mm)
0.0 Today's Sunset(IST)
17:09 Tomorrow's Sunrise(IST)
05:51 Moonrise(IST)
-- Moon set (IST)

Weather chartWeather chart•Weather chart are prepared after collection of data.•The data are represented on a map.•We have collected these chart from the official web site of Indian Meteorological department web site i.e. www.imd.gov.in
•Weather chart are prepared after collection of data.•The data are represented on a map.•We have collected these chart from the official web site of Indian Meteorological department web site i.e. www.imd.gov.in

Interpretation of weather MapInterpretation of weather Map
•The map is of 12.11.08•Here the pressure decreases from equator towards poles.•The isobar lines are almost parallel to latitude.•There are low pressure region in some places where as high pressure region in other.•The general wind pattern will be from equator towards poles.
•The map is of 12.11.08•Here the pressure decreases from equator towards poles.•The isobar lines are almost parallel to latitude.•There are low pressure region in some places where as high pressure region in other.•The general wind pattern will be from equator towards poles.

Interpretation of weather MapInterpretation of weather Map
•The map shows the general wind pattern of 12.11.08.•The wind speed is higher in the interior part of the continent over china.•Wind is also high in the midst of Indian ocean.•The general direction of wind is from west to east in north and east to west in south.
•The map shows the general wind pattern of 12.11.08.•The wind speed is higher in the interior part of the continent over china.•Wind is also high in the midst of Indian ocean.•The general direction of wind is from west to east in north and east to west in south.
Interpretation of weather MapInterpretation of weather Map
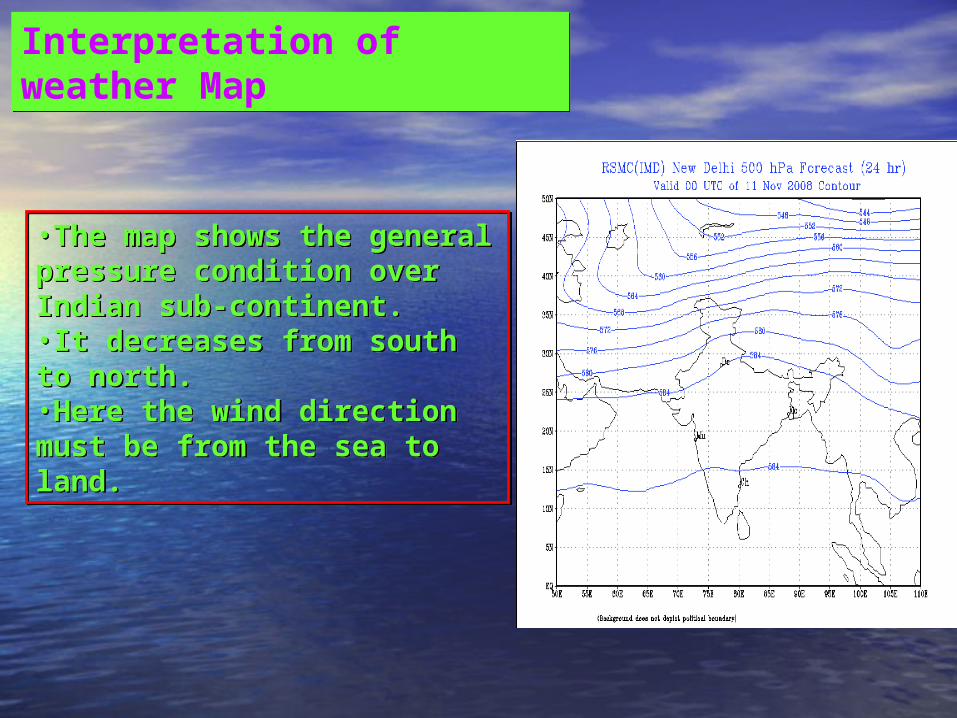
•The map shows the general pressure condition over Indian sub-continent.•It decreases from south to north.•Here the wind direction must be from the sea to land.
•The map shows the general pressure condition over Indian sub-continent.•It decreases from south to north.•Here the wind direction must be from the sea to land.
Interpretation of weather MapInterpretation of weather Map
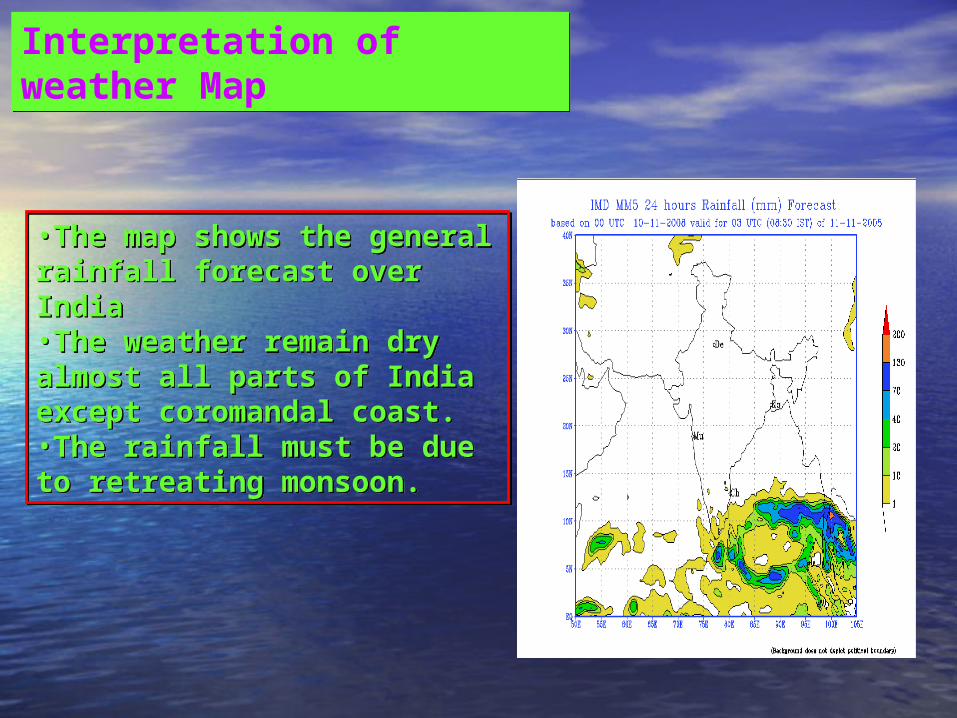
•The map shows the general rainfall forecast over India•The weather remain dry almost all parts of India except coromandal coast.•The rainfall must be due to retreating monsoon.
•The map shows the general rainfall forecast over India•The weather remain dry almost all parts of India except coromandal coast.•The rainfall must be due to retreating monsoon.
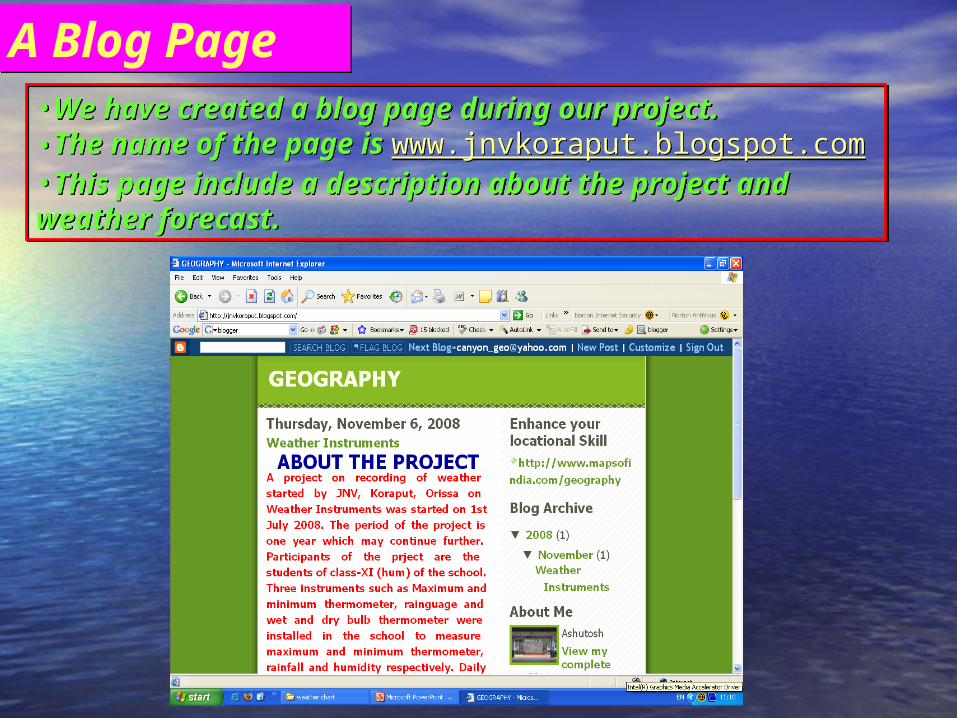
A Blog PageA Blog Page•We have created a blog page during our project.•The name of the page is www.jnvkoraput.blogspot.com•This page include a description about the project and weather forecast.
•We have created a blog page during our project.•The name of the page is www.jnvkoraput.blogspot.com•This page include a description about the project and weather forecast.
ACKNOWLEDGEMENTACKNOWLEDGEMENT
•We Thanks Mr. A. K. Mishra PGT-geography for providing help to complete the project.
•Mr. P. K. Mohanty PGT-computer Science for extending help during our project
•Mr. S. K. Tripathy, Principal for providing facilities to complete this project.
•We Thanks Mr. A. K. Mishra PGT-geography for providing help to complete the project.
•Mr. P. K. Mohanty PGT-computer Science for extending help during our project
•Mr. S. K. Tripathy, Principal for providing facilities to complete this project.