weathering profiles, mass-balance analysis, and rates of solute loss
TRANSCRIPT
For permission to copy, contact [email protected] 2002 Geological Society of America 1143
GSA Bulletin; September 2002; v. 114; no. 9; p. 1143–1158; 9 figures; 3 tables.
Weathering profiles, mass-balance analysis, and rates of solute loss:Linkages between weathering and erosion
in a small, steep catchment
Suzanne Prestrud Anderson*Center for Study of Imaging and Dynamics of the Earth, University of California, Santa Cruz, California 95064-1077, USA
William E. DietrichGeorge H Brimhall Jr.Department of Earth and Planetary Sciences, University of California, Berkeley, California 94720-4767, USA
ABSTRACT
In a headwater catchment in the OregonCoast Range, we find that solid-phase masslosses due to chemical weathering areequivalent in the bedrock and the soil.However, the long-term rate of mass lossper unit volume of parent rock is greaterin the soil than in the rock. We attributethis finding to the effects of biotic processesin the soil and to hydrologic conditions thatmaximize contact time and water fluxthrough the mineral matrix in the soil. Thisresult stems both from earlier work inwhich we demonstrated that rock and soilcontribute equally to the solute flux andfrom arguments presented here that the ba-sin is in dynamic equilibrium with respectto erosion and uplift. The silica flux of 10.76 7.1 t·km22·yr21 from the basin is severaltimes larger than the flux from older soilselsewhere, but comparable to the flux fromsites with similar physical erosion rates.This result argues that physical denudationor uplift rates play an important role in set-ting the chemical denudation rate. Physicalprocesses appear to influence chemical-weathering rates in several ways. First, theylimit chemical evolution by removing ma-terial, thus setting the residence time withinthe weathered rock and the soil. Second,bioturbation mixes rock fragments into themore reactive soil and maintains high soilporosity, allowing free circulation of water.Because the weathering in the soil is moreintense than in the rock, we argue that thechemical denudation rate will diminish
*E-mail: [email protected].
where uplift rates—and, hence, physical-denudation rates—are great enough to leadto a bedrock-dominated landscape. Chem-ical denudation rates will increase withphysical-denudation rates, but only as longas the landscape remains mantled by soil.
Keywords: chemical erosion, denudation,physical weathering, soil dynamics, uplift,weathering.
INTRODUCTION
The weathered profile, consisting of layersof weathered rock topped by soil, develops inresponse to chemical, physical, and biologicalprocesses at the Earth’s surface. The stronginterplay among these processes makes it dif-ficult to disentangle their interactions in theweathered profile. Physical weathering pro-cesses expose fresh rock and mineral surfacesto chemical weathering, whereas chemicalweathering reduces the strength of rock, mak-ing it more susceptible to physical breakdown.The interactions between these processes arewidely recognized as critical in understandingthe effects of changes in climate and of tec-tonic uplift rates on erosion (Raymo et al.,1988), landscape evolution (Anderson andHumphrey, 1989), and geochemical cycling(Gaillardet et al., 1999a).
The balance between removal of debris bytransport processes and the breakdown of rockinto movable material by weathering exerts astrong control on landscape evolution. G.K.Gilbert (1877) described the linkage betweenregolith production and erosion rates, nowcodified by geomorphologists who differenti-ate conceptually between weathering-limited
and transport-limited landscapes (Carson andKirkby, 1972). In the former, the rate of for-mation of erodible debris by physical andchemical processes controls the rate of land-scape lowering. Landscapes dominated bybare bedrock are universally recognized asweathering-limited. In contrast, landscapeswith deep regolith mantles are transport-limited. The rate of landscape lowering is lim-ited by the efficiency of transport processes,and the weathered profile thickens throughtime. Stallard (1985) demonstrated that theseconcepts could be used to explain the evolu-tion of chemical loads of large rivers.
Recent empirical advances (Heimsath et al.,1997, 1999, 2000, 2001a) support the conceptthat regolith-production rates decline under in-creasing soil cover. In an alternative model,regolith production reaches a maximum undera particular soil depth and is reduced underboth shallower and deeper soil cover (Ahnert,1967; Carson and Kirkby, 1972; Stallard,1985; Anderson and Humphrey, 1989; Rosen-bloom and Anderson, 1994; Small et al.,1999). Mechanistic justification for either typeof production rule is usually couched in termsof the effects of increasing soil depth onchemical and/or thermomechanical (Ander-son, 1999) processes.
Understanding the interplay between phys-ical and chemical weathering processes andtheir relationship to erosion rates has becomeincreasingly important in understanding geo-chemical cycles (Stallard, 1992, 1995b). Thepotential feedbacks between erosion andchemical weathering were brought to promi-nence by the erosion-driven climate changehypothesis (Raymo et al., 1988; Raymo andRuddiman, 1992). Given that global silicate-

1144 Geological Society of America Bulletin, September 2002
ANDERSON et al.
Figure 1. Photograph of the CB1 and CB2 catchments and surrounding hillslopes.View is to the southwest, oblique to the north-facing CB1 catchment. CB1 catchmentis 50 m long and ;20 m wide near the ridge crest. CB2 is 95 m long and ;45 m wide.Soil pits were located in CB2 to avoid disturbance to CB1. Star shows location of deepcore (Fig. 2).
weathering rates exert an important control onthe long-term C dioxide content of the atmo-sphere (Holland, 1978; Berner, 1990), if sili-cate chemical weathering is linked to physicaldenudation and tectonic uplift (Ruddiman andPrell, 1997), then weathering and erosion maydrive climate change. A number of workershave stressed the importance of physical ero-sion in enhancing chemical-weathering rates(Stallard, 1992, 1995a; Gaillardet et al.,1999a, 1999b; Riebe et al., 2001), whereasWhite and Blum (1995) found little correla-tion between chemical weathering and physi-cal erosion rates. The relationship betweenphysical processes and chemical weatheringhas not been elucidated at a mechanistic level,but this mission is most likely to be accom-plished in a small catchment, where there ismore control on rock type, vegetation, and lo-cal climate.
We present here a detailed study of theweathered profile in a headwater catchment inthe Oregon Coast Range (Fig. 1) and of theprocesses that have shaped it. We use chemi-cal analyses of soil and bedrock as well asprior work on soil water chemistry (Anderson
et al., 1997a; Anderson and Dietrich, 2001)and catchment hydrology (Montgomery et al.,1997; Anderson et al., 1997b; Torres et al.,1998). Previously, we have shown that half ofsolutes exported from the catchment are pro-duced in the soil and half in the bedrock.Here, we quantify solid-phase mass gains andlosses in the weathered profile, and we deter-mine the time for weathered-profile develop-ment. This approach allows us to compare thelong-term rate of mass loss in the bedrock andsoil.
The field site does not represent extremesof either physical or chemical weathering con-ditions. Instead, one expects both relativelyvigorous physical processes (owing to thesite’s steep slopes and active tectonics) andactive chemical weathering (driven by themoderately heavy rainfall). Biological influ-ences on weathering processes are both phys-ical and chemical in nature and are well ex-pressed in the catchment. Climate variationsince the Pleistocene has been relatively mod-est (Worona and Whitlock, 1995); hence, cur-rent processes are similar to those that shapedthe landscape. The uplift rate in the Oregon
Coast Range drives sufficient erosion to keepthe soils relatively thin, but is not so high asto produce large tracts without appreciablesoil development. The rainfall rate is highenough to produce measurable weathering inthe rock and soil during their relatively brieftransit through the weathered zone.
Our exploration of weathered-profile devel-opment takes several tacks. First, we describethe weathered profile and its spatial variation.A chemical mass-balance technique (Brimhalland Dietrich, 1987) allows quantification ofthe mass gains and losses of individual chem-ical elements relative to fresh parent rock.Second, we compare the alteration of the rockwith measured solute fluxes from the catch-ment, permitting comparison of present-dayweathering processes with time-integratedchemical losses from the bedrock. We canthen quantify the rate of mass loss due toweathering in the bedrock and in the soil. To-gether, these analyses show that physical pro-cesses open the bedrock up to hydrologic pro-cesses and drive the production of soil.Chemical processes attack the rock vigorouslyonce it is in contact with air, rainwater, andthe biosphere, but this activity must be viewedas a consequence of the environment producedby physical processes.
Setting
The study site is the 860 m2 CB1 catch-ment, located in the Oregon Coast Range nearCoos Bay, Oregon (Fig. 1). Topography of theOregon Coast Range is marked by steep hill-slopes bounded by bedrock and gravel chan-nels. Alluvial fills are confined to narrow val-leys along the coast inundated by lateHolocene sea-level rise (Personius, 1993; Per-sonius et al., 1993). Uplift of rock beneath theCoast Range (Adams, 1984; Kelsey et al.,1994) continually generates steep topographicgradients to drive incision of streams and ero-sion of hillslopes. The record preserved in ma-rine terraces yields rock-uplift rates of 0.03–0.23 mm·yr21 over the past 80–125 ka alongthe southern Oregon coast (Kelsey et al.,1994, 1996), probably ;0.1 mm·yr21 in thevicinity of Coos Bay (H. Kelsey, 1994, per-sonal commun.).
Soils are thin in the Coast Range, but soildepth varies considerably. Erosion rates overthe southern Oregon Coast Range have been0.05–0.08 mm·yr21 for the past 4–15 ka (Re-neau and Dietrich, 1991; Reneau et al., 1989),roughly equivalent to the long-term upliftrates. Reneau and Dietrich (1991) found thatbedrock-lowering rates (also called ‘‘exhu-mation rates’’ by England and Molnar, 1990),

Geological Society of America Bulletin, September 2002 1145
LINKAGES BETWEEN WEATHERING AND EROSION IN A SMALL, STEEP CATCHMENT
determined from colluvium in-filling rates ofunchanneled valleys in the Oregon CoastRange, were equal to sediment yield instreams. The equivalence of denudation ratesacross spatial scales from 1 to 1500 km2 sug-gests that there are no changes in sedimentstorage in the system. Recent catchment-averaged regolith-production rates of 0.117mm·yr21 (Heimsath et al., 2001b) also matchuplift and denudation rates. Heimsath et al.found considerable variability in regolith-production rates over a small spatial scale(meters to tens of meters), however, whichthey attributed to both the stochastic nature ofthe biogenic processes that form the regolithand the effects of local competition betweendrainage networks and episodic erosionalevents. At scales greater than these variations,however, the landscape appears to be in dy-namic equilibrium, and uplift rates are equalto denudation rates.
Catchment Description
The CB1 catchment is an unchanneled val-ley, a basin with convergent bedrock topog-raphy that forms the contributing area to afirst-order stream (Fig. 1). The outlet of theCB1 catchment is the head of an ephemeralfirst-order stream. The steep (458) slopes ofthe catchment are thinly mantled with soil,which supported a Douglas fir (Pseudotsugamenzeisii) forest until the area was logged in1987. It was replanted in 1988. The catchmentis underlain by the Eocene Flournoy Forma-tion, a rhythmically bedded graywacke sand-stone containing quartz, feldspar, and lithic(volcanic) fragments in a matrix of clay min-erals (Baldwin, 1974, 1975).
The CB1 catchment and the adjacent,slightly larger CB2 catchment were monitoredhydrologically from December 1989 to Feb-ruary 1992 (CB2) or November 1996 (CB1).Monitoring ended in both cases because oflandslides. Sprinkling experiments weremounted in CB1 to study the hydrology andwater chemistry in the runoff (Anderson et al.,1997a, 1997b; Montgomery et al., 1997; Tor-res et al., 1998).
METHODS
Spatial variations in the weathered profilewere documented by coring, hand augering,and digging soil pits. A 35-m-long, 65-mm-diameter core was obtained at the top of theCB1 catchment with a truck-mounted drill rig.Core recovery averaged 93% below the upper3 m, which were air blasted without recovery.The channel head is located ;42 m below the
catchment divide, and the sandstone beds dipno more than 88–158S into the slope. This coreis therefore representative of the bedrock un-derlying most of CB1 and CB2. Eleven shallowbedrock borings within the catchment weremade with a portable diamond-bit corer (Mac-Donald, 1988); these cores generally had poorrecovery, but pieces up to 0.5 m long helpedcharacterize bedrock at points within the catch-ment. About 100 holes were hand-augered inthe catchment to delineate the soil and saprolitethickness. Examination of exposures of the soil/bedrock interface in landslide scars also con-tributed to our understanding of the spatial dif-ferences in weathered-profile development.
Twenty samples were taken from the 35 mcore to characterize the unweathered parentmaterial and the weathered rock. Fourteen soilsamples were collected with a piston corer intwo soil pits in the CB2 catchment (Fig. 1).CB1 and CB2 soils are comparable, as theyare derived from the same bedrock and are ata similar stage in the hollow-filling cycle(Dietrich et al., 1986).
Rock bulk densities were determined bywater displacement of wax-coated samples(average size, 72 cm3). Soil bulk densitieswere determined for oven-dried piston coresamples. Grain-density determinations weremade with a pycnometer on milled rock ordisaggregated soil. Rock and soil sampleswere prepared for chemical analysis by pro-ducing pulps with a disc mill. Determinationsof Al, Ti, Mg, Ca, Na, K, and Fe were doneon La2O3 solutions of HF-digested sampleswith a Perkin-Elmer 3030 flame atomic ad-sorption spectrometer. Determinations of Siand Zr were done with XRF (X-ray fluores-cence) spectrometry (Spectrace 440) on fusedand pressed pellets, respectively. C and Nwere analyzed with a Perkin-Elmer ModelPE2400 CHNS/O analyzer.
Thin sections of six samples from the coreand two samples from the soil pits were point-counted to document the mineral assemblage.Quartz was distinguished from feldspar on thebasis of twinning, which may have resulted inan undercounting of feldspar grains (ourquartz counts are higher than those that Lovell(1969) and Dott (1966) obtained in formationssimilar to the Flournoy).
Soil waters were sampled with 34 suctionlysimeters and two zero-tension lysimetersduring a February 1992 winter storm with athree-day total rainfall of 144 mm, and duringa catchment-scale sprinkling experiment (ex-periment 3) in May–June 1992. Peak runoffduring the storm was 10 times greater thanduring the sprinkling experiment. For experi-ment 3, a nearly steady ‘‘rain’’ of 1.6 mm·h21
(38 mm·d21) was applied over the entire catch-ment for one week. The intensity was selectedto typify storms in the region; it is equivalentto a 24 h event with ,1 yr recurrence interval(Montgomery et al., 1997). Analysis of dailyrainfall for two years shows that daily rainfalltotals $38 mm occur in ;10% of annual raindays (National Climate Data Center [http://lwf.ncdc.noaa.gov/oa/ncdc.html] records forNorth Bend Airport). In 1983 (annual rainfall150% of normal), days with $38 mm rain ac-counted for 26% of the annual total, while in1992 (annual rainfall 92% of normal), dayswith $38 mm rain accounted for 16% of theannual total. Experiment 3 was long enoughthat quasi-steady flow conditions were reachedin the soil and outlet channel (Anderson et al.,1997b; Torres et al., 1998).
Soil water samples were field filtered (0.45mm) and analyzed for cations and silica byinductively coupled plasma–mass spectrome-try and for anions by ion chromatography (seeAnderson and Dietrich, 2001, for details). Al-kalinity was measured by titration with 0.1NHCl by using the Gran method. ‘‘Organic an-ions’’ were estimated from the difference be-tween cation and anion concentrations (Dahl-gren and Ugolini, 1989).
RESULTS
The Weathered Profile
We divided the weathered profile into fourlayers based on differences in physical prop-erties, fractures, and degree of weathering(Fig. 2). There is great contrast, chiefly in bulkdensity (Fig. 3) and organic C content, be-tween soil and bedrock. Saprolite is presentspottily in the catchment. We identified twolayers within the weathered bedrock below thesaprolite. The predominant lithology in theunweathered rock is fine-grained graywacke.Minor calcite-cemented graywacke was asso-ciated with faults and fractures.
The soil in the CB1 catchment is classifiedas Haplumbrept by the Soil Conservation Sur-vey (Haagen, 1989), reflecting its limited ped-ogenic development. The soil is an extremelyporous (average bulk density of 740 6 190kg·m23) sandy loam. It is also organic rich; Ccontent averages 2.5 wt%, and reaches as highas 10 wt% in the surface litter (Anderson andDietrich, 2001). The soil surface is hummockyowing to the presence of tree-throw moundsand the spoils and tunnels of burrowing ani-mals. The boundary between soil and bedrockis abrupt. A thin layer of saprolite underliesthe soil in some areas in the catchment. Thesaprolite is orange to tan in color and lacks
1146 Geological Society of America Bulletin, September 2002
ANDERSON et al.
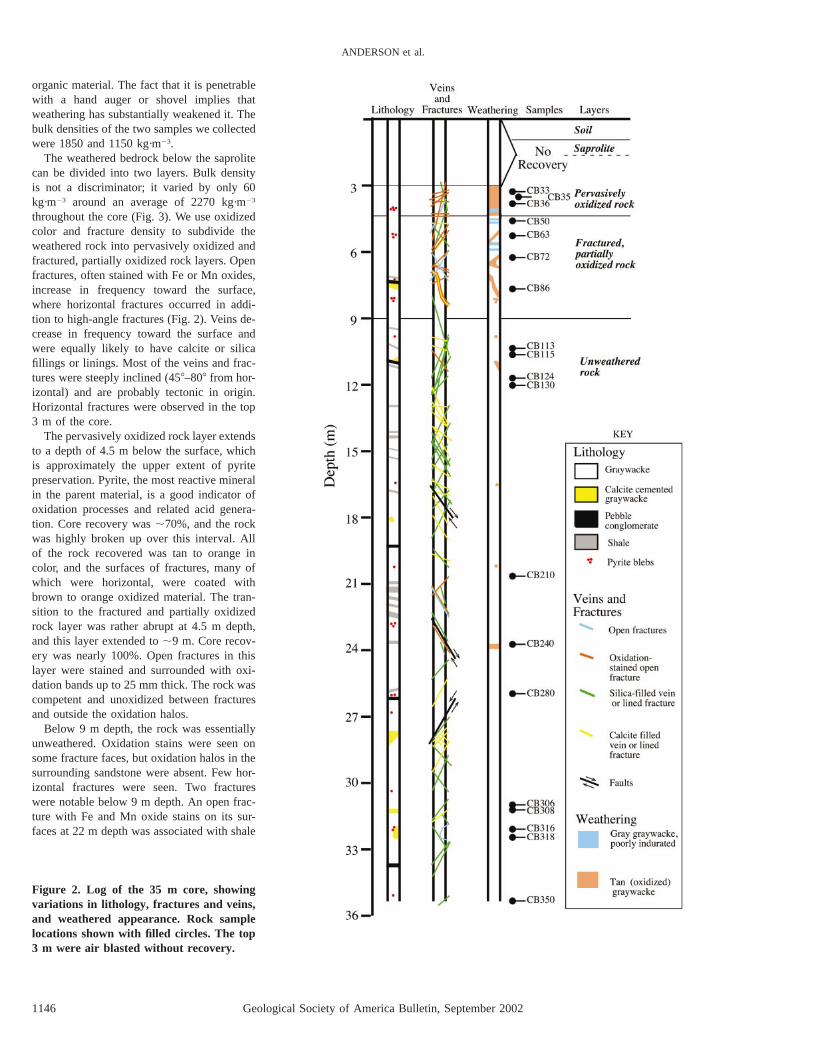
Figure 2. Log of the 35 m core, showingvariations in lithology, fractures and veins,and weathered appearance. Rock samplelocations shown with filled circles. The top3 m were air blasted without recovery.
organic material. The fact that it is penetrablewith a hand auger or shovel implies thatweathering has substantially weakened it. Thebulk densities of the two samples we collectedwere 1850 and 1150 kg·m23.
The weathered bedrock below the saprolitecan be divided into two layers. Bulk densityis not a discriminator; it varied by only 60kg·m23 around an average of 2270 kg·m23
throughout the core (Fig. 3). We use oxidizedcolor and fracture density to subdivide theweathered rock into pervasively oxidized andfractured, partially oxidized rock layers. Openfractures, often stained with Fe or Mn oxides,increase in frequency toward the surface,where horizontal fractures occurred in addi-tion to high-angle fractures (Fig. 2). Veins de-crease in frequency toward the surface andwere equally likely to have calcite or silicafillings or linings. Most of the veins and frac-tures were steeply inclined (458–808 from hor-izontal) and are probably tectonic in origin.Horizontal fractures were observed in the top3 m of the core.
The pervasively oxidized rock layer extendsto a depth of 4.5 m below the surface, whichis approximately the upper extent of pyritepreservation. Pyrite, the most reactive mineralin the parent material, is a good indicator ofoxidation processes and related acid genera-tion. Core recovery was ;70%, and the rockwas highly broken up over this interval. Allof the rock recovered was tan to orange incolor, and the surfaces of fractures, many ofwhich were horizontal, were coated withbrown to orange oxidized material. The tran-sition to the fractured and partially oxidizedrock layer was rather abrupt at 4.5 m depth,and this layer extended to ;9 m. Core recov-ery was nearly 100%. Open fractures in thislayer were stained and surrounded with oxi-dation bands up to 25 mm thick. The rock wascompetent and unoxidized between fracturesand outside the oxidation halos.
Below 9 m depth, the rock was essentiallyunweathered. Oxidation stains were seen onsome fracture faces, but oxidation halos in thesurrounding sandstone were absent. Few hor-izontal fractures were seen. Two fractureswere notable below 9 m depth. An open frac-ture with Fe and Mn oxide stains on its sur-faces at 22 m depth was associated with shale

Geological Society of America Bulletin, September 2002 1147
LINKAGES BETWEEN WEATHERING AND EROSION IN A SMALL, STEEP CATCHMENT
Figure 3. Bulk density, grain density, and porosity as a function of depth in soil andbedrock. Note the vertical-scale break below the saprolite layer; samples in the upper boxare from soil pits 1 and 2 in CB2; samples below this are from the core in CB1 (Fig. 1).
Figure 4. Longitudinal profile andcross sections of the catchment,without vertical exaggeration. Theboundaries of weathered-rock lay-ers are extrapolated between tiepoints of the 35 m core at the topof the profile and bedrock boringsindicated with vertical lines. Ac-cess rows across the site are num-bered consecutively from bottomto top; cross sections at a few rep-resentative rows are shown.
beds. More oxidation was evident along afault at 24 m depth. Below these features, allthe rock was competent and gray in color, andno oxidation stains were seen.
Spatial Variation in Weathered-ProfileDevelopment
All of the weathered layers in the bedrockbecome thinner downslope (Fig. 4). The soilthickens downslope, reaching a maximum;15 m above the channel head. Cross sectionsat right angles to the longitudinal profile showthe soil accumulations in the hollow. Averagesoil depth is 0.70 6 0.41 m (n 5 104). Sap-rolite is present as a nearly continuous layerin the top third of the catchment. It is thin ormissing under the deepest soil in the hollowaxis in the lower third of the catchment, prob-ably owing to removal in periodic landslidingevents. The saprolite varies tremendously inthickness where it is found (0.23 6 0.26 m, n5 36, excluding borings with no saprolite).The variations in saprolite thickness found onthe east nose are suggestive of blocky corestone-style weathering and are consistent withobservations of Heimsath et al. (2001b) andwith patterns seen in roadcuts.
Mineral Assemblage Variations
The mineral assemblage of the graywackeparent material is dominated by quartz, feld-

1148 Geological Society of America Bulletin, September 2002
ANDERSON et al.
TABLE 1. MINERALOGY OF SELECTED SAMPLES
Parent rock Pervasively oxidized rock Soil
Sample: CB350 CB318 CB306 CB43 CB35 CB33 Pit1 Pit2
Sample depth (m) 35.0 31.8 30.6 4.3 3.5 3.3 0.3 0.6Points counted 200 100 90 100 100 100 100 100
Quartz 40 52 40 44 39 40 32 35Plagioclase 14 15 13 8 3 6 2 2Alkali feldspar 3 4 0 2 1 1 0 0Lithic 7 8 14 13 5 9 4 6Biotite 6 1 6 3 5 4 2 2Hornblende 3 3 1 2 4 3 0 4Muscovite 0 3 1 0 2 2 2 0Glass (volcanic) 6 1 2 2 15 0 0 0Opaque 1 2 0 0 0 2 0 2Groundmass 20 11 17 14 15 24 21 43Reddish groundmass* 0 0 6 11 11 6 36 26Void† 1 0 0 1 0 6 53 54Quartz/plagioclase 2.9 3.5 3.1 5.5 13.0 6.3 15.0 16.0
Note: All mineral abundances reported as percent of nonvoid points.*Organic matter or oxides.†Percentage of total points that were voids.
spar, and lithic (volcanic) fragments in a fine-grained groundmass (Table 1). A decline inplagioclase and an increase in reddish ground-mass are the primary differences between theparent rock and the pervasively oxidized rock.Variation between the parent-rock samples isas great as any variation within the weatheredprofile for mica, lithic, hornblende, or alkalifeldspar contents. Pitted and weathered quartzand plagioclase grains are evident throughoutthe core, but are present in greater abundancein oxidized rock samples. Fractures were linedwith reddish-colored groundmass in the per-vasively oxidized rock layer (thin sectionsCB33 and CB35), and the mineral grains edg-ing the fractures were more likely to be pittedthan those in unfractured parts of the thin sec-tion. In these weathered-rock samples, a high-birefringence groundmass appeared to coatmany mineral grains, especially those liningfractures.
In the soil samples, quartz, feldspar, biotite,and volcanic-glass abundances were lowerthan in the rock, whereas reddish groundmassand void spaces were more common. The ratioof quartz to plagioclase increased by a factorof three to five. The groundmass was uniform-ly reddish in color and, in places, was nearlyopaque because of either organic material oroxides. All mineral grains within rock frag-ments in the soil were pitted and embayed,and overgrowths were common. Plagioclasewas found in the soil, but it was much lessabundant than in the fresh parent rock.
WHOLE-ROCK CHEMISTRY:QUANTIFICATION OF WEATHERINGALTERATION
Mass-Balance Model
We quantified elemental losses and gainsthat accompany weathering in the soil androck through the use of a chemical mass-balance model (Brimhall et al., 1985, 1991,1992; Brimhall and Dietrich, 1987). The mod-el is predicated on identification and charac-terization of the parent rock. Physical defor-mation, or strain, accompanying weatheringcan be calculated by conserving the mass ofan element that is unaffected by chemicalweathering. Thus, both the chemical transfor-mations and physical deformation of weath-ering can be quantified with this simplemodel.
The mass of a chemical element, j, in a vol-ume of weathered material, Vw, is equal to themass of the element in the volume of freshparent rock, Vp, that weathered to produce Vw
and the mass of the element added or lost inthe weathering process, mj,flux:
1(V r C )w w j,w100
15 (V r C ) 1 m , (1)p p j,p j,flux100
where r is the bulk density, Cj is the concen-tration in weight percent of element j, and thesubscripts w and p refer to weathered materialand parent rock, respectively. In order toquantify the mass gains or losses associatedwith weathering, the volume changes that ac-company weathering must be known. For anelement that is immobile during weathering,and that does not have an external source, themj,flux term of equation 1 is zero. In this case,equation 1 can be solved for the volumetricstrain, «i,w, of the weathered material relativeto the parent rock:
V r Cw p i,p« 5 2 1 5 2 1. (2)i,w V r Cp w i,w
Here the subscript i replaces j to emphasizethat equation 2 applies only for an immobileelement.
The strain from equation 2 can be used tocalculate mass gains or losses due to weath-ering from equation 1. These are expressed asabsolute mass changes per unit volume of par-ent rock, dj,w, with units of mass per unit vol-ume:
mj,fluxd [j,w Vp
1 Ci,p5 C r 2 r C (3)j,w p p j,p1 2100 Ci,w
or as percent mass changes relative to themass of the element in parent rock with thedimensionless element-mass-transfer coeffi-cient, tj,w:
m C Cj,flux j,w i,pt [ 100 5 2 1. (4)j,w V r C C Cp p j,p j,p i,w
Equations 3 and 4 show explicitly the de-pendence of these calculated mass gains andlosses on elemental concentrations and parent-rock density. Errors in measurements of soilbulk density propagate only into the calcula-tion of strain (equation 2) and not into thecalculation of mass gains and losses (equa-tions 3 and 4).
Addition of material to the soil surfacethrough eolian deposition is a possible sourceof error in the mass-balance analysis. We thinkthat eolian inputs are not likely to be signifi-cant in the CB1 soil given the long distancefrom Asian dust sources, the relatively wet cli-mate (minimizing local sources), and theyoung age of the soils.
Mass-Balance Model Results
We used three of the deepest samples fromthe core to define parent material. The threesamples (CB306, CB318, and CB350; see Fig.2 and Table 1) are from .5 m below the per-manent water table at 25 m and are composedof competent graywacke lacking visible oxi-dation. The average chemical composition ofthese samples defined the Cj,p and Ci,p termsin all calculations. Strains within the soil cal-culated by assuming Ti and Zr immobility de-scribe a nearly perfect 1:1 relationship; in thecalculations that follow we use Zr as the im-mobile element.

Geological Society of America Bulletin, September 2002 1149
LINKAGES BETWEEN WEATHERING AND EROSION IN A SMALL, STEEP CATCHMENT
Figure 5. Profile of volumetric strain, «, in the soil and weathered-rock layers. Strain iscalculated from equation 2 by assuming Zr immobility; error bars show the variationsdue to the range of parent-material composition. Note the depth-scale break below thesaprolite.
Soil and bedrock are dramatically differentin their physical properties (Fig. 3). Soil bulkdensities are less than half those of bedrock,and porosities are correspondingly large. Thedecline in bulk density arises from formationof porosity. Consequently, the measured strainis large and positive in the soil, but essentiallyzero within the rock (Fig. 5). The saprolitesamples show positive strains that are inter-mediate between deep soil and rock. Most ofthe soil has undergone a positive strain of ;2:i.e., a parcel of rock expands by 100% whenconverted into soil.
Variability in the parent-rock compositionleads to some uncertainty in the mass-balancecalculations. In Figure 6, shaded swaths showthe effect of compositional differences be-tween the three parent-rock samples on tj,w.Only values that fall outside of this swath canbe considered different from the parent rock.This uncertainty is greatest for Al and Si, be-cause of the large variations in their concen-trations in the parent rock and their small per-centage changes through the weatheredprofile.
The mass transfers of individual elementsare greatest within the soil (Fig. 6). Up to 50%of the Ca and 25% of the Mg and Na origi-nally present in the rock has been removedfrom the soil. The calculated mass transfers of
Si in the soil do not fall outside the range ofvariability in the parent rock, except for theshallowest sample. Nonetheless, all tSi,w val-ues within the soil are negative, rather thandistributed about zero, suggesting that silicahas been lost from the soil, but the depletionsare at the limits of detection with this method.If the silica data are taken at face value, theyamount to ;10% loss in the soil relative tothe parent rock. C (and N—not shown, butwell correlated with C) both show dramaticgains in the soil, reflecting organic matter ac-cumulation. K, which is biologically cycled,shows a slight accumulation in the shallowestsoil sample that probably reflects transport upinto plants and redeposition in leaf litter onthe soil surface (note the association of posi-tive tK,w with an extremely high C addition).K retention in the soil follows from the pres-ervation of muscovite in at least one soil pit(Table 1). Al and Fe show slight mass gainsin the soil profile, although as with Si, themass transfers for these elements do not riseabove the parent-rock variability. Our parent-rock samples appear anomalously low in Al.Nearly all samples in the profile, including allbut one of the unweathered-rock samples,show Al additions relative to the parent ma-terial. The absolute mass changes in the soilare summarized in Figure 7, which shows that
in absolute terms, mass losses rank Si . Ca. Na $ Mg, whereas C dominates the massgains. Both soil pits yield a total mass losswithin the soil column of ;100 kg·m22.
The two saprolite samples stand out fromboth the soil and the weathered rock (Fig. 6).Both samples have Ca and Na losses compa-rable to those of the overlying soil, but lackthe slight silica losses and significant C ad-ditions of the soil. There are accumulations ofAl and K in the saprolite not seen elsewhere.We tentatively attribute these to translocationof these elements from the soil because ofpodzolization. In contrast, depth trends in themass transfers are not apparent below the sap-rolite. One sample at 3.5 m depth shows sig-nificant loss of Al, Si, and other cations,whereas samples at 3.3 and 3.6 m do not showthese losses. All of these samples are abovethe highest occurrence of macroscopic pyritegrain accumulations in the core. The deple-tions measured in the sample at 3.5 m mayreflect the local effects of acid hydrolysis driv-en by pyrite oxidation (Brimhall et al., 1985).Additional scatter in tj,w below the saprolite iscomparable to the variability in the parent ma-terial. The saprolite appears therefore to betruly transitional between the organic-rich,weathered soil and the barely altered weathered-rock layers. The bulk density of the saproliteis lower than the weathered rock below it, alsosuggesting that it has undergone significantmass losses due to weathering.
Comparison with Other Observations
This quantitative analysis of mass losses inthe rock and soils is in accord with the mineralvariations in the profile (Table 1). We con-clude that the weathered appearance arisesfrom oxidation of mafic minerals, whichchanges the color of the rock without alteringits composition or mass. A pair of samples at6.3 m depth from the inside and outside of anoxidation halo around a fracture supports thisview. The pair of samples did not display sig-nificant differences in mass transfers (tj,w) forany element (Fig. 6), other than a slight ac-cumulation of Fe in the oxidized sample. Insummary, measurable weathering is limited tothe soils and saprolite, where Ca, Na, and Mghave been significantly depleted, and silicahas probably been lost, in agreement with thelosses in quartz, feldspar, and volcanic glassseen in the thin sections.
Moreover, the data are consistent with theobservation that physical disruption, such asbioturbation, is the primary mechanism ofregolith production. The positive strain of 2 ormore in the soil is roughly an order of mag-

1150 Geological Society of America Bulletin, September 2002
ANDERSON et al.

Geological Society of America Bulletin, September 2002 1151
LINKAGES BETWEEN WEATHERING AND EROSION IN A SMALL, STEEP CATCHMENT
Figure 6. Calculated mass gains and lossesof major cations, silica, and Al in theweathered rock and soil relative to un-weathered parent rock. On each plot, theupper scale expresses changes as a percent-age relative to the element mass in the par-ent rock (tj,w), whereas the lower scaleshows the absolute mass changes per unitvolume of parent rock (dj,w). Error barsrepresent variations due to the range ofparent-material composition on each cal-culation. Vertical shaded swath shows theeffect of this variability on the three parent-rock samples; samples that plot outside ofthis zone clearly differ in composition fromparent material. Circled pair of samples at6.3 m depth (within the weathered rock)are from the oxidation halo around a frac-ture and the gray, fresh-looking rock out-side the halo. Two calcite-cemented samplesare off scale to the right on the Ca plot.N
Figure 7. Summary of absolute mass gains and mass losses (dj,w) in two soil pits in theCB2 catchment. Si and the cations Ca, Na, and Mg are depleted throughout the soilsdepth; C, N, and Al show mass additions in the soil (shaded side of plot). The mass lossescan be summarized as Si . Ca . Na $ Mg; mass gains are dominated by C. The deepestsample in each profile is saprolite collected from the bottom of the soil pits. The totalmass loss in a column of soil for each pit is reported.
nitude greater than can be explained by addi-tion of organic matter, given a calculated dj,w
of ;100 kg·m23 for C in the soil and any plau-sible bulk density for organic matter. Disso-lution of silicate minerals produced mass loss-es in the soil relative to the parent rock of100–150 kg·m23 (Fig. 7), which correspondsto a porosity increase of 0.04–0.06 for a min-eral density of 2600 kg·m23. At most, then,only ;5% of the soil porosity can be attri-buted to dissolution of minerals. Most of theporosity and dramatic positive strains in thesoil can be credited neither to dissolution ofminerals nor to incorporation of organic mat-ter. This finding leads to the conclusion thatthe strains are derived from purely physicalincreases in void space, such as would becaused by stress-releasing exfoliation fractur-ing and by bioturbation- and creep-drivenmixing of rock and organic matter.
It is easy to draw the conclusion that phys-ical disruption of the soils is important in theirgenesis from observations of tree throw, ani-mal burrowing (particularly by mountain bea-vers, Aplodontia rufa), the rapid degradationof landslide scars in the field area, and thevery low bulk density of the soil. Exfoliationand raveling on bare bedrock surfaces, andscour during landslides and debris flows, mayalso be important in the transformation of rockinto soil, although these processes are likelyto be of secondary importance because theyoperate over limited areas. Without measuringthe rates of these physical processes, however,it is difficult to verify their influence on soilproduction. The argument just outlined is in
accord with our conclusion from the soil waterchemistry (Anderson and Dietrich, 2001). Thesolute-concentration profiles of the soil watershould lead to the development of Spodosolswithin the likely residence times of the soilson these slopes. Spodosols are found on alluplifted marine terraces in the vicinity (Bock-heim et al., 1996). The lack of spodic horizonsin the CB1 soil we attribute to more frequentdisruption of the soil and litter by physicalprocesses than occurs on the low-gradientterraces.
Comparison with Solute Fluxes
To the extent that current weathering pro-cesses are reflected in the soil profile, thereshould be a correspondence between the pat-tern of solute-mass fluxes and the mass-transfercoefficients calculated from the soil (Stones-
trom et al., 1998; White et al., 2002). Wetherefore compare solute profiles with the solid-phase mass transfers.
Under the steady flow conditions of oursprinkling experiment, soil water solute con-centrations are proportional to solute fluxes.How representative are the soil water soluteconcentrations during steady flow in our sprin-kling experiments of typical conditions?Clear-cut logging in 1987 is thought to havehad minimal effect on soil water and runoffcompositions measured in 1992. Catchmentwater yield and stream chemistry generally re-turn to baseline within five years (Jewett et al.,1995; Swank et al., 2001). In Oregon CoastRange soils, nutrient concentrations do notvary between 5 yr stands and old growth (En-try and Emmingham, 1995). Also, runoffchemistry varies ,20% per tenfold variationin discharge over a range of four orders of

1152 Geological Society of America Bulletin, September 2002
ANDERSON et al.
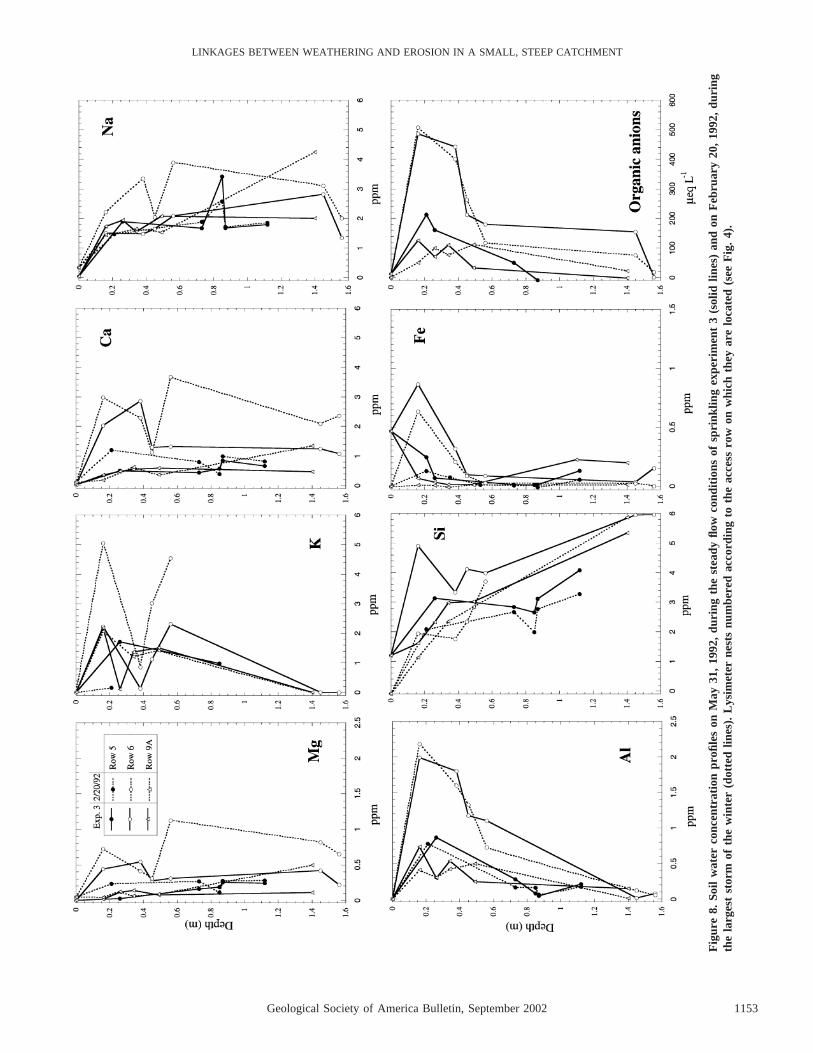
magnitude. Runoff composition variations areattributed to changes in flow paths and resi-dence time of water in bedrock under differenthydrologic conditions (Anderson et al.,1997a). Soil water solute concentrations werequite stable throughout experiment 3 (Ander-son and Dietrich, 2001). In Figure 8, we showthat soil water during experiment 3 is com-parable with soil water from the peak of awinter storm (February 20, 1992). The stormhad a peak rainfall intensity of 15 mm·h21, anorder of magnitude greater than experiment 3,and produced instantaneous discharge 10times greater than experiment 3 (Anderson etal., 1997b). Because of the remarkable consis-tency in soil water during these different hy-drologic conditions and different times in thegrowing season, we feel that the steady flowcondition is representative of typical soluteflux conditions.
The mass balance of any constituent in avertical column of soil during steady soluteflux conditions is
]M5 2= ·Qd]t
]Q ]Q ]Qx y z5 2 2 2 , (5)]x ]y ]z
where M is the mass and Qd is the dissolvedmass flux per unit area of that constituent.Noting that the solute fluxes may be writtenQi 5 UiC, where Ui is the water velocity inthe i direction and C is the solute concentra-tion, and given the specific conditions ofsteady vertical flow achieved in experiment 3,equation 5 simplifies to
]M ]C5 2U . (6)z]t ]z
Because the vadose-zone water during exper-iment 3 moved vertically at a constant veloc-ity, Uz, within the soil (Torres et al., 1998),interpretation of mass change in the soil re-sulting from the solute flux is straightforward.Regions of increasing concentration withdepth undergo net mass removal, whereas re-gions of negative solute concentration gradi-ents accumulate the solute in question.
The increasing Si concentrations in soil wa-ters with depth (Fig. 8) show that silica is lostin solution throughout the soil profile owingto chemical weathering. Our analysis of thesolid phase suggest silica losses throughoutthe soil profile (Fig. 6). If we take the soilsilica data at face value, a stance in accordwith both the thin-section analysis and the factthat all soil samples have negative dSi,w values,
we find that the greatest solid-phase masslosses in the soil are from silica and these arerelatively uniformly distributed through thesoil profile (Fig. 7). The humped solute pro-files of Al, Fe, and K should result in trans-location and accumulation of these specieswithin the soil; instead, all show small massgains (accumulation) in the solid phasethroughout the soil pits, with no evidence ofa zone of removal. Ca and Na display rela-tively uniform solute concentrations withdepth, after a steep rise in the top 0.2 m ofthe soil. This circumstance should yield masslosses of these elements concentrated near thesoil surface, yet both show uniform mass loss-es throughout the soil solid phase. Mg soluteconcentrations are lowest of all the cations,which is reflected in Mg mass losses in thesolid phase being lower than Na and Ca. Ingeneral, the solute-concentration profiles sug-gest that mass losses should be concentratednear the soil surface, rather than be uniformwith depth.
Some of the discrepancies between the sol-ute behavior and the mass changes in the solidphase may arise from the fact that solutes andsoils were not sampled within the same pro-file. A more significant difference between thetwo records, however, is that the solute pro-files show one moment in time, whereas thesolid-phase profiles show the accumulated ef-fects of weathering over significant periods oftime (several thousand years). Mechanicalmixing will tend to obliterate vertical patternsof mass change through homogenization.Changes in solute concentrations of K, Al, Ca,and Na are greatest in the top 0.5–0.6 m ofthe lysimeter profiles (Fig. 8), and therefore,gradients in the solid-phase mass gains andlosses of these elements should be found with-in this depth range in the soil pits. The relativeuniformity of the mass losses of Ca and Nathrough the soil profiles and the absence of azone of removal of Al and K in the solid phase(Fig. 6) suggest that, over time, bioturbationhomogenizes the soil to at least these depths.Si concentrations in the soil solution increasesteadily downward through the lysimeter pro-files, which should result in uniform masslosses of silica in the soil profiles, a patternthat cannot be disrupted by bioturbation. Ex-cept for the litter sample at the top of soil pit2, and the saprolite samples at the bottoms ofboth soil pits, mass losses of silica are rela-tively uniform in the soil pits, in agreementwith the prediction from solute profiles. Thus,the soil water chemistry, the soil development,and the elemental chemistry of the soils allpoint to physical processes being very impor-
tant in the genesis and subsequent evolutionof the soils in the CB1 catchment.
RATE OF MASS LOSS IN SOILVERSUS ROCK
From the analysis of mass losses in the sol-id phase, it is easy to get the impression thatall weathering takes place within the soil. Thisinterpretation is at odds, however, with a con-clusion from experiment 3 that solute fluxesfrom the site were derived roughly equallyfrom the soil and from the bedrock (Andersonand Dietrich, 2001). The total solute fluxthrough the soil, calculated from the soil waterTDS (total dissolved solids) concentrationsand vadose-zone water flux, equaled half ofthe total solute flux out of the catchment dur-ing experiment 3. Soil water travels throughthe bedrock before emerging at the channelhead, and therefore the additional solute in therunoff must be derived from bedrock. Becausethe soil thickness is less than the weathered-rock thickness, this observation suggests thatweathering in the soil is more intense than inthe bedrock.
To explore this proposition, we computedthe rate of mass loss per unit volume of parentrock measured over the time scale for devel-opment of the weathered profile. We first es-tablished the residence time for parcels of rockin the weathered rock and of soil layers in theweathered profile. We used several methods toaddress the determination of residence timefor the soil and a single method—based onuplift rates—for the weathered rock. Resi-dence time in both layers must be set by theuplift rate and layer thickness, assuming thatthese layers have constant thickness throughtime. This condition is equivalent to an as-sumption of a landscape in dynamic equilib-rium (Hack, 1960; Pavich, 1986); that is,maintenance of landforms and the weatheringprofiles on them, while erosion rates exactlymatch uplift rates.
Residence Time from Uplift Rates
Because the weathered-rock profile rangesfrom 3 to 8 m thick in the CB1 catchment, 56 1 m is a reasonable average thickness. Theaverage soil depth in the CB1 catchment is0.70 m. However, because the bulk density ofthe soil is significantly lower than that of rock,the equivalent thickness of rock representedby the soil, or the ‘‘effective thickness’’ of thesoil, is just 0.23 m. For local uplift rates, weused 0.1 6 0.07 mm·yr21, which is centeredon the most likely uplift rate for the region(H. Kelsey, 1994, personal commun.), but also
Geological Society of America Bulletin, September 2002 1153
LINKAGES BETWEEN WEATHERING AND EROSION IN A SMALL, STEEP CATCHMENT
Fig
ure
8.So
ilw
ater
conc
entr
atio
npr
ofile
son
May
31,
1992
,du
ring
the
stea
dyflo
wco
ndit
ions
ofsp
rink
ling
expe
rim
ent
3(s
olid
lines
)an
don
Feb
ruar
y20
,199
2,du
ring
the
larg
est
stor
mof
the
win
ter
(dot
ted
lines
).L
ysim
eter
nest
snu
mbe
red
acco
rdin
gto
the
acce
ssro
won
whi
chth
eyar
elo
cate
d(s
eeF
ig.
4).

1154 Geological Society of America Bulletin, September 2002
ANDERSON et al.
TABLE 2. RESIDENCE TIME ESTIMATES
Layer Thickness Effective Residence times (k.y.)(m) thickness
(m) Fromupliftrates
From dj,w
andsolute flux
14C date Reneauand Dietrich
(1991)
Soil 0.70 0.23 2.3 6 1.8 3.5 6 1.4 4.07 6 0.09 5–6Weathered rock,
including saprolite5 5 50 6 36
encompasses most of the likely range. For thisuplift rate, the residence time in the weathered-rock layers is 50 6 36 k.y., and the residencetime in the soil is 2.3 6 1.8 k.y. (Table 2).Much of the error comes from the wide rangeof possible uplift rates, which affect both res-idence times the same way. A parcel of rockspends ;20 times longer traversing the weath-ered-rock layers than passing through the soil.
Residence Time from Solute Fluxes
An alternative method is to use solute flux-es and our measurements of mass loss in thesolid phase of the soil. Several others havefound a close correspondence between modernsolute fluxes and long-term weathering ratesdetermined from calculated soil mass losses(Stonestrom et al., 1998; White et al., 1998).The residence time for material in the weath-ered profile, tw, is calculated from the sum ofmass losses in the soil S(dj,w) integrated overthe soil depth, the mean annual runoff, Qannual,and the average sum of dissolved concentra-tions of the elements considered, SjCj:
Hs
(d ) dzOE j,wj0
t 5 , (7)w ¯Q COannual jj
where HS is the soil depth. The numerator isthe total mass loss from the soil solid phase,and the denominator is the rate of mass lossin solution.
The numerator of equation 7, computed asthe product of the average dj,w values for Si,Ca, Na, and Mg from the soil pits (5 94.5 627.7 kg·m23) and the average soil thickness,is 66.2 6 19.4 kg·m22. For the denominator,we used the mean annual runoff from the CB1catchment of 1.6–1.8 m·yr21 (Anderson,1995), and the average dissolved cations plussilica concentration in the soil during steadyrunoff in experiment 3 of 11.0 6 3.0 ppm(Anderson and Dietrich, 2001). The soil resi-dence time calculated from equation 7 is 3.56 1.4 k.y.
Other Measures
We have two additional independent age es-timates for the soil. A 14C age of 4070 6 90yr B.P. (Center for Accelerator Mass Spec-trometry, Lawrence Livermore National Lab-oratory) on charcoal from the base of soil pit1 in the CB2 catchment is in good agreementwith the values in Table 2. Reneau and Die-trich (1991) calculated residence times of 5–6k.y. for colluvium in the southern OregonCoast Range, based on 14C age dates of col-luvial fills.
Depth of Significant Mass Loss in theWeathered Rock
The similarities between the residence timescomputed for the soil from the approaches justoutlined supports the idea that the local land-scape is in dynamic equilibrium. This state-ment means that the soil does not change inthickness with time and that regolith produc-tion and erosion both occur at the same rate.It is likely that this dynamic equilibrium ex-tends to the weathered-rock layers as well. Aconsequence of the combination of dynamicequilibrium and equal partitioning of solutefluxes from the soil and the bedrock is that weshould expect to see equivalent solid-phasemass losses in the soil and bedrock despite thedisparity in residence times within these lay-ers. We make this prediction because in steadystate, the residence time, tr, and thickness oflayers, H, are related through the uplift rate, u5 H/tr. Material in the thinner soil layer thushas a shorter residence time than in the thickerweathered rock in proportion to the uplift rate.We can calculate the average change in den-sity, D , in a layer due to mass loss in solutionras
Q (C 2 C )w 0Dr 5 2 , (8)u
where Qw is the water flux (in m/yr), and (C—C0) is the change in solute concentration aswater flows through the layer. Because the netsolute fluxes from the soil and bedrock layers
at CB1 are roughly identical (Anderson andDietrich, 2001), the change in density is thesame within the layers. This circumstanceshould be manifested by similar integratedmass losses in the soil layer and the weathered-rock layer.
From the measured annual water flux of1.6–1.8 m/yr, average bedrock-derived cationsplus silica concentration in the runoff of 9.46 3.0 ppm (Anderson and Dietrich, 2001),and uplift rate of 0.10 6 0.07 mm/yr, we ob-tain an average change in density within theweathered bedrock layer of 160 6 123 kg/m3.A change in density of this magnitude is cer-tainly measurable; therefore, the lack of ob-servable density variation within the bedrockcore samples does not stem from too small asignature. The average bulk density of all thesamples from the core is 2270 6 60 kg/m3,whereas bulk densities of two saprolite sam-ples from the soil pits are 1150 and 1850 kg/m3 (Fig. 3). These saprolite samples have un-dergone density losses of 1120 and 420 kg/m3, respectively. That the saprolite samplesdisplay mass losses much greater than the av-erage density change we have just computedfor the weathered-rock layer is reasonable forsamples from the top of a profile in which thedegree of weathering declines with depth.
Our sampling was not sufficiently dense atthe top of the weathered rock to allow us toidentify the thickness of the weathered-rocklayer that has undergone significant mass loss-es or to define how these mass losses varywith depth. To put limits on the thickness ofthis significantly weathered rock layer, we ap-peal to our observation that integrated masslosses in the weathered rock must equal thoseof the soil. The integrated mass losses in thebedrock are equal to the average densitychange multiplied by an appropriate depth(D )H. This can be equated to the integratedrmass loss in the soil:
Hs
(Dr )H 5 (d ) dz, (9)OR R E j,wj0
where the left side shows the mass losses inthe rock and the right side shows the masslosses in the soil. We have already foundthat the right side of equation 9 is 66.2 619.4 kg·m22 and that D is 160 6 123rkg·m23. Therefore, the representative thick-ness, HR, for the weathered-rock layer is0.41 6 0.34 m.
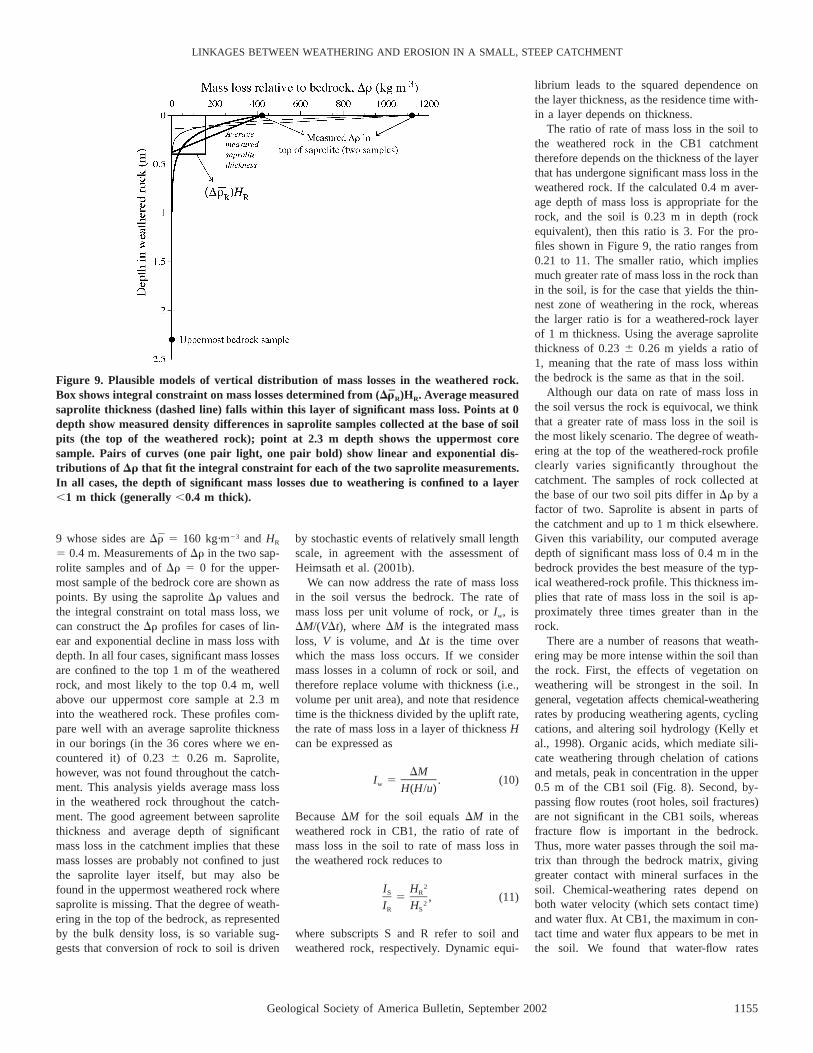
Constraints on the distribution of mass loss-es in the weathered rock are depicted in Figure9. The total mass loss in the weathered-rocklayer is equal to the area of the box in Figure
Geological Society of America Bulletin, September 2002 1155
LINKAGES BETWEEN WEATHERING AND EROSION IN A SMALL, STEEP CATCHMENT
Figure 9. Plausible models of vertical distribution of mass losses in the weathered rock.Box shows integral constraint on mass losses determined from (D R)HR. Average measuredrsaprolite thickness (dashed line) falls within this layer of significant mass loss. Points at 0depth show measured density differences in saprolite samples collected at the base of soilpits (the top of the weathered rock); point at 2.3 m depth shows the uppermost coresample. Pairs of curves (one pair light, one pair bold) show linear and exponential dis-tributions of Dr that fit the integral constraint for each of the two saprolite measurements.In all cases, the depth of significant mass losses due to weathering is confined to a layer,1 m thick (generally ,0.4 m thick).
9 whose sides are D 5 160 kg·m23 and HRr5 0.4 m. Measurements of Dr in the two sap-rolite samples and of Dr 5 0 for the upper-most sample of the bedrock core are shown aspoints. By using the saprolite Dr values andthe integral constraint on total mass loss, wecan construct the Dr profiles for cases of lin-ear and exponential decline in mass loss withdepth. In all four cases, significant mass lossesare confined to the top 1 m of the weatheredrock, and most likely to the top 0.4 m, wellabove our uppermost core sample at 2.3 minto the weathered rock. These profiles com-pare well with an average saprolite thicknessin our borings (in the 36 cores where we en-countered it) of 0.23 6 0.26 m. Saprolite,however, was not found throughout the catch-ment. This analysis yields average mass lossin the weathered rock throughout the catch-ment. The good agreement between saprolitethickness and average depth of significantmass loss in the catchment implies that thesemass losses are probably not confined to justthe saprolite layer itself, but may also befound in the uppermost weathered rock wheresaprolite is missing. That the degree of weath-ering in the top of the bedrock, as representedby the bulk density loss, is so variable sug-gests that conversion of rock to soil is driven
by stochastic events of relatively small lengthscale, in agreement with the assessment ofHeimsath et al. (2001b).
We can now address the rate of mass lossin the soil versus the bedrock. The rate ofmass loss per unit volume of rock, or Iw, isDM/(VDt), where DM is the integrated massloss, V is volume, and Dt is the time overwhich the mass loss occurs. If we considermass losses in a column of rock or soil, andtherefore replace volume with thickness (i.e.,volume per unit area), and note that residencetime is the thickness divided by the uplift rate,the rate of mass loss in a layer of thickness Hcan be expressed as
DMI 5 . (10)w H(H/u)
Because DM for the soil equals DM in theweathered rock in CB1, the ratio of rate ofmass loss in the soil to rate of mass loss inthe weathered rock reduces to
2I HS R5 , (11)2I HR S
where subscripts S and R refer to soil andweathered rock, respectively. Dynamic equi-
librium leads to the squared dependence onthe layer thickness, as the residence time with-in a layer depends on thickness.
The ratio of rate of mass loss in the soil tothe weathered rock in the CB1 catchmenttherefore depends on the thickness of the layerthat has undergone significant mass loss in theweathered rock. If the calculated 0.4 m aver-age depth of mass loss is appropriate for therock, and the soil is 0.23 m in depth (rockequivalent), then this ratio is 3. For the pro-files shown in Figure 9, the ratio ranges from0.21 to 11. The smaller ratio, which impliesmuch greater rate of mass loss in the rock thanin the soil, is for the case that yields the thin-nest zone of weathering in the rock, whereasthe larger ratio is for a weathered-rock layerof 1 m thickness. Using the average saprolitethickness of 0.23 6 0.26 m yields a ratio of1, meaning that the rate of mass loss withinthe bedrock is the same as that in the soil.
Although our data on rate of mass loss inthe soil versus the rock is equivocal, we thinkthat a greater rate of mass loss in the soil isthe most likely scenario. The degree of weath-ering at the top of the weathered-rock profileclearly varies significantly throughout thecatchment. The samples of rock collected atthe base of our two soil pits differ in Dr by afactor of two. Saprolite is absent in parts ofthe catchment and up to 1 m thick elsewhere.Given this variability, our computed averagedepth of significant mass loss of 0.4 m in thebedrock provides the best measure of the typ-ical weathered-rock profile. This thickness im-plies that rate of mass loss in the soil is ap-proximately three times greater than in therock.
There are a number of reasons that weath-ering may be more intense within the soil thanthe rock. First, the effects of vegetation onweathering will be strongest in the soil. Ingeneral, vegetation affects chemical-weatheringrates by producing weathering agents, cyclingcations, and altering soil hydrology (Kelly etal., 1998). Organic acids, which mediate sili-cate weathering through chelation of cationsand metals, peak in concentration in the upper0.5 m of the CB1 soil (Fig. 8). Second, by-passing flow routes (root holes, soil fractures)are not significant in the CB1 soils, whereasfracture flow is important in the bedrock.Thus, more water passes through the soil ma-trix than through the bedrock matrix, givinggreater contact with mineral surfaces in thesoil. Chemical-weathering rates depend onboth water velocity (which sets contact time)and water flux. At CB1, the maximum in con-tact time and water flux appears to be met inthe soil. We found that water-flow rates
1156 Geological Society of America Bulletin, September 2002
ANDERSON et al.
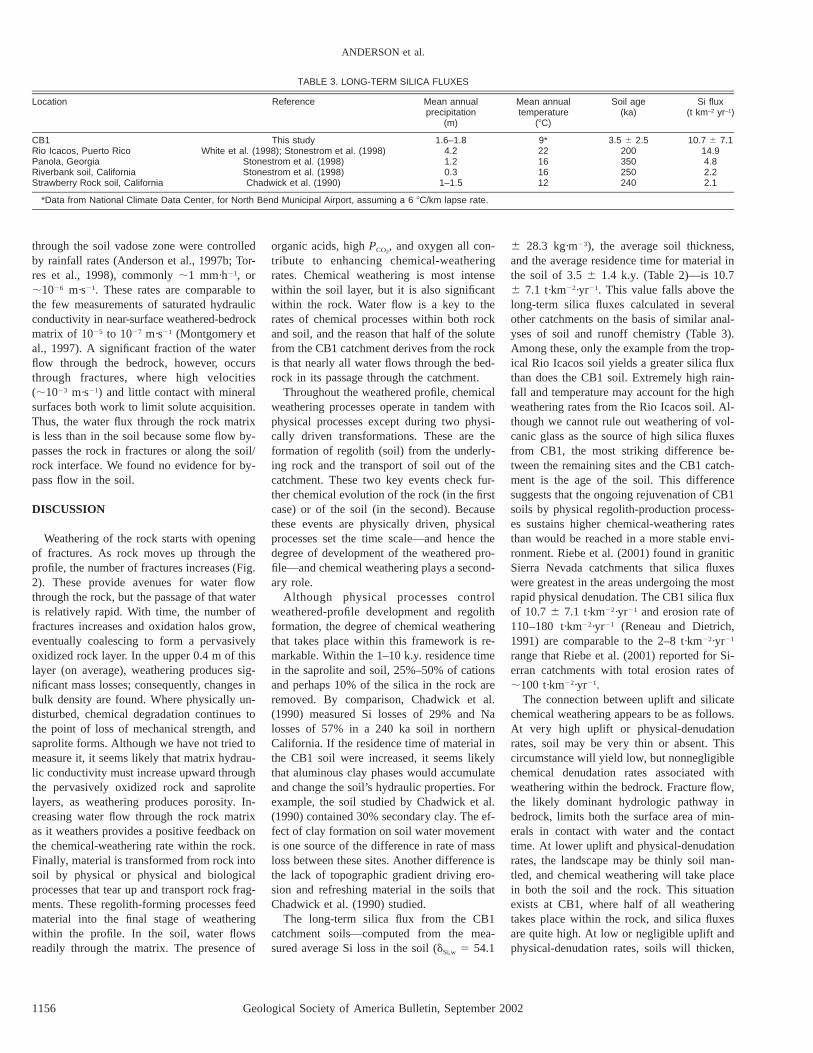
TABLE 3. LONG-TERM SILICA FLUXES
Location Reference Mean annualprecipitation
(m)
Mean annualtemperature
(8C)
Soil age(ka)
Si flux(t km–2 yr–1)
CB1 This study 1.6–1.8 9* 3.5 6 2.5 10.7 6 7.1Rio Icacos, Puerto Rico White et al. (1998); Stonestrom et al. (1998) 4.2 22 200 14.9Panola, Georgia Stonestrom et al. (1998) 1.2 16 350 4.8Riverbank soil, California Stonestrom et al. (1998) 0.3 16 250 2.2Strawberry Rock soil, California Chadwick et al. (1990) 1–1.5 12 240 2.1
*Data from National Climate Data Center, for North Bend Municipal Airport, assuming a 6 8C/km lapse rate.
through the soil vadose zone were controlledby rainfall rates (Anderson et al., 1997b; Tor-res et al., 1998), commonly ;1 mm·h21, or;1026 m·s21. These rates are comparable tothe few measurements of saturated hydraulicconductivity in near-surface weathered-bedrockmatrix of 1025 to 1027 m·s21 (Montgomery etal., 1997). A significant fraction of the waterflow through the bedrock, however, occursthrough fractures, where high velocities(;1023 m·s21) and little contact with mineralsurfaces both work to limit solute acquisition.Thus, the water flux through the rock matrixis less than in the soil because some flow by-passes the rock in fractures or along the soil/rock interface. We found no evidence for by-pass flow in the soil.
DISCUSSION
Weathering of the rock starts with openingof fractures. As rock moves up through theprofile, the number of fractures increases (Fig.2). These provide avenues for water flowthrough the rock, but the passage of that wateris relatively rapid. With time, the number offractures increases and oxidation halos grow,eventually coalescing to form a pervasivelyoxidized rock layer. In the upper 0.4 m of thislayer (on average), weathering produces sig-nificant mass losses; consequently, changes inbulk density are found. Where physically un-disturbed, chemical degradation continues tothe point of loss of mechanical strength, andsaprolite forms. Although we have not tried tomeasure it, it seems likely that matrix hydrau-lic conductivity must increase upward throughthe pervasively oxidized rock and saprolitelayers, as weathering produces porosity. In-creasing water flow through the rock matrixas it weathers provides a positive feedback onthe chemical-weathering rate within the rock.Finally, material is transformed from rock intosoil by physical or physical and biologicalprocesses that tear up and transport rock frag-ments. These regolith-forming processes feedmaterial into the final stage of weatheringwithin the profile. In the soil, water flowsreadily through the matrix. The presence of
organic acids, high , and oxygen all con-PCO2
tribute to enhancing chemical-weatheringrates. Chemical weathering is most intensewithin the soil layer, but it is also significantwithin the rock. Water flow is a key to therates of chemical processes within both rockand soil, and the reason that half of the solutefrom the CB1 catchment derives from the rockis that nearly all water flows through the bed-rock in its passage through the catchment.
Throughout the weathered profile, chemicalweathering processes operate in tandem withphysical processes except during two physi-cally driven transformations. These are theformation of regolith (soil) from the underly-ing rock and the transport of soil out of thecatchment. These two key events check fur-ther chemical evolution of the rock (in the firstcase) or of the soil (in the second). Becausethese events are physically driven, physicalprocesses set the time scale—and hence thedegree of development of the weathered pro-file—and chemical weathering plays a second-ary role.
Although physical processes controlweathered-profile development and regolithformation, the degree of chemical weatheringthat takes place within this framework is re-markable. Within the 1–10 k.y. residence timein the saprolite and soil, 25%–50% of cationsand perhaps 10% of the silica in the rock areremoved. By comparison, Chadwick et al.(1990) measured Si losses of 29% and Nalosses of 57% in a 240 ka soil in northernCalifornia. If the residence time of material inthe CB1 soil were increased, it seems likelythat aluminous clay phases would accumulateand change the soil’s hydraulic properties. Forexample, the soil studied by Chadwick et al.(1990) contained 30% secondary clay. The ef-fect of clay formation on soil water movementis one source of the difference in rate of massloss between these sites. Another difference isthe lack of topographic gradient driving ero-sion and refreshing material in the soils thatChadwick et al. (1990) studied.
The long-term silica flux from the CB1catchment soils—computed from the mea-sured average Si loss in the soil (dSi,w 5 54.1
6 28.3 kg·m23), the average soil thickness,and the average residence time for material inthe soil of 3.5 6 1.4 k.y. (Table 2)—is 10.76 7.1 t·km22·yr21. This value falls above thelong-term silica fluxes calculated in severalother catchments on the basis of similar anal-yses of soil and runoff chemistry (Table 3).Among these, only the example from the trop-ical Rio Icacos soil yields a greater silica fluxthan does the CB1 soil. Extremely high rain-fall and temperature may account for the highweathering rates from the Rio Icacos soil. Al-though we cannot rule out weathering of vol-canic glass as the source of high silica fluxesfrom CB1, the most striking difference be-tween the remaining sites and the CB1 catch-ment is the age of the soil. This differencesuggests that the ongoing rejuvenation of CB1soils by physical regolith-production process-es sustains higher chemical-weathering ratesthan would be reached in a more stable envi-ronment. Riebe et al. (2001) found in graniticSierra Nevada catchments that silica fluxeswere greatest in the areas undergoing the mostrapid physical denudation. The CB1 silica fluxof 10.7 6 7.1 t·km22·yr21 and erosion rate of110–180 t·km22·yr21 (Reneau and Dietrich,1991) are comparable to the 2–8 t·km22·yr21
range that Riebe et al. (2001) reported for Si-erran catchments with total erosion rates of;100 t·km22·yr21.
The connection between uplift and silicatechemical weathering appears to be as follows.At very high uplift or physical-denudationrates, soil may be very thin or absent. Thiscircumstance will yield low, but nonnegligiblechemical denudation rates associated withweathering within the bedrock. Fracture flow,the likely dominant hydrologic pathway inbedrock, limits both the surface area of min-erals in contact with water and the contacttime. At lower uplift and physical-denudationrates, the landscape may be thinly soil man-tled, and chemical weathering will take placein both the soil and the rock. This situationexists at CB1, where half of all weatheringtakes place within the rock, and silica fluxesare quite high. At low or negligible uplift andphysical-denudation rates, soils will thicken,
Geological Society of America Bulletin, September 2002 1157
LINKAGES BETWEEN WEATHERING AND EROSION IN A SMALL, STEEP CATCHMENT
and we think that chemical-weathering rateswill be reduced. At this end of the spectrum,low physical-process rates mean that soils candevelop into mature profiles. Development ofclay may impede water flow through the soil,whereas thickening the soil may lead to chem-ical saturation control on chemical-weatheringrates (e.g., White et al., 2001). Together, theseeffects suggest that silicate chemical-weatheringrates will be greatest at some intermediate up-lift or physical-denudation rate, where physi-cal processes are rapid enough to continuallyadd fresh rock into the weathering profile, yetlow enough to permit development of a soil.
CONCLUSIONS
The weathered profile in this steep, activelyeroding headwater basin consists of a loose,poorly developed ;0.7 m deep soil overlying3–8 m of weathered rock. The total mass lostby chemical weathering is as great from therock as from the soil. Because the thicknessof the weathering layer is greater in the rockthan in the soil (normalized to equivalent den-sity), the rate of mass loss is greater in the soilthan in the rock. Soils are important sites ofchemical weathering, because the combinationof hydrology and biology that they supportgenerally enhances solute-production rates.Although weathering within bedrock is oftenignored (e.g., Riebe et al., 2001), this workdemonstrates that bedrock can also be a sig-nificant site of chemical weathering.
The silica flux of 10.7 6 7.1 t·km22·yr21
from the CB1 catchment is higher than thatfrom other catchments with considerably olderweathering profiles (Table 3) and is compa-rable to silica fluxes from catchments withsimilar physical-denudation rates (Riebe et al.,2001). We infer that physical processes en-hance chemical-weathering rates by rejuve-nating and refreshing material within the soil‘‘reactor.’’ The hydrology of a young, biotur-bated soil is also conducive to high solutefluxes because of the lack of impeding hori-zons. These observations suggest that chemi-cal-weathering rates from catchments dependon physical-denudation rates and therefore onuplift rates. However, we infer that the rela-tionship between chemical weathering and up-lift rates is not likely to be monotonic. Whenuplift rates are high enough that the landscapebecomes bedrock dominated, hydrologic con-tact with mineral surfaces diminishes (fractureflow dominates), and enhancement of weath-ering by biotic processes declines. Both ofthese effects will tend to lower the chemicaldenudation rate. This result parallels our ar-guments that rate of mass loss within the bed-
rock at CB1 is lower than within the soil. Theimplication is that areas undergoing the high-est uplift rates will not produce the highestsilicate-weathering rates. Instead, silicate-weathering rates will be maximized in activelyeroding, soil-mantled landscapes.
ACKNOWLEDGMENTS
We thank Tim Teague, C. Lewis, and L. Abbottfor assistance with the laboratory work and O.Chadwick for discussions about the mass-balancemodel. We appreciated thoughtful reviews by S.Brantley, R. Stallard, and associate editor J. Hanor.This work was supported by a National Aeronauticsand Space Administration global change graduate fel-lowship (NGT30083), the National Science Founda-tion (EAR8417467), the U.S. Geological Survey Wa-ter Resources Division (14080001G12111), and theWeyerhauser Company. CSIDE (Center for Study ofImaging and Dynamics of the Earth) contributionnumber 438.
REFERENCES CITED
Adams, J., 1984, Active deformation of the Pacific North-west continental margin: Tectonics, v. 3, p. 449–472.
Ahnert, F., 1967, The role of the equilibrium concept in theinterpretation of landforms of fluvial erosion and de-position, in Macar, P., ed., L’Evolution des Versants:Les Congress et Colloques de l’Universite de Liege,v. 40, p. 23–41.
Anderson, R.S., 1999, Near-surface thermal profiles in al-pine bedrock: Implications for the frost weathering ofrock: Arctic and Alpine Research, v. 30, p. 362–372.
Anderson, R.S., and Humphrey, N.F., 1989, Interaction ofweathering and transport processes in the evolution ofarid landscapes, in Cross, T., Quantitative DynamicStratigraphy: Englewood Cliffs, New Jersey, Prentice-Hall, p. 349–361.
Anderson, S.P., 1995, Flow paths, solute sources, weath-ering, and denudation rates: The chemical geomor-phology of a small catchment [Ph.D. thesis]: Berkeley,University of California, 380 p.
Anderson, S.P., and Dietrich, W.E., 2001, Chemical weath-ering and runoff chemistry in a steep headwater catch-ment: Hydrological Processes, v. 15, p. 1791–1815.
Anderson, S.P., Dietrich, W.E., Torres, R., Montgomery,D.R., and Loague, K., 1997a, Concentration-dischargerelationships in a steep, unchanneled catchment: WaterResources Research, v. 33, p. 211–225.
Anderson, S.P., Dietrich, W.E., Montgomery, D.R., Torres,R., Conrad, M.E., and Loague, K., 1997b, Subsurfaceflow paths in a steep unchanneled catchment: WaterResources Research, v. 33, p. 2637–2653.
Baldwin, E.M., 1974, Eocene stratigraphy of southwesternOregon: Oregon Department of Geology and MineralIndustries Bulletin, no. 83, 38 p.
Baldwin, E.M., 1975, Revision of the Eocene stratigraphyof southwestern Oregon, in Weaver, D.W., Hornaday,G.R., and Tipton, A., eds., Paleogene symposium andselected technical papers—Conference on future en-ergy horizons of the Pacific Coast: Long Beach, Cal-ifornia, American Association of Petroleum Geolo-gists, p. 49–64.
Berner, R.A., 1990, Atmospheric carbon dioxide levels overPhanerozoic time: Science, v. 249, p. 1382–1386.
Bockheim, J.G., Marshall, J.G., and Kelsey, H.M., 1996,Soil-forming processes and rates on uplifted marineterraces in southwestern Oregon, USA: Geoderma,v. 73, p. 39–62.
Brimhall, G.H., Alpers, C.N., and Cunningham, A.B., 1985,Analysis of supergene ore-forming processes andground water solute transport using mass balance prin-ciples: Economic Geology, v. 80, p. 1227–1256.
Brimhall, G.H., and Dietrich, W.E., 1987, Constitutive mass
balance relations between chemical composition, vol-ume, density, porosity, and strain in metasomatic hy-drochemical systems: Results on weathering and pe-dogenesis: Geochimica et Cosmochimica Acta, v. 51,p. 567–587.
Brimhall, G.H., Lewis, C.J., Ford, C., Bratt, J., Taylor, G.,and Warin, O., 1991, Quantitative geochemical ap-proach to pedogenesis: Importance of parent materialreduction, volumetric expansion, and eolian influx inlateritization: Geoderma, v. 51, p. 51–91.
Brimhall, G.H., Chadwick, O.A., Lewis, C.J., Compston,W., Williams, I.S., Danti, K.J., Dietrich, W.E., Power,M.E., Hendricks, D., and Bratt, J., 1992, Deforma-tional mass transport and invasive processes in soilevolution: Science, v. 255, p. 695–702.
Carson, M.A., and Kirkby, M.J., 1972, Hillslope form andprocess: Cambridge, UK, Cambridge University Press,475 p.
Chadwick, O.A., Brimhall, G.H., Jr., and Hendricks, D.M.,1990, From a black to a gray box—A mass balanceinterpretation of pedogenesis: Geomorphology, v. 3,p. 369–390.
Dahlgren, R.A., and Ugolini, F.C., 1989, Aluminum frac-tionation of soil solutions from unperturbed and teph-ra-treated Spodosols, Cascade Range, Washington,USA: Soil Science Society of America Journal, v. 53,p. 559–566.
Dietrich, W.E., Reneau, S.L., and Wilson, C.J., 1986, Hol-lows, colluvium, and landslides in soil-mantled land-scapes, in Abrahams, A.D., ed., Hillslope processes:Boston, Allen and Unwin, p. 361–388.
Dott, R.H., Jr., 1966, Eocene deltaic sedimentation at CoosBay, Oregon: Journal of Geology, v. 74, p. 373–420.
England, P., and Molnar, P., 1990, Surface uplift, uplift ofrocks, and exhumation of rocks: Geology, v. 18,p. 1173–1177.
Entry, J.A., and Emmingham, W.H., 1995, Influence of for-est age on nutrient availability and storage in conif-erous soils of the Oregon Coast Range: CanadianJournal of Forest Research, v. 25, p. 114–120.
Gaillardet, J., Dupre, B., Louvat, P., and Allegre, C.J.,1999a, Global silicate weathering and CO2 consump-tion rates deduced from the chemistry of large rivers:Chemical Geology, v. 159, p. 3–30.
Gaillardet, J., Dupre, B., and Allegre, C.J., 1999b, Geo-chemistry of large river suspended sediments: Silicateweathering or recycling tracer? Geochimica et Cos-mochimica Acta, v. 63, p. 4037–4051.
Gilbert, G.K., 1877, Report on the geology of the HenryMountains (Utah): Washington, D.C., U.S. Geograph-ical and Geological Survey, Publication of the PowellSurvey, Government Printing Office, 160 p.
Haagen, J.T., 1989, Soil survey of Coos County, Oregon:U.S. Department of Agriculture, Soil ConservationService, 269 p.
Hack, J.T., 1960, Interpretation of erosional topography inhumid temperate regions: American Journal of Sci-ence, v. 258-A, p. 80–97.
Heimsath, A.M., Dietrich, W.E., Nishiizumi, K., and Finkel,R.C., 1997, The soil production function and land-scape equilibrium: Nature, v. 388, p. 358–361.
Heimsath, A.M., Dietrich, W.E., Nishiizumi, K., and Finkel,R.C., 1999, Cosmogenic nuclides, topography, and thespatial variation of soil depth: Geomorphology, v. 27,p. 151–172.
Heimsath, A.M., Chappell, J., Dietrich, W.E., Nishiizumi,K., and Finkel, R.C., 2000, Soil production on a re-treating escarpment in southeastern Australia: Geolo-gy, v. 28, p. 787–790.
Heimsath, A.M., Chappell, J., Dietrich, W.E., Nishiizumi,K., and Finkel, R.C., 2001a, Late Quaternary erosionin southeastern Australia: A field example using cos-mogenic nuclides: Quaternary International, v. 83–85,p. 169–185.
Heimsath, A.M., Dietrich, W.E., Nishiizumi, K., and Finkel,R.C., 2001b, Stochastic processes of soil productionand transport: Erosion rates, topographic variation andcosmogenic nuclides in the Oregon Coast Range:Earth Surface Processes and Landforms, v. 26,p. 531–552.
Holland, H.D., 1978, The chemistry of the atmosphere andoceans: New York, John Wiley and Sons, 351 p.

1158 Geological Society of America Bulletin, September 2002
ANDERSON et al.
Jewett, K., Daugharty, D., Krause, H.H., and Arp, P.A.,1995, Watershed responses to clear-cutting: Effects onsoil solutions and stream water discharge in centralNew Brunswick: Canadian Journal of Soil Science,v. 75, p. 475–490.
Kelly, E.F., Chadwick, O.A., and Hilinski, T.E., 1998, Theeffect of plants on mineral weathering: Biogeochem-istry, v. 42, p. 21–53.
Kelsey, H.M., Engebretson, D.C., Mitchell, C.E., and Tick-nor, R.L., 1994, Topographic form of the Coast Rang-es of the Cascadia margin in relation to coastal upliftrates and plate subduction: Journal of Geophysical Re-search, v. 99, p. 12245–12255.
Kelsey, H.M., Ticknor, R.L., Bockheim, J.G., Mitchell,C.E., 1996, Quaternary upper plate deformation incoastal Oregon: Geology Society of America Bulletin,v. 108, p. 843–860.
Lovell, J.P.B., 1969, Tyee Formation: Undeformed turbi-dites and their lateral equivalents: Mineralogy and pa-leogeography: Geological Society of America Bulle-tin, v. 80, p. 9–22.
MacDonald, L.H., 1988, An inexpensive, portable systemfor drilling into subsurface layers: Soil Science Soci-ety of America Journal, v. 52, p. 1817–1819.
Montgomery, D.R., Dietrich, W.E., Torres, R., Anderson,S.P., Heffner, J.T., and Loague, K., 1997, Hydrologicresponse of a steep, unchanneled valley to natural andapplied rainfall: Water Resources Research, v. 33,p. 91–109.
Pavich, M.J., 1986, Processes and rates of saprolite pro-duction and erosion on a foliated granitic rock of theVirginia Piedmont, in Colman, S.M., and Dethier,D.P., Rates of chemical weathering of rocks and min-erals: Orlando, Florida, Academic Press, p. 551–590.
Personius, S.F., 1993, Age and origin of fluvial terraces inthe central Coast Range, western Oregon: U.S. Geo-logical Survey Bulletin Report B 2038, 56 p.
Personius, S.F., Kelsey, H.M., and Grabau, P.C., 1993, Ev-idence for regional stream aggradation in the centralOregon Coast Range during the Pleistocene–Holocenetransition: Quaternary Research, v. 40, p. 297–308.
Raymo, M.E., and Ruddiman, W.F., 1992, Tectonic forcingof late Cenozoic climate: Nature, v. 359, p. 117–122.
Raymo, M.E., Ruddiman, W.F., and Froelich, P.N., 1988,Influence of late Cenozoic mountain building on
ocean geochemical cycles: Geology, v. 16,p. 649–653.
Reneau, S.L., and Dietrich, W.E., 1991, Erosion rates in thesouthern Oregon Coast Range: Evidence for an equi-librium between hillslope erosion and sediment yield:Earth Surface Processes and Landforms, v. 16,p. 307–322.
Reneau, S.L., Dietrich, W.E., Rubin, M., Donahue, D.J.,and Jull, A.J.T., 1989, Analysis of hillslope erosionrates using dated colluvial deposits: Journal of Geol-ogy, v. 97, p. 45–63.
Riebe, C.S., Kirchner, J.W., Granger, D.E., and Finkel,R.C., 2001, Strong tectonic and weak climatic controlof long-term chemical weathering rates: Geology,v. 29, p. 511–514.
Rosenbloom, N.A., and Anderson, R.S., 1994, Hillslopeand channel evolution in a marine terraced landscape,Santa-Cruz, California: Journal of Geophysical Re-search, v. 99B, p. 14013–14029.
Ruddiman, W.F., and Prell, W.L., 1997, Introduction to theuplift-climate connection, in Ruddiman, W.F., ed., Tec-tonic uplift and climate change: New York, PlenumPress, p. 3–15.
Small, E.E., Anderson, R.S., and Hancock, G.S., 1999, Es-timates of the rate of regolith production using Be-10and Al-26 from an alpine hillslope: Geomorphology,v. 27, p. 131–150.
Stallard, R.F., 1985, River chemistry, geology, geomor-phology, and soils in the Amazon and Orinoco basins,in Drever, J.I., ed., The chemistry of weathering: Dor-drecht, Netherlands, D. Reidel Publishing Company,p. 293–316.
Stallard, R.F., 1992, Tectonic processes, continental free-board, and the rate-controlling step for continental de-nudation, in Butcher, S.S., Charlson, R.J., Orians,G.H., and Wolfe, G.V., eds., Global biogeochemicalcycles: London, UK, Academic Press, p. 93–121.
Stallard, R.F., 1995a, Relating chemical and physical ero-sion, in White, A.F., and Brantley, S.L., eds., Chemicalweathering rates of silicate minerals: MineralogicalSociety of America Reviews in Mineralogy, v. 31,p. 543–564.
Stallard, R.F., 1995b, Tectonic, environmental, and humanaspects of weathering and erosion: A global review
using a steady-state perspective: Annual Review ofEarth and Planetary Sciences, v. 23, p. 11–39.
Stonestrom, D.A., White, A.F., and Akstin, K.C., 1998, De-termining rates of chemical weathering in soils—Sol-ute transport versus profile evolution: Journal of Hy-drology, v. 209, p. 331–345.
Swank, W.T., Vose, J.M., and Elliott, K.J., 2001, Long-termhydrologic and water quality responses followingcommercial clearcutting of mixed hardwoods on asouthern Appalachian catchment: Forest Ecology andManagement, v. 143, p. 163–178.
Torres, R., Dietrich, W.E., Loague, K., Montgomery, D.R.,and Anderson, S.P., 1998, Unsaturated zone processesand the hydrologic response of a steep, unchanneledcatchment: Water Resources Research, v. 34,p. 1865–1879.
White, A.F., Blum, A.E., Schulz, M.S., Huntington, T.G.,Peters, N.E., and Stonestrom, D.A., 2002, Chemicalweathering of the Panola granite: Solute and regolithelemental fluxes and the weathering rate of biotite, inHellmann, R., and Wood, S.A., eds., Water rock in-teraction, ore deposits, and environmental geochem-istry, a tribute to David A. Crerar: Geochemical So-ciety Special Publication 7, p. 37–59.
White, A.F., and Blum, A.E., 1995, Effects of climate onchemical weathering in watersheds: Geochimica etCosmochimica Acta, v. 59, p. 1729–1747.
White, A.F., Blum, A.E., Schulz, M.S., Vivit, D.V., Stones-trom, D.A., Larson, M., Murphy, S.F., and Eberl, D.,1998, Chemical weathering in a tropical watershed,Luquillo Mountains, Puerto Rico: I. Long-term versusshort-term weathering fluxes: Geochimica et Cosmo-chimica Acta, v. 62, p. 209–226.
White, A.F., Bullen, T.D., Schulz, M.S., Blum, A.E.,Huntington, T.G., and Peters, N.E., 2001, Differentialrates of feldspar weathering in granitic regoliths: Geo-chimica et Cosmochimica Acta, v. 65, p. 847–869.
Worona, M.A., and Whitlock, C., 1995, Late Quaternaryvegetation and climate history near Little Lake, Cen-tral Coast Range, Oregon: Geological Society ofAmerica Bulletin, v. 107, p. 867–876.
MANUSCRIPT RECEIVED BY THE SOCIETY APRIL 20, 2001REVISED MANUSCRIPT RECEIVED JANUARY 2, 2002MANUSCRIPT ACCEPTED JANUARY 21, 2002
Printed in the USA