weathering the storm: the financial impacts of hurricanes ... · 2 weathering the storm the...
TRANSCRIPT

February 2018
Weathering the Storm:The Financial Impacts of Hurricanes Harvey and Irma on One Million Households
2
Weathering the StormThe Financial Impacts of Hurricanes Harvey and Irma on One Million Households Diana Farrell
Fiona Greig
Executive SummaryThe year 2017 was marked as the most expensive year for disasters in the US, with total damage exceeding $300 billion (NOAA, 2017). Disasters have been growing in both incidence and the losses they inflict. These losses include direct costs such as injury, loss of life, and damage to property; as well as indirect costs such as business interruption, lost wages, displaced residents, and lower tourism.
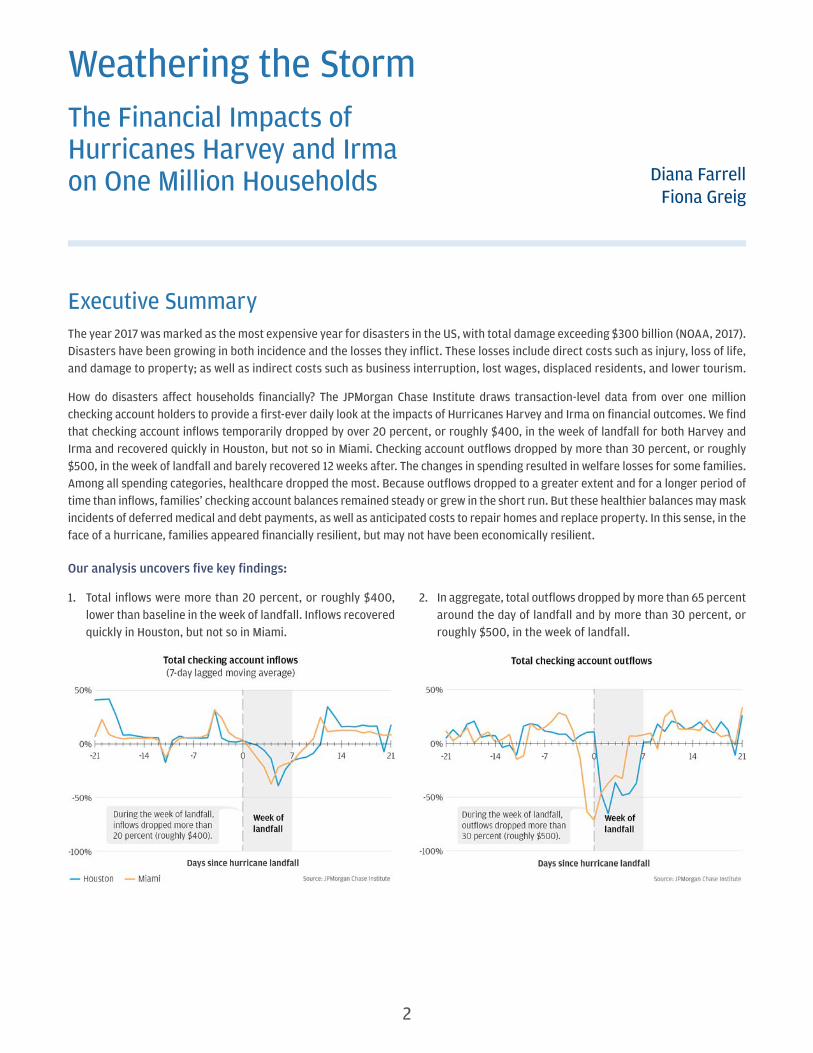
How do disasters affect households financially? The JPMorgan Chase Institute draws transaction-level data from over one million checking account holders to provide a first-ever daily look at the impacts of Hurricanes Harvey and Irma on financial outcomes. We find that checking account inflows temporarily dropped by over 20 percent, or roughly $400, in the week of landfall for both Harvey and Irma and recovered quickly in Houston, but not so in Miami. Checking account outflows dropped by more than 30 percent, or roughly $500, in the week of landfall and barely recovered 12 weeks after. The changes in spending resulted in welfare losses for some families. Among all spending categories, healthcare dropped the most. Because outflows dropped to a greater extent and for a longer period of time than inflows, families’ checking account balances remained steady or grew in the short run. But these healthier balances may mask incidents of deferred medical and debt payments, as well as anticipated costs to repair homes and replace property. In this sense, in the face of a hurricane, families appeared financially resilient, but may not have been economically resilient.
Our analysis uncovers five key findings:
1. Total inflows were more than 20 percent, or roughly $400, lower than baseline in the week of landfall. Inflows recovered quickly in Houston, but not so in Miami.
2. In aggregate, total outflows dropped by more than 65 percent around the day of landfall and by more than 30 percent, or roughly $500, in the week of landfall.

3
WEATHERING THE STORM: THE FINANCIAL IMPACTS OF HURRICANES HARVEY AND IRMA ON ONE MILLION HOUSEHOLDS
3
Executive Summary
3. Some spending categories (fuel, grocery, and home expenses) saw increases in preparation for the hurricane. However, in the week of landfall, consumers cut spending across most categories. Healthcare spending dropped by more than 50 percent and still remained lower 12 weeks after.
4. Debt payments dropped by more than 15 percent in the week when the hurricanes hit and cumulatively remained lower than baseline 12 weeks after Hurricane Harvey and 10 weeks after Hurricane Irma.
5. Checking account balances were 10 percent, or roughly $670, higher than baseline 12 weeks after Hurricane Harvey and remained steady 10 weeks after Hurricane Irma.
ConclusionThese findings underscore that disasters such as hurricanes disrupt the flow of money and people’s financial routines. The spending category that dropped the most was healthcare spending, leaving open key questions as to whether the slowdown in healthcare spending was caused by a drop in demand or disruptions in healthcare supply. While checking account balances remained stable or grew in the short run, these healthier balances may mask welfare losses, such as incidents of deferred medical care and debt payments, as well as anticipated costs to repair homes and replace property. In this sense, in the face of a hurricane families appeared financially resilient but may not have been economically resilient. Local officials may want to consider strengthening efforts to improve the resiliency of healthcare providers in flood-prone areas. In addition, families living in flood-prone areas could take significant actions to make themselves more economically resilient in the face of a hurricane—notably, building a liquid cash buffer to weather financial volatility and purchasing flood insurance. This report marks a critical step forward in understanding the impacts of hurricanes on people’s financial lives and informing efforts to improve disaster preparedness, and response.

4
Introduction
The year 2017 was on record as having the highest number of billion-dollar weather events since 1980, on par with 2011, and Congress approved over $50 billion in federal funding for disaster relief in 2017 (NOAA, 2017). Following Hurricanes Harvey and Irma, Hurricane Maria’s landfall (in Puerto Rico) marked a record three Category 4+ hurricane landfalls in the US in 2017. Disasters have been growing in both incidence and in the losses they inflict (Kousky, 2014). These losses are estimated to exceed $100 billion per year worldwide and include direct costs such as injury, loss of life, and damage to property; as well as indirect costs such as business interruption, lost wages, displaced residents, and lower tourism. Of all natural disasters, floods typically inflict the largest loss of life and property, and climate change is projected to increase the incidence of, and losses from, floods (Kousky, 2014).
How do disasters affect households financially? This report provides a first-ever daily view of the impacts of floods on household spending, income, and liquid assets in the cases of Hurricane Harvey and Hurricane Irma in 2017. Our topline results focus on Houston and Miami metro areas respectively, where we have substantial sample coverage, but we also publish estimates for other metro areas in Texas and Florida affected by these two hurricanes. We examine what happened to household checking account inflows, outflows, and balances in the 7 weeks prior to and 12 weeks after the hurricanes.
We find that inflows temporarily dropped by over 20 percent, or roughly $400, in the week of landfall and recovered quickly in Houston, but no so in Miami. Outflows dropped by more than 30 percent, or roughly $500, in the week of landfall and had barely recovered 12 weeks after. The changes in spending resulted in welfare losses for some families. Among all spending categories, healthcare dropped the most, debt payments slowed, and home expenses increased the most. Because outflows dropped to a greater extent than inflows, families’ checking account balances remained steady or grew in the short run. But these healthier balances may mask incidents of deferred medical and debt payments, as well as anticipated costs to repair homes and replace property. In this sense families appeared financially resilient, but may not have been economically resilient in the face of a hurricane.
Our specific findings are fivefold: First, total inflows were more than 20 percent, or roughly $400, lower than baseline in the week of landfall. Inflows recovered quickly in Houston, but not so in Miami. Second, total outflows dropped by more than 65 percent around the day of landfall and by more than 30 percent, or roughly $500, in the week of landfall. Third, some spending categories (fuel, grocery, and home expenses) saw increases in preparation for the hurricane. However, in the week of landfall, consumers cut spending across most categories. Healthcare spending dropped by more than 50 percent and still remained lower 12 weeks after. Fourth, debt payments dropped by more than 15 percent in the week when the hurricanes hit and cumulatively remained lower than baseline 12 weeks after Hurricane Harvey and 10 weeks after Hurricane Irma. Finally, checking account balances were 10 percent, or roughly $670, higher than baseline 12 weeks after Hurricane Harvey and remained steady 10 weeks after Hurricane Irma.
Box 1: Potential impacts of Hurricanes Harvey and Irma on financial outcomes and how we measure them
In this report, we examine the effects of two Category 4 hurricanes of 2017—Hurricane Harvey and Hurricane Irma. Hurricane Harvey made landfall on August 25 and resulted in over 40 inches of rainfall and historic flooding in Houston and surrounding counties. Hurricane Irma made landfall on September 10 and delivered extremely high winds and storm surge along coastal areas of Florida but just 4 inches of rain in Miami. See the Data Asset section for an in-depth description and comparison of the hurricane events (Figure 14 in the Data Asset section).
A hurricane could impact a household’s financial outcomes in a variety of ways. First, households spend money to prepare for the hurricane. This spending could include
purchasing food, water, fuel, batteries, medical supplies, and other provisions to sustain a family through possible power outages and store closures. They may also incur expenses to protect their homes and property against damage. Some families leave their homes in advance of the hurricane either by choice or as a result of mandatory evacuation orders. They may move into a shelter or to an area unaffected by the hurricane, potentially incurring costs for fuel, travel, hotel rooms, and other provisions.
During the hurricane, economic activity may come to a near halt. With many businesses closed, employees stay home from work, as do customers. For salaried workers, the hurricane may have little immediate impact on their
5
WEATHERING THE STORM: THE FINANCIAL IMPACTS OF HURRICANES HARVEY AND IRMA ON ONE MILLION HOUSEHOLDS
5
Introduction
income, but many hourly workers may experience a drop in their hours, save the few who might be working overtime. Even if workers collect a paycheck, they may have difficulty accessing the funds unless they are deposited directly into their account or paid in cash. Spending may also drop significantly, as may debt payments, unless individuals have set up their bills to be paid automatically. More generally, the hurricane may disrupt individuals' normal transaction habits, because they are distracted, occupied, or physically unable to transact without access to powered electronic devices, bank branches, or ATMs.
After the hurricane, many families may incur expenses to return home and replace or repair homes, vehicles, and personal belongings. They may also incur medical expenses treating hurricane-related injuries. They may “catch up” on purchases, appointments, and payments they missed during the hurricane. Depending on what industry they work in and the physical damage to their workplace, they may see an increase or decrease in wages relative to pre-hurricane levels.
In sum, it is worth noting a few key dynamics. First, hurricanes may have very disparate impacts across families. Certain families may come through virtually unscathed in every aspect of their lives or even come out ahead if they work in the construction business, for example. Others may suffer massive damage to their homes and blows to their livelihoods. Second, hurricanes may result in not just a shift in timing of inflows and outflows but also in composition of income and spending. On the positive side, humanitarian aid and other disaster relief efforts may result in the availability of free food, water, clothing, medical services, and other reduced-price or free services. Many financial institutions, including Chase Bank, waived late fees on mortgages, auto loans, and credit card debt as well as checking account overdraft fees and monthly service charges for customers residing in hurricane-affected areas. On the flip side, a drop in spending on healthcare, vehicle repair, or other necessities may reflect a true welfare loss, particularly if deferred for a long period of time. Similarly, individuals who fall behind on their debt payments may incur higher borrowing costs over time.
While we cannot observe each of these distinct phenomena, we assess the net effect of these disparate impacts on household financial outcomes. We assembled a sample of over one million checking account customers who resided in areas affected by Hurricanes Harvey and Irma during the month of landfall—August 2017 for Hurricane Harvey and September 2017 for Hurricane Irma—and were regular users of their Chase checking accounts. Our results focus
on the outcomes of Houston and Miami residents, though we publish summary statistics (in Figure 18 of the Data Asset section) of other metro areas similarly affected by the hurricanes, including Beaumont in Texas and Orlando, Tampa, Fort Myers, Jacksonville, and Naples in Florida.
With data available until November 2017, we examine changes in patterns of inflows, outflows, and checking account balances up to 12 weeks after Hurricane Harvey and 10 weeks after Hurricane Irma. Inflows include both labor income and other inflows, and outflows include spending, bill and debt payments, and other outflows. In order to compare the impacts of Hurricanes Harvey and Irma, we present our results as event studies, where day zero represents the day of landfall (August 25 for Houston residents and September 10 for Miami residents), and week zero—the week of landfall—represents the seven-day period starting on the day of landfall (the weeks beginning August 25 and September 10 in Houston and Miami, respectively). In each case we compare outflows, inflows, and balances to the same period the year prior. This year-over-year comparison offers a simple way of accounting for the day-of-week, day-of-month, and seasonal patterns observed in inflows, outflows, and balances, which otherwise make it difficult to clearly detect the impacts of the hurricanes. See the Data Asset section for a more in-depth discussion of our methods and unadjusted data series (Figure 15).
In order to quantify the change in inflows and outflows in a given period, we compare actual levels of inflows and outflows to what we might have expected given observed levels of inflows and outflows in a “baseline period,” defined as seven to three weeks prior to landfall. Starting two weeks prior to landfall and up to twelve weeks after the hurricane we extrapolate an expected baseline level of inflows and outflows for each category as the level in the corresponding week in 2016 multiplied by the year-over-year growth rate in that category during the baseline period. We use the term "baseline" to refer to this expected baseline value. Then for each category of inflows and outflows we calculate the percent deviation between the actual observed level and the "baseline."
We assess the changes in financial outcomes by week, but also cumulatively by summing up deviation between actual and baseline levels by week for 12 weeks after Hurricane Harvey and 10 weeks after Hurricane Irma. This cumulative view provides insight into how the hurricane influenced not just the timing of inflows and outflows but also the composition over time.
6
Findings
Finding One
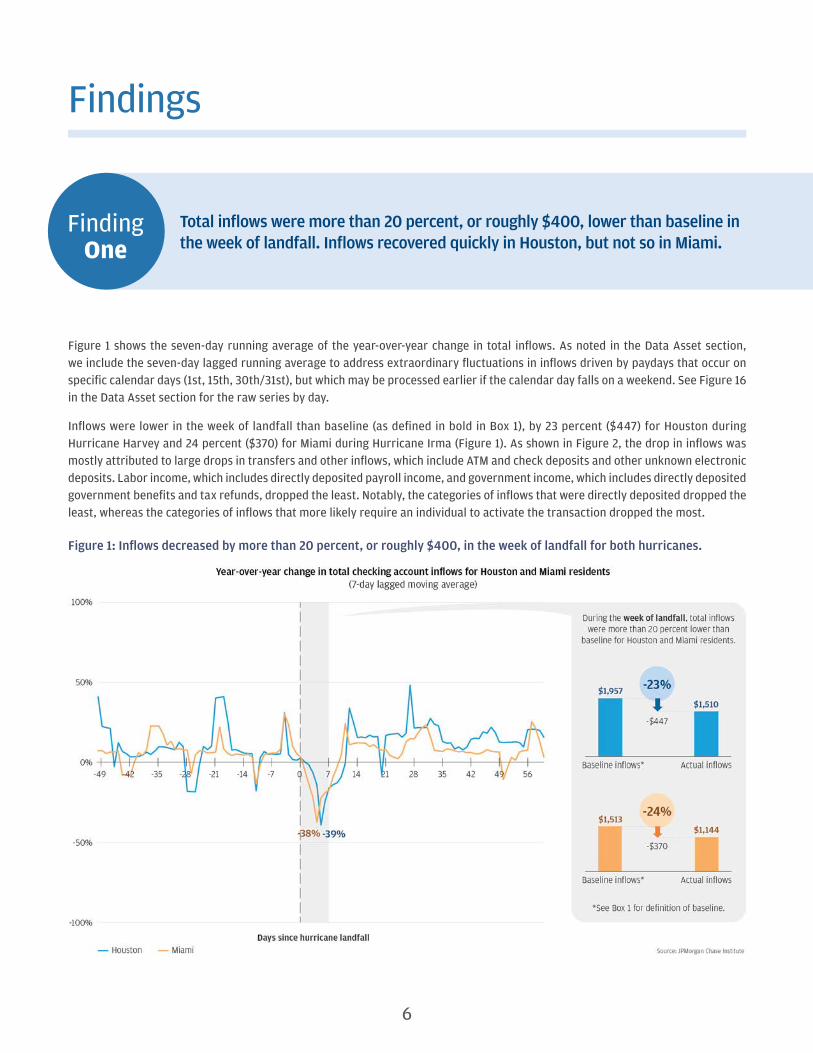
Total inflows were more than 20 percent, or roughly $400, lower than baseline in the week of landfall. Inflows recovered quickly in Houston, but not so in Miami.
Figure 1 shows the seven-day running average of the year-over-year change in total inflows. As noted in the Data Asset section, we include the seven-day lagged running average to address extraordinary fluctuations in inflows driven by paydays that occur on specific calendar days (1st, 15th, 30th/31st), but which may be processed earlier if the calendar day falls on a weekend. See Figure 16 in the Data Asset section for the raw series by day.
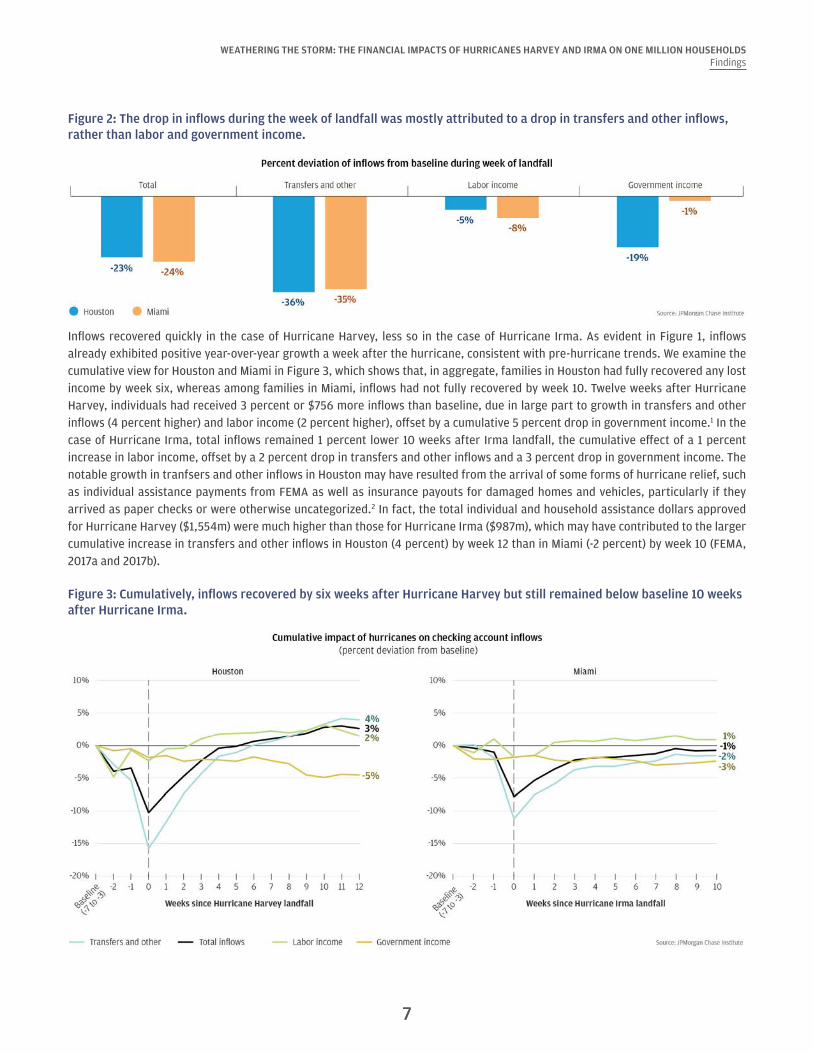
Inflows were lower in the week of landfall than baseline (as defined in bold in Box 1), by 23 percent ($447) for Houston during Hurricane Harvey and 24 percent ($370) for Miami during Hurricane Irma (Figure 1). As shown in Figure 2, the drop in inflows was mostly attributed to large drops in transfers and other inflows, which include ATM and check deposits and other unknown electronic deposits. Labor income, which includes directly deposited payroll income, and government income, which includes directly deposited government benefits and tax refunds, dropped the least. Notably, the categories of inflows that were directly deposited dropped the least, whereas the categories of inflows that more likely require an individual to activate the transaction dropped the most.
Figure 1: Inflows decreased by more than 20 percent, or roughly $400, in the week of landfall for both hurricanes.
7
WEATHERING THE STORM: THE FINANCIAL IMPACTS OF HURRICANES HARVEY AND IRMA ON ONE MILLION HOUSEHOLDSFindings
7
Figure 2: The drop in inflows during the week of landfall was mostly attributed to a drop in transfers and other inflows, rather than labor and government income.
Inflows recovered quickly in the case of Hurricane Harvey, less so in the case of Hurricane Irma. As evident in Figure 1, inflows already exhibited positive year-over-year growth a week after the hurricane, consistent with pre-hurricane trends. We examine the cumulative view for Houston and Miami in Figure 3, which shows that, in aggregate, families in Houston had fully recovered any lost income by week six, whereas among families in Miami, inflows had not fully recovered by week 10. Twelve weeks after Hurricane Harvey, individuals had received 3 percent or $756 more inflows than baseline, due in large part to growth in transfers and other inflows (4 percent higher) and labor income (2 percent higher), offset by a cumulative 5 percent drop in government income.1 In the case of Hurricane Irma, total inflows remained 1 percent lower 10 weeks after Irma landfall, the cumulative effect of a 1 percent increase in labor income, offset by a 2 percent drop in transfers and other inflows and a 3 percent drop in government income. The notable growth in tranfsers and other inflows in Houston may have resulted from the arrival of some forms of hurricane relief, such as individual assistance payments from FEMA as well as insurance payouts for damaged homes and vehicles, particularly if they arrived as paper checks or were otherwise uncategorized.2 In fact, the total individual and household assistance dollars approved for Hurricane Harvey ($1,554m) were much higher than those for Hurricane Irma ($987m), which may have contributed to the larger cumulative increase in transfers and other inflows in Houston (4 percent) by week 12 than in Miami (-2 percent) by week 10 (FEMA, 2017a and 2017b).
Figure 3: Cumulatively, inflows recovered by six weeks after Hurricane Harvey but still remained below baseline 10 weeks after Hurricane Irma.

8
WEATHERING THE STORM: THE FINANCIAL IMPACTS OF HURRICANES HARVEY AND IRMA ON ONE MILLION HOUSEHOLDSFindings
8
Finding Two
Total outflows dropped by more than 65 percent around the day of landfall and by more than 30 percent, or roughly $500, in the week of landfall.
In aggregate, relative to the year prior, outflows dropped significantly during the week of landfall for both hurricanes. Figure 4 displays the year-over-year change in total checking account outflows for Houston and Miami residents. At their lowest points, outflows were 65 percent lower in Houston and 71 percent lower in Miami compared to their respective levels in 2016. As evident in Figure 4, outflow levels during the baseline period were, in general, higher than they had been the year prior. Taking into consideration this year-over-year secular growth, we estimate that in the week of landfall, total outflows were 34 percent ($562) lower than baseline period for Houston and 33 percent ($490) lower for Miami.
Figure 4: Outflows dropped by more than 65 percent around day of landfall for the two hurricanes.
Residents in both metro areas experienced a similar drop in total outflows during the hurricanes in magnitude. However, Miami residents’ spending pattern accelerated and then dropped roughly five days earlier relative to landfall compared to Houston residents. We observe an acceleration in outflows among Miami residents starting 10 days prior and reaching peak level on September 5, five days before landfall. On September 5, outflows were 28 percent higher than the previous year. Notably, this pattern of accelerated preparatory spending was much less pronounced before Harvey landfall for Houston residents. Following the peak of the anticipatory response Miami residents immediately started to cut spending on September 5, five days before landfall. In contrast, Houston residents only started to cut outflows starting on the day of landfall.
Several factors could have led to Miami residents’ heightened anticipatory response before Irma. As described in the Data Asset section, Miami residents had five full days of watching a Category 5 hurricane approach before it made landfall on Florida Keys on September 10 (National Weather Service, 2017a). Hurricane Harvey, in contrast, quickly intensified from a tropical storm to a Category 4 hurricane within 48 hours (National Weather Service, 2017b), giving Houston residents far less advance warning than Miami residents had. In addition, there could also have been heightened awareness of potential hurricane damage given that Irma happened two weeks after Harvey. Finally, evacuation orders were ordered for Irma but not Harvey, causing many Miami residents to leave their homes in advance of the hurricane.
By two weeks after the hurricane, year-over-year growth rates of outflows had returned to their baseline levels in aggregate. The notable spike in year-over-year change in outflows on day 25 after Irma landfall was due to low levels of outflows during Hurricane Matthew that impacted Florida during the first week of October 2016. Next we explore how the composition of spending changed before, during, and after the hurricane.

9
WEATHERING THE STORM: THE FINANCIAL IMPACTS OF HURRICANES HARVEY AND IRMA ON ONE MILLION HOUSEHOLDSFindings
9
Finding Three
Some spending categories (fuel, grocery, and home expenses) saw increases in preparation for the hurricane. However, in the week of landfall, consumers cut spending across most categories. Healthcare spending dropped by more than 50 percent and still remained lower 12 weeks after.
A week prior to landfall, consumers increased spending on key consumption categories in preparation for the hurricane. The spike in “preparatory spending” was most striking for fuel and transit, grocery, and home expenses. For example, fuel and transit expenses were 37 percent and 33 percent higher than baseline for Houston and Miami residents respectively during the week prior to landfall (Figure 5). Grocery and home expenses were also elevated in both Houston and Miami relative to baseline.
Figure 5: During the week before landfall, consumers increased spending on fuel, grocery, and home expenses.
The increase in spending across these categories was even more striking at the daily level (Figure 6) and reveals that the anticipatory spending response differed between Houston and Irma residents in not just timing but also composition. At peak levels, fuel and transit spending increased by 168 percent year-over-year before Harvey made landfall and 176 percent year-over-year before Irma. Grocery spending increased by 167 percent before Harvey landfall and 139 percent before Irma landfall. Interestingly, Miami residents increased their home expenses considerably more than Houston residents, potentially in an effort to mitigate the impacts of stronger wind brought by Hurricane Irma. During the week before landfall, the year-over-year growth rate of Miami residents’ spending on home expenses reached 147 percent at its peak, compared to 58 percent for Houston residents.
The spike in “preparatory spending”
was most striking for fuel and transit, grocery, and
home expenses.

10
WEATHERING THE STORM: THE FINANCIAL IMPACTS OF HURRICANES HARVEY AND IRMA ON ONE MILLION HOUSEHOLDSFindings
10
Figure 6: Year-over-year change in spending was even more striking at the daily level in Houston and Miami.
11
WEATHERING THE STORM: THE FINANCIAL IMPACTS OF HURRICANES HARVEY AND IRMA ON ONE MILLION HOUSEHOLDSFindings
11
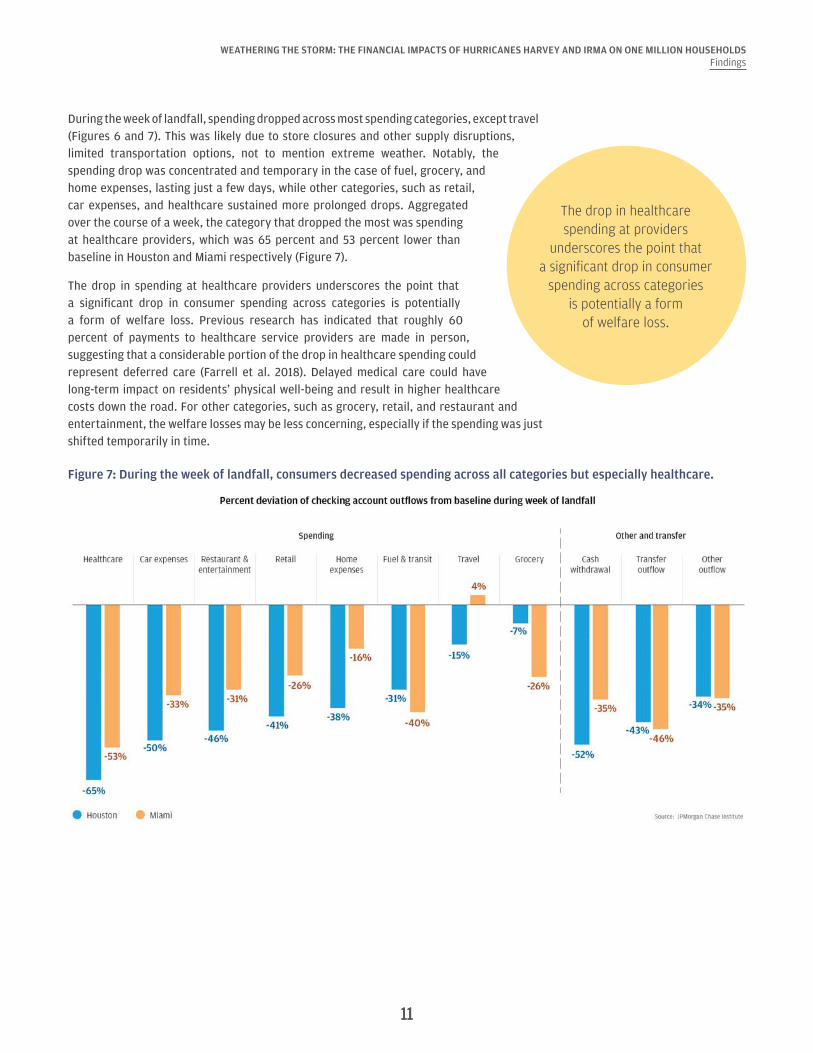
During the week of landfall, spending dropped across most spending categories, except travel (Figures 6 and 7). This was likely due to store closures and other supply disruptions, limited transportation options, not to mention extreme weather. Notably, the spending drop was concentrated and temporary in the case of fuel, grocery, and home expenses, lasting just a few days, while other categories, such as retail, car expenses, and healthcare sustained more prolonged drops. Aggregated over the course of a week, the category that dropped the most was spending at healthcare providers, which was 65 percent and 53 percent lower than baseline in Houston and Miami respectively (Figure 7).
The drop in spending at healthcare providers underscores the point that a significant drop in consumer spending across categories is potentially a form of welfare loss. Previous research has indicated that roughly 60 percent of payments to healthcare service providers are made in person, suggesting that a considerable portion of the drop in healthcare spending could represent deferred care (Farrell et al. 2018). Delayed medical care could have long-term impact on residents’ physical well-being and result in higher healthcare costs down the road. For other categories, such as grocery, retail, and restaurant and entertainment, the welfare losses may be less concerning, especially if the spending was just shifted temporarily in time.
The drop in healthcare spending at providers
underscores the point that a significant drop in consumer
spending across categories is potentially a form
of welfare loss.
Figure 7: During the week of landfall, consumers decreased spending across all categories but especially healthcare.
12
WEATHERING THE STORM: THE FINANCIAL IMPACTS OF HURRICANES HARVEY AND IRMA ON ONE MILLION HOUSEHOLDSFindings
12
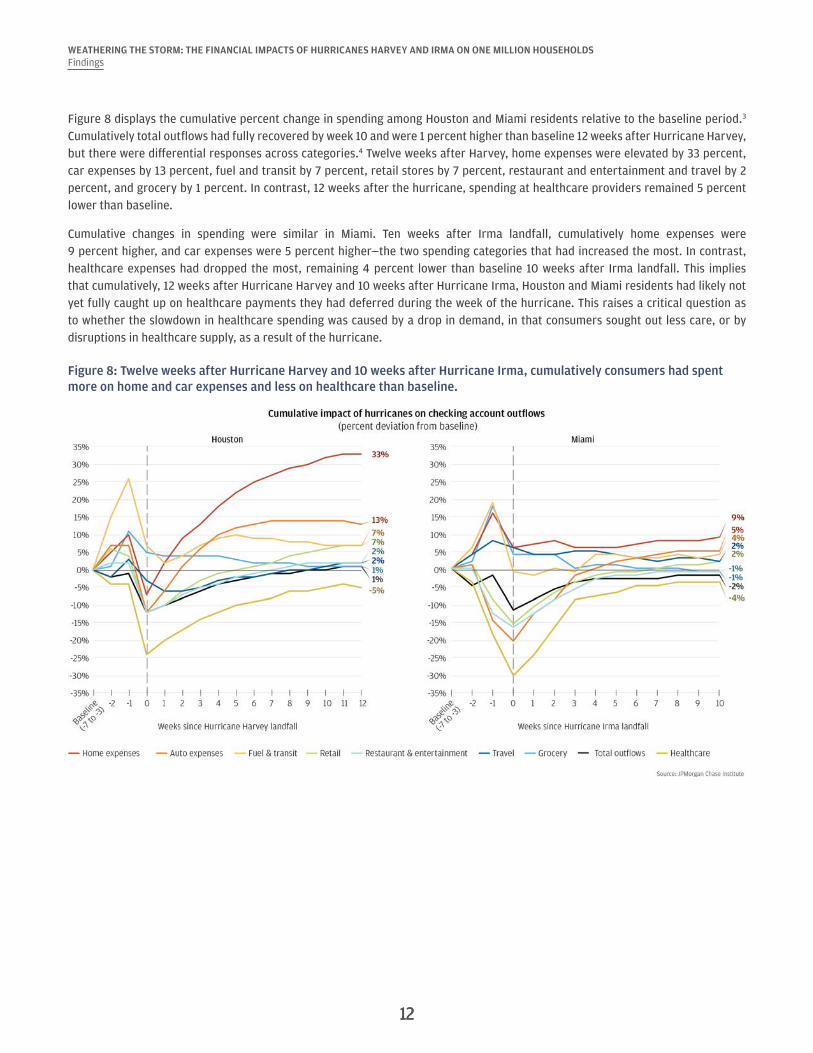
Figure 8 displays the cumulative percent change in spending among Houston and Miami residents relative to the baseline period.3
Cumulatively total outflows had fully recovered by week 10 and were 1 percent higher than baseline 12 weeks after Hurricane Harvey, but there were differential responses across categories.4 Twelve weeks after Harvey, home expenses were elevated by 33 percent, car expenses by 13 percent, fuel and transit by 7 percent, retail stores by 7 percent, restaurant and entertainment and travel by 2 percent, and grocery by 1 percent. In contrast, 12 weeks after the hurricane, spending at healthcare providers remained 5 percent lower than baseline.
Cumulative changes in spending were similar in Miami. Ten weeks after Irma landfall, cumulatively home expenses were 9 percent higher, and car expenses were 5 percent higher—the two spending categories that had increased the most. In contrast, healthcare expenses had dropped the most, remaining 4 percent lower than baseline 10 weeks after Irma landfall. This implies that cumulatively, 12 weeks after Hurricane Harvey and 10 weeks after Hurricane Irma, Houston and Miami residents had likely not yet fully caught up on healthcare payments they had deferred during the week of the hurricane. This raises a critical question as to whether the slowdown in healthcare spending was caused by a drop in demand, in that consumers sought out less care, or by disruptions in healthcare supply, as a result of the hurricane.
Figure 8: Twelve weeks after Hurricane Harvey and 10 weeks after Hurricane Irma, cumulatively consumers had spent more on home and car expenses and less on healthcare than baseline.
13
WEATHERING THE STORM: THE FINANCIAL IMPACTS OF HURRICANES HARVEY AND IRMA ON ONE MILLION HOUSEHOLDSFindings
13
Finding Four
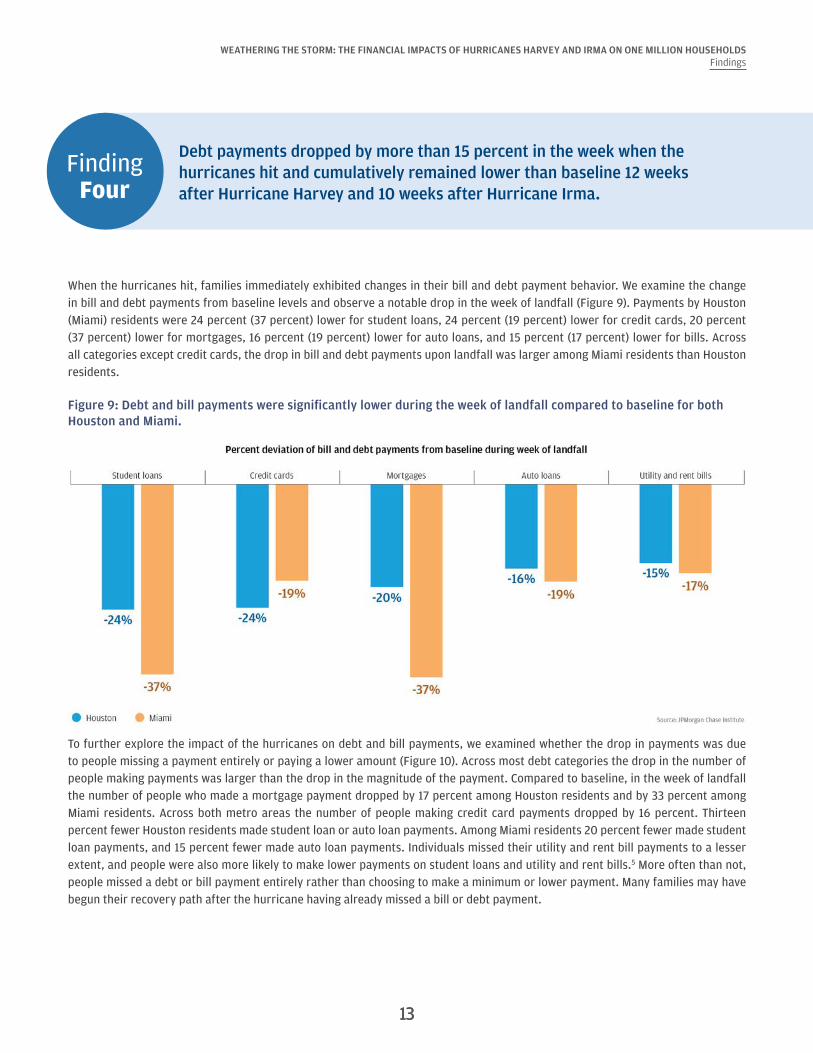
Debt payments dropped by more than 15 percent in the week when the hurricanes hit and cumulatively remained lower than baseline 12 weeks after Hurricane Harvey and 10 weeks after Hurricane Irma.
When the hurricanes hit, families immediately exhibited changes in their bill and debt payment behavior. We examine the change in bill and debt payments from baseline levels and observe a notable drop in the week of landfall (Figure 9). Payments by Houston (Miami) residents were 24 percent (37 percent) lower for student loans, 24 percent (19 percent) lower for credit cards, 20 percent (37 percent) lower for mortgages, 16 percent (19 percent) lower for auto loans, and 15 percent (17 percent) lower for bills. Across all categories except credit cards, the drop in bill and debt payments upon landfall was larger among Miami residents than Houston residents.
Figure 9: Debt and bill payments were significantly lower during the week of landfall compared to baseline for both Houston and Miami.
To further explore the impact of the hurricanes on debt and bill payments, we examined whether the drop in payments was due to people missing a payment entirely or paying a lower amount (Figure 10). Across most debt categories the drop in the number of people making payments was larger than the drop in the magnitude of the payment. Compared to baseline, in the week of landfall the number of people who made a mortgage payment dropped by 17 percent among Houston residents and by 33 percent among Miami residents. Across both metro areas the number of people making credit card payments dropped by 16 percent. Thirteen percent fewer Houston residents made student loan or auto loan payments. Among Miami residents 20 percent fewer made student loan payments, and 15 percent fewer made auto loan payments. Individuals missed their utility and rent bill payments to a lesser extent, and people were also more likely to make lower payments on student loans and utility and rent bills.5 More often than not, people missed a debt or bill payment entirely rather than choosing to make a minimum or lower payment. Many families may have begun their recovery path after the hurricane having already missed a bill or debt payment.

14
WEATHERING THE STORM: THE FINANCIAL IMPACTS OF HURRICANES HARVEY AND IRMA ON ONE MILLION HOUSEHOLDSFindings
14
Figure 10: The drop in debt and bill payments was primarily due to people missing their debt payment entirely rather than paying a lower amount.
Next we examine whether families caught up on their bill and debt payments over time within the 12 weeks after Hurricane Harvey and 10 weeks after Hurricane Irma. We find that 12 weeks after Hurricane Harvey, bill and debt payment among Houston residents were all still lower than baseline levels by 12 percent for mortgages, 9 percent for auto loans and student loans, and 2 percent lower for credit card payments and bill payments (Figure 11). In Miami we observe that, as of 10 weeks after Hurricane Irma, cumulatively Miami residents had recovered pace on their rent and utility bills but made considerably lower debt payments. Their cumulative debt payments were 16 percent lower payments for mortgages, 19 percent lower for student loans, 7 percent lower for auto loans, and 2 percent lower for credit cards.6 In fact, as of 10 weeks after landfall the cumulative drop in debt payments was larger among Miami residents than Houston residents.
Figure 11: Debt payments were still lower than baseline 12 weeks after Hurricane Harvey and 10 weeks after Hurricane Irma.

15
WEATHERING THE STORM: THE FINANCIAL IMPACTS OF HURRICANES HARVEY AND IRMA ON ONE MILLION HOUSEHOLDSFindings
15
There are several possibilities for why bill and debt payments still remained lower than baseline 12 weeks later. First, individuals may have simply missed a payment during the hurricane and never caught up. The hurricane may have disrupted their normal bill and debt paying behavior in that they found it physically difficult to transact or were simply focused on more pressing needs. This is a likely possibility given that only a minority of consumers opt into automatic payment plans. Among Chase customers, just 36 percent of mortgage holders, 16 percent of credit card holders, and 3 percent of auto loan holders were enrolled in automatic payment plans in 2017.
A second likely reason for lower debt payments could be that costs and penalties for late payments were lowered. Many financial institutions put auto loans and mortgages into forbearance in hurricane-hit areas, meaning that debtors could delay payment without incurring late payment fees or derogatory credit report records (Federal Housing Finance Authority, 2017). That said, individuals may have needed to request forbearance in order to receive such status, and, even while loans are in forbearance, interest charges accrue, resulting in higher total debt costs. Evidence from past disasters suggests that people took on more credit card debt but did not suffer worse credit outcomes as a result (Gallagher and Hartley, 2017; Tran and Sheldon, 2017).
Many families may have begun
their recovery path after the hurricane having already missed a bill
or debt payment.A third reason people may have paid lower bill and debt payments is that some individuals may have actually owed lower amounts after the hurricane. This could apply to credit cards due to lower credit card spending and utility bills due to power outages and lower demand. People who suffered damage to their vehicles and homes might also owe less on their auto loans and mortgages respectively if they used insurance payouts to pay down their loan debt rather than repair their vehicle or home.7 In short, the cumulative drop in bill and debt payments may have represented an increase in debts costs for some but not necessarily all individuals.
In summary, when it comes to outflows, we observed an anticipatory increase in advance of the hurricanes most notably in fuel, grocery, and home expenses. The anticipatory spending response was larger in the case of Hurricane Irma in Miami, which came shortly on the heels of Hurricane Harvey and triggered mandatory evacuations. The arrival of the hurricanes resulted in dramatic drops across all spending categories, but most dramatically in healthcare spending. Hurricane landfall also marked a slowdown in families’ bill and debt payment behavior. After the hurricane, spending surged in home and auto expenses, but consumers continued to spend less than baseline on healthcare and make lower debt payments even 12 weeks after Hurricane Harvey and 10 weeks after Hurricane Irma. As a final step we examine how inflows and outflows impacted checking account balances.

16
WEATHERING THE STORM: THE FINANCIAL IMPACTS OF HURRICANES HARVEY AND IRMA ON ONE MILLION HOUSEHOLDSFindings
16
Finding Five
Checking account balances were 10 percent, or roughly $670, higher than baseline 12 weeks after Hurricane Harvey and remained steady 10 weeks after Hurricane Irma.
Figure 12 shows the change in checking account balances relative to baseline by week up to 12 weeks after Hurricane Harvey and 10 weeks after Hurricane Irma. It shows that in the week of the hurricane, checking account balances remained relatively steady due to the simultaneous drops in inflows and outflows. Checking account balances among Houston residents started to rise within one week after the hurricane due to the fact that the pace of inflows recovered more quickly than the pace of outflows. By 12 weeks after Hurricane Harvey, checking account balances were $668 or 10 percent higher than baseline. By 10 weeks after Hurricane Irma, checking account balances among Miami residents were $70 or 2 percent higher than baseline. The growth in checking account balances in Miami was less significant than in Houston.8 This is due to the fact that, as shown in Figures 3 and 8, in Houston, inflows recovered more quickly than outflows. In Miami, both inflows and outflows remained below baseline to a similar extent as of 10 weeks after the hurricane.
Figure 12: Average daily checking account balances were 10 percent, or $668, higher than baseline 12 weeks after Hurricane Harvey.
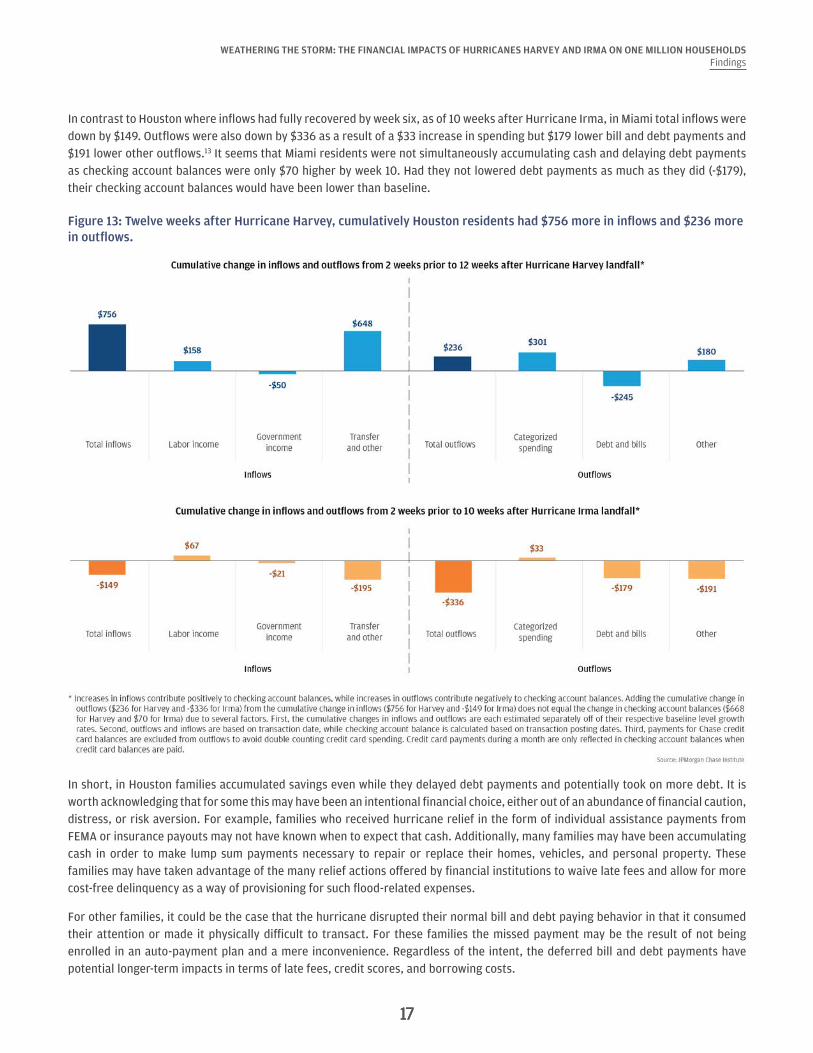
To put the changes in checking account balances into perspective, we display the cumulative dollar change in outflows and inflows (Figure 13). While these numbers represent estimates (and reflect differences in transaction versus posting dates) and are thus not perfectly comparable in an accounting sense, we can see that, among Houston residents, the growth in inflows ($756) was higher in magnitude than the growth in outflows ($236) and thus may have contributed more to the growth in checking account balances.9
Families in Houston spent roughly $301 more than baseline levels, and other outflows increased by $180.10 This increase in spending and other outflows was offset by decreases in total bill and debt payments (-$245) and a cumulative increase in inflows ($756).11 It is worth noting that the increase in inflows ($756) was almost entirely driven by the increase in transfers and other inflows ($648), which may include hurricane relief. In addition, the increase in inflows was more than sufficient to cover the increase in spending ($301). This means that as of 12 weeks after Hurricane Harvey, in aggregate, had families kept pace with their bill and debt payments and other outflows their checking account balances would have still remained higher than baseline. As we have previously noted, the decrease in debt payments may not necessarily reflect an increase in debt balances. To the extent that families did fall behind on debt payments, many families may have had the cash to continue making debt payments at the same pace as they had been before and may have accumulated more debt and more cash at the same time.12
17
WEATHERING THE STORM: THE FINANCIAL IMPACTS OF HURRICANES HARVEY AND IRMA ON ONE MILLION HOUSEHOLDSFindings
17
In contrast to Houston where inflows had fully recovered by week six, as of 10 weeks after Hurricane Irma, in Miami total inflows were down by $149. Outflows were also down by $336 as a result of a $33 increase in spending but $179 lower bill and debt payments and $191 lower other outflows.13 It seems that Miami residents were not simultaneously accumulating cash and delaying debt payments as checking account balances were only $70 higher by week 10. Had they not lowered debt payments as much as they did (-$179), their checking account balances would have been lower than baseline.
Figure 13: Twelve weeks after Hurricane Harvey, cumulatively Houston residents had $756 more in inflows and $236 more in outflows.
In short, in Houston families accumulated savings even while they delayed debt payments and potentially took on more debt. It is worth acknowledging that for some this may have been an intentional financial choice, either out of an abundance of financial caution, distress, or risk aversion. For example, families who received hurricane relief in the form of individual assistance payments from FEMA or insurance payouts may not have known when to expect that cash. Additionally, many families may have been accumulating cash in order to make lump sum payments necessary to repair or replace their homes, vehicles, and personal property. These families may have taken advantage of the many relief actions offered by financial institutions to waive late fees and allow for more cost-free delinquency as a way of provisioning for such flood-related expenses.
For other families, it could be the case that the hurricane disrupted their normal bill and debt paying behavior in that it consumed their attention or made it physically difficult to transact. For these families the missed payment may be the result of not being enrolled in an auto-payment plan and a mere inconvenience. Regardless of the intent, the deferred bill and debt payments have potential longer-term impacts in terms of late fees, credit scores, and borrowing costs.
18
Implications
In summary, Hurricanes Harvey and Irma resulted in major financial disruptions for many families. Total inflows dropped by more than 20 percent or roughly $400 in the week of landfall but recovered quickly in Houston. Total outflows dropped by more than 30 percent in the week of landfall and still had barely recovered 12 weeks after the hurricane. Because outflows dropped to a greater extent, families’ checking account balances remained stable or grew in the short run. But these healthier balances may mask incidents of deferred medical and debt payments, as well as anticipated costs to repair homes and replace property. In this sense families appeared financially resilient, but may not have been economically resilient in the face of a hurricane. Below we consider implications for the financial resilience of families and efforts to improve disaster preparedness and response.
• The hurricanes resulted in material drops in healthcare payments, which had not recovered even 12 weeks after Hurricane Harvey and 10 weeks after Hurricane Irma. This leaves open key questions as to whether the slowdown in healthcare spending was caused by a drop in demand, in that consumers sought out less care; a drop in out-of-pocket costs, possibly due to the availability of more healthcare free of charge; or by disruptions in healthcare supply, which have been documented in the aftermath of other hurricanes (e.g., City of New York, 2013 and Abramson and Garfield, 2006). In any case, a drop in demand or supply or both would likely result in deferred care, which could lead to worse health outcomes and higher costs. Local officials may want to consider strengthening efforts to ensure healthcare providers, including hospitals, nursing homes, and adult care facilities, are more prepared for and resilient to disasters. Importantly, this may require more fundamental investments in emergency generators, flood proofing, infrastructure to enable access to medical reports across providers, and other measures to improve the resiliency of healthcare providers in flood-prone areas. In addition, emergency response efforts may need to provision for baseline healthcare needs at shelters and emphasize to residents the importance of continuing to meet their non-hurricane related healthcare needs during and after a disaster. The fact that healthcare spending is so elastic in the face of a hurricane underscores the extent to which the most vulnerable—the very young, the sick, and the elderly—may be disproportionately impacted by disruptions in healthcare supply from a disaster.
• The hurricanes resulted in disruptions in bill and debt payments and inflows not directly deposited. Many families began their recovery path having already missed a bill or debt payment. For those without automatic billpay or direct deposit, hurricanes may impede or disrupt people’s ability to trigger payments or access a paper paycheck. This is evident in the drop in bill payments, debt payments, as well as disproportionately large drop in inflows not directly deposited (i.e. transfers and other inflows). In this sense, disasters and associated power outages influence not just the flow of electricity but also the flow of money. For most people most of the time, automatic bill payments and payroll direct deposit play a key role in simplifying one’s financial life and ensuring one does not fall behind on debt payments and has access to payroll income. During extreme events, however, automatic bill payments and direct deposit may play a vital role in allowing people to continue routine financial transactions and access liquidity.
• Families living in flood-prone areas could take significant actions to make them more economically resilient in the face of a hurricane. First, families need a liquid cash buffer to weather financial volatility. Even though checking account balances remained steady or grew, the hurricane caused increased volatility in the form of spending spikes prior to the storm followed by major income and spending dips during the storm. People need a financial buffer to cover costs associated with evacuation, home mitigation, and other preparations in advance of a storm, not to mention the losses they might incur as a result of the storm. Second, those who live in the 100-year or 500-year flood plain may want to consider taking measures to make their home more physically resilient in the face of a storm as well as purchasing flood insurance. Although flood insurance is required for Federal Housing and Finance Agency-insured mortgages on homes within the 100-year flood plain, with the growth in high-intensity storms and rising sea levels, many flood-plain maps do not adequately reflect current and future risks, resulting in inadequate flood insurance coverage levels (Technical Mapping Advisory Council, 2016). Third, families with pre-existing healthcare needs may want to evacuate in advance of a hurricane. Given the drops in healthcare spending observed during and after Hurricanes Harvey and Irma and the documented disruptions in care and facilities observed during Hurricanes Katrina and Sandy, hurricanes can pose a major threat to the continuity of care (City of New York, 2013 and Abramson and Garfield, 2006).

19
WEATHERING THE STORM: THE FINANCIAL IMPACTS OF HURRICANES HARVEY AND IRMA ON ONE MILLION HOUSEHOLDSImplications
19
• High-frequency financial transaction data can help fill gaps in official national statistics and shed more light on the impact of shock events on household finance and consumer behavior. Scant evidence exists on the impacts of disasters on financial outcomes, and what does exist relies on outcomes observed on a quarterly basis (Tran and Shelden, 2017). With high-frequency financial transaction data, we are able to observe household financial outcomes day to day, which unmask important dynamics for household finance and decision-making that are otherwise uncovered by monthly or quarterly estimates. Furthermore, we are able to gather large samples of families in locations that are most significantly impacted. National statistics may be lacking when it comes to specific geographic locations. With the ability to observe the financial outcomes of several hundred thousand families within Houston and Miami, we can speak directly to the financial and economic impacts on Houston and Miami residents specifically.
People need a financial buffer to cover costs
associated with evacuation, home mitigation, and other preparations in advance of a
storm, not to mention the losses they might incur as
a result of the storm.

20
Data Asset
Background on Hurricanes Harvey and Irma
In this report, we examine the effects of two Category 4 hurricanes in 2017—Hurricane Harvey and Hurricane Irma (see Figure 14 below for descriptions). Hurricane Harvey made landfall on August 25 and resulted in over 40 inches of rainfall and historic flooding in Houston and surrounding counties. Hurricane Irma made landfall on September 10 delivering extremely high winds and storm surge along coastal areas of Florida but just 4 inches of rain in Miami.
There are notable differences between these two events. First, Hurricane Harvey was considered a “rain event,” while Hurricane Irma was more of a “wind event." There was considerably more rainfall concentrated in Houston from Harvey (43 inches) than in Miami from Irma (4 inches), whereas the estimated wind damage across a five-state area was much larger from Irma than from Harvey. Second, the anticipatory response to Irma was greater than for Harvey. Harvey intensified much more rapidly than Irma giving residents and policy makers little notice to prepare. In merely one day, Harvey developed from a tropical storm to a Category 4 hurricane. In contrast, Irma intensified from a tropical storm to a hurricane on August 31 and was labeled an “extremely dangerous” Category 5 hurricane on September 5, already five days before landfall. In addition, while Harvey was the first Category 4 hurricane of the 2017 hurricane season, Irma occurred less than three weeks thereafter, possibly making hurricanes more salient in the minds of Florida residents. While evacuations were not ordered for Houston residents, they were mandatory for many Miami residents, particularly those living in coastal areas (Florida Division of Emergency Management, 2017).
Figure 14: Description of Hurricanes Harvey and Irma and focal geographies for JPMCI analysis.
Event and landfall dateNational Oceanic and Atmospheric Administration (NOAA) description
Focal geography: inches of rainfall
JPMCI sample size
Hurricane HarveyAugust 25, 2017
Category 4 hurricane made landfall near Rockport, Texas causing widespread damage. Harvey's devastation was most pronounced due to the large region of extreme rainfall producing historic flooding across Houston and surrounding areas. More than 30 inches of rainfall fell on 6.9 million people, while 1.25 million experienced over 45 inches and 11,000 had over 50 inches, based on 7-day rainfall totals ending August 31. This historic rainfall caused massive flooding that displaced over 30,000 people and damaged or destroyed over 200,000 homes and businesses.
Houston: 43 in 487,455
Beaumont: 47 in 8,390
Hurricane Irma September 10, 2017
Category 4 hurricane made landfall at Cudjoe Key, Florida after devastating the US Virgin Islands—St John and St Thomas—as a Category 5 storm. The Florida Keys were heavily impacted, as 25 percent of buildings were destroyed while 65 percent were significantly damaged. Severe wind and storm surge damage also occurred along the coasts of Florida and South Carolina. Jacksonville, FL and Charleston, SC received near-historic levels of storm surge causing significant coastal flooding. Irma maintained a maximum sustained wind of 185 mph for 37 hours, the longest in the satellite era. Irma also was a Category 5 storm for longer than all other Atlantic hurricanes except Ivan in 2004.
Miami: 4 in 369,116
Orlando: 9 in 111,302
Tampa: 4 in 65,435
Fort Myers: 10 in 11,553
Jacksonville: 11 in 10,121
Naples: 12 in 7,816
21
WEATHERING THE STORM: THE FINANCIAL IMPACTS OF HURRICANES HARVEY AND IRMA ON ONE MILLION HOUSEHOLDSData Asset
21
Measuring impacts of Hurricanes Harvey and Irma
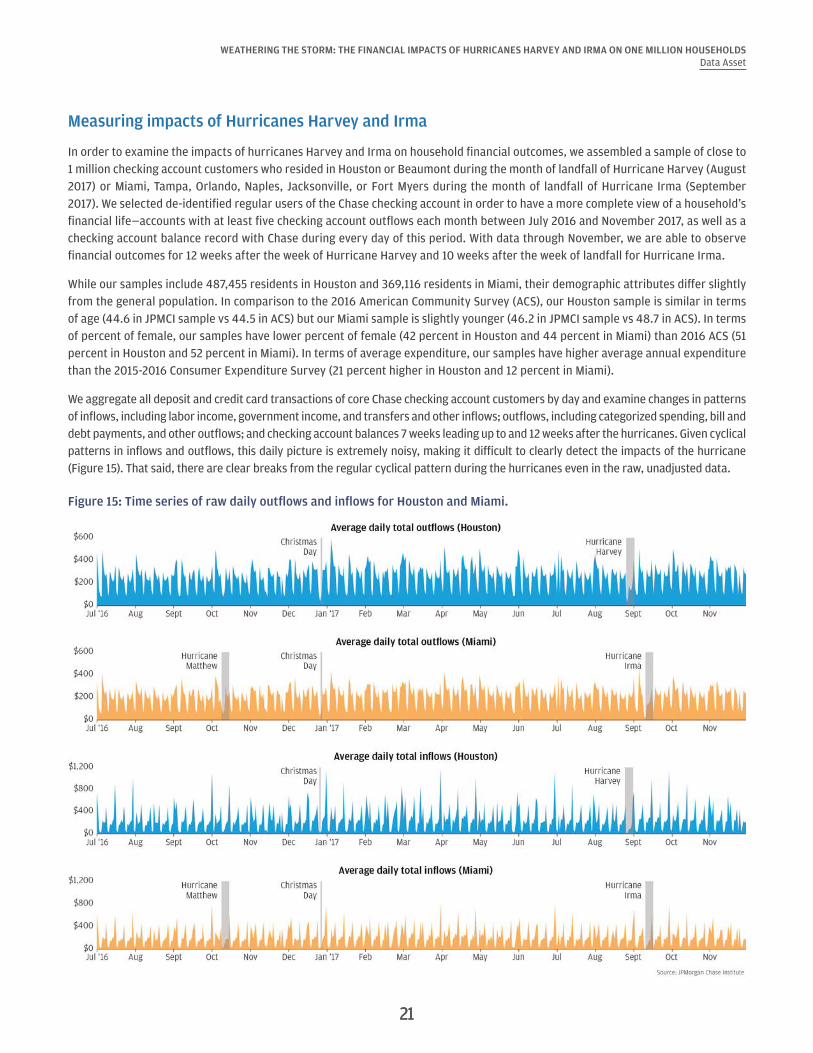
In order to examine the impacts of hurricanes Harvey and Irma on household financial outcomes, we assembled a sample of close to 1 million checking account customers who resided in Houston or Beaumont during the month of landfall of Hurricane Harvey (August 2017) or Miami, Tampa, Orlando, Naples, Jacksonville, or Fort Myers during the month of landfall of Hurricane Irma (September 2017). We selected de-identified regular users of the Chase checking account in order to have a more complete view of a household’s financial life—accounts with at least five checking account outflows each month between July 2016 and November 2017, as well as a checking account balance record with Chase during every day of this period. With data through November, we are able to observe financial outcomes for 12 weeks after the week of Hurricane Harvey and 10 weeks after the week of landfall for Hurricane Irma.
While our samples include 487,455 residents in Houston and 369,116 residents in Miami, their demographic attributes differ slightly from the general population. In comparison to the 2016 American Community Survey (ACS), our Houston sample is similar in terms of age (44.6 in JPMCI sample vs 44.5 in ACS) but our Miami sample is slightly younger (46.2 in JPMCI sample vs 48.7 in ACS). In terms of percent of female, our samples have lower percent of female (42 percent in Houston and 44 percent in Miami) than 2016 ACS (51 percent in Houston and 52 percent in Miami). In terms of average expenditure, our samples have higher average annual expenditure than the 2015-2016 Consumer Expenditure Survey (21 percent higher in Houston and 12 percent in Miami).
We aggregate all deposit and credit card transactions of core Chase checking account customers by day and examine changes in patterns of inflows, including labor income, government income, and transfers and other inflows; outflows, including categorized spending, bill and debt payments, and other outflows; and checking account balances 7 weeks leading up to and 12 weeks after the hurricanes. Given cyclical patterns in inflows and outflows, this daily picture is extremely noisy, making it difficult to clearly detect the impacts of the hurricane (Figure 15). That said, there are clear breaks from the regular cyclical pattern during the hurricanes even in the raw, unadjusted data.
Figure 15: Time series of raw daily outflows and inflows for Houston and Miami.
22
WEATHERING THE STORM: THE FINANCIAL IMPACTS OF HURRICANES HARVEY AND IRMA ON ONE MILLION HOUSEHOLDSData Asset
22
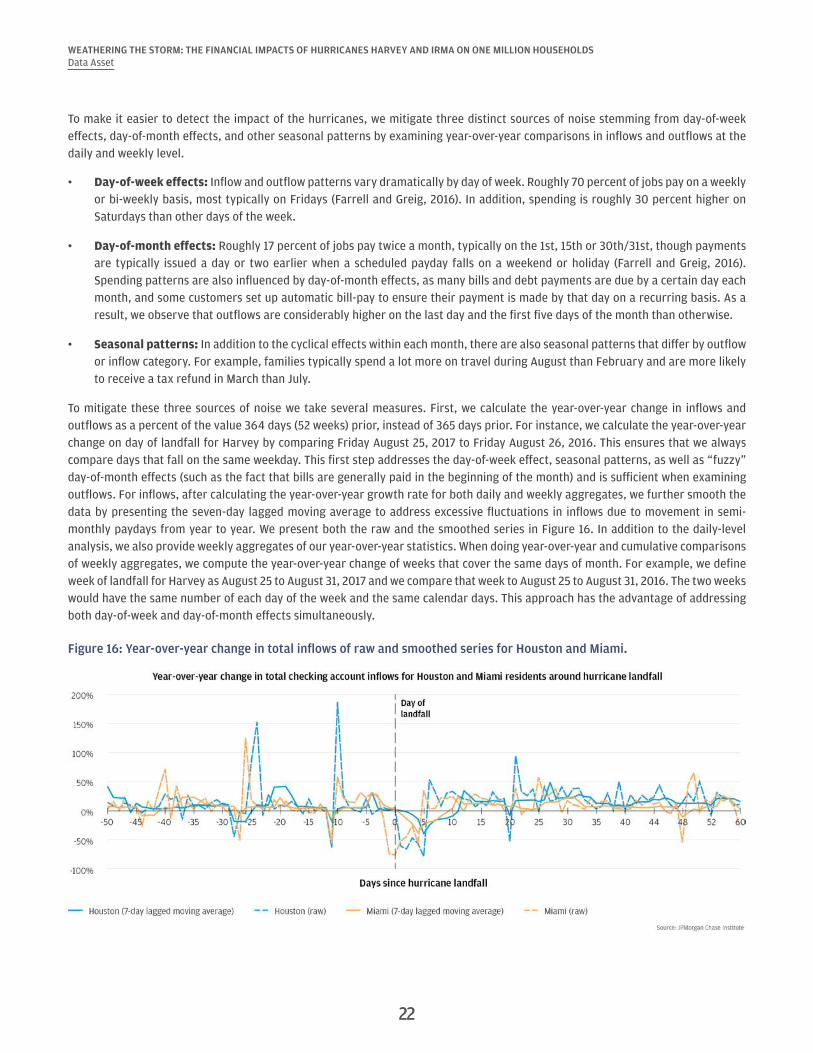
To make it easier to detect the impact of the hurricanes, we mitigate three distinct sources of noise stemming from day-of-week effects, day-of-month effects, and other seasonal patterns by examining year-over-year comparisons in inflows and outflows at the daily and weekly level.
• Day-of-week effects: Inflow and outflow patterns vary dramatically by day of week. Roughly 70 percent of jobs pay on a weekly or bi-weekly basis, most typically on Fridays (Farrell and Greig, 2016). In addition, spending is roughly 30 percent higher on Saturdays than other days of the week.
• Day-of-month effects: Roughly 17 percent of jobs pay twice a month, typically on the 1st, 15th or 30th/31st, though payments are typically issued a day or two earlier when a scheduled payday falls on a weekend or holiday (Farrell and Greig, 2016). Spending patterns are also influenced by day-of-month effects, as many bills and debt payments are due by a certain day each month, and some customers set up automatic bill-pay to ensure their payment is made by that day on a recurring basis. As a result, we observe that outflows are considerably higher on the last day and the first five days of the month than otherwise.
• Seasonal patterns: In addition to the cyclical effects within each month, there are also seasonal patterns that differ by outflow or inflow category. For example, families typically spend a lot more on travel during August than February and are more likely to receive a tax refund in March than July.
To mitigate these three sources of noise we take several measures. First, we calculate the year-over-year change in inflows and outflows as a percent of the value 364 days (52 weeks) prior, instead of 365 days prior. For instance, we calculate the year-over-year change on day of landfall for Harvey by comparing Friday August 25, 2017 to Friday August 26, 2016. This ensures that we always compare days that fall on the same weekday. This first step addresses the day-of-week effect, seasonal patterns, as well as “fuzzy” day-of-month effects (such as the fact that bills are generally paid in the beginning of the month) and is sufficient when examining outflows. For inflows, after calculating the year-over-year growth rate for both daily and weekly aggregates, we further smooth the data by presenting the seven-day lagged moving average to address excessive fluctuations in inflows due to movement in semi-monthly paydays from year to year. We present both the raw and the smoothed series in Figure 16. In addition to the daily-level analysis, we also provide weekly aggregates of our year-over-year statistics. When doing year-over-year and cumulative comparisons of weekly aggregates, we compute the year-over-year change of weeks that cover the same days of month. For example, we define week of landfall for Harvey as August 25 to August 31, 2017 and we compare that week to August 25 to August 31, 2016. The two weeks would have the same number of each day of the week and the same calendar days. This approach has the advantage of addressing both day-of-week and day-of-month effects simultaneously.
Figure 16: Year-over-year change in total inflows of raw and smoothed series for Houston and Miami.
23
WEATHERING THE STORM: THE FINANCIAL IMPACTS OF HURRICANES HARVEY AND IRMA ON ONE MILLION HOUSEHOLDSData Asset
23
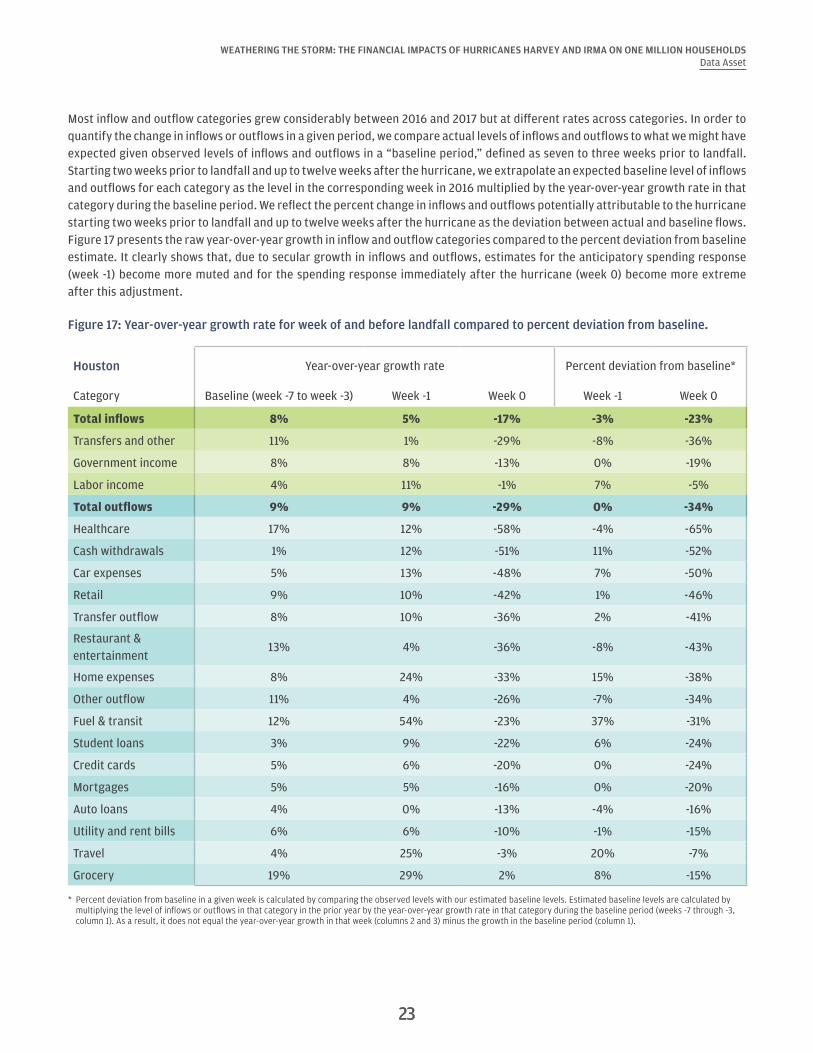
Most inflow and outflow categories grew considerably between 2016 and 2017 but at different rates across categories. In order to quantify the change in inflows or outflows in a given period, we compare actual levels of inflows and outflows to what we might have expected given observed levels of inflows and outflows in a “baseline period,” defined as seven to three weeks prior to landfall. Starting two weeks prior to landfall and up to twelve weeks after the hurricane, we extrapolate an expected baseline level of inflows and outflows for each category as the level in the corresponding week in 2016 multiplied by the year-over-year growth rate in that category during the baseline period. We reflect the percent change in inflows and outflows potentially attributable to the hurricane starting two weeks prior to landfall and up to twelve weeks after the hurricane as the deviation between actual and baseline flows. Figure 17 presents the raw year-over-year growth in inflow and outflow categories compared to the percent deviation from baseline estimate. It clearly shows that, due to secular growth in inflows and outflows, estimates for the anticipatory spending response (week -1) become more muted and for the spending response immediately after the hurricane (week 0) become more extreme after this adjustment.
Figure 17: Year-over-year growth rate for week of and before landfall compared to percent deviation from baseline.
Houston Year-over-year growth rate Percent deviation from baseline*
Category Baseline (week -7 to week -3) Week -1 Week 0 Week -1 Week 0
Total inflows 8% 5% -17% -3% -23%
Transfers and other 11% 1% -29% -8% -36%
Government income 8% 8% -13% 0% -19%
Labor income 4% 11% -1% 7% -5%
Total outflows 9% 9% -29% 0% -34%
Healthcare 17% 12% -58% -4% -65%
Cash withdrawals 1% 12% -51% 11% -52%
Car expenses 5% 13% -48% 7% -50%
Retail 9% 10% -42% 1% -46%
Transfer outflow 8% 10% -36% 2% -41%
Restaurant & entertainment
13% 4% -36% -8% -43%
Home expenses 8% 24% -33% 15% -38%
Other outflow 11% 4% -26% -7% -34%
Fuel & transit 12% 54% -23% 37% -31%
Student loans 3% 9% -22% 6% -24%
Credit cards 5% 6% -20% 0% -24%
Mortgages 5% 5% -16% 0% -20%
Auto loans 4% 0% -13% -4% -16%
Utility and rent bills 6% 6% -10% -1% -15%
Travel 4% 25% -3% 20% -7%
Grocery 19% 29% 2% 8% -15%
* Percent deviation from baseline in a given week is calculated by comparing the observed levels with our estimated baseline levels. Estimated baseline levels are calculated by multiplying the level of inflows or outflows in that category in the prior year by the year-over-year growth rate in that category during the baseline period (weeks -7 through -3, column 1). As a result, it does not equal the year-over-year growth in that week (columns 2 and 3) minus the growth in the baseline period (column 1).
24
WEATHERING THE STORM: THE FINANCIAL IMPACTS OF HURRICANES HARVEY AND IRMA ON ONE MILLION HOUSEHOLDSData Asset
24
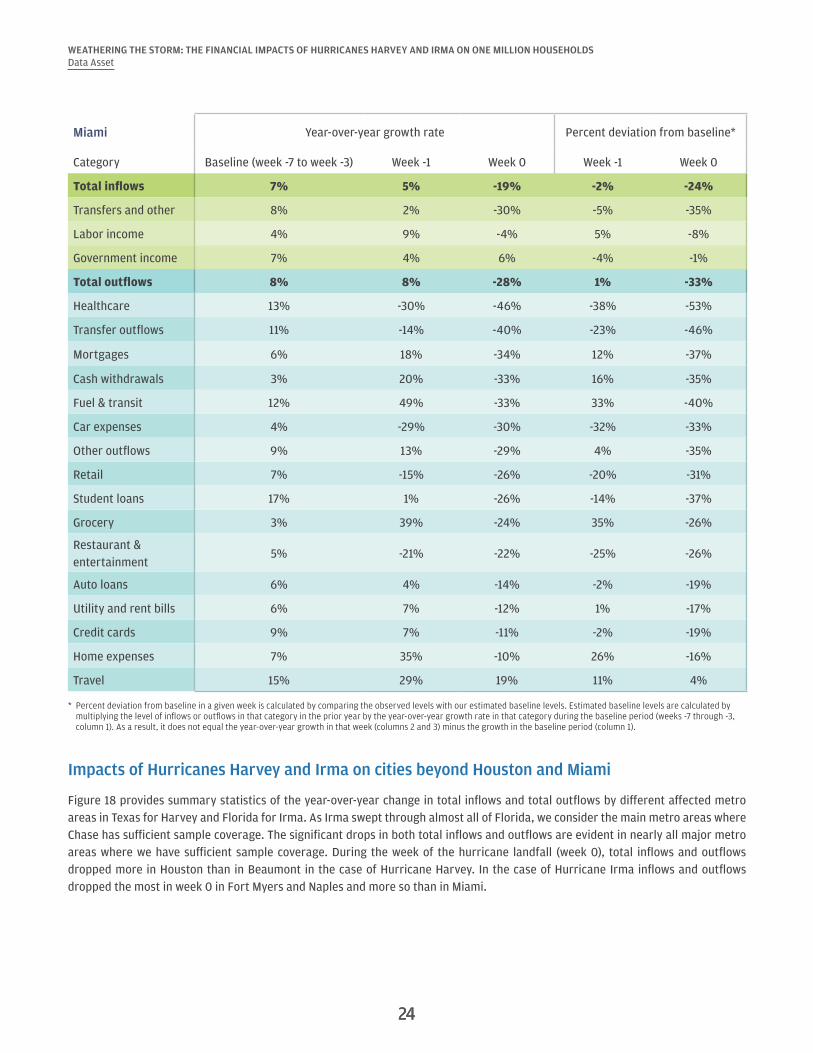
Miami Year-over-year growth rate Percent deviation from baseline*
Category Baseline (week -7 to week -3) Week -1 Week 0 Week -1 Week 0
Total inflows 7% 5% -19% -2% -24%
Transfers and other 8% 2% -30% -5% -35%
Labor income 4% 9% -4% 5% -8%
Government income 7% 4% 6% -4% -1%
Total outflows 8% 8% -28% 1% -33%
Healthcare 13% -30% -46% -38% -53%
Transfer outflows 11% -14% -40% -23% -46%
Mortgages 6% 18% -34% 12% -37%
Cash withdrawals 3% 20% -33% 16% -35%
Fuel & transit 12% 49% -33% 33% -40%
Car expenses 4% -29% -30% -32% -33%
Other outflows 9% 13% -29% 4% -35%
Retail 7% -15% -26% -20% -31%
Student loans 17% 1% -26% -14% -37%
Grocery 3% 39% -24% 35% -26%
Restaurant & entertainment
5% -21% -22% -25% -26%
Auto loans 6% 4% -14% -2% -19%
Utility and rent bills 6% 7% -12% 1% -17%
Credit cards 9% 7% -11% -2% -19%
Home expenses 7% 35% -10% 26% -16%
Travel 15% 29% 19% 11% 4%
* Percent deviation from baseline in a given week is calculated by comparing the observed levels with our estimated baseline levels. Estimated baseline levels are calculated by multiplying the level of inflows or outflows in that category in the prior year by the year-over-year growth rate in that category during the baseline period (weeks -7 through -3, column 1). As a result, it does not equal the year-over-year growth in that week (columns 2 and 3) minus the growth in the baseline period (column 1).
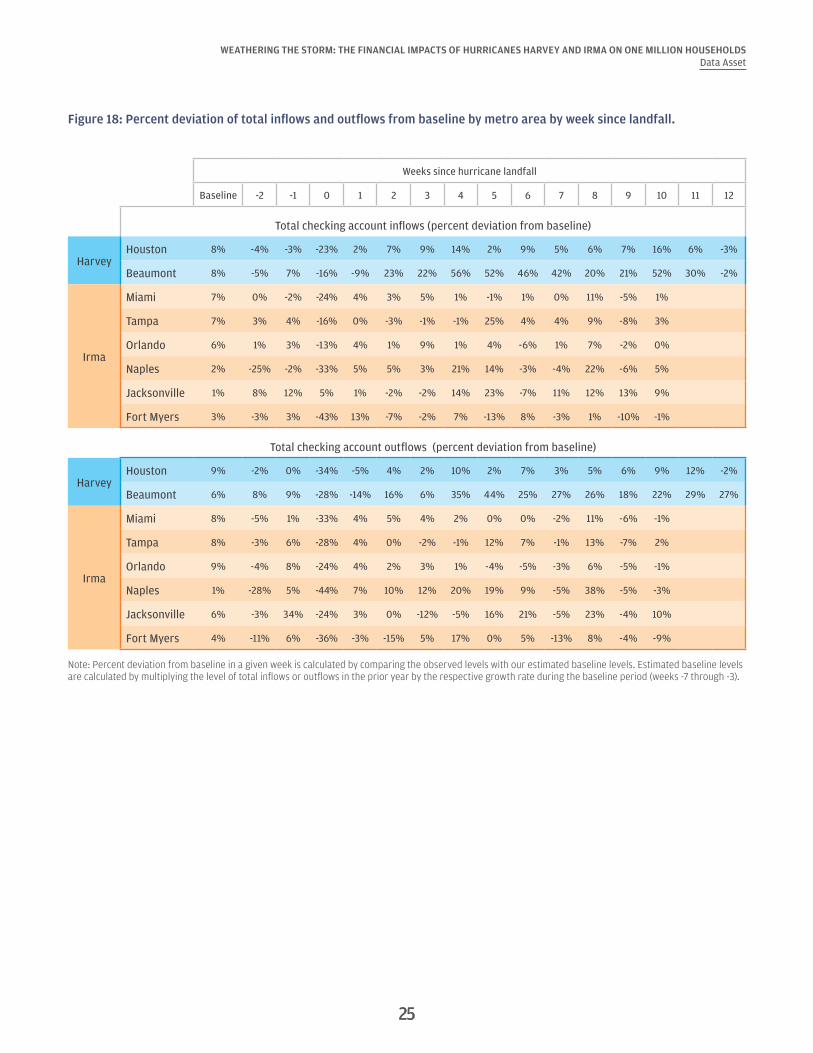
Impacts of Hurricanes Harvey and Irma on cities beyond Houston and Miami
Figure 18 provides summary statistics of the year-over-year change in total inflows and total outflows by different affected metro areas in Texas for Harvey and Florida for Irma. As Irma swept through almost all of Florida, we consider the main metro areas where Chase has sufficient sample coverage. The significant drops in both total inflows and outflows are evident in nearly all major metro areas where we have sufficient sample coverage. During the week of the hurricane landfall (week 0), total inflows and outflows dropped more in Houston than in Beaumont in the case of Hurricane Harvey. In the case of Hurricane Irma inflows and outflows dropped the most in week 0 in Fort Myers and Naples and more so than in Miami.
25
WEATHERING THE STORM: THE FINANCIAL IMPACTS OF HURRICANES HARVEY AND IRMA ON ONE MILLION HOUSEHOLDSData Asset
25
Figure 18: Percent deviation of total inflows and outflows from baseline by metro area by week since landfall.
Weeks since hurricane landfall
Baseline -2 -1 0 1 2 3 4 5 6 7 8 9 10 11 12
Total checking account inflows (percent deviation from baseline)
HarveyHouston 8% -4% -3% -23% 2% 7% 9% 14% 2% 9% 5% 6% 7% 16% 6% -3%
Beaumont 8% -5% 7% -16% -9% 23% 22% 56% 52% 46% 42% 20% 21% 52% 30% -2%
Irma
Miami 7% 0% -2% -24% 4% 3% 5% 1% -1% 1% 0% 11% -5% 1%
Tampa 7% 3% 4% -16% 0% -3% -1% -1% 25% 4% 4% 9% -8% 3%
Orlando 6% 1% 3% -13% 4% 1% 9% 1% 4% -6% 1% 7% -2% 0%
Naples 2% -25% -2% -33% 5% 5% 3% 21% 14% -3% -4% 22% -6% 5%
Jacksonville 1% 8% 12% 5% 1% -2% -2% 14% 23% -7% 11% 12% 13% 9%
Fort Myers 3% -3% 3% -43% 13% -7% -2% 7% -13% 8% -3% 1% -10% -1%
Total checking account outflows (percent deviation from baseline)
HarveyHouston 9% -2% 0% -34% -5% 4% 2% 10% 2% 7% 3% 5% 6% 9% 12% -2%
Beaumont 6% 8% 9% -28% -14% 16% 6% 35% 44% 25% 27% 26% 18% 22% 29% 27%
Irma
Miami 8% -5% 1% -33% 4% 5% 4% 2% 0% 0% -2% 11% -6% -1%
Tampa 8% -3% 6% -28% 4% 0% -2% -1% 12% 7% -1% 13% -7% 2%
Orlando 9% -4% 8% -24% 4% 2% 3% 1% -4% -5% -3% 6% -5% -1%
Naples 1% -28% 5% -44% 7% 10% 12% 20% 19% 9% -5% 38% -5% -3%
Jacksonville 6% -3% 34% -24% 3% 0% -12% -5% 16% 21% -5% 23% -4% 10%
Fort Myers 4% -11% 6% -36% -3% -15% 5% 17% 0% 5% -13% 8% -4% -9%
Note: Percent deviation from baseline in a given week is calculated by comparing the observed levels with our estimated baseline levels. Estimated baseline levels are calculated by multiplying the level of total inflows or outflows in the prior year by the respective growth rate during the baseline period (weeks -7 through -3).

26
References
Abramson, David, and Richard Garfield. “On the Edge: Children and Families Displaced by Hurricanes Katrina and Rita Face a Looming Medical and Mental Health Crisis.” New York: Mailman School of Public Health, Columbia University. 2006.
The City of New York. “PlaNYC: A Stronger, More Resilient New York.” 2013. City of New York. http://www.nyc.gov/html/sirr/html/report/report.shtml
Corelogic. “CoreLogic Analysis Estimates Total Residential Insured and Uninsured Flood Loss for Hurricane Harvey Between $25 Billion and $37 Billion — Approximately 70 Percent of Flood Damage is Uninsured.” 2017a. http://www.corelogic.com/about-us/news/media-advisory-corelogic-analysis-estimates-total-residential-insured-and-uninsured-flood-loss-for-hurricane-harvey-between-$25.aspx
Corelogic. “CoreLogic Analysis Estimates Property Damage from Hurricane Irma Between $42.5 Billion and $65 Billion.” 2017b. http://www.corelogic.com/about-us/news/media-advisory-corelogic-analysis-estimates-property-damage-from-hurricane-irma-between-$42.5-billion-and-$65-billion.aspx
Farrell, Diana, Fiona Greig, and Amar Hamoudi. "Deferred Care: How Tax Refunds Enable Healthcare Spending." JPMorgan Chase Institute, 2018.
Farrell, Diana and Fiona Greig. “Paychecks, Paydays, and the Online Platform Economy.” JPMorgan Chase Institute, 2016.
Federal Housing Finance Agency. “Help For Homeowners Affected by Hurricanes.” 2017. https://www.fhfa.gov/Homeownersbuyer/MortgageAssistance/Documents/Hurricane_Relief_Flyer.pdf
Federal Emergency Management Agency. "Texas Hurricane Harvey (DR-4332)." 2017a. https://www.fema.gov/disaster/4332
Federal Emergency Management Agency. "Florida Hurricane Irma (DR-4337)." 2017b. https://www.fema.gov/disaster/4337
Florida Division of Emergency Management. “Gov. Scott Issues Updates on Hurricane Irma Preparedness –Evening September 9, 2017.” 2017. http://www.floridadisaster.org/archive_news/archive_news.htm
Gallagher, J., and Hartley, D., "Household finance after a natural disaster: The case of Hurricane Katrina." American Economic Journal: Economic Policy, 9(3), 199-228. 2017.
Kousky, Carolyn. “Informing Climate Adaptation: A Review of the Economic Costs of Natural Disasters.” Energy Economics 46: 576-592. 2014.
National Weather Service. "Detailed Meteorological Summary on Hurricane Irma." 2017a. https://www.weather.gov/tae/Irma_technical_summary
National Weather Service. "Major Hurricane Harvey - August 25-29, 2017." 2017b. http://www.weather.gov/crp/hurricane_harvey
NOAA National Centers for Environmental Information (NCEI). “U.S. Billion-Dollar Weather and Climate Disasters.” 2017. https://www.ncdc.noaa.gov/billions/
Segal, Andrew. “ITG Survey: Only one in 10 drivers have GAP insurance.” InsuretheGap. 2017. https://www.insurethegap.com/articles/only-one-in-10-drivers-have-gap-insurance
Steven Ruggles, Katie Genadek, Ronald Goeken, Josiah Grover, and Matthew Sobek. Integrated Public Use Microdata Series: Version 7.0 [dataset]. Minneapolis, MN: University of Minnesota. 2017. https://doi.org/10.18128/D010.V7.0
Technical Mapping Advisory Council. “Technical Mapping Advisory Council 2016 Annual Report.” 2016. https://www.fema.gov/media-library-data/1492803841077-57e4653a1b2de856e14672e56d6f0e64/TMAC_2016_Annual_Report_%28508%29.pdf
Tran, Brigitte Roth, and Tamara L. Sheldon. “Same storm, different disasters: Consumer credit access, income inequality, and natural disaster recovery.” 2017.
The Weather Prediction Center. “Storm summary number 20 for tropical depression Harvey preliminary rainfall totals and wind reports.” 2017. http://www.wpc.ncep.noaa.gov/discussions/nfdscc1.html
U.S. Department of Labor, Bureau of Labor Statistics. Consumer Expenditure Survey. "Table 3024. Selected southern metropolitan statistical areas: Average annual expenditures and characteristics, Consumer Expenditure Survey, 2015-2016." 2017. https://www.bls.gov/cex/2016/msas/south.pdf
Zinman, Jonathan. Household Debt: Facts, Puzzles, Theories, and Policies, Annual Review of Economics vol. 7, 251-76. 2015.
27
Endnotes
1 Total change in inflows is calculated as the sum of the changes across all inflow sub-categories. This calculation results in an estimate ($756) that is slightly higher than the dollar change in total inflows from baseline ($731), as a result of each sub-component's different year-over-year growth rate in the baseline period.
2 If the source or type of an inflow is not identified, the inflow would be labeled as uncategorized and hence included in “transfers and other inflows.”
3 For each weekt we calculate the sum of the spending in 2017 from week-2 through weekt and divide that sum by the expected spending over that period, which equates to the sum of the spending in 2016 from week-2 through weekt multiplied by the year-over-year percent change in spending during the baseline period (week-7 through week-3).
4 Included within total outflows but not reflected in Figure 8 are cash withdrawals, transfers, and other miscellaneous outflows which, after eight weeks, were cumulatively 5 percent higher, 1 percent lower, and the same compared to baseline respectively.
5 Since we are aggregating payments across debt and bill categories, it is worth noting that individuals who have multiple loans or bills within a certain category may have appeared to have dropped the payment amount if they did not make payments across all debts due within a category. This is more likely to be the case for utility and rent bills, which aggregates several types of bills including cell phones, cable, electricity, water, and rent.
6 The volatility of weekly debt and bill payments during week -2 and -1 are due to payment schedules for debt and bills. Debt and bill payments tend to occur more frequently on weekdays and beginning and end of months. In 2017, week -2 relative to Irma landfall includes August 27, 2017 (Saturday) to September 2, 2017 (Sunday). Both September 1 and 2 (days with more frequent debt and bill payments) are weekdays in 2016 but partially fell on a weekend in 2017. However, the cumulative view 10 weeks out should aggregate across such weekly volatility due to payment schedules.
7 While the prevalence of gap insurance on auto loans and leases is relatively low (Segal, 2017), flood insurance is much more common and is in fact required by FHA mortgages on homes within the 100-year flood plain. In fact, Corelogic estimated that roughly 80 percent of residential properties damaged by Hurricane Harvey were covered by flood insurance (Corelogic, 2017a). Gallagher and Hartley (2017) provide evidence that after Katrina, some families did use insurance payouts to pre-pay their mortgage, resulting in lower mortgage debt.
8 In order to ensure that the aggregate growth in checking account balances did not reflect the experience of certain segments of the population, we also examine the median within-family change in checking account balances among Houston and Miami residents. This allows us to capture the median change in checking account balances within a family from one year to the next. Among both Houston and Miami residents, checking account balances were roughly 10 percent higher after the hurricane compared to the year prior.
9 Increase in inflows contributes positively to checking account balances, while increases in outflows contribute negatively to checking account balances. Subtracting the cumulative increase in outflows ($236) from the cumulative increase in inflows ($756) does not equal the change in checking account balances ($668) because of several factors: First, the cumulative changes in inflows and outflows are each estimated separately off of their respective baseline level growth rates. Second, outflows and inflows are based on transaction date, while checking account balance is calculated based on transaction posting dates. For analysis related to flows (i.e. inflows and outflows), we use transaction dates, when transactions actually happen. For analysis related to balances, we use posting dates, when transactions are posted to accounts. Posting dates tend to be a few days later than transaction dates. Third, payments for Chase credit card balances are excluded from outflows to avoid double counting credit card spending. Credit cards spending during a month are only reflected in checking account balances when credit card balances are paid.
10 The $301 increase in spending reflects $109 more on home expenses, $87 more on retail, $37 more on fuel and transit, $34 more on car expenses, $25 more on restaurant and entertainment, $11 more on groceries, and $9 more on travel, offset by a decrease of $11 in healthcare spending. The $180 increase in other outflows includes a $120 increase in cash withdrawals, a $38 increase in transfers and a $22 increase in other outlays.
11 The $245 drop in bill and debt payments reflects a $123 drop in mortgage payments, a $49 drop in utility and rent bills, a $38 drop in auto loan payments, a $26 drop in credit card payments, and a $9 drop in student loan payments.
12 Previous academic literature has documented more broadly that households tend to simultaneously hold cash and credit card debt (e.g. Zinman, 2015).
13 The $149 decrease in inflows includes $195 lower transfers and other inflows and $21 lower government income, offset by $67 higher in labor income. The $33 increase in spending reflects $16 more on home expenses, $13 more on retail, $13 more on fuel and transit, $7 more on car expenses, $5 more on travel, offset by $5 less on healthcare, $4 less on restaurant and entertainment, and $12 less on grocery. The $191 decrease in total other outflows includes $36 lower cash withdrawals and $341 lower transfers, offset by $186 higher other outlays. The $179 decrease in debt and bill payments reflects $6 lower payments for utility and rent bills, $15 lower for student loans, $24 lower for credit cards, $113 lower for mortgages, and $20 lower for auto loans.
Suggested Citation
Farrell, Diana and Fiona Greig. 2018. "Weathering the Storm: The Financial Impacts of Hurricanes Harvey and Irma on One Million Households" JPMorgan Chase Institute.
Acknowledgments
We thank our research analyst, Chenxi Yu, for her hard work and contributions to this research.
This effort would not have been possible without the critical support of the JPMorgan Chase Intelligent Solutions team of data experts, including Brent Warshaw, Gaby Marano, Stella Ng, Steve Farrell, Michael Harasimowicz, and Bill Bowlsbey, and JPMorgan Chase Institute team members including Amar Hamoudi, Christopher Wheat, Beatriz Rache, Marvin Ward, Robert McDowall, Carlos Grandet, Natalie Holmes, Sruthi Rao, Alyssa Flaschner, Jolie Spiegelman, Caitlin Legacki, Courtney Hacker, Kelly Benoit, and Gena Stern.
We are also grateful for the invaluable inputs of academic and policy experts, including Carolyn Kousky and Katherine Greig from the Wharton Risk Management and Decision Process Center at the University of Pennsylvania and Jonathan Zinman from Dartmouth College. We are deeply grateful for their generosity of time, insight, and support.
We would like to acknowledge Jamie Dimon, CEO of JPMorgan Chase & Co., for his vision and leadership in establishing the Institute and enabling the ongoing research agenda. Along with support from across the Firm—notably from Peter Scher, Len Laufer, Max Neukirchen, Patrik Ringstroem, Joyce Chang, and Judy Miller—the Institute has had the resources and support to pioneer a new approach to contribute to global economic analysis and insight.
This material is a product of JPMorgan Chase Institute and is provided to you solely for general information purposes. Unless otherwise specifically stated, any views or opinions expressed herein are solely those of the authors listed and may differ from the views and opinions expressed by J.P. Morgan Securities LLC (JPMS) Research Department or other departments or divisions of JPMorgan Chase & Co. or its affiliates. This material is not a product of the Research Department of JPMS. Information has been obtained from sources believed to be reliable, but JPMorgan Chase & Co. or its affiliates and/or subsidiaries (collectively J.P. Morgan) do not warrant its completeness or accuracy. Opinions and estimates constitute our judgment as of the date of this material and are subject to change without notice. The data relied on for this report are based on past transactions and may not be indicative of future results. The opinion herein should not be construed as an individual recommendation for any particular client and is not intended as recommendations of particular securities, financial instruments, or strategies for a particular client. This material does not constitute a solicitation or offer in any jurisdiction where such a solicitation is unlawful.
©2018 JPMorgan Chase & Co. All rights reserved. This publication or any portion hereof may not be reprinted, sold, or redistributed without the written consent of J.P. Morgan. www.jpmorganchaseinstitute.com