web analytics - ernetlcm.csa.iisc.ernet.in/indous-symposium/slides/ram_indo_us_web_v1… · web...
TRANSCRIPT

Web Analytics Is Computational Advertising
Statistics or Machine Learning? Static or Dynamic?
Ram Akella
University of California (Berkeley and Santa Cruz)
and Stanford University [email protected], [email protected]
650-279-3078
Indo-US Workshop on Analytics
December 19, 2011

Issues Piece meal use of data
Fragmented Data
No big picture intent or model in mind
No task in mind
Computational Advertising Observation 1
- Area is wide open (despite Google dominance)
- Current models based on A/B testing, which is often wholly inappropriate
=> Static hypothesis testing, for a dynamic situation with massive confounding error possibilities
- Many errors being made by practitioners, even those with PhDs from the major groups/schools
- Bayesian estimation (Kalman filtering) problem, when many other marketing campaigns are the signals that become the noise for the campaign under consideration
Page 3
Computational Advertising: Access to Data Observation 2
- Only way to do this right, given sparse, noisy data, is to use production data
- Research is based on unrestricted access to production and processed data
- Vs sampled data sets (e..g Sponsored search at another firm)
Page 4
Campaign attribution and effectiveness: In search of the gold standard

OR
Attaining Advertiser Nirvana !!!
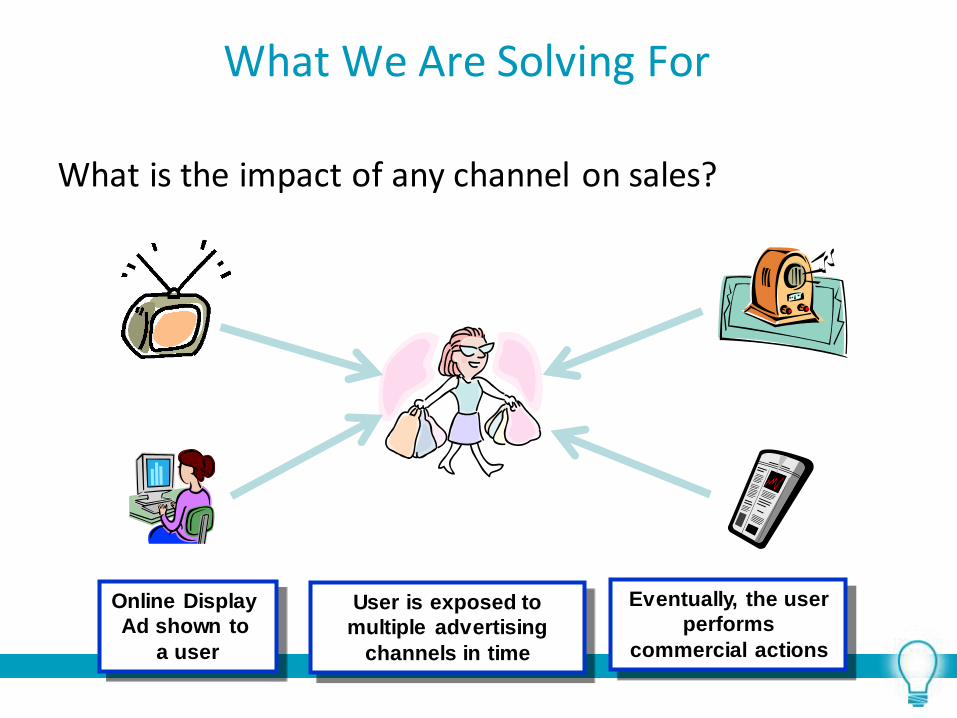
What We Are Solving For
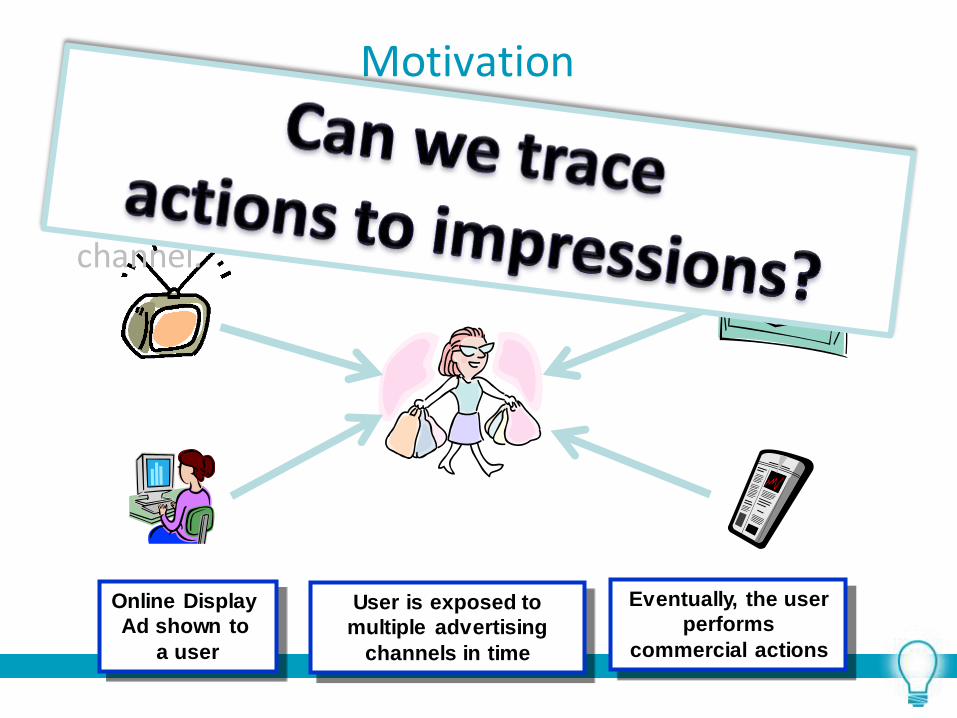
What is the impact of any channel on sales?
Online Display
Ad shown to
a user
User is exposed to
multiple advertising
channels in time
Eventually, the user
performs
commercial actions
Online Display
Ad shown to
a user
User is exposed to
multiple advertising
channels in time
Eventually, the user
performs
commercial actions
Motivation
Online display advertising is an area of rapid growth and consequently of great interest as a marketing channel.
Marketing Executive Need How do I allocate my marketing budget across channels?
• To maximize ROI
Page 9

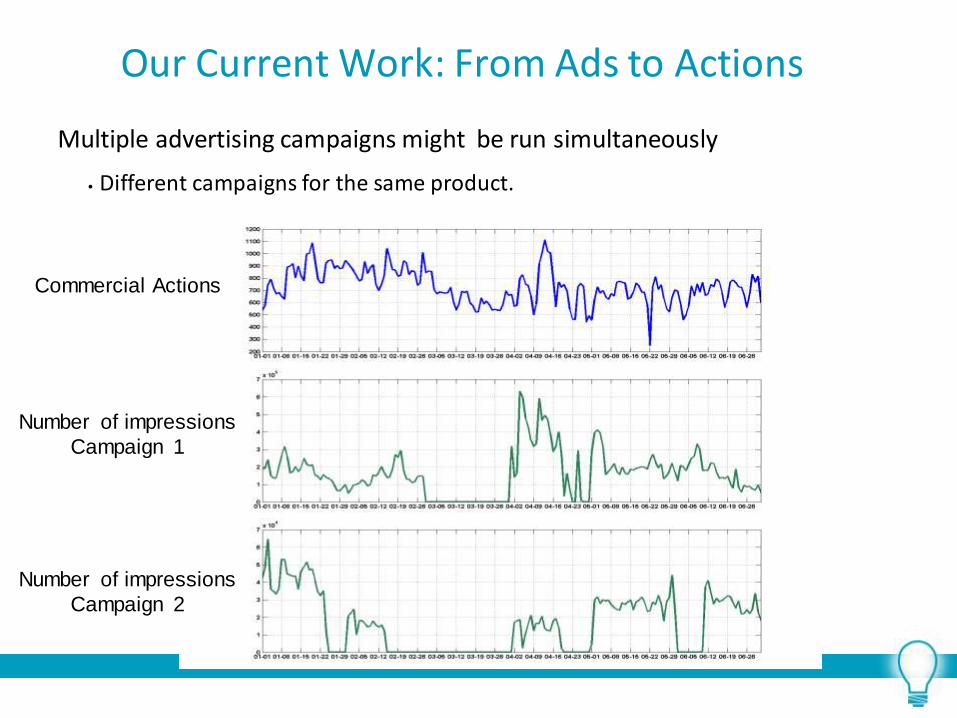
Our Current Work: From Ads to Actions
Multiple advertising campaigns might be run simultaneously
• Different campaigns for the same product.
Number of impressions
Campaign 1
Number of impressions
Campaign 2
Commercial Actions

CHALLENGES
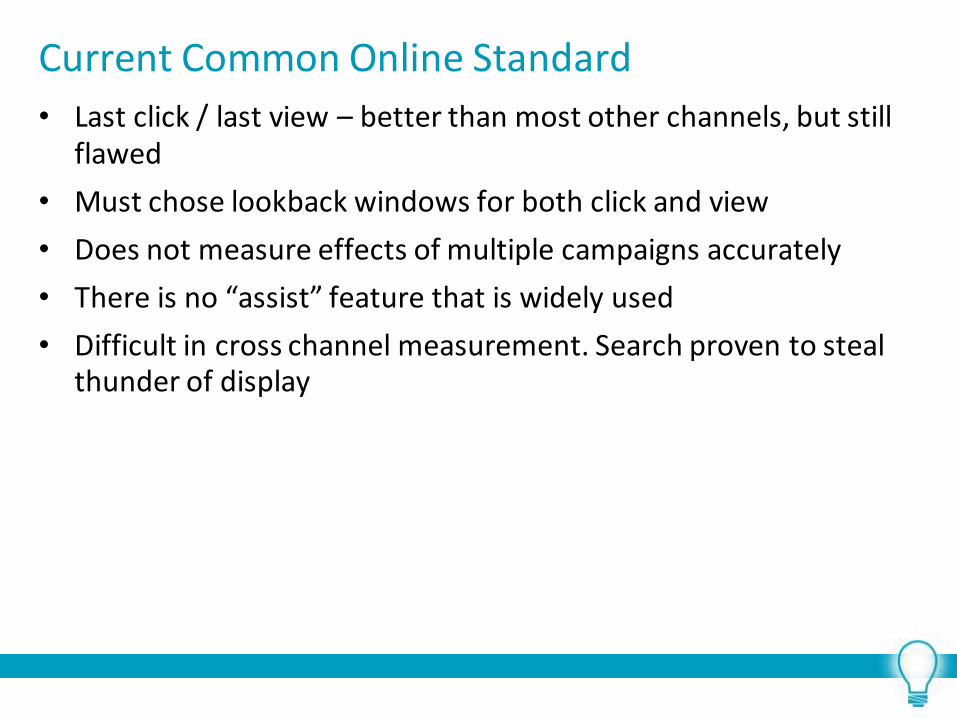
Current Common Online Standard
• Last click / last view – better than most other channels, but still flawed
• Must chose lookback windows for both click and view
• Does not measure effects of multiple campaigns accurately
• There is no “assist” feature that is widely used
• Difficult in cross channel measurement. Search proven to steal thunder of display

Improvement on Current Standard Filled With Flaws
A/B Testing
Key idea of A/B test
• “Randomize” so that two (“statistically”) similar groups can be compared • Expose only one group to ad impression
• Hope: Enough (“statistically significant”) difference in results between groups
Graphics to show two identical groups accept one is
exposed to ads and another is not

A/B Testing Model Actions = Ax Impressions +B+ noise
Y = AX + B + e
X= 0 => No impressions
Page 14

Ideal Outcome
• Those who are exposed to the test group are more likely to convert than those exposed to the test. There is little noise within the data and a strong confidence interval
• Actual sales increase in accordance to results, further increasing legitimacy

Advertising Life in Heavenly Hawaii
Happy ending!!!
A B
x x x x x x
o o o o o o o
o o
o o
x x x x x x
o o
o o

Often Actual Outcome
• Results are very noisy, there is lift and no lift in both segments. Too many factors in creating accurate A/B segments. Data is non-directional
• Data shows lift, yet real life sales do not correspond to data. Brings legitimacy to A/B test into question
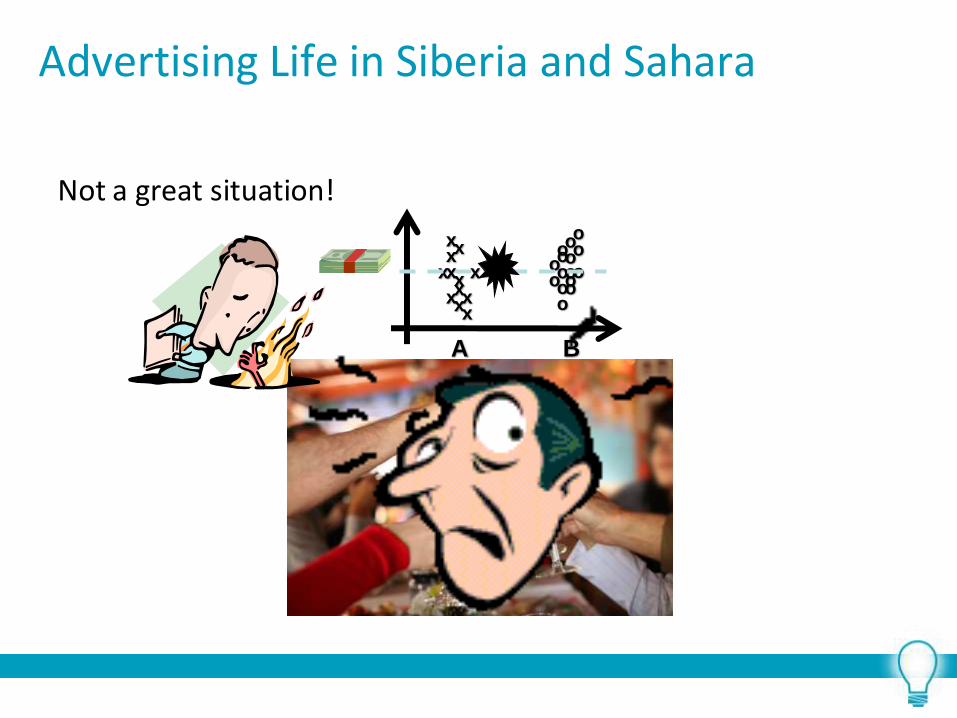
Advertising Life in Siberia and Sahara
Not a great situation!
A B
x x
x
x x x
o o o o o
o
o
o o
o
o x x x x
x x
o o o o
Life in Advertising Siberia Even if A/B testing appears to work…
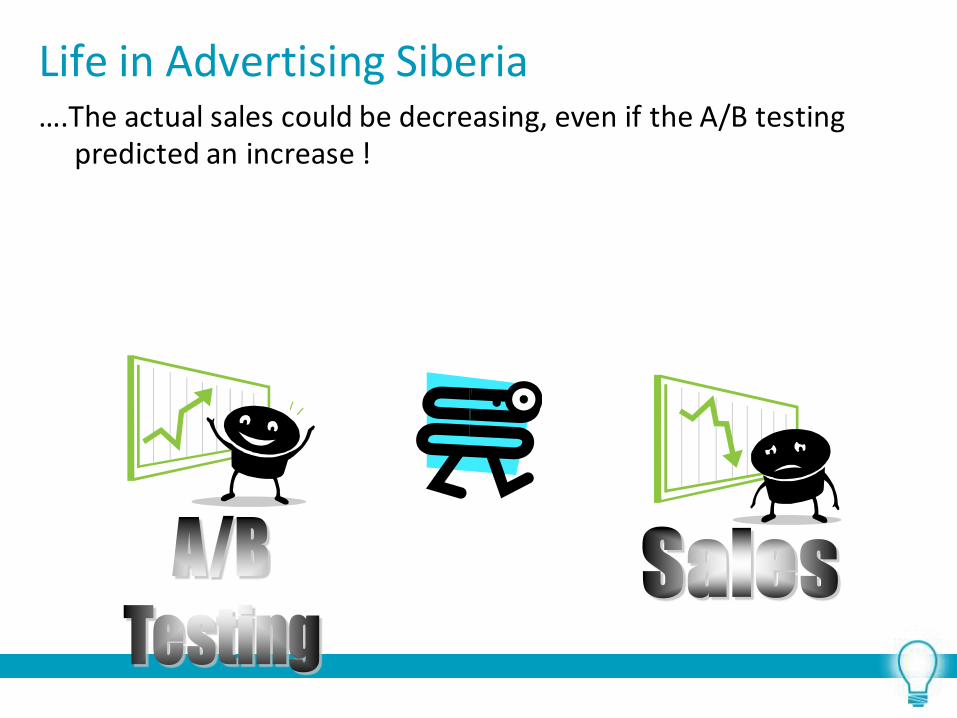
Life in Advertising Siberia ….The actual sales could be decreasing, even if the A/B testing
predicted an increase !

Page 21
Why is Heaven in
Hawaii Denied to Us?
The Path to Hell is Paved with Good Intentions!
“ I do not really think I can afford to reduce advertising effort to potential customers, to measure the impact of the advertising with this wacky A/B testing
• If I do this, am going to “lose” potential revenue!!!
• Vs.
“ Wow, I am glad I used up more opportunity for my control group. I now know where to put my dollars, and which campaigns are duds and a waste on my marketing spend. On my way to Heaven now – Rocket Blasting off!!”

Advertising Hell (Continued) “ Wow, do I really need THAT many customers to get a good
confidence interval? ”
“ You are telling me that all my wasted ad capacity still gives me garbage and no insights?”
“ What do you mean: A/B Testing cannot be done for thousands of campaigns all together? What is the big deal?”

Is there a glimmer of hope to get to Heaven?
“ Lord - Will Petunia save me?” (From Cabin in the Sky)
“ There are these things called Observational Studies”
• Getting valid results from “unplanned campaigns”
• Making these look like randomized studies
What tricks can we use? • Trick 1: “ Matching” – Finding “similar” users in this context
• Trick 2: “ Weighting” each user action (using probability of exposure given user characteristics)
Then, back to old problems! • Selection bias
• Confounding effects all over again
Problems With Current Method
• Randomization and scale are necessary, but very difficult to achieve due to 3 challenges:
• Selection Bias due to targeting
• Confounding Error
• Costs
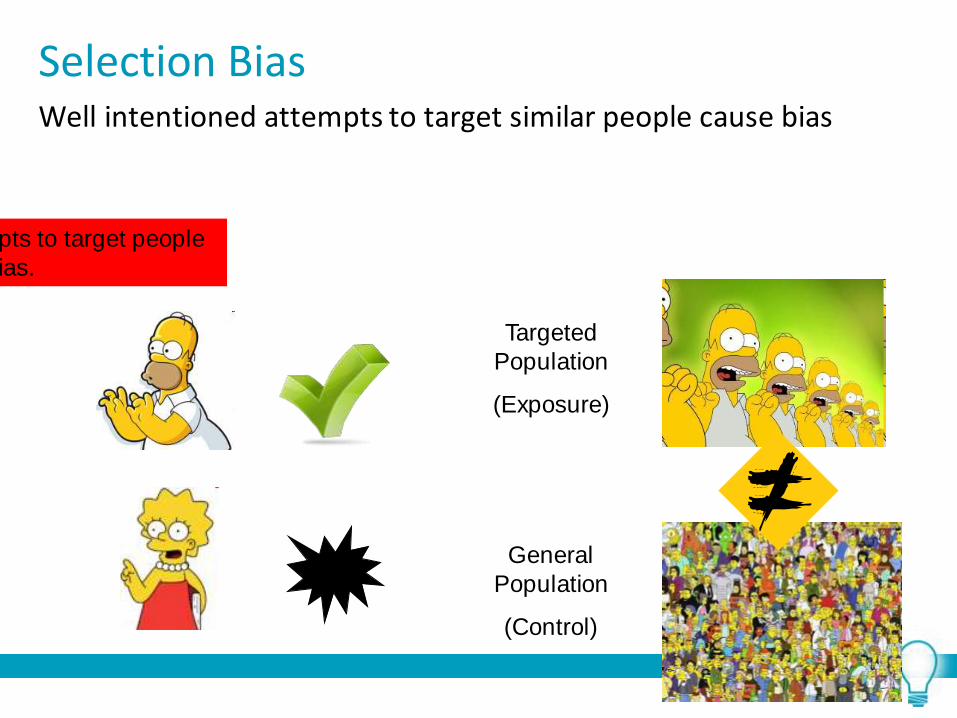
Selection Bias
Targeted
Population
(Exposure)
General
Population
(Control)
Well intentioned attempts to target similar people cause bias
Idea here was to show how attempts to target people
cause selection bias.

Confounding Error
Variables can effect sales that are not accounted for in A/B tests
Y X
D
Demographics
Campaigns
Activity Bias: “Browse
More” segment S
Sales
S

Costs
• In order to develop A/B segments, there most be a control group who sees no ads. Who will pay for these ads? What is the opportunity cost of not serving an actual ad to that users?
• Often tests must be run for a long time due to needed number of conversions
• Costs of testing itself can be very expensive

Overcoming Challenges
Observational Studies
• Getting valid results from unplanned campaigns
• Making these look like randomized studies
What tricks can we use?
• Trick 1: “ Matching” – Finding “similar” users in this context
• Trick 2: “ Weighting” each user action (using probability of exposure given user characteristics)
Setbacks
• Selection bias
• Confounding effects all over again

SOLUTION – AFTER REFRAMING QUESTION
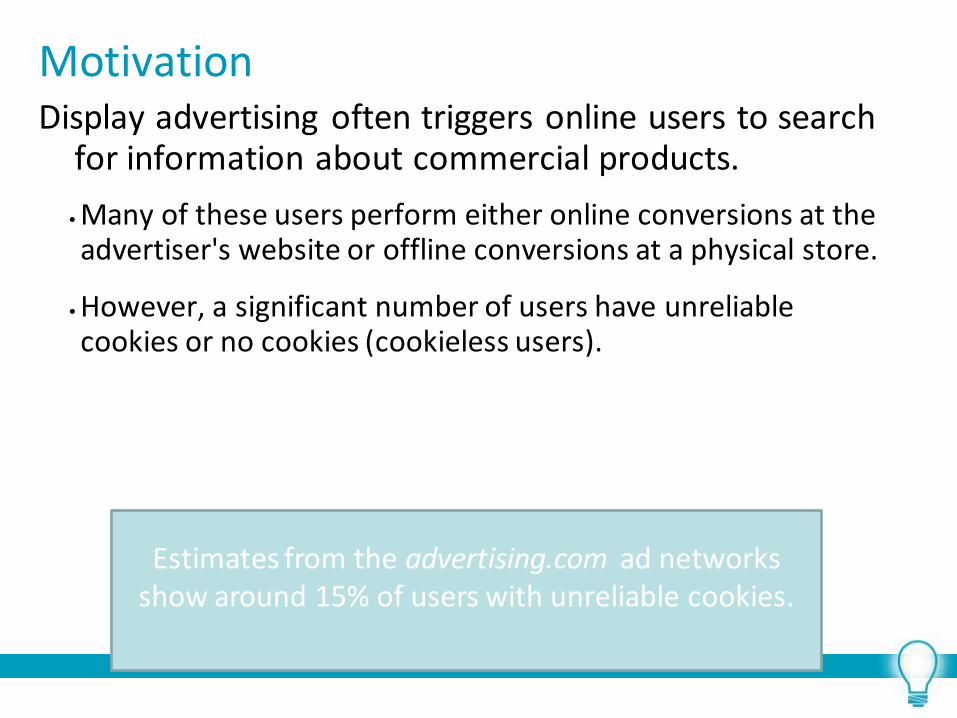
Motivation Display advertising often triggers online users to search
for information about commercial products.
• Many of these users perform either online conversions at the advertiser's website or offline conversions at a physical store.
• However, a significant number of users have unreliable cookies or no cookies (cookieless users).
Estimates from the advertising.com ad networks show around 15% of users with unreliable cookies.

Motivation: CPA model
Ad Network
Advertiser Actions
Delays
Data Collection Changes
User

Motivation: CPA model The Pay-per-Action or Cost-per-Action business model
(CPA) is often used in display advertising when the goal of marketing is to increase commercial actions
• An “action” could range from online orders to email subscriptions
• CPA reduces the risk of click fraud [1]
• CPA is often used by risk-averse companies
Under this model several challenges arise compared to Cost-per-Click model where CTRs are often used as a measure of success.

Motivation: CPA model A key difference in CPA is that commercial actions are
collected by advertisers.
• Several events could happen in the advertiser website that restructure the action collection process
• Restructuring of the website • Merging of products to a single ID • Disaggregation of products to create a new ID
• Three reasons could prevent an advertiser from sharing true action data [1]
• Strategic reasons • Cost of gathering the data • Cost of disclosing data
Motivation: CPA model Another key difference in CPA is timing
• In CPC, assuming a short time (minutes), between the time the impression has been shown and the time it is clicked, is reasonable
• In CPA, it could be several days before a commercial action is performed after showing an impression [1].
The user behavior once he/she goes to the advertiser website is not observed
• A clear connection between an action and impression is not possible
• A user might not even notice an impression which would receive attribution associated with an action, if this is the last impression shown to this user [2]

Problem Description
Our goal is :
To measure the effectiveness in commercial actions of online display advertising when users are exposed to multiple advertising channels which are not traceable.
Problem Definition If a user performs a commercial action, how should the advertiser
assign attribution of credit for the conversion across these multiple channels and media impressions?
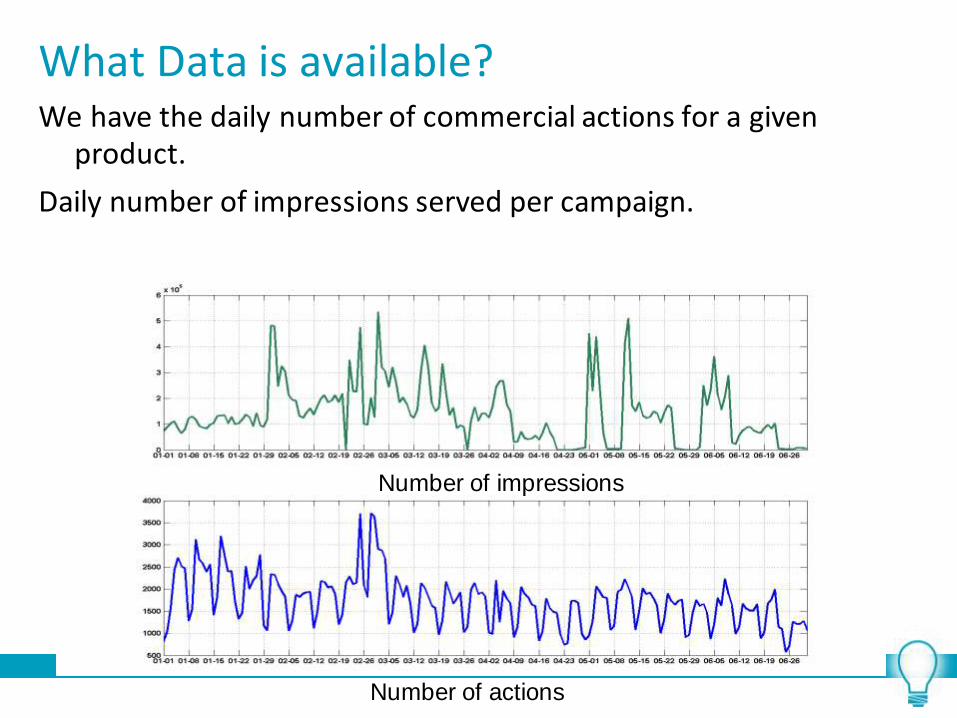
What Data is available? We have the daily number of commercial actions for a given
product.
Daily number of impressions served per campaign.
Number of impressions
Number of actions

What Data is available? Multiple advertising campaigns might be run simultaneously
• Different campaigns with different marketing strategies for the same product
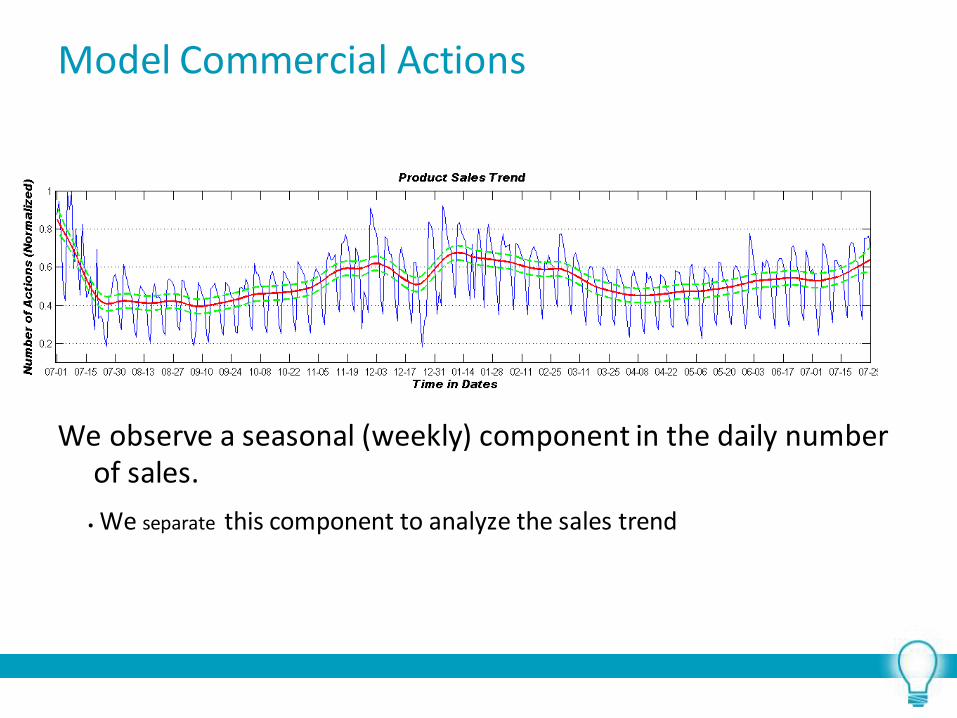
Model Commercial Actions
We observe a seasonal (weekly) component in the daily number of sales.
• We separate this component to analyze the sales trend
Modeling Commercial Actions The number of actions is defined as a stochastic process.
We decompose it into seasonal and polynomial (trend) components.
We use a Dynamic Linear Model (DLM) or state-based (Kalman Filtering) to model the action time series
A “state” is defined for each campaign, with memory to capture the persistence of the impact of ad impression exposures

Model Actions and Impressions
We model the impact of the number of impressions on commercial actions.
• We assume the number of impressions to be as given (our goal is not to model the policy to deliver impressions).
Number of actions Number of impressions

Model Actions and Impressions • We assume a decay factor to model the impact of the effect of impressions
on actions. This factor is learned based on the product
Posterior distribution of the number of days
after the impressions’ impact has reduced to less than 15%.
Campaign effect from the log of the number of impressions used to describe the actions
Model Actions and Impressions The coefficient of the number of impressions for each campaign is
dynamic.
• Multiple campaigns effects are combined linearly and incorporated in a DLM.
We assume a fully Bayesian approach using Gibbs sampling to fit the model based on Kalman filtering and sampling.

Sense-and-Respond: From Ads to Actions • Time Series Model Accounts for Multi Channel Effect
• If you serve 100 million impressions per day and get 100 conversion and one day you serve 100 million impressions and get 150 conversions, 50 of those are most likely due to something else.
• Decay Rate Accounts For Recency • There is a relationship between the recency of an ad exposure and its power to
influence a conversion
• Multi Campaign Model • Relationships exist between multiple campaigns running for the same advertiser
• Dynamic Effect • Accounts for frequency saturation, at a certain point additional impressions have less
value
users Advertisers
Impressions Actions

Instrumentation: From Ads to Actions
Decay Rate Dynamic Effect
Multi Campaign Model Time Series
Model
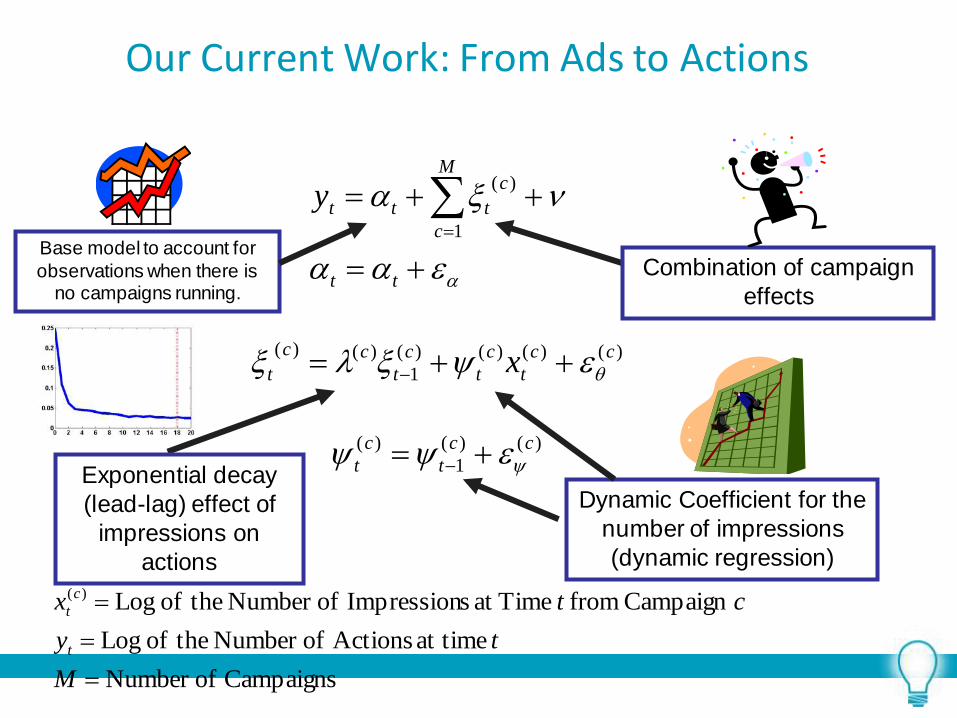
Our Current Work: From Ads to Actions
)()(
1
)(
)()()()(
1
)()(
1
)(
cc
t
c
t
cc
t
c
t
c
t
cc
t
tt
M
c
c
ttt
x
y
Exponential decay
(lead-lag) effect of
impressions on
actions
Dynamic Coefficient for the
number of impressions
(dynamic regression)
Combination of campaign
effects
Base model to account for
observations when there is no campaigns running.
Campaigns ofNumber
at time Actions ofNumber theof Log
Campaign from Timeat sImpression ofNumber theof Log)(
M
ty
ctx
t
c
t
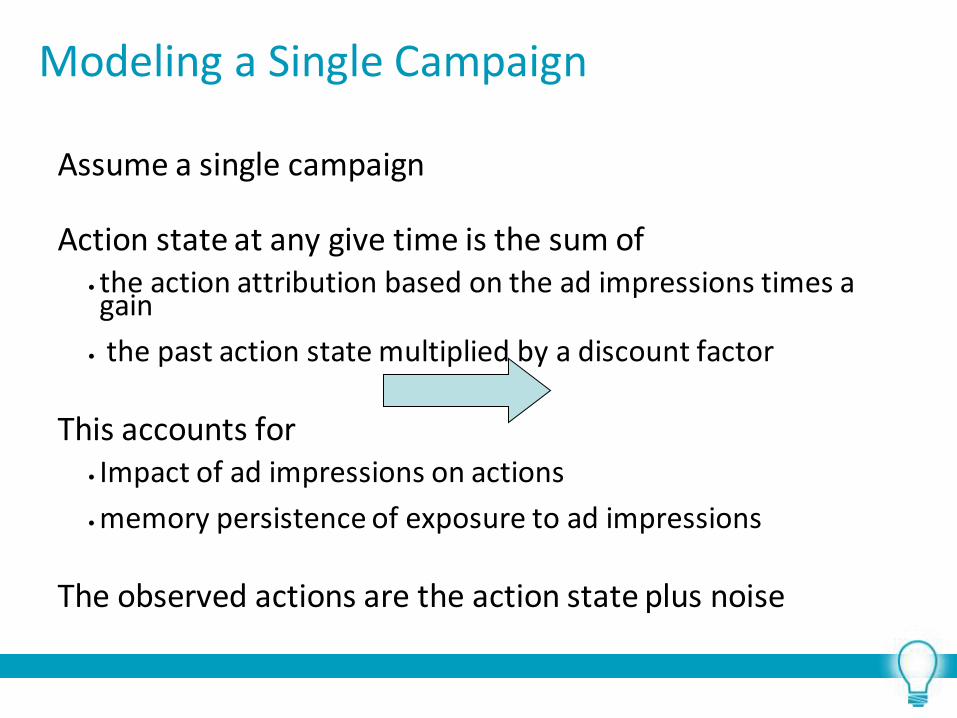
Modeling a Single Campaign
Assume a single campaign Action state at any give time is the sum of
• the action attribution based on the ad impressions times a gain
• the past action state multiplied by a discount factor
This accounts for
• Impact of ad impressions on actions
• memory persistence of exposure to ad impressions
The observed actions are the action state plus noise
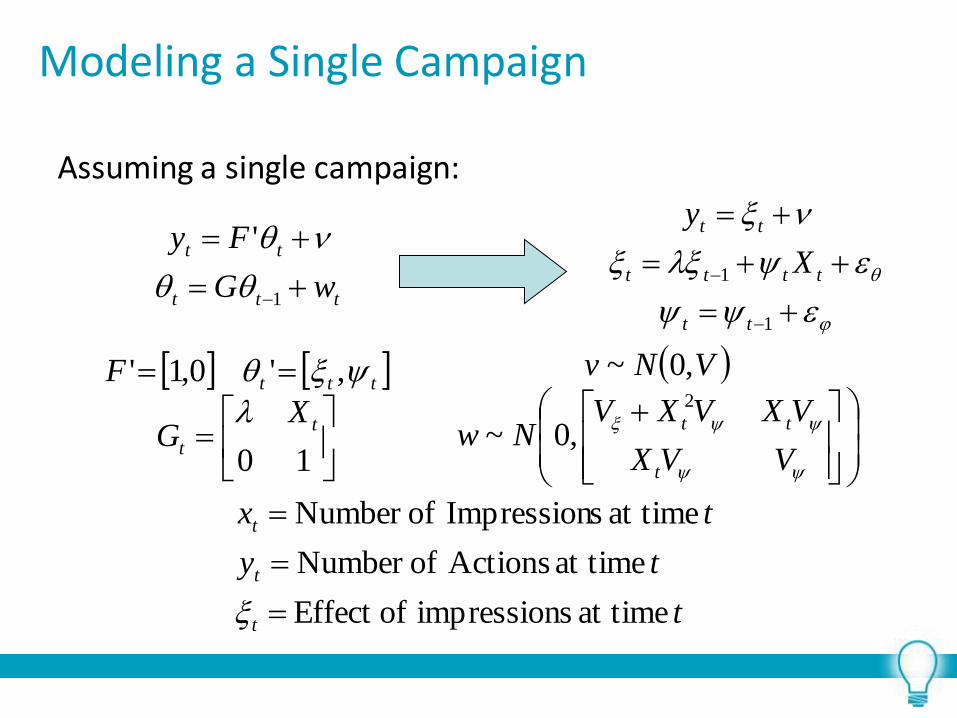
Modeling a Single Campaign
Assuming a single campaign:
ttt
tt
wG
Fy
1
'
VVX
VXVXVNw
VNv
XG
F
t
ttt
t
ttt2
,0~
,0~
10
,'0,1'
1
1
tt
tttt
tt
X
y
t
ty
tx
t
t
t
at time simpression ofEffect
at time Actions ofNumber
at time sImpression ofNumber

Model for Multiple Campaigns Add the action states to create the aggregate or
total number action state This plus noise will give us the observed number of
actions

Model for Multiple Campaigns
ttt
tt
wG
Fy
1
'
10,,
10
,,,,'0,1,,0,1')()()1()1(
)()()1()1()1(
M
t
M
tt
M
t
M
tttt
M
XXblockdiagG
F
)()(
1
)(
)()()()(
1
)()(1
)(
cc
t
c
t
cc
t
c
t
c
t
cc
t
M
c
c
tt
x
y
Campaigns ofNumber
at time Actions ofNumber
Campaign from Timeat sImpression ofNumber )(
M
ty
ctx
t
c
t
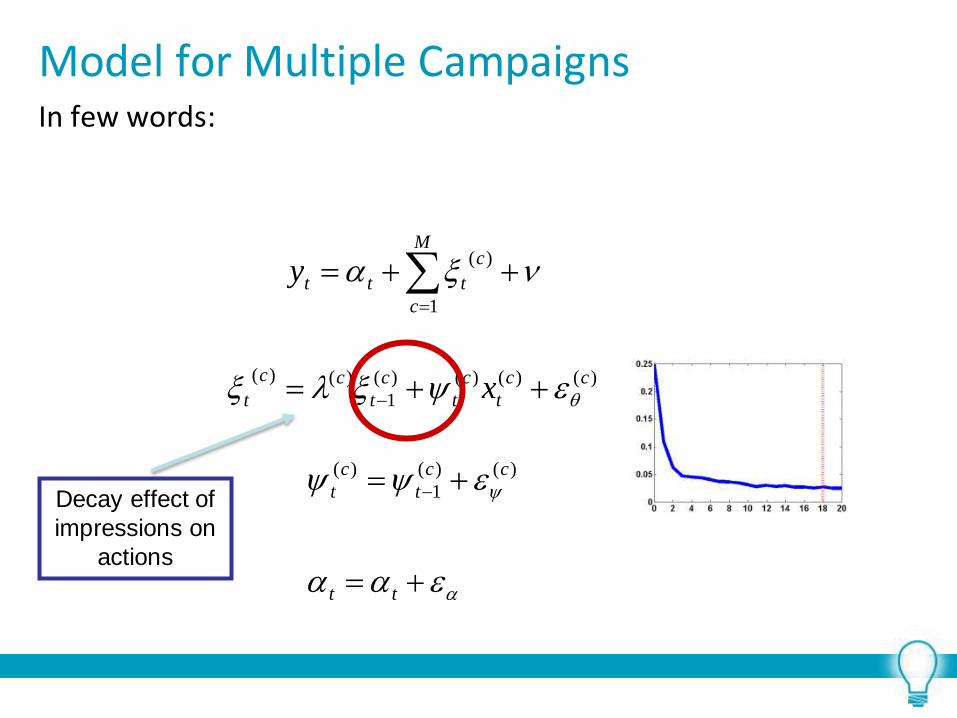
Model for Multiple Campaigns In few words:
tt
cc
t
c
t
cc
t
c
t
c
t
cc
t
M
c
c
ttt
x
y
)()(
1
)(
)()()()(
1
)()(
1
)(
Decay effect of
impressions on
actions
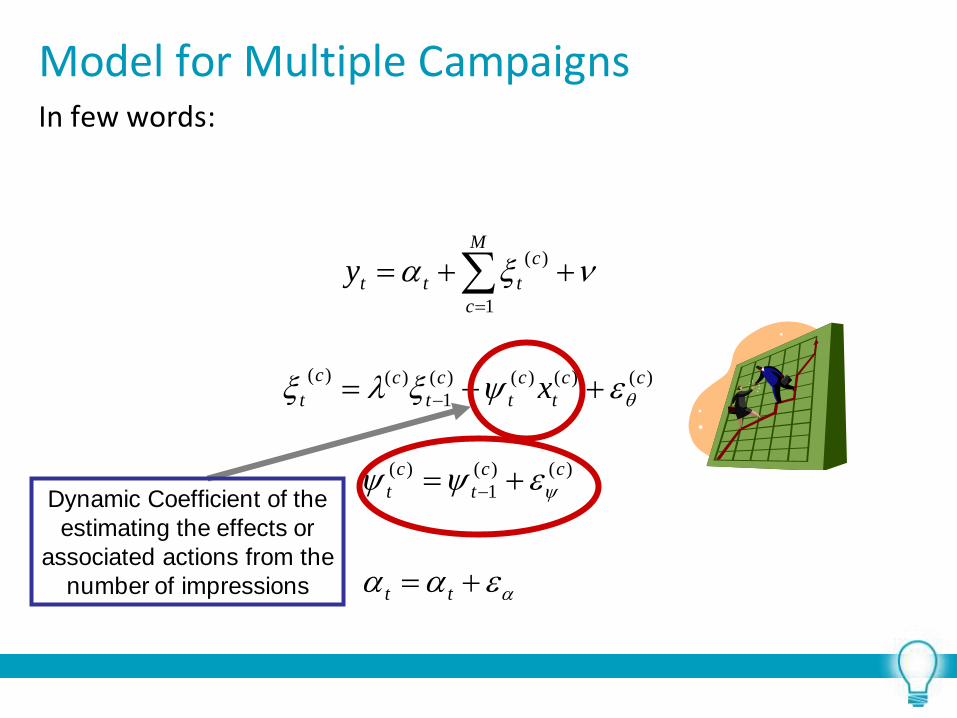
Model for Multiple Campaigns In few words:
tt
cc
t
c
t
cc
t
c
t
c
t
cc
t
M
c
c
ttt
x
y
)()(
1
)(
)()()()(
1
)()(
1
)(
Dynamic Coefficient of the
estimating the effects or
associated actions from the
number of impressions

Model for Multiple Campaigns In summary:
tt
cc
t
c
t
cc
t
c
t
c
t
cc
t
M
c
c
ttt
x
y
)()(
1
)(
)()()()(
1
)()(
1
)(
Linear supperposition of
campaign effects
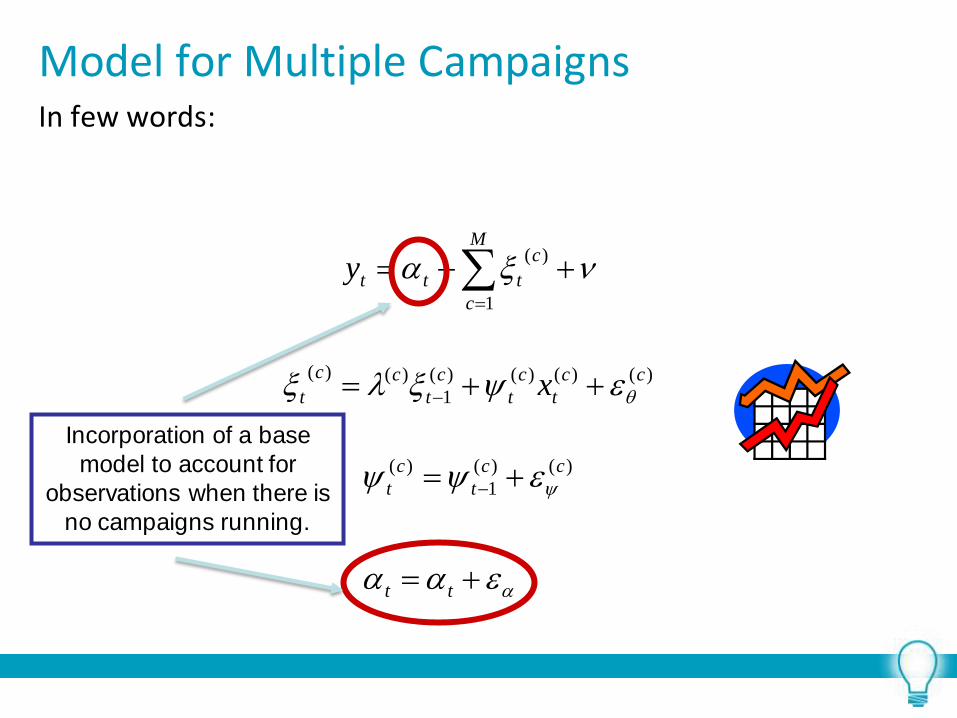
Model for Multiple Campaigns In few words:
tt
cc
t
c
t
cc
t
c
t
c
t
cc
t
M
c
c
ttt
x
y
)()(
1
)(
)()()()(
1
)()(
1
)(
Incorporation of a base
model to account for
observations when there is
no campaigns running.

Great Model, but .. How do we obtain the parameters?
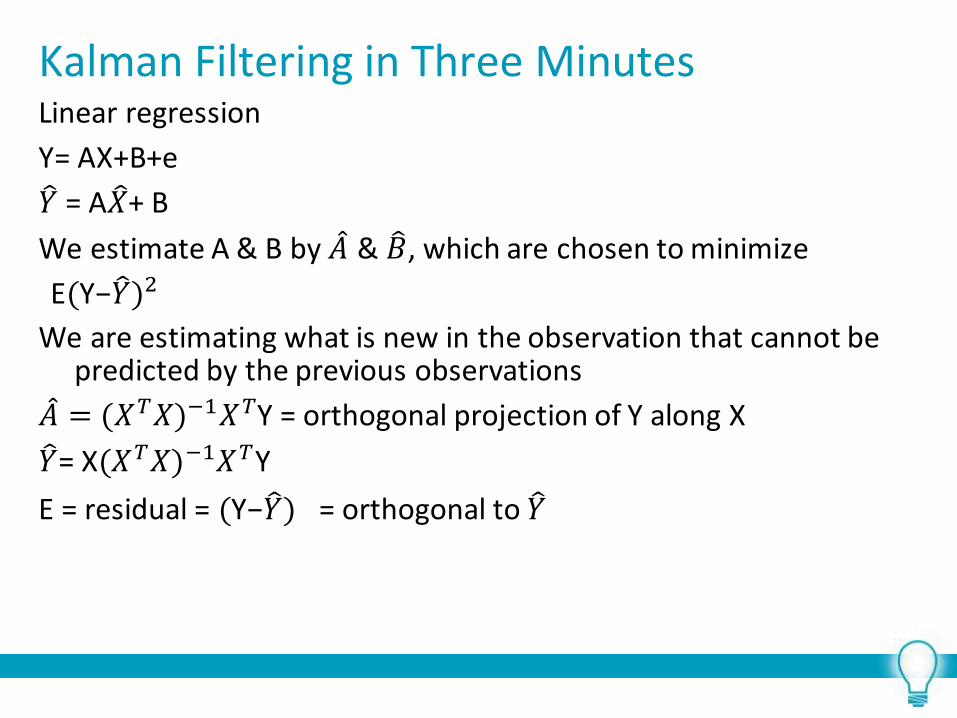
Kalman Filtering in Three Minutes Linear regression
Y= AX+B+e
𝑌 = A𝑋 + B
We estimate A & B by 𝐴 & 𝐵 , which are chosen to minimize
E(Y−𝑌 )2
We are estimating what is new in the observation that cannot be predicted by the previous observations
𝐴 = (𝑋𝑇𝑋)−1𝑋𝑇Y = orthogonal projection of Y along X
𝑌 = X(𝑋𝑇𝑋)−1𝑋𝑇Y
E = residual = (Y−𝑌 ) = orthogonal to 𝑌

Kalman Filtering The Kalman Filter does
• Exactly the same BUT
• Accounts for the change in X with time(𝑋𝑡 𝑡𝑜 𝑋𝑡+1)
• Accounts for the unobserved state
• Assume that the initial variances are known to us
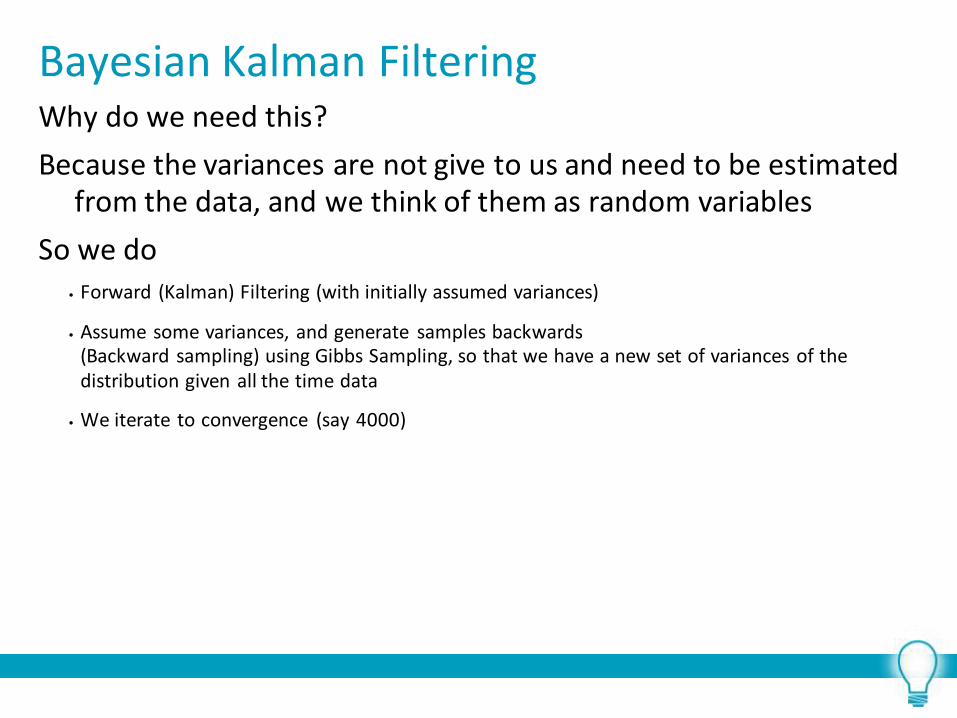
Bayesian Kalman Filtering Why do we need this?
Because the variances are not give to us and need to be estimated from the data, and we think of them as random variables
So we do • Forward (Kalman) Filtering (with initially assumed variances)
• Assume some variances, and generate samples backwards (Backward sampling) using Gibbs Sampling, so that we have a new set of variances of the distribution given all the time data
• We iterate to convergence (say 4000)
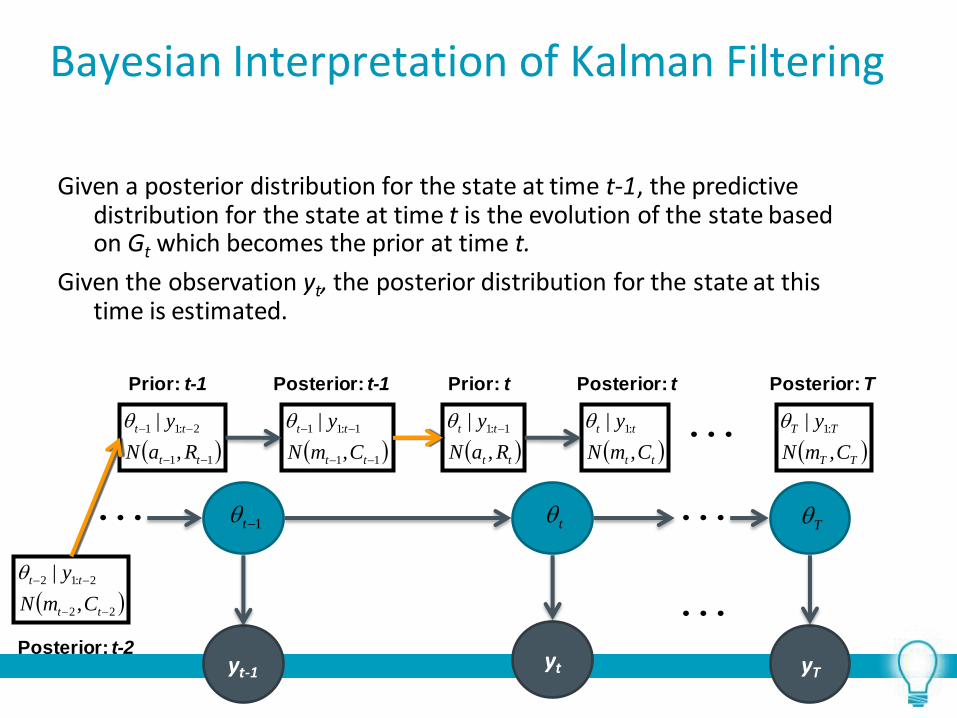
Bayesian Interpretation of Kalman Filtering
Given a posterior distribution for the state at time t-1, the predictive distribution for the state at time t is the evolution of the state based on Gt which becomes the prior at time t.
Given the observation yt, the posterior distribution for the state at this time is estimated.
yt-1
1t t T
yt yT
22
2:12
,
|
tt
tt
CmN
y
11
2:11
,
|
tt
tt
RaN
y
tt
tt
CmN
y
,
| :1
TT
TT
CmN
y
,
| :1
11
1:11
,
|
tt
tt
CmN
y
tt
tt
RaN
y
,
| 1:1 Prior: t-1 Posterior: t-1 Prior: t Posterior: t Posterior: T
Posterior: t-2

Backward Sampling States from Posterior Dist given D1:T
11
:11
,
,|
TT
s
TTT
HhN
D
TT
TT
CmN
D
,
| :1
22
1:12
,
,|
TT
s
TTT
HhN
y
11
2:11
,
,|
HhN
D s
T
TT
TT
CmN
D
,
| :1 11
1:11
,
|
TT
TT
CmN
D
Post given D1:T-1
22
2:12
,
|
TT
TT
CmN
D
Post given D1:T Post given D1:T-2
11
11
,
|
CmN
D
Post given D1
Forward Filtering: Posterior Dist of states given D1:t
1 2T 1T T
1Y 2TY 1TYTY

Attribution Recall that, In linear regression
• Attribution is not based on gain coefficient, but R-squared!
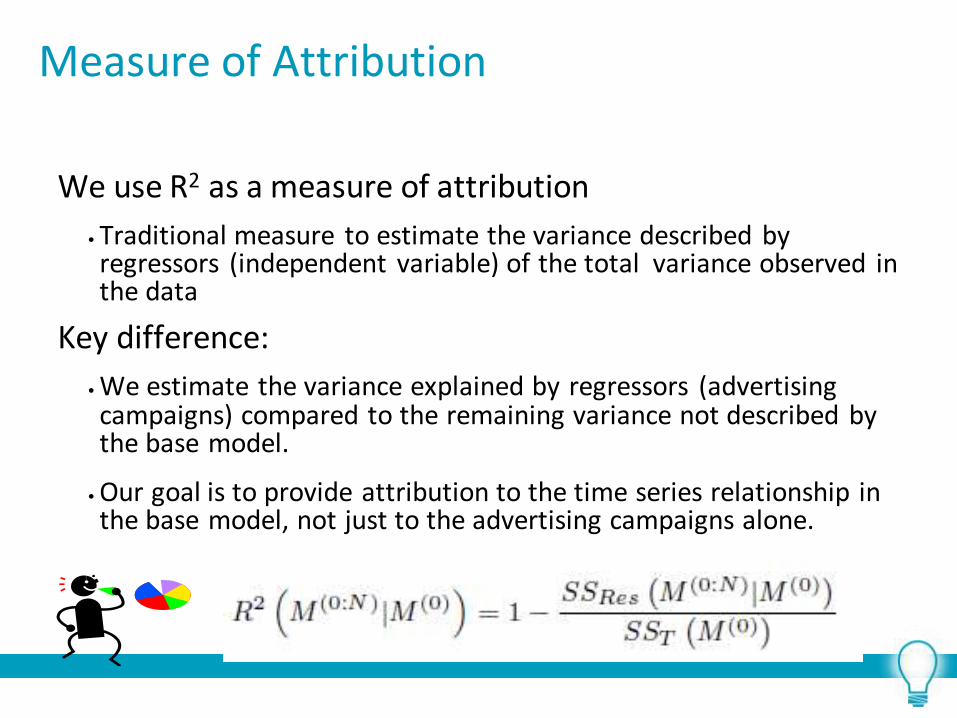
Measure of Attribution
We use R2 as a measure of attribution
• Traditional measure to estimate the variance described by regressors (independent variable) of the total variance observed in the data
Key difference:
• We estimate the variance explained by regressors (advertising campaigns) compared to the remaining variance not described by the base model.
• Our goal is to provide attribution to the time series relationship in the base model, not just to the advertising campaigns alone.
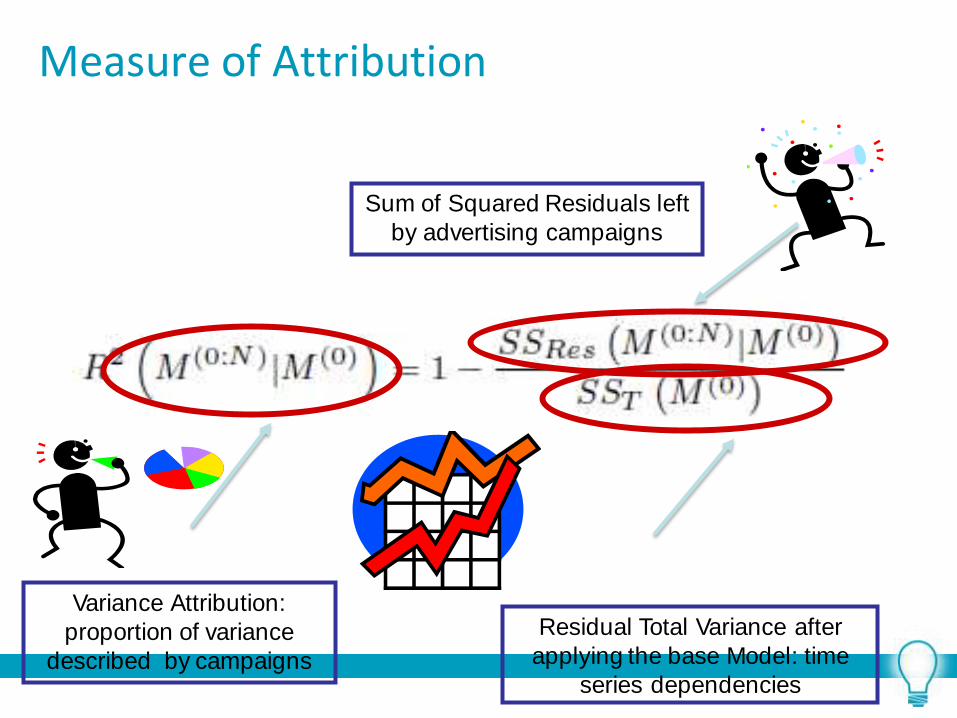
Measure of Attribution
Variance Attribution:
proportion of variance
described by campaigns
Sum of Squared Residuals left
by advertising campaigns
Residual Total Variance after
applying the base Model: time
series dependencies

Results
Analyzed
•2,885 campaigns
•1,251 products
•Six months of data
•No cookies relating ad impressions to user actions are available
•From the Advertising.com ad network
Objective • Evaluate the impact of the campaign on the actions
More from Deep in the Big Data Analytics Trenches
Standard Big Data Environment • 1000 machine Hadoop Cluster
• 2800+ campaigns
• 1200+ products
• 6 months
• Approximately 50 TB
Even processed data difficult to understand and takes time, with all the notes and documentation
Context is very difficult to obtain
Page 66
Our Current Work: From Ads to Actions
Multiple advertising campaigns might be run simultaneously
• Different campaigns for the same product.
Number of impressions
Campaign 1
Number of impressions
Campaign 2
Commercial Actions

Results: Predicting Actions With and Without Use of Impression Data
Base model results effect on predictions
Contribution from the base model to commercial sales
Contribution from the full model (impressions + base) to commercial sales
Blue: Observed Actions Red: Prediction
Dotted: Credible Interval
Blue: Observed Actions Red: Prediction
Dotted: Credible Interval
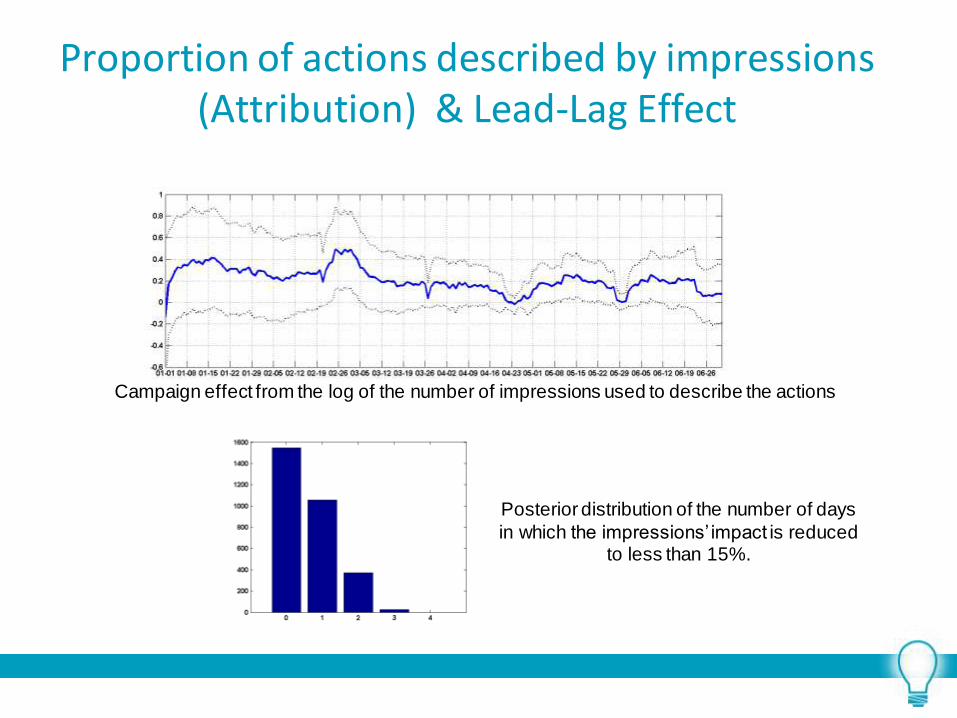
Proportion of actions described by impressions (Attribution) & Lead-Lag Effect
Campaign effect from the log of the number of impressions used to describe the actions
Posterior distribution of the number of days
in which the impressions’ impact is reduced to less than 15%.

Results
Distribution of R2 for all campaigns for 2000 campaigns from 1200 products

A/B Test Comparison
Campaign 1 Campaign 2
Low Mean High Low Mean High
AB Testing 0.009 0.199 0.458 -0.034 0.15 0.312
Attribution Log-Based Model
0.013
0.051
0.117
-0.049
0.347
0.809
Attribution Seasonal Log Based Model
0.044 0.068 0.119 0.094 0.18 0.519
AB testing has
high variability
due to sparsity

MOVING FORWARD
Future Directions and Available Collaboration Opportunities
• We have indicated the potential for effective attribution of actions to campaigns (and ad impressions)
• Continuing to work with leading firms to help enhance advertising and answering and exploring questions such as
• “Your online advertising and associated attribution”
• “Helping you tune your A/B testing over time e.g. Is 50% non-exposed over 1 week better or 17% unexposed over 3 weeks?”
• “Optimizing campaigns mid-flight”
• “ Variation of Observational studies to compensate for targeting based sampling”
• Continuing to work with statisticians at Berkeley and Stanford