web appendix ea p*b web appendix e joint products products that are inter- ... cost function...
TRANSCRIPT

WE-1
PRICING OF JOINT PRODUCTSAND TRANSFER PRICING
Chapter 14 of the textbook addressed pricing decisions for firms that produce sev-eral alternative products that are technically independent in the production process.Joint products, in contrast, are interdependent in the production process; that is, achange in the production of one produces a change in the variable cost or the avail-ability of the other. Examples of joint products include the production of liquidoxygen and nitrogen from air, beef and hides from steers, and gasoline and fuel oilfrom crude oil. In some cases, such as the production of beef and hides from cattle,the outputs are obtained in relatively fixed proportions. In other cases, such as theproduction of gasoline and fuel oil from crude oil, variable proportions of the outputscan be obtained through pressure and heat changes in the chemical cracking processin a refinery. We will examine each of these cases further in this appendix.
JOINT PRODUCTS IN FIXED PROPORTIONS
When outputs are produced in fixed proportions, they should be analyzed as a productpackage. Because the products are jointly produced, all costs are incurred in pro-duction of the package, and no conceptually correct method exists for allocatingthese costs to the individual products. Determination of the optimal output andprices of the products involves a comparison of the total marginal revenue from allthe products with the marginal cost. In the following analysis, each unit of the prod-uct package consists of the output obtained from one unit of input. For example, theslaughtering of a steer might yield a product package consisting of 500 pounds ofbeef and one hide.
Figure WE.1(a) shows the demand functions and their respective marginal revenuefunctions for two products (A and B) that make up a product package, along withthe marginal cost function for the production process. The total marginal revenuefunction (MRT) for the product package is obtained by vertically summing themarginal revenue functions for the individual products (MRA and MRB). The netrevenue gain to the firm of producing one more unit of the product package is theadditional (marginal) revenue from Product A plus the inseparable additional(marginal) revenue from Product B. The intersection of the total marginal revenuefunction (MRT) and the marginal cost function (MC) determines the optimal outputof the product package (Q*) along with the optimal prices of the two individualproducts (i.e., and ).
PRICING OF JOINT PRODUCTS: WILLIAMS COMPANY
Suppose the Williams Company is faced with the following demand functions fortwo joint products produced in fixed proportions:
P1 � 50 � 0.5Q [WE.1]P2 � 60 � 2Q [WE.2]
P*BP*A
WEB APPENDIX E
Joint Products
Products that are inter-dependent in the produc-tion process, such asgasoline and fuel oil inan oil refinery; a changein the production of oneproduces a change in thecost of availability of theother.
EXAMPLE
21605_26_Webappendix_E.qxd 4/25/07 11:58 Page WE-1

Furthermore, suppose that the marginal cost function for the joint products is
MC � 38 � Q [WE.3]
The two marginal revenue functions are obtained as follows:
Summing the two inseparable marginal revenue functions vertically yields
[WE.4]
Setting the total marginal revenue function equal to the marginal cost function andsolving for Q yields the optimal output
Q* � 12
72 � 6Q
110 � 5Q � 38 � Q
MRT � MC
� 110 � 5Q
� (50 � Q) � (60 � 4Q)
MRT � MR1 � MR2
MR2 �dTR2
dQ� 60 � 4Q
TR2 � P2Q � (60 � 2Q)Q � 60Q � 2Q2
MR1 �dTR1
dQ� 50 � Q
TR1 � P1Q � (50 � 0.5Q)Q � 50Q � 0.5Q2
WE-2 WEB APPENDIX E Pricing of Joint Products and Transfer Pricing
Figure WE.1 Optimal Price and Output Determination of Joint Products A and BProduced in Fixed Proportions
Quantity of product package (units)
P*
MRT
Q* Q1
P*MRA
MC
DA
DB
MRB
P*
MRT
Q*Q*
P* MRA
MC
DA
DBMRB
Excess of Product B
Q1
Cos
t an
d pr
ice
($/u
nit)
Cos
t an
d pr
ice
($/u
nit)
A
B
A
B
B A
Quantity of product package (units)
0 0
(a) No excess production (b) Excess production of Product B
21605_26_Webappendix_E.qxd 4/25/07 11:58 Page WE-2

or 12 units of the product package. Substituting this value into the demand functions(Equations WE.1 and WE.2) gives the optimal prices of the two products:
One complication in the preceding analysis can occur if the marginal cost function(MC) intersects the total marginal revenue function (MRT) at an output in excess ofQ1 in Figure WE.1(a). Above Q1, the marginal revenue of Product B is negative,and the firm would not want to sell more than Q1 units of Product B. When thissituation occurs, as shown in Figure WE.1(b), the optimal solution is to produce
units of the product package. This quantity is determined at the intersectionof the MRA and MC functions. units of Product A should be sold at a price of
However, only units of Product B should be sold at a price of .The excess output of Product B, namely � , should be destroyed or discardedso as not to depress the market price.
When solving a numerical problem, one can check to see whether the marginalcost function intersects the total marginal revenue function at an output greaterthan Q1 by substituting the optimal output (Q*) into the MRA and MRB functions.If either marginal revenue value is negative, then the marginal cost functionshould be set equal to the marginal revenue function of the other product in deter-mining the optimal price and output combination.1 For example, if the MRB func-tion is negative, then one would use MRA (rather than MRT) to determine theoptimal solution.
JOINT PRODUCTS IN VARIABLE PROPORTIONS
When the outputs can be produced in variable proportions, the analysis is somewhatmore complex than the fixed proportions case.
PRICING OF JOINT PRODUCTS: SLUSSER CHEMICAL COMPANY
The decision facing the Slusser Chemical Company is illustrated in Figure WE.2. Thequantities of two chemicals (X and Y) that may be produced are indicated on the ver-tical and horizontal axes. The isocost or production possibility curves (labeled TC)indicate the amounts of X and Y that may be produced for the same total cost. Forinstance, looking at the isocost curve labeled TC � 8, we see that the firm may pro-duce Qx units of X and Qy units of Y, Q�x units of X and Q�y units of Y, or any possi-ble combination along that curve at an equivalent total cost of TC � 8. Hence
Q*BQ*AP*BQ*B (� Q1)P*A.
Q*AQ*A
� $36 per unit of Product B
P*2 � 60 � 2(12)
� $44 per unit of Product A
P*1 � 50 � 0.5(12)
WEB APPENDIX E Pricing of Joint Products and Transfer Pricing WE-3
1 Note in the Williams Company example that when Q* � 12, MR1 � 50 � 12 � $38 � 0 and MR2 �
60 � 4(12) � $12 � 0. Hence, no excess output of either product was being produced.
EXAMPLE
21605_26_Webappendix_E.qxd 4/25/07 11:58 Page WE-3

Slusser can increase the output of, say, Product X in two ways. One way is to movealong the isocost curve, increasing the output of X at the expense of Y. The other isto increase the amount of the inputs or factors (e.g., capital and/or labor) in the pro-duction process; that is, move in a northeast direction to a higher isocost curve. Theonly requirement of isocost or production possibility curves is that they be concaveto the origin, indicating an imperfect adaptability of the firm’s productive resourcesin producing X and Y.
The isorevenue lines (labeled TR) take into account the prices that Slusser receivesfor its two outputs. Each line is of equal revenue, indicating that any combination ofX and Y along any particular line will yield the same total revenue. The straightisorevenue lines in Figure WE.2 indicate that products X and Y are being sold inpurely competitive markets; that is, the prices of X and Y do not change as outputchanges. (If this relationship were not the case, the isorevenue lines would no longerbe straight; nevertheless, the general tangency solution for an optimal output combi-nation does not change.) Line TR � 25 is constructed such that Qy2 times the price ofY (Py) equals Qx2 times the price of X (Px). The slope of each isorevenue line is equal
WE-4 WEB APPENDIX E Pricing of Joint Products and Transfer Pricing
Figure WE.2 Joint Products Produced in Variable Proportions: An Optimal Price-Output Mix,Slusser Chemical Company
Output of Product Y (units)
Qy3Q′
Q′
Qx
Qx3
Qy
Qx2
Qy2
π = 2TC = 8
TR = 10
TC = 14
TC = 20
π = 3
π = 6
π = 5
TR = 15
TR = 20
TR = 25
0 y
x
Out
put
of P
rodu
ct X
(un
its)
TC = 12
21605_26_Webappendix_E.qxd 4/25/07 11:58 Page WE-4

to Py � Px, because the slope of TR � 25 equals Qx2 � Qy2, and Px(Qx2) � Py(Qy2);therefore
A whole family of isorevenue lines exists that is defined by the prices and levels ofoutput for X and Y. The further one moves in a northeast direction, the greater thetotal revenue associated with any isorevenue line.
The solution for an optimum combination of outputs requires a point of tangencybetween the isocost and isorevenue curves. This solution may be illustrated with theTC � 14 isocost curve. Under the conditions depicted in Figure WE.2 Slusser shouldproduce Qx3 units of X and Qy3 units of Y because total profit, � (the difference be-tween TR and TC), is maximized at that point. To produce any other possible out-put combination along the TC � 14 isocost curve would result in the same costs(14), but would place the firm on a lower isorevenue curve, thereby reducing profit.Because profits are maximized at the point of tangency (� � 6), the marginal cost ofproducing each product must be exactly equal to the marginal revenue each productgenerates.
The analysis presented here could be expanded considerably by dropping some ofthe assumptions. For instance, the two-product case could be expanded to a moregeneral n-product case. One could also assume a far greater number of variable fac-tors of production than the one factor (or bundle of factors) implicitly assumed. Inaddition, the assumption that the prices of input factors are not a function of theiruse and the assumption that the prices of outputs are independent of the quantityproduced could be dropped. Cases such as these may be analyzed with calculus,2
but in many instances the simplified model presented provides an adequate frame-work for analysis. Linear programming also provides an extremely useful tool forexamining problems of allocating common productive facilities among two or moreproducts to maximize profits.
In conclusion, the decision to add (or delete) products to (from) a firm’s prod-uct line must consider true (net) marginal revenue and true (net) marginal cost.If a new product is a reasonably close substitute for an existing product, theaddition of the new product is likely to cannibalize the sales of the existingproduct. This sales reduction must be considered in the marginal revenue analysis.In addition, complementarities in demand between two or more products (when alower price or increased availability of one product stimulates an increase in de-mand for another) must also be considered in a multiproduct firm’s price and outputdecisions.
Finally, in deciding whether to add, delete, or change the relative output of anyone product, the impact of that action on the cost of producing the firm’s other out-puts must be taken into consideration. Only after true marginal costs and benefitshave been accounted for may optimal strategies about the makeup of a firm’s prod-uct line be adopted.
Py
Px�
Qx2
Qy2
WEB APPENDIX E Pricing of Joint Products and Transfer Pricing WE-5
2 Frederick Warren-Boulton, “Vertical Control with Variable Proportions,” Journal of Political Economy, 1974,pp. 783–802.
21605_26_Webappendix_E.qxd 4/25/07 11:58 Page WE-5

TRANSFER PRICING
Associated with the tremendous growth in the size of corporations has been a trendtoward decentralized decision making and control within these organizations. Be-cause of the exceedingly complex coordination and communication problems withinlarge multiproduct national or multinational firms, such firms typically are brokenup into a group of semiautonomous operating divisions. Each division constitutes aprofit center with the responsibility and authority for making operating decisionsand an appropriate set of rewards and incentives to motivate profit-maximizing de-cisions. Because of the complexity of this problem, we limit the following analysis inseveral ways.
In practice, the external demand functions of two divisions are often interrelated.For example, a degree of dependence presumably exists between the demand func-tions of the Chevrolet and Pontiac divisions of General Motors. In the analysis ofthis section, however, it is assumed that the external demand functions of each divi-sion are independent.
The production processes of two divisions are also often cost dependent eitherthrough technological interdependence or through the effects of output changes onthe costs of inputs employed in the production process. An example of the formertype of interdependence would be the case of an oil refinery in which the mix of out-puts (e.g., gasoline, kerosene, heating oil, and lubricants) is limited by the produc-tion process. An example of the latter type would be two divisions that are biddingfor a raw material (sheet metal) or labor skill in short supply and that are, as a re-sult, causing the price to rise. In the ensuing analysis, it is assumed that the produc-tion processes are cost independent.
A third source of dependence, and the only one considered in this section, occurswhenever one division sells all or part of its output to another division of the samefirm. For example, within the Ford Motor Company a multitude of internal transfersof goods and services takes place. The Engine and Foundry Division, Transmissionand Chassis Division, Metal Stamping Division, and the Glass Division, among oth-ers, transfer products to the Automotive Assembly Division. The AutomotiveAssembly Division in turn transfers completed cars to the Ford and Lincoln-MercurySales and Marketing Divisions.
The price at which each intermediate good or service is transferred from the sell-ing to the buying division affects the revenues of the selling division and the costs ofthe buying division. Consequently, the price-output decisions and profitability ofeach division will be affected by the transfer price.
A transfer price serves two sometimes competing functions in the decentralizedfirm. One function is to act as a measure of the marginal value of resources used inthe division when making the price and output decisions that will maximize profits.The other is to serve as a measure of the total value of the resources used in thedivision when analyzing the performance of the division. It is sometimes possiblefor these functions to conflict.3 The emphasis in this section is on determining thecorrect transfer price to use in making marginal decisions about product price andoutput of each division.
WE-6 WEB APPENDIX E Pricing of Joint Products and Transfer Pricing
Transfer Price
The price at which anintermediate good orservice is transferredfrom the selling divisionto the buying divisionwithin the same firm.
3 See C. Horngren and G. Foster, Cost Accounting: A Managerial Emphasis, 10th ed. (Englewood Cliffs,NJ: Prentice Hall, 2000), Chapter 22.
21605_26_Webappendix_E.qxd 4/25/07 11:58 Page WE-6

PRICING OF INTERDEPARTMENTAL SERVICES AT BELL ATLANTIC4
Bell Atlantic (now Verizon) has taken the transfer pricing concept and applied it onan experimental basis to the pricing of interdepartmental services, such as informa-tion services, business research, medical services, and training and development.Each of 10 client-service departments charges other departments of the company forthe services it renders. For example, a manager who uses an in-house speech writerwould have to pay for this service out of his or her department’s budget. The speechwriter’s department would then be credited with the amount charged for providingthe service. From these revenues, each client-service department is expected to pay allits expenses, including salaries and benefits, rent, office equipment, and electricity.A department that fails to cover its costs could be faced with some difficult choices,such as replacing the manager, reducing its staff, or even possible elimination by giv-ing the work to an outside vendor.
One of the most difficult problems in implementing such a transfer pricing systemis determining the costs and market value of a department’s services. Most depart-ments at Bell Atlantic ended up pricing their services in line with what outside ven-dors charged. Some departments billed for their services on an hourly basis, whereasothers charged a set amount for each project. To prevent overcharging by the client-service departments, in-house users were allowed to use outside vendors when theycould obtain a better price from the vendor.
The benefits from such a pricing system are twofold. First, some client-servicedepartments found that they were overstaffed and were required to reduce the scaleof their operations. For example, the communications services group eliminated11 positions. Second, users of these services were forced to scale back their requeststo more realistic levels if the price quote was too high. Under the old system, servicerequests were sometimes excessive because the costs were being borne by thedepartment doing the work rather than by the clients. Annual savings with thenew system of more than $4 million were reported for four of Bell Atlantic’s client-service groups.
In the following analysis, assume that a decentralized firm consists of twoseparate divisions that form a two-stage process to manufacture and market asingle product. The production division manufactures an intermediate product,which is sold internally to the marketing division at the transfer price. Themarketing division converts the intermediate product into a final product,which it then sells in an imperfectly competitive (that is, monopolistic) externalmarket.
Under the assumptions of demand and cost independence already discussed, threepossible cases can be considered:
• No external market for the intermediate product.• Perfectly competitive external market for the intermediate product.• Imperfectly competitive external market for the intermediate product.
WEB APPENDIX E Pricing of Joint Products and Transfer Pricing WE-7
EXAMPLE
4 Based on “At Bell Atlantic, Competing Is Learned from the Inside,” Wall Street Journal (July 12, 1989), p. B1.
21605_26_Webappendix_E.qxd 4/25/07 11:58 Page WE-7

The first two cases are examined in the remainder of this section. The third case ofan imperfectly competitive external market can be analyzed using the third-degreeprice discrimination model discussed in Chapter 14 of the textbook. It leads to thecounterintuitive result that optimal transfer prices may exceed external prices atwhich the manufacturer will sell to outside buyers. This price discrimination case isnot reexamined here.
NO EXTERNAL MARKET FOR THE INTERMEDIATE PRODUCT
With no external market for the intermediate product, the production divisionwould be unable to dispose of any excess units over and above the amount desiredby the marketing division. Likewise, if demand for the final product should exceedthe capacity of the production division, the marketing division would be unable toobtain additional units of the intermediate product externally. Therefore, the quan-tity of the product manufactured by the production division must necessarilybe equal to the amount sold by the marketing division.5 The determination of theprofit-maximizing price-output combination and the resulting transfer price areshown in Figure WE.3. The marginal cost per unit to the firm, MC, of any level of
WE-8 WEB APPENDIX E Pricing of Joint Products and Transfer Pricing
Figure WE.3 Determination of the Transfer Price with No External Market for the Intermediate Product
B
A
Quantity
MRm
MCt = MCm + Pt
MC = MCp + MCm
P*
P*
Q*
Q*
Pt
MCm
Dm
MCp
Cos
t an
d pr
ice
($/u
nit)
m
t
m
p
0
5 This analysis assumes that all units produced during the period must be sold during the period; that is, noinventories of the intermediate product can be carried over into the next period.
21605_26_Webappendix_E.qxd 4/25/07 11:58 Page WE-8

output is the sum of the marginal costs per unit of production, MCp, and marketing,MCm. By equating marginal cost MC to external marginal revenue MRm (Point A),one obtains the firm’s profit-maximizing decisions— as the optimal price and
as the optimal quantity of the final product to be sold by the marketing divisionin the external market. Therefore, the optimal transfer price is set equal to themarginal production cost per unit MCp at the optimum output level (Point B).At this point, each division, when seeking to maximize its own division profit,will maximize the overall profit of the firm. This result can be demonstrated in thefollowing manner.
Once the transfer price is established, the production division will face a horizon-tal demand curve (and corresponding marginal revenue curve) at the given transferprice for the intermediate product. The profits of the production division will bemaximized at the point where its divisional marginal cost equals divisional marginalrevenue—in this case where the Pt line intersects the MCp curve. This conditionyields as the optimum quantity of the intermediate product, which is identicalto the optimum quantity of the final product determined previously. Similarly,once the transfer price is established, the marketing division is faced with a marginalcost curve MCt, which is the sum of the marginal marketing cost per unit MCm andthe given transfer price Pt. The profits of the marketing division will be maximizedat the point where its divisional cost is equal to its divisional marginal revenue—where the MCt and MRm curves intersect. This condition results in the same optimalprice and output decision (i.e., and ) as was obtained previously in maxi-mizing the overall profits of the firm.
DETERMINING THE OPTIMAL TRANSFER PRICE: PORTLAND ELECTRONICS
The production division (p) of the Portland Electronics Company manufactures acomponent that it sells internally to the marketing division (m), which promotes anddistributes the product through its own domestic retail outlets. Assume that thiscomponent has no external market (i.e., the production division cannot sell any ex-cess production of the component to outside buyers and the marketing division can-not obtain additional components from outside suppliers). The marketing division’sdemand function for the component is
Pm � 100 � 0.001Qm [WE.5]
where Pm is the selling price (in dollars per unit) and Qm is the quantity sold (inunits). The marketing division’s total cost function in dollars (excluding the cost ofthe component) is
Cm � 300,000 � 10Qm [WE.6]
The production division’s total cost function (in dollars) is
[WE.7]
where Qp is the quantity produced and sold.We are interested in determining the profit-maximizing outputs for the produc-
tion and marketing divisions and the optimal transfer price for intracompany sales.
Cp � 500,000 � 15Qp � 0.0005Q2p
Q*mP*m
Q*mQ*p
Q*pP*t
Q*mP*m
WEB APPENDIX E Pricing of Joint Products and Transfer Pricing WE-9
EXAMPLE
21605_26_Webappendix_E.qxd 4/25/07 11:58 Page WE-9

The marginal cost per unit to the firm, MC, is equal to the sum of the marginal costsof production, MCp, and marketing, MCm:
MC � MCp � MCm [WE.8]
The marginal cost of the production division is equal to the first derivative of Cp
(Equation WE.7):
[WE.9]
The marginal cost of the marketing division is equal to the first derivative of Cm
(Equation WE.6):
[WE.10]
Substituting Equations WE.9 and WE.10 into Equation WE.8 and recognizing that
Qm � Qp
we obtain
[WE.11]
The marketing division’s total revenue function is equal to
[WE.12]
Taking the first derivative of TRm (Equation WE.12) gives
[WE.13]
Setting Equation WE.11 equal to Equation WE.13 gives the optimal output for themarketing division:
MC � MRm
25 � 0.0010Qm � 100 � 0.002Qm
Q*m � 25,000 units
� 100 � 0.002Qm
MRm �d(TRm)
dQm
� 100Qm � 0.001Q2m
� (100 � 0.001Qm)Qm
TRm � PmQm
� 25 � 0.0010Qm
MC � 15 � 0.0010Qm � 10
� 10
MCm �dCm
dQ
� 15 � 0.0010Qp
MCp �dCp
dQp
WE-10 WEB APPENDIX E Pricing of Joint Products and Transfer Pricing
21605_26_Webappendix_E.qxd 4/25/07 11:58 Page WE-10
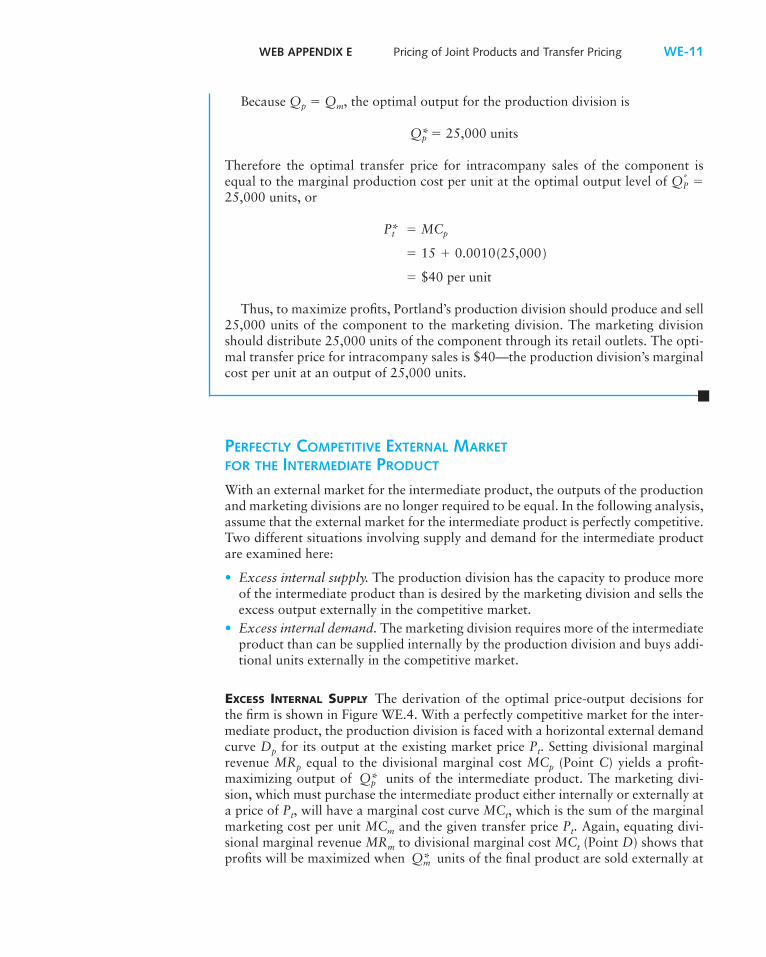
Because Qp � Qm, the optimal output for the production division is
Therefore the optimal transfer price for intracompany sales of the component isequal to the marginal production cost per unit at the optimal output level of �25,000 units, or
Thus, to maximize profits, Portland’s production division should produce and sell25,000 units of the component to the marketing division. The marketing divisionshould distribute 25,000 units of the component through its retail outlets. The opti-mal transfer price for intracompany sales is $40—the production division’s marginalcost per unit at an output of 25,000 units.
PERFECTLY COMPETITIVE EXTERNAL MARKETFOR THE INTERMEDIATE PRODUCT
With an external market for the intermediate product, the outputs of the productionand marketing divisions are no longer required to be equal. In the following analysis,assume that the external market for the intermediate product is perfectly competitive.Two different situations involving supply and demand for the intermediate productare examined here:
• Excess internal supply. The production division has the capacity to produce moreof the intermediate product than is desired by the marketing division and sells theexcess output externally in the competitive market.
• Excess internal demand. The marketing division requires more of the intermediateproduct than can be supplied internally by the production division and buys addi-tional units externally in the competitive market.
EXCESS INTERNAL SUPPLY The derivation of the optimal price-output decisions forthe firm is shown in Figure WE.4. With a perfectly competitive market for the inter-mediate product, the production division is faced with a horizontal external demandcurve Dp for its output at the existing market price Pt. Setting divisional marginalrevenue MRp equal to the divisional marginal cost MCp (Point C) yields a profit-maximizing output of units of the intermediate product. The marketing divi-sion, which must purchase the intermediate product either internally or externally ata price of Pt, will have a marginal cost curve MCt, which is the sum of the marginalmarketing cost per unit MCm and the given transfer price Pt. Again, equating divi-sional marginal revenue MRm to divisional marginal cost MCt (Point D) shows thatprofits will be maximized when units of the final product are sold externally atQ*m
Q*p
� $40 per unit
� 15 � 0.0010(25,000)
P*t � MCp
Q*P
Q*p � 25,000 units
WEB APPENDIX E Pricing of Joint Products and Transfer Pricing WE-11
21605_26_Webappendix_E.qxd 4/25/07 11:58 Page WE-11
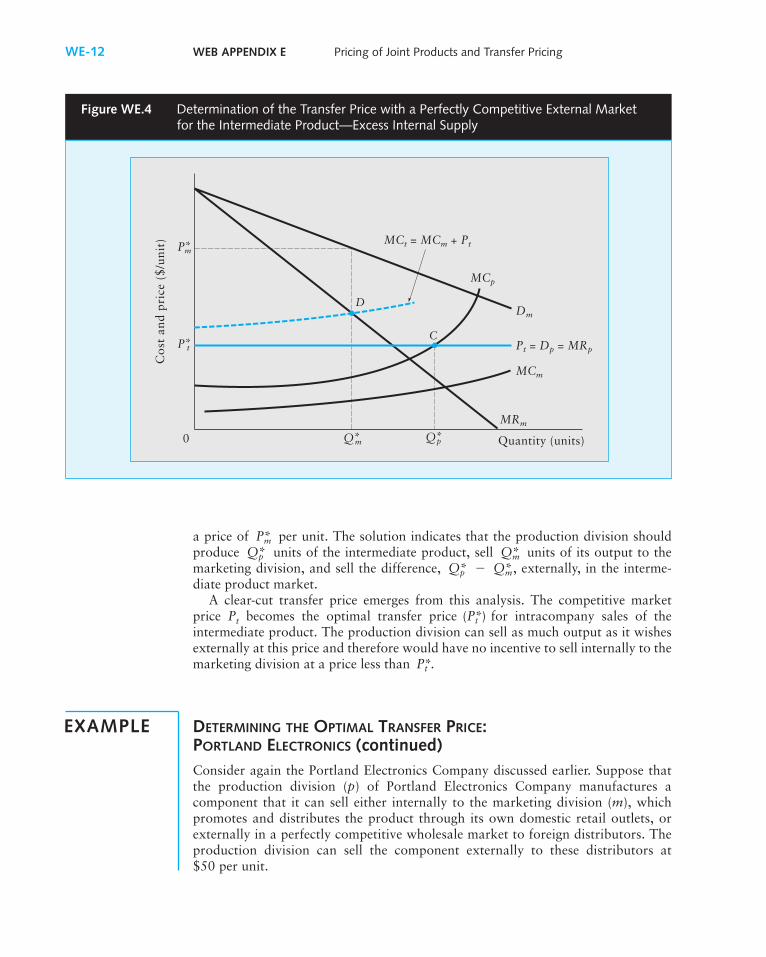
a price of per unit. The solution indicates that the production division shouldproduce units of the intermediate product, sell units of its output to themarketing division, and sell the difference, � , externally, in the interme-diate product market.
A clear-cut transfer price emerges from this analysis. The competitive marketprice Pt becomes the optimal transfer price for intracompany sales of theintermediate product. The production division can sell as much output as it wishesexternally at this price and therefore would have no incentive to sell internally to themarketing division at a price less than
DETERMINING THE OPTIMAL TRANSFER PRICE: PORTLAND ELECTRONICS (continued)Consider again the Portland Electronics Company discussed earlier. Suppose thatthe production division (p) of Portland Electronics Company manufactures acomponent that it can sell either internally to the marketing division (m), whichpromotes and distributes the product through its own domestic retail outlets, orexternally in a perfectly competitive wholesale market to foreign distributors. Theproduction division can sell the component externally to these distributors at$50 per unit.
P*t .
(P*t )
Q*mQ*pQ*mQ*p
P*m
WE-12 WEB APPENDIX E Pricing of Joint Products and Transfer Pricing
EXAMPLE
Figure WE.4 Determination of the Transfer Price with a Perfectly Competitive External Marketfor the Intermediate Product—Excess Internal Supply
D
Quantity (units)
MRm
MCt = MCm + Pt
Pt = Dp = MRp
P*
P*
Q*
MCm
Dm
MCp
C
m
t
m p
Co
st a
nd
pri
ce (
$/u
nit
)
Q* 0
21605_26_Webappendix_E.qxd 4/25/07 11:58 Page WE-12

The task is to determine the profit-maximizing outputs for the production andmarketing divisions and the optimal transfer price for intracompany sales. Theproduction division’s optimal output occurs at the point where divisional marginalrevenue equals divisional marginal cost. Because the production division can sell asmuch output as it wishes (externally) at the competitive market price of $50, itsmarginal revenue is equal to
MRp � 50
As we saw earlier, the production division’s marginal cost relationship is (fromEquation WE.9)
MCp � 15 � 0.0010Qp
Setting MCp � MRp yields the optimal output for the production division:
The marketing division’s optimal output occurs where divisional marginal revenueequals divisional marginal cost. Marginal cost for the marketing division (MCt) isequal to the sum of its own marginal marketing costs (MCm) plus the cost per unit ofthe components purchased from the production division (Pt) or
MCt � MCm � Pt [WE.14]
Because the external wholesale market for the component is perfectly competi-tive, the production division would not be willing to sell components to the market-ing division for less than the market price of $50 per unit. Therefore, the optimaltransfer price is the competitive market price of $50 per unit.
� $50 per unit
As was shown earlier, marginal marketing costs (MCm) were
MCm � 10
Hence, by Equation WE.14, MCt is given by
The marketing division’s marginal revenue function (MRm) was given earlier as(from Equation WE.13)
MRm � 100 � 0.002Qm
Setting MRm � MCt yields the optimal output for the marketing division:
Thus to maximize profits, Portland’s production division should produce 35,000units of the component, sell 20,000 units internally to the marketing division,
Q*m � 20,000 units
100 � 0.002Qm � 60
� 60
MCt � 10 � 50
P*t
(P*t )
Q*p � 35,000 units
15 � 0.0010Qp � 50
WEB APPENDIX E Pricing of Joint Products and Transfer Pricing WE-13
21605_26_Webappendix_E.qxd 4/25/07 11:58 Page WE-13

and sell the remaining 15,000 units (35,000 � 20,000) externally to other (foreign)distributors. The marketing division should distribute 20,000 units of the compo-nent through its retail outlets. The optimal transfer price for the intracompany salesis the competitive market price of $50 per unit.
EXCESS INTERNAL DEMAND The derivation of the optimal price-output decisionsfor the firm under excess internal demand is shown in Figure WE.5. Similar tothe excess internal supply situation discussed previously, the production divisionwill attempt to maximize its profits by setting divisional marginal revenue MRp
equal to divisional marginal cost MCp (Point E), which results in an optimal solu-tion of units of the intermediate product. The marketing division, with amarginal cost curve MCt equal to the sum of the marginal marketing costs per unitMCm and the given transfer price Pt, will attempt to maximize profits by equatingdivisional marginal revenue MRm to divisional marginal cost MCt (Point F). Thisapproach yields an optimal solution of Q*m units of the final product being soldexternally at a price of per unit. The solution indicates that the productiondivision should produce and sell its entire output of units of the intermediateproduct to the marketing division. The marketing division should purchase anadditional � units of the intermediate product externally in the interme-diate product market.
Q*pQ*m
Q*pP*m
Q*p
WE-14 WEB APPENDIX E Pricing of Joint Products and Transfer Pricing
Figure WE.5 Determination of the Transfer Price with a Perfectly Competitive External Marketfor the Intermediate Products—Excess Internal Demand
0
F
Quantity (units)
MRm
MCt = MCm + Pt
Pt = Dp = MRp
P*
P*
Q*Q*
MCm
Dm
MCp
Et
m
p m
Co
st a
nd
pri
ce (
$/u
nit
)
21605_26_Webappendix_E.qxd 4/25/07 11:58 Page WE-14

WEB APPENDIX E Pricing of Joint Products and Transfer Pricing WE-15
Multinational corporations have a great deal of flexi-bility in setting transfer prices, because often no exter-nal market standards dictate the level of theseintrafirm prices. In the absence of differential tax ratesbetween the various countries in which a firm doesbusiness, the establishment of appropriate transferprices involves application of microeconomic decisionrules and cost accounting principles. However, becauselarge multinational firms operate in several differentcountries, each with its own system of taxation and itsown unique corporate income tax rates and policies,the use of transfer pricing to aggressively manage andreduce tax liabilities is common and profitable. For ex-ample, in 1991 the IRS charged Toyota with systemat-ically overcharging its U.S. subsidiary for most of thevehicles and parts sold in the United States. The effectof these actions was to transfer profits that would havebeen booked (and taxed at high rates) in the UnitedStates to Japan, where tax rates are much lower.Toyota denied any wrongdoing but agreed to pay theIRS $1 billion in a settlement of these claims.
Westinghouse Electric booked 27 percent of its1986 domestic profit in Puerto Rico, where it has veryfew sales. The corporate tax rate in Puerto Rico is setat 0 percent to stimulate the economy. Yamaha MotorCorporation’s U.S. subsidiary paid only $5,272 intaxes in the early 1980s, whereas IRS accountantsclaim that proper accounting of transfer prices wouldhave resulted in $127 million in taxes.
The issue of setting proper transfer prices is ex-tremely complex. Many differences between companypolicies and IRS regulations arise because of the com-plexity of the issue. However, the IRS has become in-creasingly aggressive in prosecuting blatant cases ofabuse. Financial managers of multinational firms willhave to give this issue greater attention in coming yearsif they expect to achieve the goal of maximizing share-holder wealth within the bounds of legal and ethicalstandards of business practice.
6 Based on L. Martz, “The Corporate Shell Game,” Newsweek(April 15, 1991), pp. 48–49.
TRANSFER PRICING, TAXES, AND ETHICS6
• Joint products are products that are technically inter-dependent in the production process; that is, a changein the production of one produces a change in the costor availability of another. When the joint products areproduced in fixed proportions, the optimal output ofthe product package (consisting of the individual prod-ucts) and optimal prices of the individual products arefound at the intersection of the total marginal revenuefunction and the marginal cost function of producingthe product package. When joint products are pro-duced in variable proportions, the optimal output oc-curs where the marginal cost of producing each product
is equal to the marginal revenue of each product. Thisoccurs at the point of tangency between the isocostand isorevenue curves for the products.
• Transfer pricing analysis is important when a firm isfaced with the problem of pricing items that are pro-duced and used internally in the firm. When the exter-nal market for the intermediate product is perfectlycompetitive, the firm should use the market-determinedprice on intracompany sales. In other cases an appro-priate profit-maximizing transfer price is a function ofthe marginal costs and revenues of the respective divi-sions in the firm.
SUMMARY
As in the situation of excess internal supply discussed earlier, the optimal transferprice for intracompany transfers of the intermediate product is equal to thecompetitive market price Pt. The marketing division can purchase as much of the in-termediate product as it wishes externally at this price and therefore would be unwill-ing to make purchases from the production division at a price higher than P*t .
(P*t )
21605_26_Webappendix_E.qxd 4/25/07 11:58 Page WE-15

WE-16 WEB APPENDIX E Pricing of Joint Products and Transfer Pricing
Exercises 1. Explain why you feel that the interdependency terms between each of the followingpairs of products would tend to be either positive (complements), negative (substitutes),or zero (independent):a. Polaroid: Instant cameras and filmb. Nabisco: Fleischmann’s and Blue Bonnet margarinec. Nabisco: Ritz crackers and Oreo cookiesd. Nabisco: Oreo cookies (regular size) and Mini Oreose. Nabisco: Camel and Winston cigarettesf. General Motors: Saturn compact cars and Chevrolet compact carsg. General Motors: Buick full-size cars and Chevrolet compact cars
2. A company produces both oil and natural gas from a well in the panhandle of WestTexas. If these products are produced from the well in fixed proportions, what wouldone expect the impact of an increase in the price of oil to be on the rate of gasproduction?
3. Refer to the Williams Company joint products example (Equations WE.1–WE.4):a. On a graph with quantity on the horizontal axis and price (and cost) on the verti-
cal axis, plot the demand and marginal revenue functions for the two products andthe marginal cost function for the product package.
b. From the graph in Part (a), determine the optimal output and price for each of thetwo products. Compare the graphical solution with the algebraic solution in Chapter14 of the textbook.
4. Refer again to the Williams Company joint products example (Equations WE.1–E.4)and assume that the marginal cost function (Equation WE.3) is replaced with thefollowing one:
MC � 22 � 0.5Q
Determine the optimal output and selling price for each of the two products.5. Refer to the Portland Electronics Company transfer pricing example, discussed earlier
in this appendix, which dealt with a competitive external market for the intermediateproduct. Complete the following table (based on the optimal solution):
Production Division Marketing Division
Total revenue
Total cost
Total profit
6. Refer again to the Portland Electronics Company transfer pricing example discussedearlier in this appendix, which dealt with a perfectly competitive external market forthe intermediate product. Assume that the company can buy (or sell) additional units ofthe component at $30 per unit. Determine the optimal price and output decisions for theproduction and marketing divisions and compare them with the solution obtained inthe chapter.
7. Consolidated Sugar Company has two divisions: a farming-preprocessing (p) divisionand a processing-marketing (m) division. The farming-preprocessing division growssugar cane and crushes it into juice, which it sells internally to the processing-marketingdivision or externally in the perfectly competitive open market. The processing-marketing division buys cane juice, either internally from the farming-preprocessingdivision or externally in the open market, and then evaporates and purifies it and sellsit as processed sugar.
21605_26_Webappendix_E.qxd 4/25/07 11:58 Page WE-16

WEB APPENDIX E Pricing of Joint Products and Transfer Pricing WE-17
The processing-marketing division’s demand function for processed sugar is
Pm � 24 � Qm
where Pm is the price, in dollars per unit, and Qm is the quantity sold, in units, and itscost function (excluding cane juice) is
Cm � 8 � 2Qm
The farming-preprocessing division’s total cost function for cane juice is
Cp � 10 � 2Qp �
where Qp is the quantity produced, in units. Assume that one unit of cane juice is con-verted into one unit of processed sugar. Furthermore, assume that the open market pricefor cane juice is $14.a. What is the profit-maximizing price and output level for the farming-preprocessing
division?b. What is the profit-maximizing price and output level for the processing-marketing
division?c. How much of its output (cane juice) should the farming-preprocessing division sell
(i) internally to the processing-marketing division and (ii) externally on the openmarket?
d. How much of its input (cane juice) should the processing-marketing division buy(i) internally from the farming-preprocessing division and (ii) externally on theopen market?
e. What is the minimum price at which the farming-preprocessing division would bewilling to sell cane juice to the processing-marketing division? Explain.
f. What is the maximum price that the processing-marketing division would be will-ing to pay to buy cane juice from the farming-preprocessing division? Explain.
g. To maximize the overall profits of Consolidated Sugar, what price should the com-pany use for intracompany transfers of cane juice from the farming-preprocessingdivision to the processing-marketing division?
Q2p
CASE
EXERCISE
TRANSFER PRICING
DeSoto Engine, a division of International Motors, produces automobile engines. Itsells these engines to the automobile assembly division within the corporation. A dis-pute has arisen between the managers of the DeSoto division and the assembly divi-sion concerning the appropriate transfer price for intracompany sales of engines.The current transfer price of $385 per unit was arrived at by taking the standard costof the engine ($350) and adding a 10 percent profit margin ($35), based on an esti-mated volume of 450,000 engines per year. The manager of the DeSoto division ar-gues that the transfer price should be raised because the division’s average profitmargin on other products is 18 percent. The manager of the assembly division claimsthat the transfer price should be lowered because an assembly division manager at acompeting automobile company indicated that engines cost his division only $325per unit. The corporation’s chief economist has been asked to solve this intracom-pany pricing problem.
21605_26_Webappendix_E.qxd 4/25/07 11:58 Page WE-17

The economist collected the following demand and cost information. Demand forautomobiles is given by the following function:
Pm � 10,000 � 0.01Qm
where Pm is the selling price (in dollars) per automobile and Qm is the number ofvehicles sold. (Assume for simplicity that price is the only variable that affectsdemand.) The total cost function for the assembly division (excluding the cost of theengines) is
Cm � 1,150,000,000 � 2,500Qm
where Cm is the cost (in dollars). The DeSoto division’s total cost function is
Cp � 30,000,000 � 275Qp � 0.000125Q2p
where Qp is the number of engines produced and Cp is the cost (in dollars).
QUESTIONSAssume that no external market exists for these engines. (In other words, the DeSotodivision cannot sell any excess engines to outside buyers and the assembly divisioncannot obtain additional engines from outside suppliers).
1. Determine the profit-maximizing output (vehicles) for the assembly division.
2. Determine the profit-maximizing output (engines) for the DeSoto division.
3. Determine the optimal transfer price for intracompany sales of engines.
4. Calculate (a) total revenue, (b) total cost, and (c) total profits for each divisionat the optimal solution found in Questions 1, 2, and 3.
The manager of the DeSoto division is dissatisfied with the solution to the transfer-pricing problem. On further investigation, he finds that a perfectly competitive ex-ternal market exists for automobile engines, with many automobile manufacturersand suppliers willing to sell or purchase engines at the going market price. Specifi-cally, a large German automobile company (BW Motors) has offered to purchaseall of DeSoto’s engine output (up to 700,000 engines per year) at a price of $425per unit.
5. Determine the profit-maximizing output for the assembly division.
6. Determine the profit-maximizing output for the DeSoto division.
7. Determine the optimal transfer price for intracompany sales of engines.
8. Determine how many engines the DeSoto division should sell (a) internally tothe assembly division and (b) externally to BW Motors.
9. Calculate (a) total revenue, (b) total costs, and (c) total profits for each divisionat the optimal solution found in Questions 5, 6, 7, and 8.
WE-18 WEB APPENDIX E Pricing of Joint Products and Transfer Pricing
21605_26_Webappendix_E.qxd 4/25/07 11:58 Page WE-18