web appendix first population-level effectiveness ... population-level effectiveness evaluation of a...
TRANSCRIPT

Page 1 of 21
Web Appendix
First Population-level Effectiveness Evaluation of a National Programme to Prevent
HIV Transmission from Mother to Child, South Africa
1. Web Appendix 1: PMTCT policy timeline
2. Web Appendix 2: Sample size calculation
3. Web Appendix 3: Number of facilities needed by Province
4. Web Appendix 4: Construction of socio economic status variable
5. Web Appendix 5: Imputations for gestational age and CD4 cell count
6. Web Appendix 6: MTCT by province, 2010

Page 1 of 21
Web Appendix 1: PMTCT policy time-line
Page 2 of 21
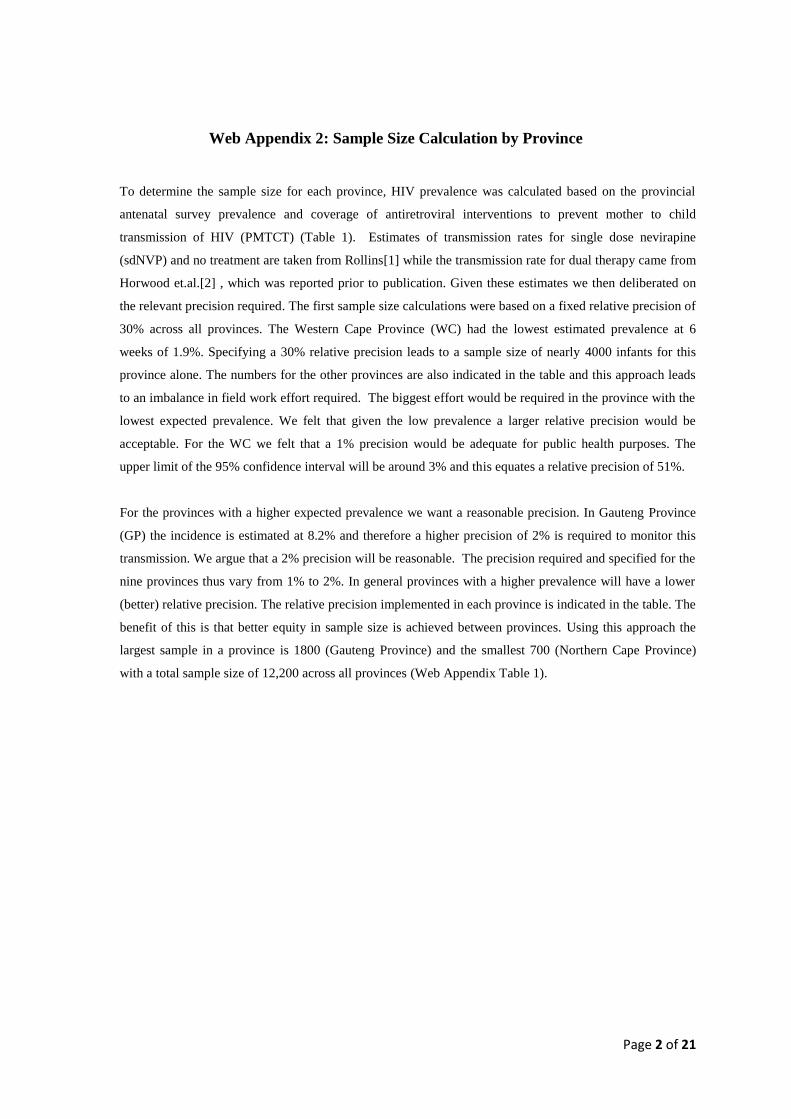
Web Appendix 2: Sample Size Calculation by Province
To determine the sample size for each province, HIV prevalence was calculated based on the provincial
antenatal survey prevalence and coverage of antiretroviral interventions to prevent mother to child
transmission of HIV (PMTCT) (Table 1). Estimates of transmission rates for single dose nevirapine
(sdNVP) and no treatment are taken from Rollins[1] while the transmission rate for dual therapy came from
Horwood et.al.[2] , which was reported prior to publication. Given these estimates we then deliberated on
the relevant precision required. The first sample size calculations were based on a fixed relative precision of
30% across all provinces. The Western Cape Province (WC) had the lowest estimated prevalence at 6
weeks of 1.9%. Specifying a 30% relative precision leads to a sample size of nearly 4000 infants for this
province alone. The numbers for the other provinces are also indicated in the table and this approach leads
to an imbalance in field work effort required. The biggest effort would be required in the province with the
lowest expected prevalence. We felt that given the low prevalence a larger relative precision would be
acceptable. For the WC we felt that a 1% precision would be adequate for public health purposes. The
upper limit of the 95% confidence interval will be around 3% and this equates a relative precision of 51%.
For the provinces with a higher expected prevalence we want a reasonable precision. In Gauteng Province
(GP) the incidence is estimated at 8.2% and therefore a higher precision of 2% is required to monitor this
transmission. We argue that a 2% precision will be reasonable. The precision required and specified for the
nine provinces thus vary from 1% to 2%. In general provinces with a higher prevalence will have a lower
(better) relative precision. The relative precision implemented in each province is indicated in the table. The
benefit of this is that better equity in sample size is achieved between provinces. Using this approach the
largest sample in a province is 1800 (Gauteng Province) and the smallest 700 (Northern Cape Province)
with a total sample size of 12,200 across all provinces (Web Appendix Table 1).

Page 3 of 21
Web Appendix Table 1: SAMPLE SIZE CALCULATION
Footnote: EC – Eastern Cape Province; FS – Free State Province; GP = Gauteng Province; KZN = Kwa-Zulu Natal Province; LP – Limpopo Province; MP – Mpumalanga Province; NW – North West Province;
NC – Northern Cape Province; WC – Western Cape Province. Prev. – prevalence ANC = antenatal clinic RP = relative precision sdNVP = single dose nevirapine Pop. = population RP = relative
precision DE = design effect ANC HIV seroprevalence from the 2008 antenatal survey, published in 2009 and immunisation coverage data from the 2007 District Health Information system (DHIS)
*WC and KZN assume full coverage dual therapy - Rollins KZN Study is 7%
** Design Effect = 1+(100-1)*(ICC=.01)=2
ANC
HIV
Prev.
2008
%
ANC
HIV
test
%
babies
on
PMTCT
Estimated
Coverage
(%tested X
%admin to
baby)
No
PMTCT
coverage
MTCT in
exposed
assuming sd NVP
=15% &
untreated=29%
(Rollins)*
Overall
Pop.
Prev.
30% relative precision in each
province Varying relative precision across provinces
Error
margin
with
30%
relative
precision
(RP) RP
SS
for
30%
RP
Sample
size for
design
effect
(DE)** of
2 & RP
30%
Error
margin
with RP
Varying
RP by
province
Sample
size using
varying
RP
without
DE
Sample
size using
varying
RP with
DE**
of 2
ZA 29 67 47 31.5% 24.6% 7.1% 2.1 30 575 1150
EC 24 73 35 25.6% 74.5% 25.4% 6.1% 1.8 30 680 1360 1.8 30% 700 1400
FS 29 70 52 36.4% 63.6% 23.9% 6.9% 2.1 30 560 1120 2.0 29% 617 1300
GP 31 65 27 17.6% 82.5% 26.5% 8.2% 2.5 30 463 926 2.0 24% 723 1800
KZN* 37 66 52 34.3% 65.7% 21.4% 7.9% 2.4 30 485 970 2.0 25% 699 1400
LP 20 74 54 40.0% 60.0% 23.4% 4.7% 1.4 30 878 1756 1.5 32% 703 1400
MP 34 56 36 20.2% 79.8% 26.2% 8.9% 2.7 30 428 856 2.0 22% 779 1600
NC 14 81 70 56.7% 43.3% 21.1% 2.9% 0.9 30 1336 2672 1.8 60% 350 700
NW 29.9 86 50 43.0% 57.0% 23.0% 6.9% 2.1 30 560 1119 2.0 29% 601 1200
WC* 15 97 75 72.8% 27.3% 13.0% 1.9% 0.6 30 1989 3978 1.0 51% 716 1400
TOTAL 7379 14758 12200

Page 4 of 21
Web Appendix 3: Number of facilities needed per province
Each province was divided into 3 strata:
Stratum 1 is clinics and community health centres (CHCs) that have annual Diphtheria – Tetanus –
Pertussis – 1st dose (DTP1) 130-300 based on the 2007 District Health Information System (DHIS)
data
Stratum 2 are clinics and CHCs with ≥300 DTP1 and HIV prevalence below the national (<29%) rate
based on the 2007 DHIS data and the 2008 antenatal survey data (published 2009) respectively
Stratum 3 are clinics and CHCs with ≥300 DTP1st dose (based on the 2007 DHIS data) and HIV
prevalence above the national rate based on 2008 antenatal survey data
Small facilities were excluded for issues relating to feasibility and cost-efficiency of data collection
Provinces that did not have a third stratum
Western Cape Province (WC), Limpopo Province(LP) and Northern Cape Province (NC) have no third
stratum because there is no district with ≥29% HIV prevalence and high delivery rate (>300 Immunization)
in the province. However, for WC, sub district level data from the antenatal clinics HIV sero-prevalence
survey (ANC survey) was available, which indicated that Khayelitsha sub-district has ≥29% HIV
prevalence. Thus the third stratum was created from large clinics in Khayelitsha. We were unable to do the
same for Limpopo and NC, as we didn’t have sub-district level HIV prevalence data (from the ANC survey)
for these two provinces.
Web Appendix Tables 2-10 show the number of clinics that needed to be randomly selected in each stratum
within each province, given the uptake of six weeks immunisation in DHIS 2007 (multistage probability
proportional to size sampling).

Page 5 of 21
Web Appendix - Tables 2-10: Number of facilities needed to be sampled from each province to collect data within 3wks (4 weeks for Northern Cape) duration from each
facility. Note DTP1 = 1st DTP at six weeks post-delivery
Web Appendix Table 2: EASTERN CAPE
Strata
Total Annual DTP1 for the
province Percentage
Adjusted
Percentage
(Column D)
Sample size
proportional
Sample size
adjusted
proportional
Median
yearly clinic
DTP1 number
Median 3 week
clinic DTP1
number
number of
facilities
need to be
visited
number of
facilities need to
be visited based
on adjusted
distribution
(Column J)
Small clinics (<130
DTP1#) 25862 20 20
Medium size clinics
(130-300 annual
DTP1#) 41620 36.38% 30% 509 420 186.5 11 47 39
large size (Annual
DTP1 #>300) but low
HIV prevalence 41646 36.40% 43% 510 602 459 26 19 23
large size (Annual
DTP1 #>300) but high
HIV prevalence 31141 27% 27% 381 378 402 23 16 16
Over all Total 114407 100% 100% 1400 1400 83
78
(or 98 if small
facilities are
included)

Page 6 of 21
Web Appendix Table 3: FREE STATE
Strata
Total Annual DTP
for the province Percentage
Sample size
proportional
Median yearly clinic
DTP1 number
Median 3 week clinic
DTP1 number
number of facilities need
to be visited
Small clinics (<130
DTP1#) 4880 20
Medium size clinics (130-
300 annual DTP1#) 14418 27.34% 355 201 12 31
large size (Annual DTP1
#>300) but high HIV
prevalence 38326 72.66% 945 404 23 41
Overall Total 52744 100% 1300
72
(or 92 if small facilities
are included)
In Free state, we have only two strata - we grouped the last two strata as one stratum: The second strata (large and
low HIV prevalence ) in Free state had only 0.74% weighting which translates to sampling only 1 facility from the
second stratum. Since sampling cannot be done for one facility, the second stratum is combined with the third stratum
and thus we have only two strata for Free state.

Page 7 of 21
Web AppendixTable 4: GAUTENG
Strata
Total Annual DTP
for the province Percentage
Sample size
proportional
Median yearly clinic
DTP1 number
Median 3 week clinic
DTP1 number
number of facilities need
to be visited
Small clinics (<130
DTP1#) 1926 20
Medium size clinics (130-
300 annual DTP1#) 15359 8.95% 161 237.5 14 12
large size (Annual DTP1
#>300) but low HIV
prevalence 33023 19.25% 347 549 32 11
large size (Annual DTP1
#>300) but high HIV
prevalence 123199 71.80% 1292 629 36 36
Over all Total 171581 100% 1800
59 (or 79 if small facilities
are included)
Page 8 of 21
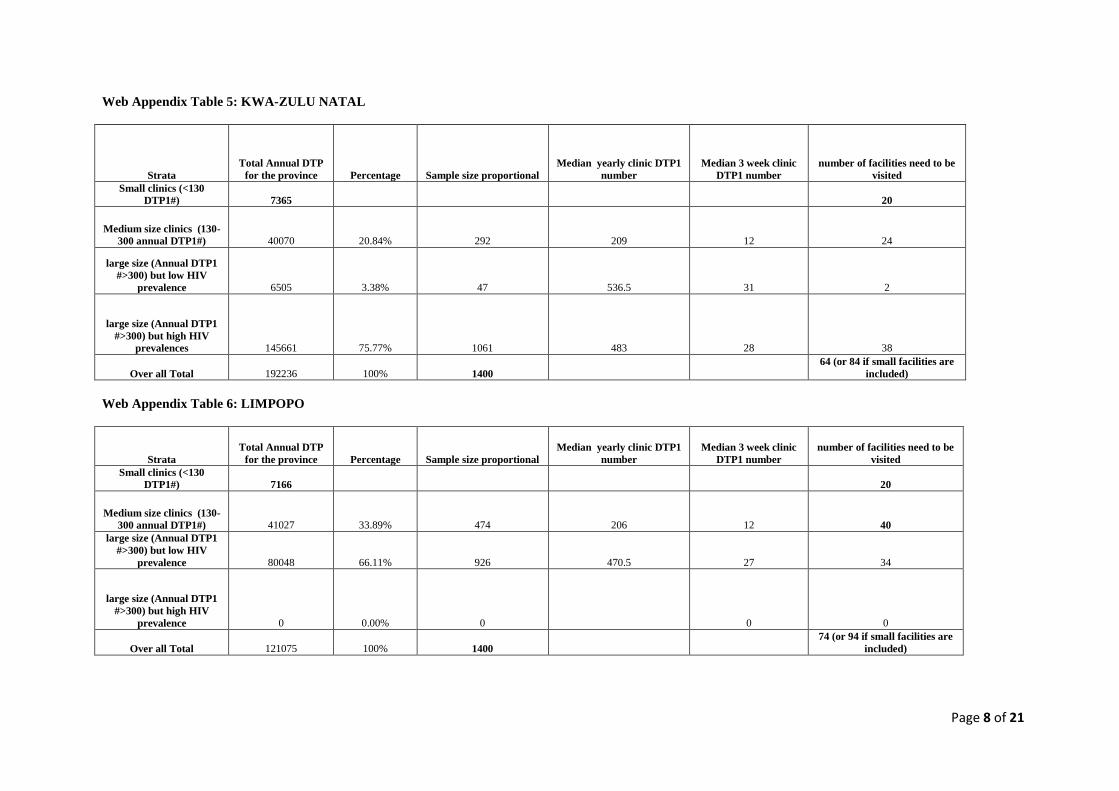
Web Appendix Table 5: KWA-ZULU NATAL
Strata
Total Annual DTP
for the province Percentage Sample size proportional
Median yearly clinic DTP1
number
Median 3 week clinic
DTP1 number
number of facilities need to be
visited
Small clinics (<130
DTP1#) 7365 20
Medium size clinics (130-
300 annual DTP1#) 40070 20.84% 292 209 12 24
large size (Annual DTP1
#>300) but low HIV
prevalence 6505 3.38% 47 536.5 31 2
large size (Annual DTP1
#>300) but high HIV
prevalences 145661 75.77% 1061 483 28 38
Over all Total 192236 100% 1400 64 (or 84 if small facilities are
included)
Web Appendix Table 6: LIMPOPO
Strata
Total Annual DTP
for the province Percentage Sample size proportional
Median yearly clinic DTP1
number
Median 3 week clinic
DTP1 number
number of facilities need to be
visited
Small clinics (<130
DTP1#) 7166 20
Medium size clinics (130-
300 annual DTP1#) 41027 33.89% 474 206 12 40
large size (Annual DTP1
#>300) but low HIV
prevalence 80048 66.11% 926 470.5 27 34
large size (Annual DTP1
#>300) but high HIV
prevalence 0 0.00% 0 0 0
Over all Total 121075 100% 1400
74 (or 94 if small facilities are
included)

Page 9 of 21
Web Appendix Table 7: MPUMALANGA
Strata
Total Annual DTP
for the province Percentage
Adjusted
percentage
(Column D)
Sample size
proportional
Sample size
adjusted proportional
Median
yearly clinic
DTPDTP1
number
Median 3 week
clinic DTPDTP1
number
number of
facilities
need to be
visited
number of facilities need
to be visited based on
adjusted distribution
(Column J)
Small clinics (<130
DTP1#) 4545 20
Medium size clinics (130-
300 annual DTP1#) 20858 26.73% 20% 428 320 225 13 33 25
large size (Annual DTP1
#>300) but low HIV
prevalences 0 0.00% 0 0 0 0 0 0
large size (Annual DTP1
#>300) but high HIV
prevalence 57172 73.27% 80% 1172 1280 439 25 46 51
Over all Total 78030 100% 100% 1600 1600 79 76

Page 10 of 21
Web Appendix Table 8: NORTHERN CAPE
Strata
Total Annual DTP
for the province Percentage
Sample size
proportional
Median yearly clinic
DTP1 number
Median 4 week clinic
DTP1 number
number of facilities need to
be visited
Small clinics (<130
DTP1#) 2475 20
Medium size clinics (130-
300 annual DTP1#) 7766 51.82% 363 207.5 16 23
large size (Annual DTP1
#>300) but low HIV
prevalence 7221 48.18% 337 400 32 11
large size (Annual DTP1
#>300) but high HIV
prevalence 0 0.00% 0 0
Over all Total 14987 100% 700 34 (or 54 if small facilities
are included)
Sample size in Northern Cape
Northern Cape had 96 facilities to be sampled which was not an achievable target, given the vastness of the province, within the allocated time. A decision was taken to
reduce the number of facilities that need to be visited to 53. Because the facilities are very far apart it was logistically not feasible to visit 53 facilities; thus we increased the
duration of field work per facility to 4 weeks and reduced the number of facilities to 34. All small facilities were excluded from this 34

Page 11 of 21
Web Appendix Table 9: NORTH WEST
Strata
Total Annual DTP
for the province Percentage
Sample size
proportional
Median yearly clinic
DTP1 number
Median 3 week clinic
DTP1 number
number of facilities need to be
visited
Small clinics (<130
DTP1#) 8758 20
Medium size clinics (130-
300 annual DTP1#) 22925 34.26% 411 204.5 12 35
large size (Annual DTP1
#>300) but low HIV
prevalence 24100 36.02% 432 413 24 18
large size (Annual DTP1
#>300) but high HIV
prevalence 19887 29.72% 357 432.5 25 14
Over all Total 66912 100% 1200 67 (or 87 if small facilities are
included)
Page 12 of 21
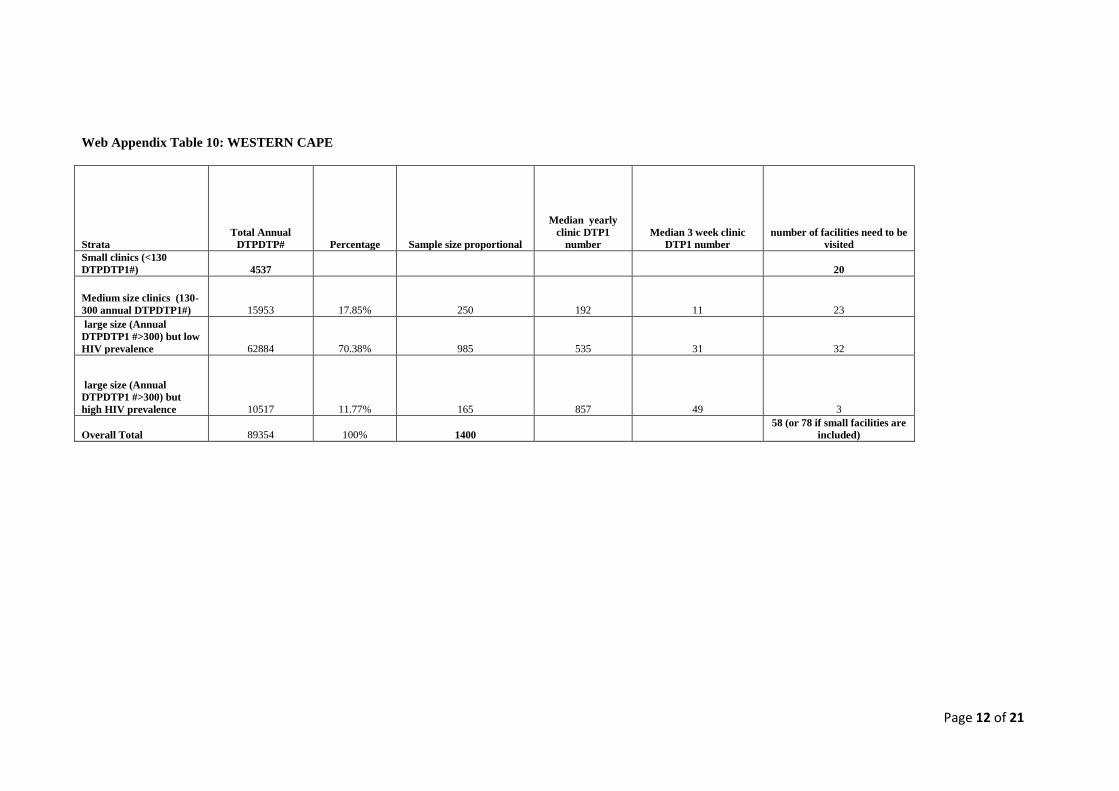
Web Appendix Table 10: WESTERN CAPE
Strata
Total Annual
DTPDTP# Percentage Sample size proportional
Median yearly
clinic DTP1
number
Median 3 week clinic
DTP1 number
number of facilities need to be
visited
Small clinics (<130
DTPDTP1#) 4537 20
Medium size clinics (130-
300 annual DTPDTP1#) 15953 17.85% 250 192 11 23
large size (Annual
DTPDTP1 #>300) but low
HIV prevalence 62884 70.38% 985 535 31 32
large size (Annual
DTPDTP1 #>300) but
high HIV prevalence 10517 11.77% 165 857 49 3
Overall Total 89354 100% 1400 58 (or 78 if small facilities are
included)

Page 13 of 21
Adjusting weighting for Mpumalanga and Eastern Cape
The number of facilities needed to be sampled for Mpumalanga (MP) and Eastern Cape (EC) was 79 and 83
respectively. Most of the facilities were from the medium-sized clinic stratum. It was realised that sample
size might be difficult to achieve with the available logistics capacity; thus we have slightly shifted the
weighting to the large clinics (see column D) and hence the number of facilities need to be sampled from
medium facilities decreased from 47 to 39 for EC and from 33 to 25 for MP (see column J). This was
considered to be logistocally feasible.

Page 14 of 21
Web Appendix 4: Construction of Socio-economic status variable
The SES variable was constructed using a clustering algorithm (Spath, H. (1980), Cluster Analysis Algorithms, Chichester, Eng.: Ellis Horwood.; Hartigan, J. A. (1985),
"Statistical Theory in Clustering," Journal of Classification, 2, 63–76. SAS STAT 9.2 Documentation.) that considered 10 interview items that measured a spectrum of socio-
economic indicators, and used the distance between an observations value on each of these variables and the overall mean for that variable to create three SES levels for the
population. Web Appendix Table 11 shows the distribution of these variables across the 3 levels of our calculated SES variable for the entire study sample. The largest
differences between the lower and lowest SES groups were the availability of electricity or gas for cooking, and access to home amenities such as a stove, radio, television or
telephone. There was not a significant difference between the lower and lowest SES groups in terms of reported food scarcity, however, women in the lowest SES group
were less likely to receive support from a male partner and more likely to receive a Child support grant from the South African government.
(http://www.services.gov.za/services/content/Home/ServicesForPeople/Socialbenefits/childsupportgrant/en_ZA ;
http://www.info.gov.za/view/DownloadFileAction?id=90553

Page 15 of 21
Web Appendix Table 11: Distribution of individual variables that contributed to the overall socio-economic status (SES) score levels of average, lower than average
and lowest SES.
Variable SES Category
Average Lower Lowest
Included in the SES factor analysis
Home Material Brick 88.2 (86.8-89.7) 0.0 91.7(89.8-93.5)
Informal material/corrugated iron/wood 11.8 (10.3-13.2) 51.0 (45.1-56.9) 8.3 (6.5-10.1)
Traditional/Mud 0.0 49.0 (43.0-54.9) 0.0
Water Source )Piped vs. not
piped
Piped 91.8 (90.5-93.0) 32.5 (27.6-37.4) 41.0 (36.5-45.5)
Toilet Type Flush 73.1 (71.0-75.3) 6.5(5.2-7.9) 12.5 (9.4-15.6)
Pit Latrine 26.8 (24.6-29.0) 84.0(80.8-87.2) 76.9 (73.6-80.3)
None/Other 0.0 9.4(6.5-12.4) 10.6 (7.9-13.2)
Cooking Fuel Electricity/Gas 98.2 (97.7-98.6) 88.3 (79.7-86.8) 74.8 (71.2-78.5)
Wood/coal 1.8(1.3-2.2) 16.1(12.6-19.6) 24.8 (21.1-28.4)
Household owns Refrigerator 86.4 (85.3-87.7) 23.5(20.2-26.9) 46.7 (42.7-50.7)
Radio 86.4(85.5-87.4) 63.0 (59.9-66.0) 46.5 (42.7-50.3)
Television 93.5(92.8-94.3) 42.1(38.4-45.9) 27.3(24.4-30.2)
Household owns.. cont/ Stove 98.4 (98.0-98.7) 86.2(83.1-89.3) 40.1(35.8-44.4)
Landline Telephone / Cell phone 90.9(89.9-91.8) 80.7(77.6-83.7) 50.6(46.0-55.2)
Car 18.3(16.9-19.7) 2.8 (1.9-3.7) 3.1(2.0-4.1)
Variables expected to be associated with socio-economic status used to test the face validity of the clustering procedure.
In the last year was there a time when the family ran out of food and had to ask for
help? (Yes)
13.1 (11.5-14.8) 25.4(21.5-29.2) 20.1(17.2-23.0)
Source of maternal income
Mother’s employment 20.3 (19.1-21.6) 10.1(8.3-11.8) 10.3 (8.8-11.9)
Partner/Husband/Ex-husband 65.2 (63.4-67.0) 61.7 (58.7-64.6) 41.8 (38.7-44.9)
Child Support grant 11.5(10.2-12.7) 16.5 (13.8-19.1) 27.5 (24.4-30.7)

Page 16 of 21
Web Appendix 5: Multiple Imputations
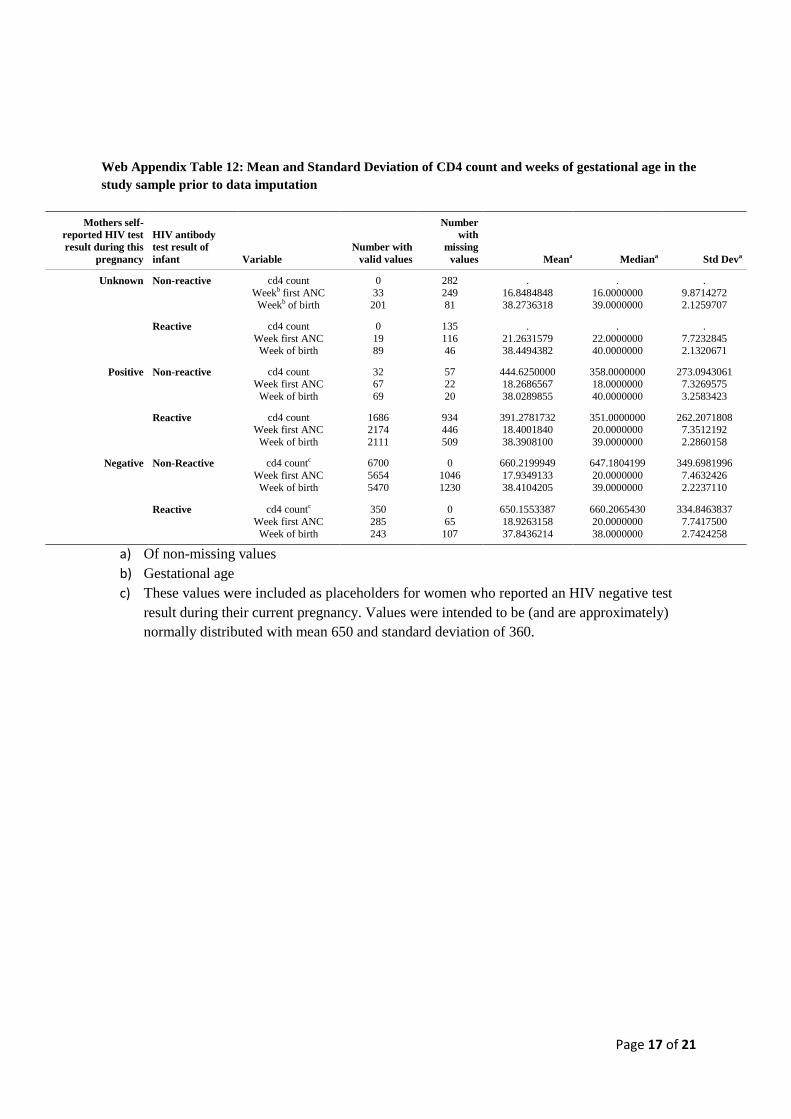
In order to impute missing CD4 count data for HIV-infected mothers only, we created dummy values for
mothers that had reported a negative HIV test result during their current pregnancy (n=7050) that were designed
to represent a normally distributed range of CD4 counts for healthy South Africans with mean 650 and standard
deviation of 360.[3, 4] This resulted in a need to impute CD4 for only 1408 women, representing 13.8% of the
total sample but 47% of all infected women (Web Appendix Table 12). Thus while imputed CD4 was used for
imputing gestational age at first antenatal clinic (ANC) visit for the entire sample, we did not include the
imputed CD4 variable as potential confounder in analyses limited to HIV-infected mothers as we felt that too
large a percentage of the data was missing to allow for reliable inference in this sub-population. After filling in
cd4 counts for the part of the population for which these data were not relevant, roughly 20% of the sample was
missing data for at least one variable of interest (Supplemental Table 13). Missing data were imputed to a
monotone missing pattern using Marcov Chain Monte Carlo imputation of 5 replicates of the original data (See
Web Appendix Table 13 for the monotone missing data patterns). The remaining missing values of birthweight,
CD4 count for HIV infected mothers, gestational age at birth and then gestational age of the infant at first ANC
visit were imputed using regression techniques that used imputation models which included all exposures of
interest (ARV status of the mother, breastfeeding status, and type of delivery) and potential confounders (SES
strata, mothers age, education and marital status and whether or not the pregnancy was planned) of the analytic
models described in the main text. The majority of those with any missing data to impute (13.4% of the total
study sample) were missing data on gestational age of the infant at birth, an additional 4.5% were missing data
on both gestational age of the infant at birth and at the mother’s first ANC visit. As expected and evidenced by
the similarities of the data in Web Appendix Tables 12 and 14, the imputation did not change the distribution of
values in the overall sample, with similar mean, median and standard deviation for variables of interest in all
categories of HIV test results in the complete case and imputation data sets. The final model reported in Table 2
of the main text was developed using methods for analysis of imputed data because the data contained 1944
imputed values of gestational age at first ANC visit for the entire sample, including data for 620 of 3088 (20%)
with infants categorized as exposed to HIV. In this model there were also 157 (5%) of values imputed for
birthweight as a continuous variable prior to categorization of this variable into the dichotomous values of
≥2.5kg and <2.5kg.
Page 17 of 21
a) Of non-missing values
b) Gestational age
c) These values were included as placeholders for women who reported an HIV negative test
result during their current pregnancy. Values were intended to be (and are approximately)
normally distributed with mean 650 and standard deviation of 360.
Mothers self-
reported HIV test
result during this
pregnancy
HIV antibody
test result of
infant Variable
Number with
valid values
Number
with
missing
values Meana Mediana Std Deva
Unknown Non-reactive cd4 count
Weekb first ANC Weekb of birth
0
33 201
282
249 81
.
16.8484848 38.2736318
.
16.0000000 39.0000000
.
9.8714272 2.1259707
Reactive cd4 count
Week first ANC Week of birth
0
19 89
135
116 46
.
21.2631579 38.4494382
.
22.0000000 40.0000000
.
7.7232845 2.1320671
Positive Non-reactive cd4 count Week first ANC
Week of birth
32 67
69
57 22
20
444.6250000 18.2686567
38.0289855
358.0000000 18.0000000
40.0000000
273.0943061 7.3269575
3.2583423
Reactive cd4 count Week first ANC
Week of birth
1686 2174
2111
934 446
509
391.2781732 18.4001840
38.3908100
351.0000000 20.0000000
39.0000000
262.2071808 7.3512192
2.2860158
Negative Non-Reactive cd4 countc
Week first ANC
Week of birth
6700
5654
5470
0
1046
1230
660.2199949
17.9349133
38.4104205
647.1804199
20.0000000
39.0000000
349.6981996
7.4632426
2.2237110
Reactive cd4 countc
Week first ANC
Week of birth
350
285
243
0
65
107
650.1553387
18.9263158
37.8436214
660.2065430
20.0000000
38.0000000
334.8463837
7.7417500
2.7424258
Web Appendix Table 12: Mean and Standard Deviation of CD4 count and weeks of gestational age in the
study sample prior to data imputation

Page 18 of 21
Web Appendix Table 13: Missing data patterns for imputation after Markov Chain Monte Carlo
imputation to create 5 replicate datasets with a monotone missing data pattern
Missing Data Patterns
Group
Ses
Strata
Mother’s
Age
Marital
Status
Planned
Pregnancy
Delivery
Type
Breast
Feeding Rx Regimen
Birth
weight
CD4
count
Gestag
e at
first
ANC
Gest.
Age at
birth Count
Percent
of Total
1 X X X X X X X X X X X 43160 80.41
2 X X X X X X X X X X . 7165 13.35
3 X X X X X X X X X . . 2315 4.31
4 X X X X X X X X . . . 805 1.50
5 X X X X X X X . . . . 230 0.43

Page 19 of 21
Web Appendix Table 14: Mean and Standard Deviation of CD4 count and weeks of gestational age in the
study sample after data imputation
Mothers self
reported HIV
Status
HIV antibody
results of the
infant Variable
Number of
observationsa
Missing
data Mean Median
Standard
Deviation
Unknown Negative cd4 count Weekb first ANC
Weekb of birth
1410 1410
1410
0 0
0
681.1248227 17.2829787
38.2156028
672.0000000 17.0000000
38.0000000
341.2960686 8.1222076
2.1223166
Positive cd4 count Week first ANC
Week of birth
675 675
675
0 0
0
656.2814815 15.8059259
38.3377778
646.0000000 16.0000000
39.0000000
342.9423966 8.8884929
2.1867509
Positive Negative cd4 count
Week first ANC
Week of birth
445
445
445
0
0
0
450.3865169
18.2022472
38.1910112
384.0000000
18.0000000
40.0000000
291.1589668
7.5309867
3.0346216
Positive cd4 count
Week first ANC
Week of birth
13100
13100
13100
0
0
0
416.4175573
18.4049618
38.3758779
372.0000000
20.0000000
39.0000000
279.2226348
7.3709509
2.2887447
Negative Negative cd4 countc
Week first ANC Week of birth
33500
33500 33500
0
0 0
660.2235821
17.9696418 38.3952836
647.0000000
20.0000000 39.0000000
349.6868243
7.4491663 2.2203710
Positive cd4 countc
Week first ANC Week of birth
1750
1750 1750
0
0 0
650.1714286
18.8777143 37.8668571
660.5000000
20.0000000 38.0000000
334.4629845
7.7032524 2.5939166
a) In 5 imputed datasets representing copies of the original data to which the imputed data were added.
b) Of Gestation
c) These values for CD4 count were not imputed but were set to a standard normal distribution with mean
650 and standard deviation 360.
Web Appendix 6: MTCT by province
Web Appendix Table 15: HIV exposure and MTCT by province
Province Infant HIV exposure % (95% CI) MTCT (%) 95% CI
Eastern Cape* 30.5 (26.9-34.2) 4.7 (2.4-7.0)
Free State 31.3 (29.1-33.5) 5.9 (3.8-8.0)
Gauteng 30.4 (27.9-33.0) 2.5 (1.5-3.6)
KwaZulu-Natal 44.3 (40.2-48.4) 2.9 (1.7-4.0)
Limpopo 23.9 (21.8-25.9) 3.6 (1.4-5.8)
Mpumalanga 37.0 (34.3-39.7) 5.7 (4.1-7.3)
Northern Cape* 16.0 (13.7-18.3) 1.4 (0.1-3.4)
Northwest 31.3 (29.0-33.5) 4.4 (2.9-5.9)
Western Cape 21.0 (17.0-25.0) 3.9 (1.9-5.8)
South Africa 32.0 (30.7-33.3) 3.5 (2.9-4.1)

Page 20 of 21
REFERENCES 1. Rollins N, Little K, Mzoloa S, Horwood C, Newell M-L: Surveillance of mother-to-child
transmission prevention programmes at immunization clinics: the case for universal
screening. AIDS 2007, 21:1341-1347.
2. Horwood C, Vermaak K, Butler L, Haskins L, Phakathia S, Rollins N: Elimination of
paediatric HIV in KwaZulu-Natal, South Africa: large-scale assessment of interventions for
the prevention of mother-to-child transmission. Bulletin of the World Health Organisation
2012, 90:168-175.
3. Zaidi J, Grapsa E, Tanser F, Newell M, Bärnighausen T: Dramatic increases in HIV
prevalence after scale-up of antiretroviral treatment: a longitudinal population-based HIV
surveillance study in rural kwazulu-natal. AIDS 2013.
4. Vinnard C, Wileyto E, Bisson G, Winston C: First Use of Multiple Imputation with the
National Tuberculosis Surveillance System. Epidemiology Research Int 2013.