web-based traffic monitoring using ntopng · web-based traffic monitoring using ntopng simone...
TRANSCRIPT
Arnhem, The Netherlands • October 17, 2016
meeting
Web-Based Traffic Monitoring Using ntopng
Simone Mainardi, PhD [email protected]
ntop Users Group Meeting
Arnhem, The Netherlands • October 17, 2016
meeting
Outlook
• ntopng architecture and design
• ntopng as a flow collector
• Using ntopng
• Advanced monitoring with ntopng
Arnhem, The Netherlands • October 17, 2016
meeting
ntopng Design Goals
• Clean separation between the monitoring engine and the reporting facilities
• Robust, crash-free engine
• Platform scriptability for enabling extensions or changes at runtime without restart
• Realtime: most monitoring tools aggregate data (5 mins usually) and present it when it’s too late
• Many new features including HTML 5-based dynamic GUI, categorization, Deep Packet Inspection (DPI)

Arnhem, The Netherlands • October 17, 2016
meeting
ntopng Architecture
• Three different and self-contained components, communicating with clean API calls.
Users
HTTPLua-based Web Reports
nDPI-based C++ Monitoring Engine
PF_RING Kernel Module and Drivers
InternetTraffic
Lua API Calls
PF_RING C API Calls(Linux) Kernel
Data Cache
Arnhem, The Netherlands • October 17, 2016
meeting
ntopng Monitoring Engine
• Coded in C++ and based on the concept of flow (set of packets with the same 5-tuple)
• Flows are inspected with a home-grown DPI-library named nDPI aiming to discover the “real” application protocol (no ports are used)
• Information is clustered per
• (Capture) Network Device
• Flow
• Host
• Network
• High-level Aggregations
Arnhem, The Netherlands • October 17, 2016
meeting
Lua-based ntopng Scriptability [1/3]
• A design principle of ntopng is the clean separation of the GUI from engine
• This means that ntopng can (also) be used (via HTTP) to feed data into third party apps such as Nagios or OpenNMS
• All data export from the engine happens via Lua
• Lua methods invoke the ntopng C++ API in order to interact with the monitoring engine
Arnhem, The Netherlands • October 17, 2016
meeting
Lua-based ntopng Scriptability [2/3]
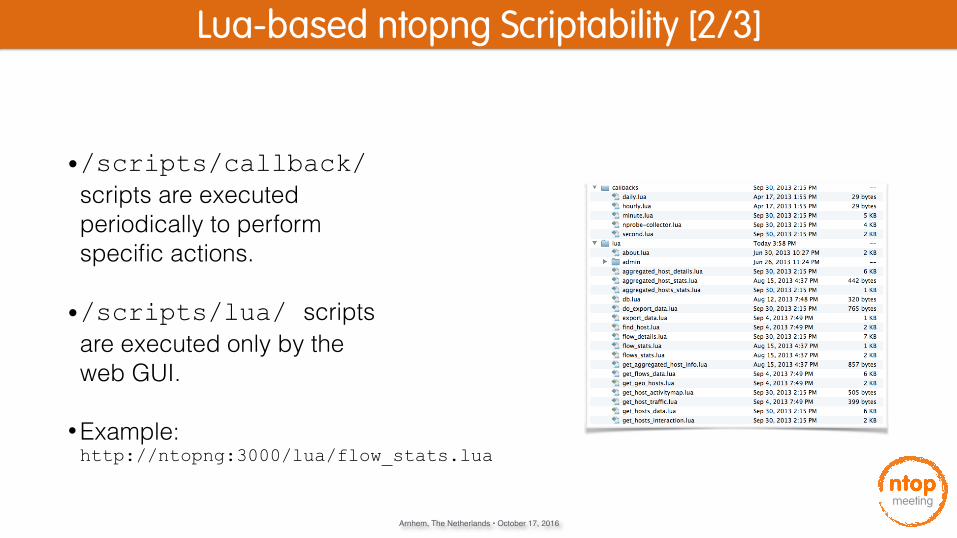
•/scripts/callback/ scripts are executed periodically to performspecific actions.
•/scripts/lua/ scriptsare executed only by theweb GUI.
• Example:http://ntopng:3000/lua/flow_stats.lua
Arnhem, The Netherlands • October 17, 2016
meeting
Lua-based ntopng Scriptability [3/3]
•ntopng defines (in C++) two Lua classes:
•interface
• Hook to objects that describe flows and hosts
• Access to live monitoring data
•ntop
• General functions used to interact with ntopng configuration
•Lua objects are usually in “read-only” mode
•C++ sets their data, Lua reads data (e.g. host.name)
•Some Lua methods (e.g. interface.restoreHost()) can however modify the information stored in the engine
Arnhem, The Netherlands • October 17, 2016
meeting
Using ntopng for traffic analysis, troubleshooting, and flow collection
Arnhem, The Netherlands • October 17, 2016
meeting
Using ntopng for traffic analysis, troubleshooting, and flow collection
Arnhem, The Netherlands • October 17, 2016
meeting
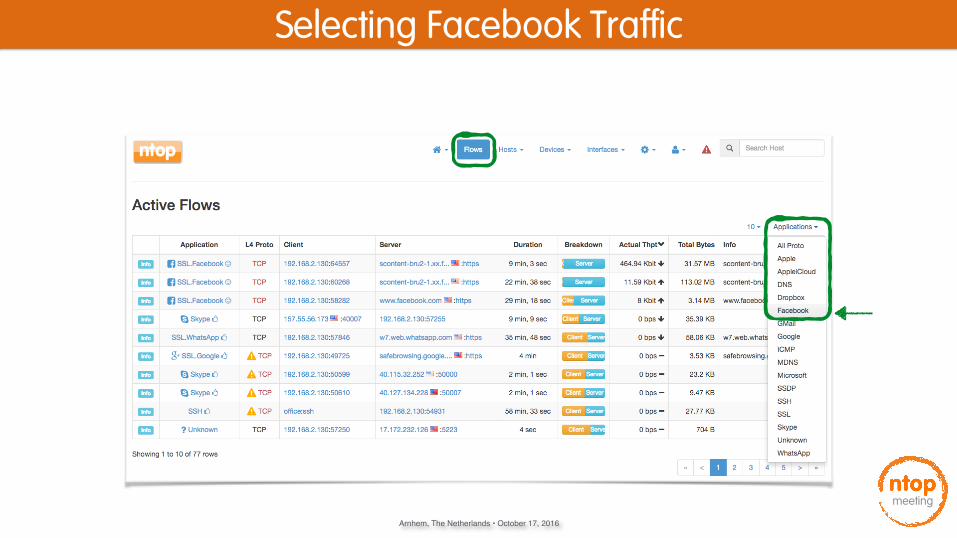
Selecting Facebook Traffic

Arnhem, The Netherlands • October 17, 2016
meeting
Analyzing Facebook Traffic
SSL: encrypted Facebook : fun
DNS: domain Facebook : fun
certificate name for SSL
A query for DNS
Arnhem, The Netherlands • October 17, 2016
meeting
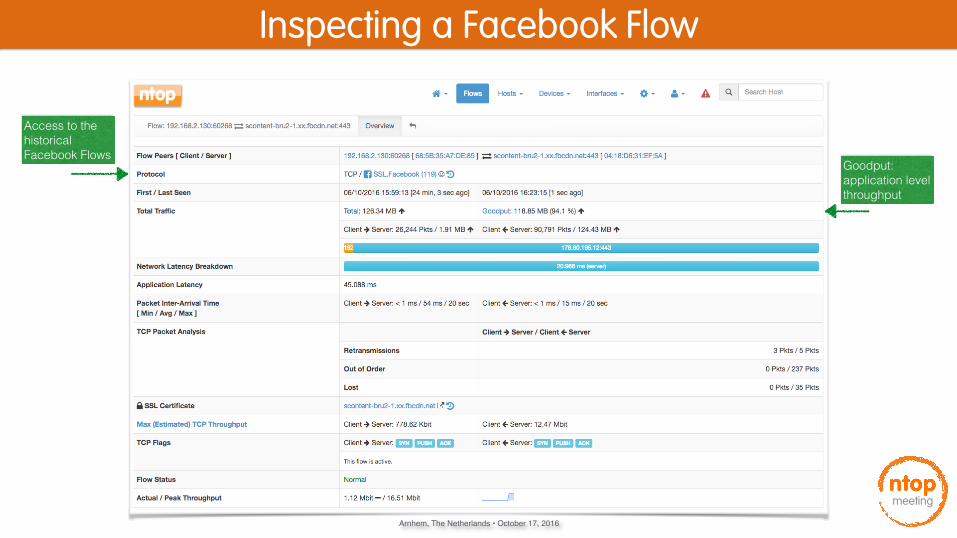
Inspecting a Facebook Flow
Goodput: application level throughput
Access to the historical Facebook Flows
Arnhem, The Netherlands • October 17, 2016
meeting
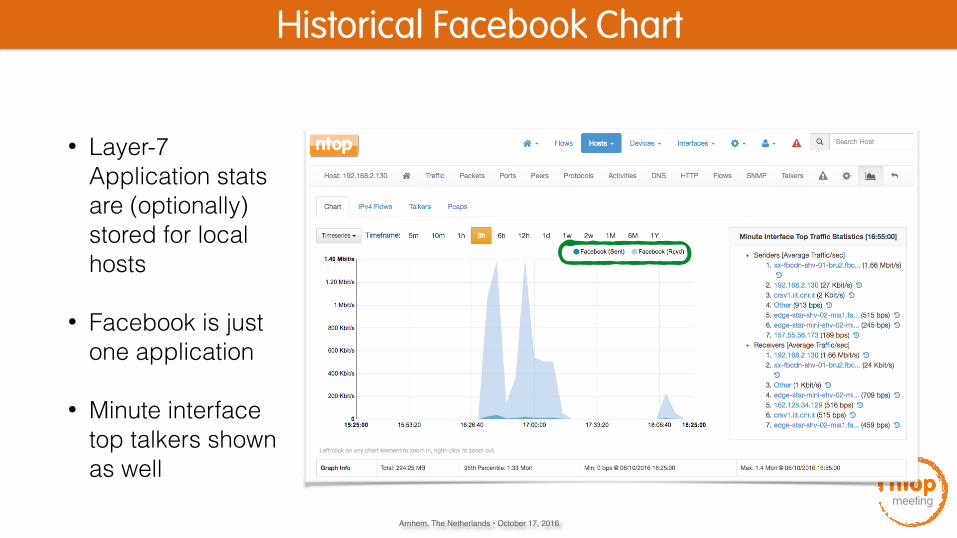
Historical Facebook Chart
• Layer-7 Application stats are (optionally) stored for local hosts
• Facebook is just one application
• Minute interface top talkers shown as well
Arnhem, The Netherlands • October 17, 2016
meeting
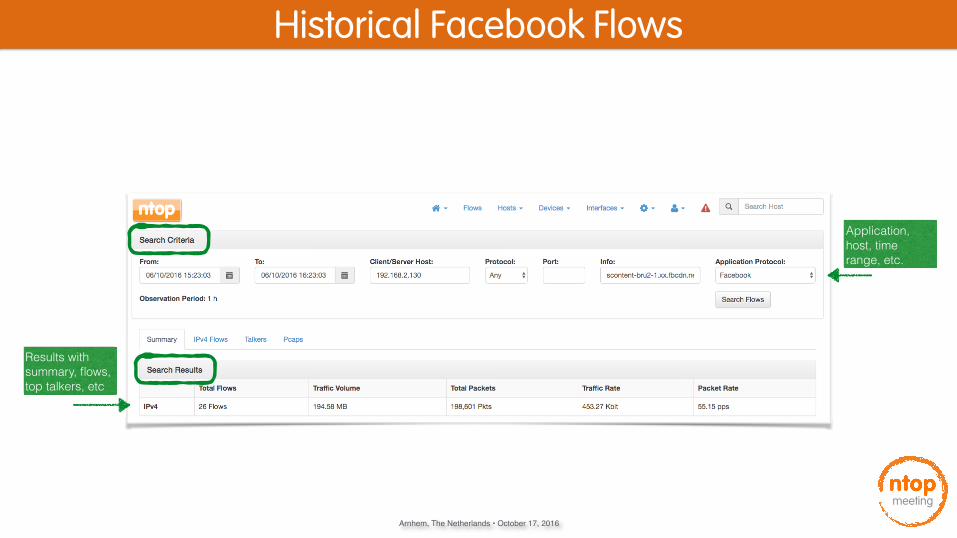
Historical Facebook Flows
Application, host, time range, etc.
Results with summary, flows, top talkers, etc

Arnhem, The Netherlands • October 17, 2016
meeting
Historical Facebook Flows
Arnhem, The Netherlands • October 17, 2016
meeting
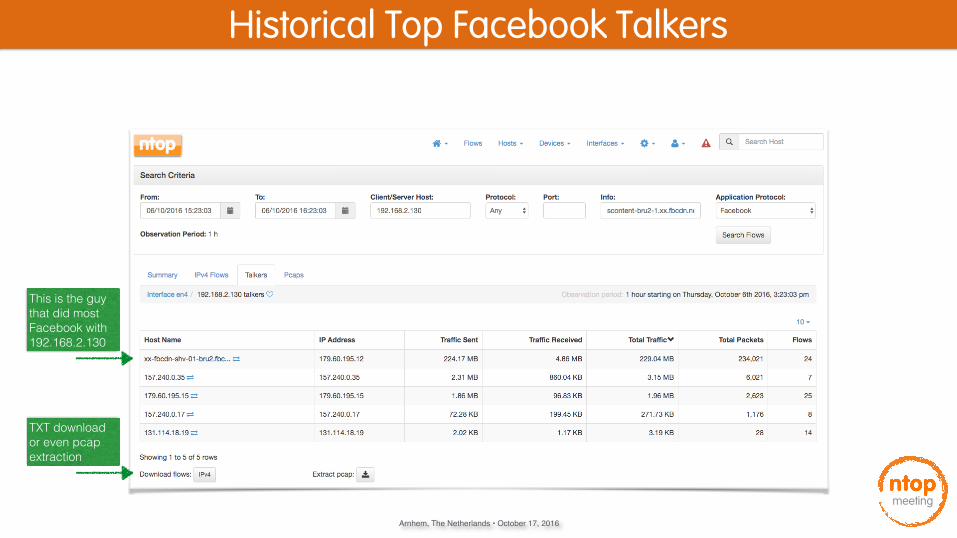
Historical Top Facebook Talkers
This is the guy that did most Facebook with 192.168.2.130
TXT download or even pcap extraction

Arnhem, The Netherlands • October 17, 2016
meeting
Traffic Analysis: Take Home
• Ability to Inspect Traffic up to the Layer-7
• Realtime flows with information on peers, throughput, TCP status, HTTP requests, SSL/TLS certificates
• Historical charts: bytes, packets per host / network / application protocol / etc
• Ability to record flows and browse / export them according to multiple search criteria.
Arnhem, The Netherlands • October 17, 2016
meeting
Using ntopng for traffic analysis, troubleshooting, and flow collection

Arnhem, The Netherlands • October 17, 2016
meeting
Sorting out Network and Security Issues
• Network Issues
• Application Latency / Round Trip Time / Retransmissions
• Bandwidth usage
• Top Talkers / AS / Networks / Countries / OSes etc.
• Security Issues
• Scans / SYN floods / flow floods
• post-mortem analyses of trace files to investigate security incidents

Arnhem, The Netherlands • October 17, 2016
meeting
Analysing Traces of a Security Incident
• ntopng is able to process pcap trace files and visualise them as if they were live captures
• ntopng -i /path/to/the/capture.pcap
• Looking at the issue from an additional perspective
• Wireshark offers a packet-centered view
• ntopng offers a flow-centered view

Arnhem, The Netherlands • October 17, 2016
meeting
Getting the Traces
• Incident:http://www.malware-traffic-analysis.net/2016/09/20/index.html
• Trace: 2016-09-20-traffic-analysis-exercise.pcap
• Courtesy of Brad (@malware_traffic malware-traffic-analysis.net)
• What happened?
Arnhem, The Netherlands • October 17, 2016
meeting
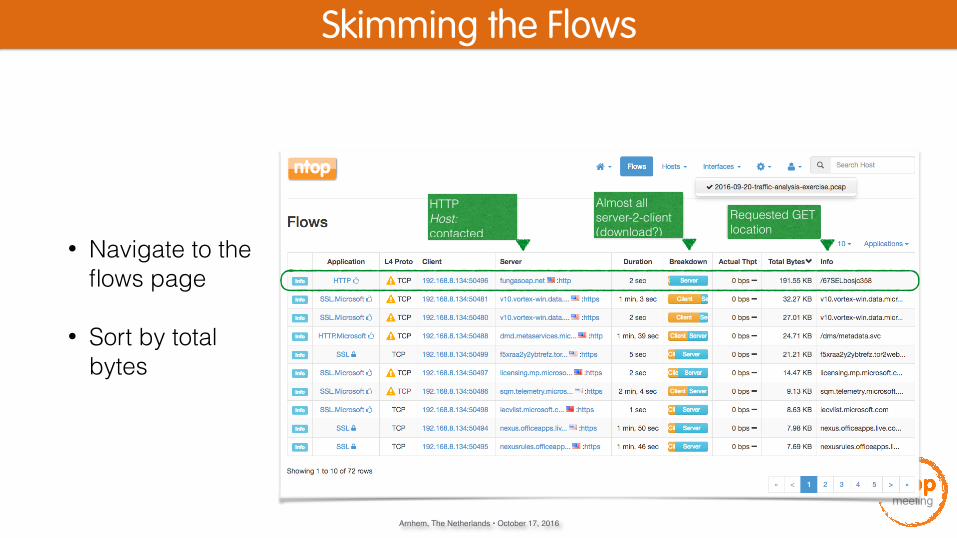
Skimming the Flows
• Navigate to the flows page
• Sort by total bytes
Almost all server-2-client (download?)
HTTPHost: contacted
Requested GET location
Arnhem, The Netherlands • October 17, 2016
meeting
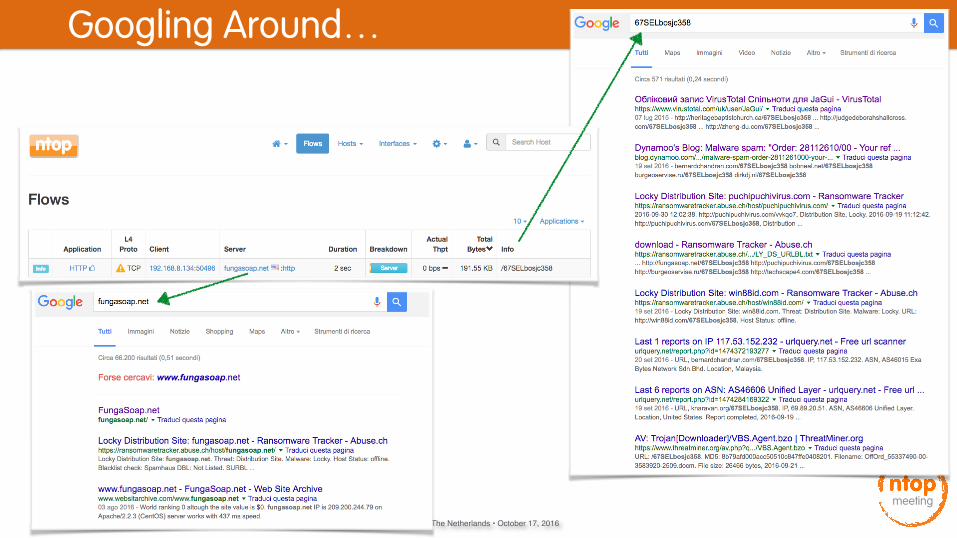
Googling Around…
Arnhem, The Netherlands • October 17, 2016
meeting
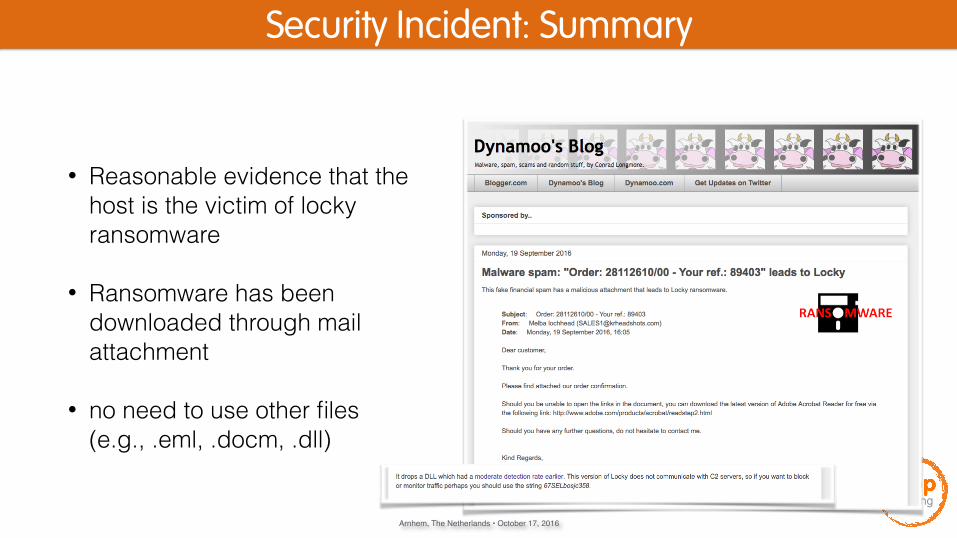
Security Incident: Summary
• Reasonable evidence that the host is the victim of locky ransomware
• Ransomware has been downloaded through mail attachment
• no need to use other files (e.g., .eml, .docm, .dll)
Arnhem, The Netherlands • October 17, 2016
meeting
Monitoring VoIP Calls
• ntopng can be used to visualize VoIP calls
• Visualization of SIP and RTP that are the de-facto standards in the VoIP industry
Arnhem, The Netherlands • October 17, 2016
meeting
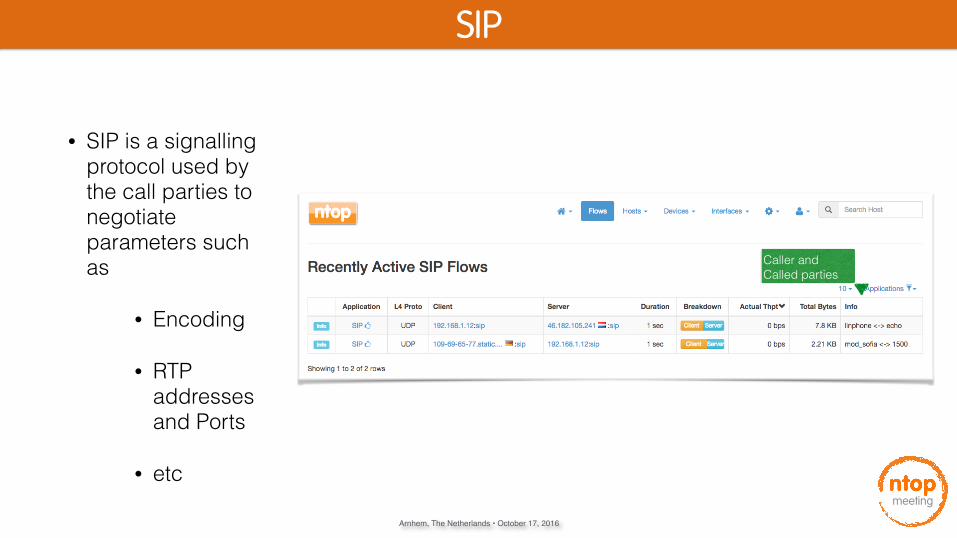
SIP
• SIP is a signalling protocol used by the call parties to negotiate parameters such as
• Encoding
• RTP addresses and Ports
• etc
Caller and Called parties
Arnhem, The Netherlands • October 17, 2016
meeting
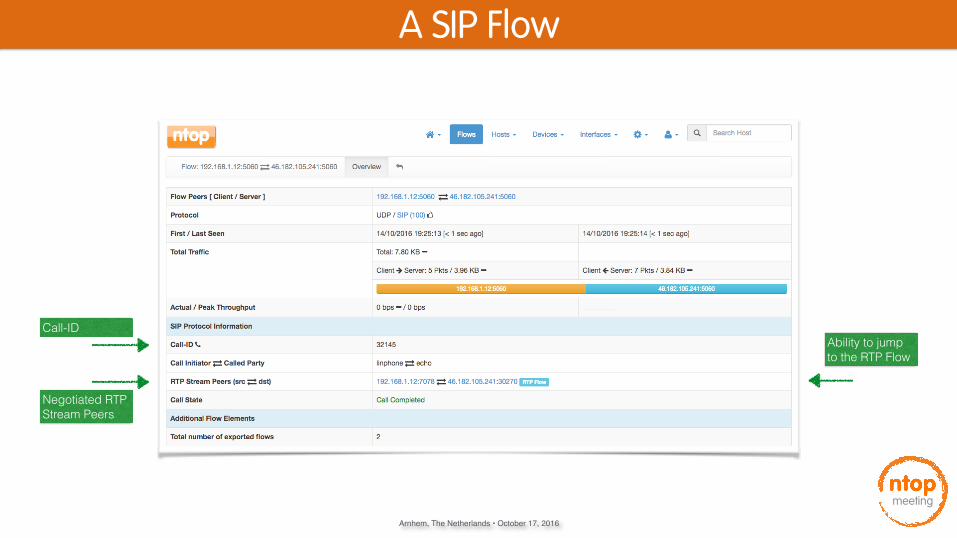
A SIP Flow
Ability to jump to the RTP Flow
Call-ID
Negotiated RTP Stream Peers
Arnhem, The Netherlands • October 17, 2016
meeting
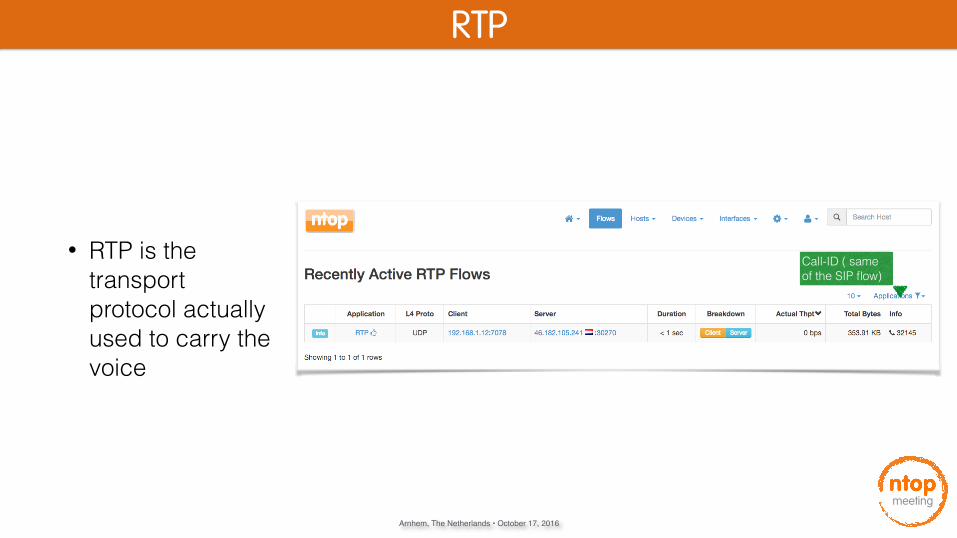
RTP
• RTP is the transport protocol actually used to carry the voice
Call-ID ( same of the SIP flow)
Arnhem, The Netherlands • October 17, 2016
meeting
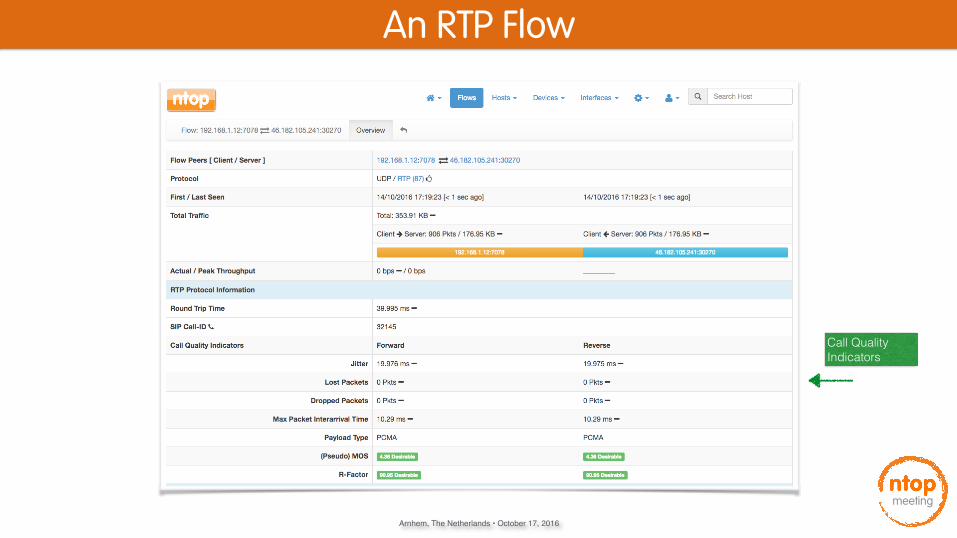
An RTP Flow
Call Quality Indicators
Arnhem, The Netherlands • October 17, 2016
meeting
Using ntopng for traffic analysis, troubleshooting, and flow collection
Arnhem, The Netherlands • October 17, 2016
meeting
Flow Collection with ntopng and nProbe
• nProbe (a home-grown NetFlow/sFlow collector/probe) is responsible for collecting/generating flows and convert them to JSON so that ntopng can understand it
• The communication ntopng <-> nProbe is over ØMQ a simple/fast messaging system that allows the two peers to be decoupled while:
• Avoiding “fat” communication protocols such as HTTP
• Relying on a system that works per message (no per packet) and handles automatic reconnection if necessary
Arnhem, The Netherlands • October 17, 2016
meeting
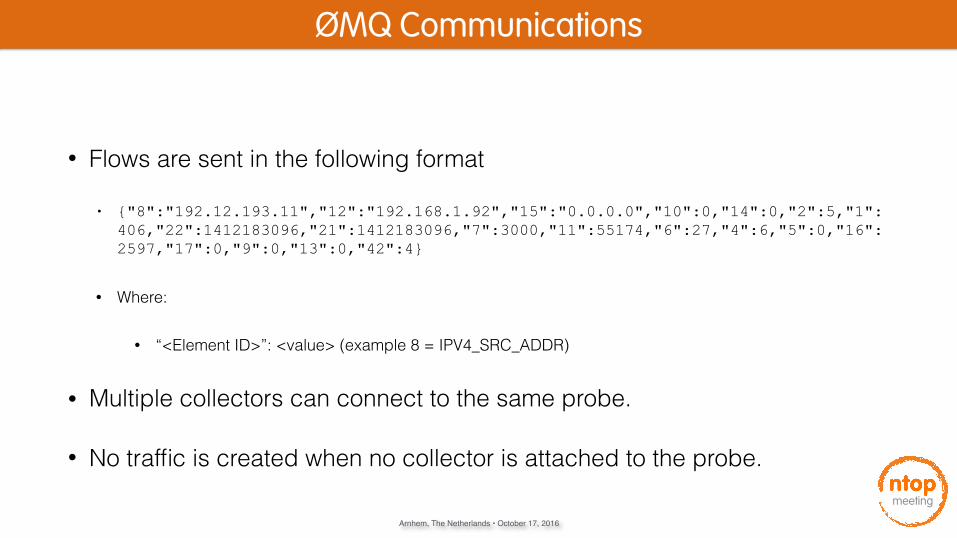
ØMQ Communications
• Flows are sent in the following format
• {"8":"192.12.193.11","12":"192.168.1.92","15":"0.0.0.0","10":0,"14":0,"2":5,"1":406,"22":1412183096,"21":1412183096,"7":3000,"11":55174,"6":27,"4":6,"5":0,"16":2597,"17":0,"9":0,"13":0,"42":4}
• Where:
• “<Element ID>”: <value> (example 8 = IPV4_SRC_ADDR)
• Multiple collectors can connect to the same probe.
• No traffic is created when no collector is attached to the probe.
Arnhem, The Netherlands • October 17, 2016
meeting
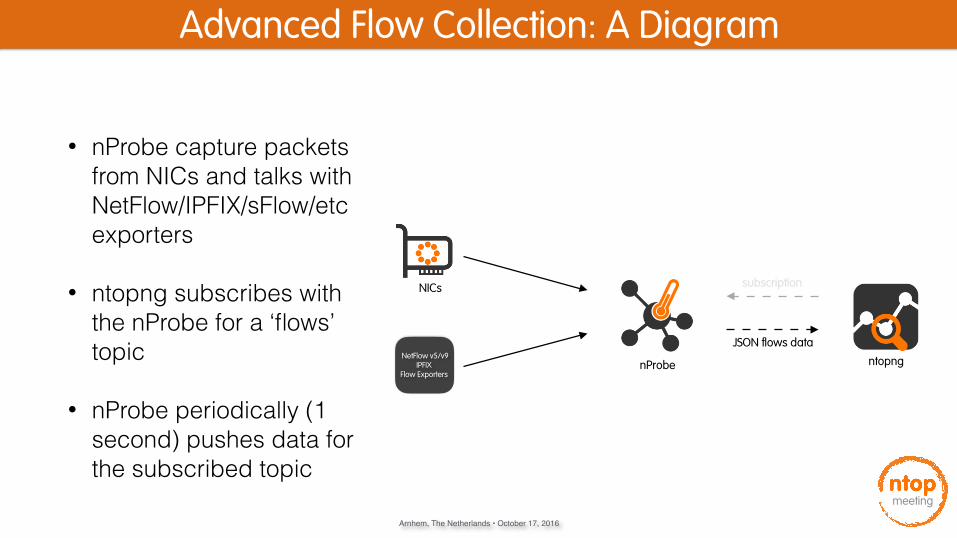
Advanced Flow Collection: A Diagram
• nProbe capture packets from NICs and talks with NetFlow/IPFIX/sFlow/etc exporters
• ntopng subscribes with the nProbe for a ‘flows’ topic
• nProbe periodically (1 second) pushes data for the subscribed topic
NICs
ntopngNetFlow v5/v9IPFIX
Flow ExportersnProbe
subscription
JSON flows data
Arnhem, The Netherlands • October 17, 2016
meeting
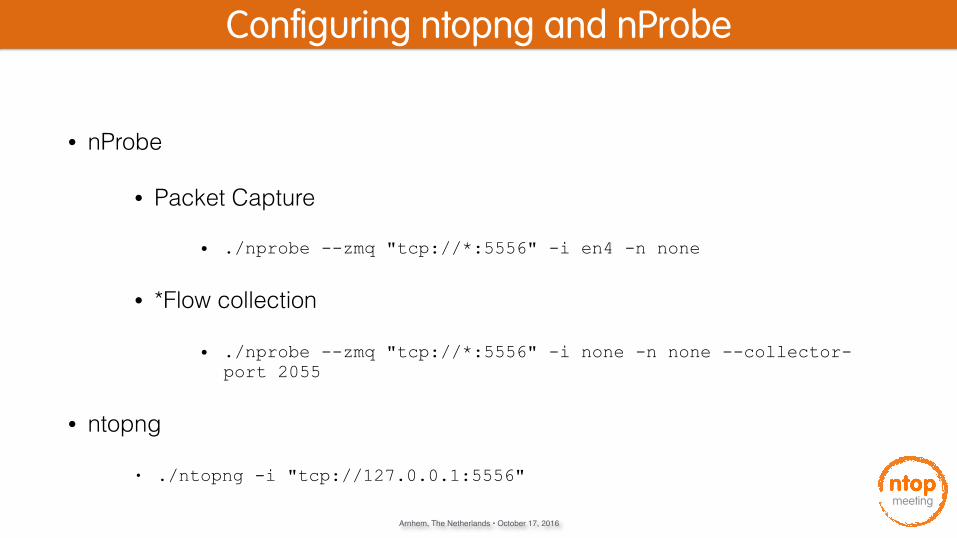
Configuring ntopng and nProbe
• nProbe
• Packet Capture
• ./nprobe --zmq "tcp://*:5556" -i en4 -n none
• *Flow collection
• ./nprobe --zmq "tcp://*:5556" -i none -n none --collector-port 2055
• ntopng
• ./ntopng -i "tcp://127.0.0.1:5556"

Arnhem, The Netherlands • October 17, 2016
meeting
Visualising the Remote Interface
• Remote probe interface name, speed and ip addresses
• Treated by ntopng as if it was a local interface
Arnhem, The Netherlands • October 17, 2016
meeting
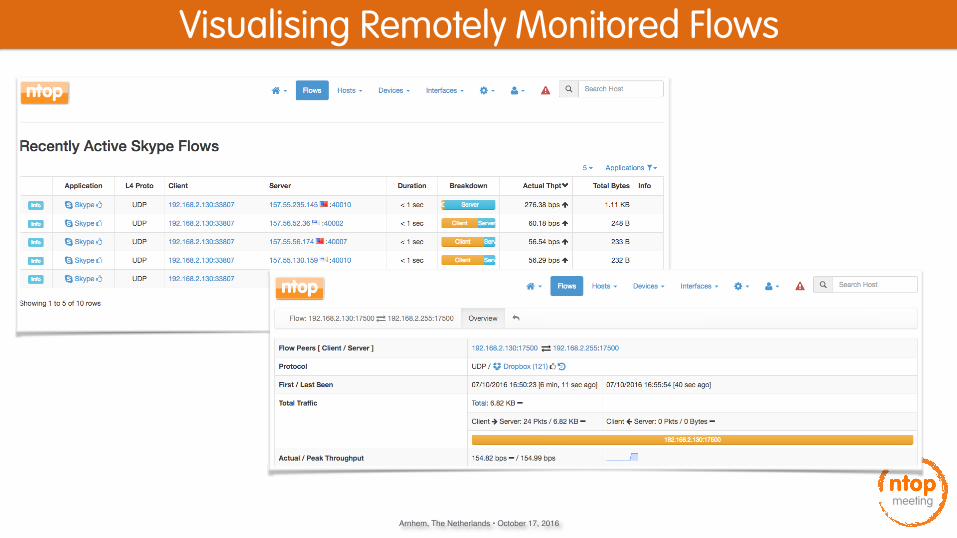
Visualising Remotely Monitored Flows
Arnhem, The Netherlands • October 17, 2016
meeting
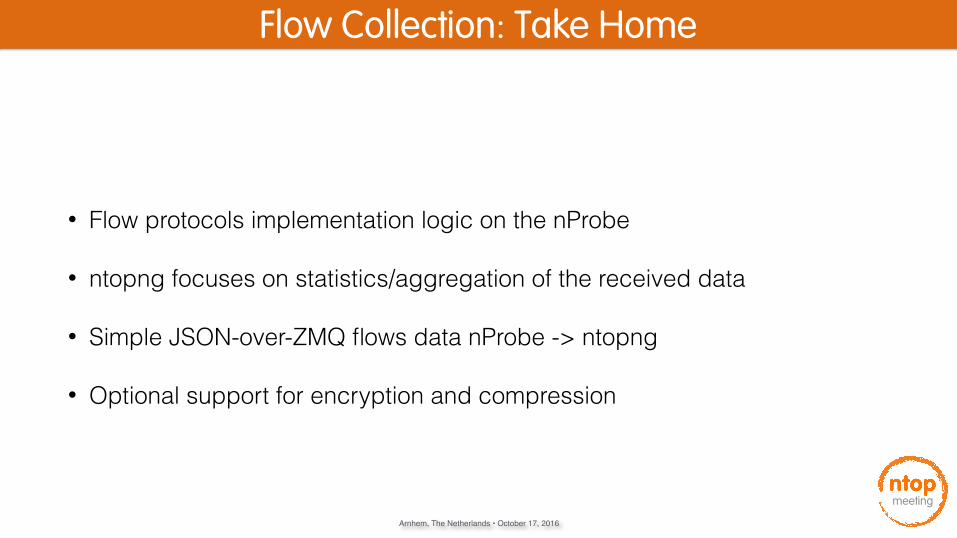
Flow Collection: Take Home
• Flow protocols implementation logic on the nProbe
• ntopng focuses on statistics/aggregation of the received data
• Simple JSON-over-ZMQ flows data nProbe -> ntopng
• Optional support for encryption and compression

Arnhem, The Netherlands • October 17, 2016
meeting
Thank You!
Simone Mainardi, PhD [email protected]
Arnhem, The Netherlands • October 17, 2016
meeting
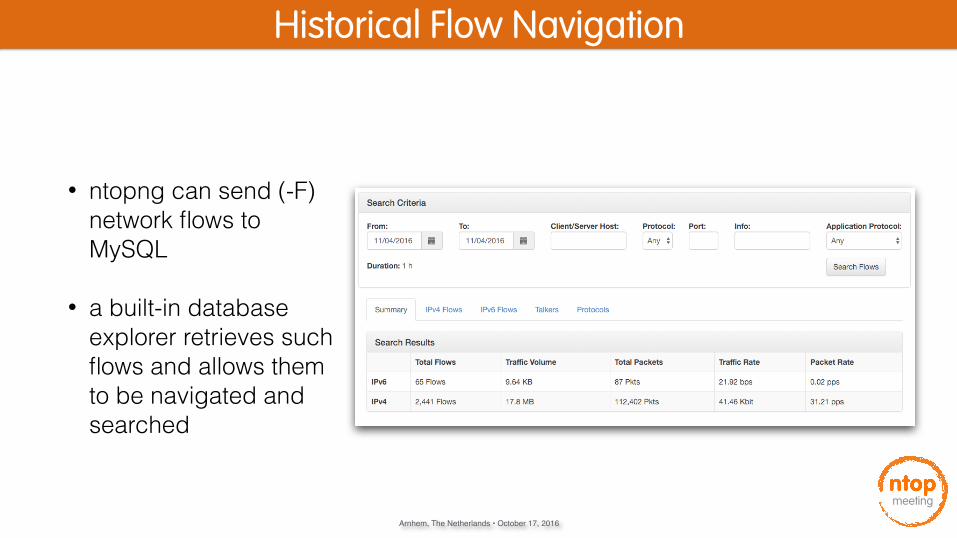
Historical Flow Navigation
• ntopng can send (-F) network flows to MySQL
• a built-in database explorer retrieves such flows and allows them to be navigated and searched

Arnhem, The Netherlands • October 17, 2016
meeting
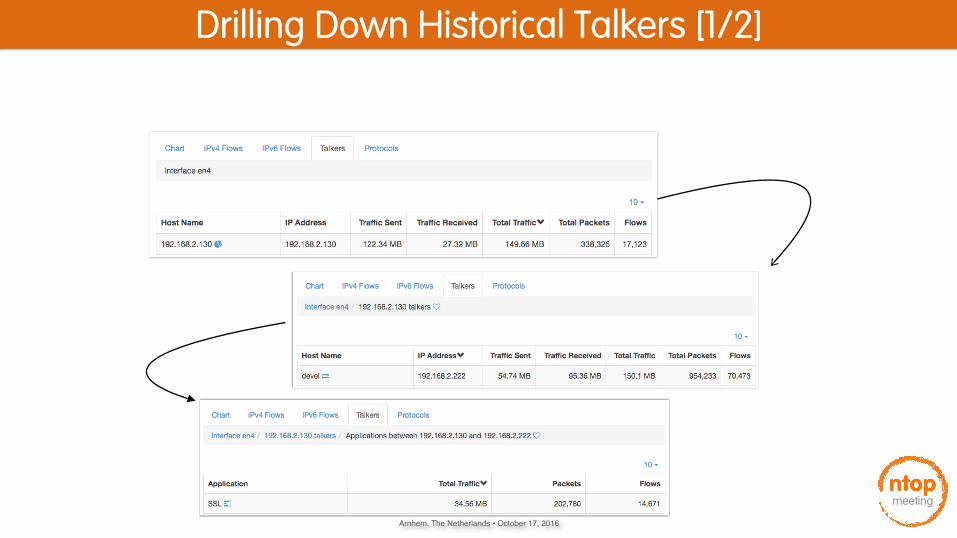
Historical Talkers
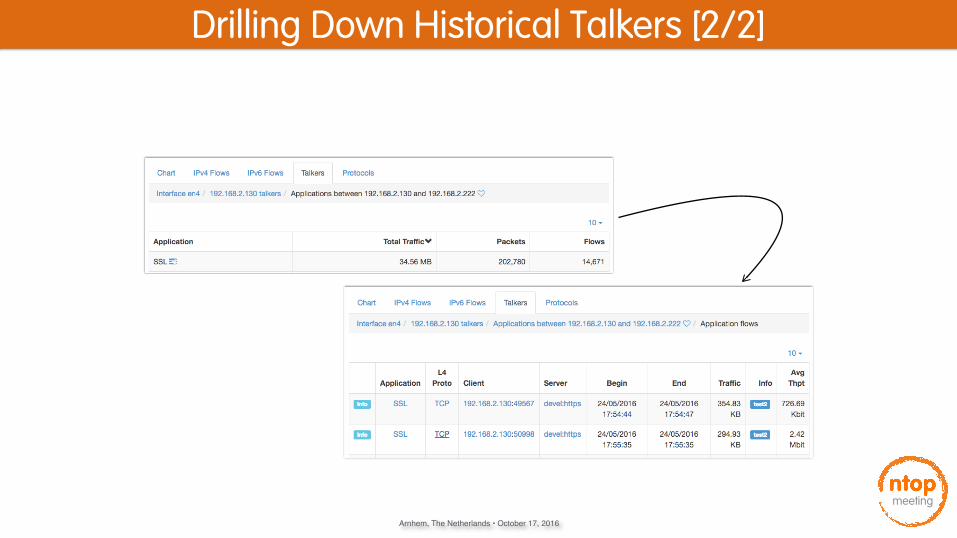
• Top Talkers can be automatically extracted from flows
• Every top talker can be clicked to inspect its peers
• Every peer can be clicked to inspect L7 application protocols
• Flows matching inspection criteria can be downloaded at any stage
Arnhem, The Netherlands • October 17, 2016
meeting
Drilling Down Historical Talkers [1/2]
Arnhem, The Netherlands • October 17, 2016
meeting
Drilling Down Historical Talkers [2/2]

Arnhem, The Netherlands • October 17, 2016
meeting
Historical Applications
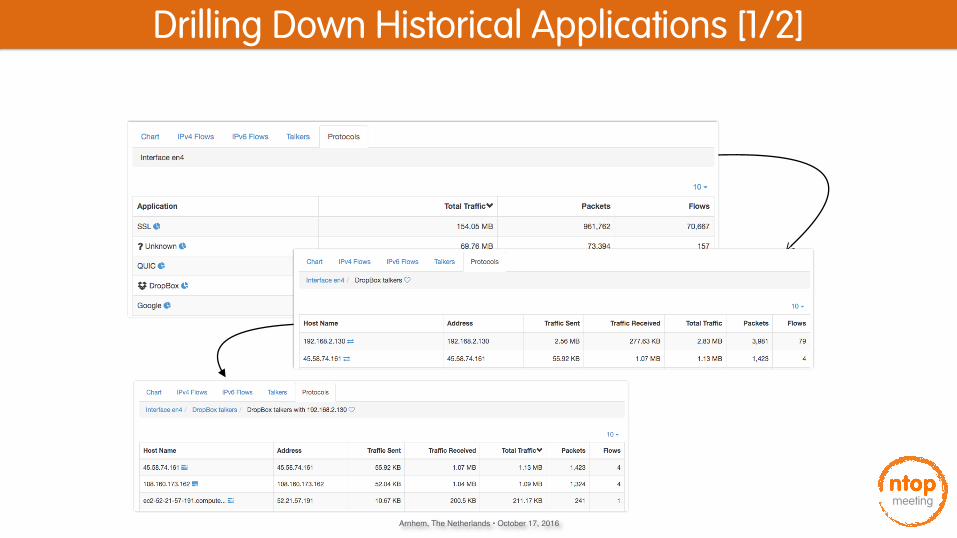
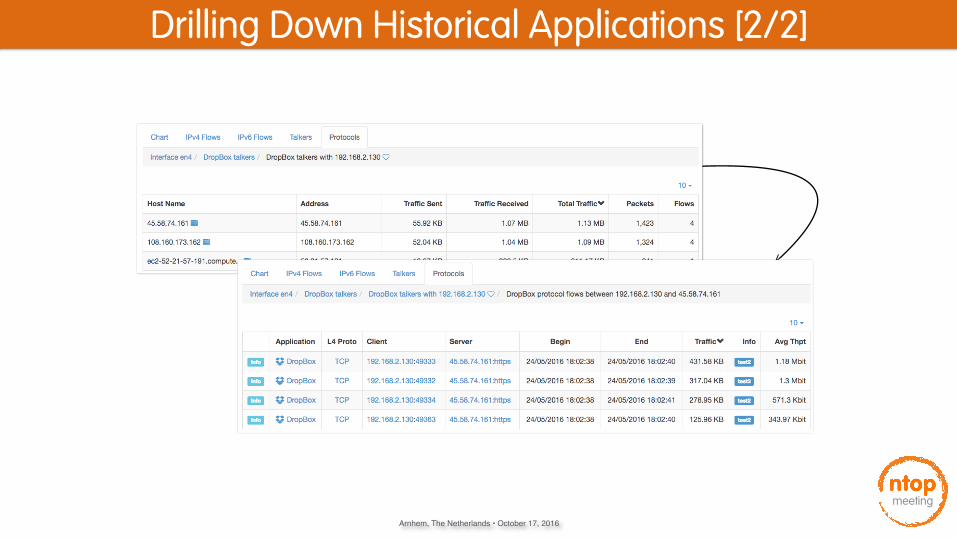
• Top Applications can be automatically extracted from flows as well
• Every top application can be clicked to inspect hosts that have used it
• Every host can be clicked to inspect peers that have used a given application to communicate with the host
• Flows matching inspection criteria can be downloaded at any stage
Arnhem, The Netherlands • October 17, 2016
meeting
Drilling Down Historical Applications [1/2]
Arnhem, The Netherlands • October 17, 2016
meeting
Drilling Down Historical Applications [2/2]
Arnhem, The Netherlands • October 17, 2016
meeting
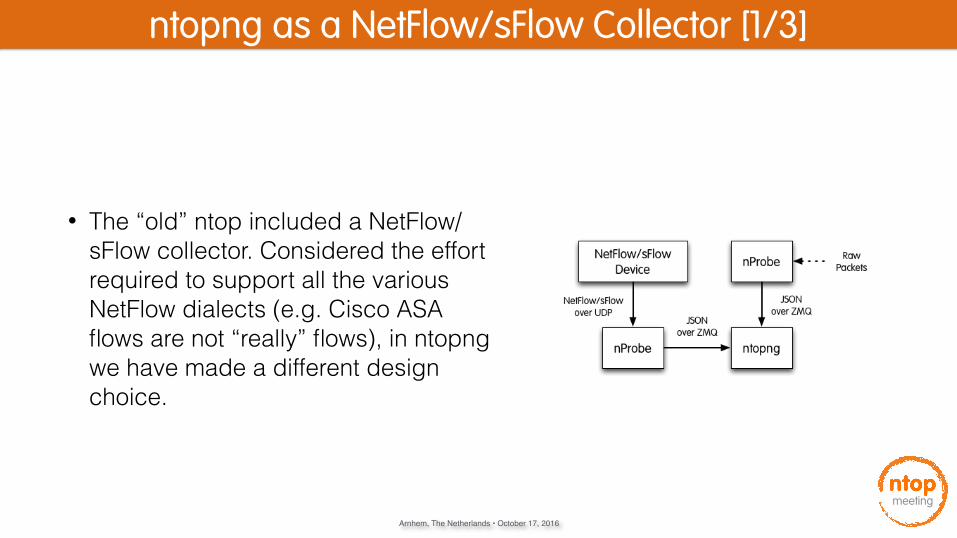
ntopng as a NetFlow/sFlow Collector [1/3]
• The “old” ntop included a NetFlow/sFlow collector. Considered the effort required to support all the various NetFlow dialects (e.g. Cisco ASA flows are not “really” flows), in ntopng we have made a different design choice.
Arnhem, The Netherlands • October 17, 2016
meeting
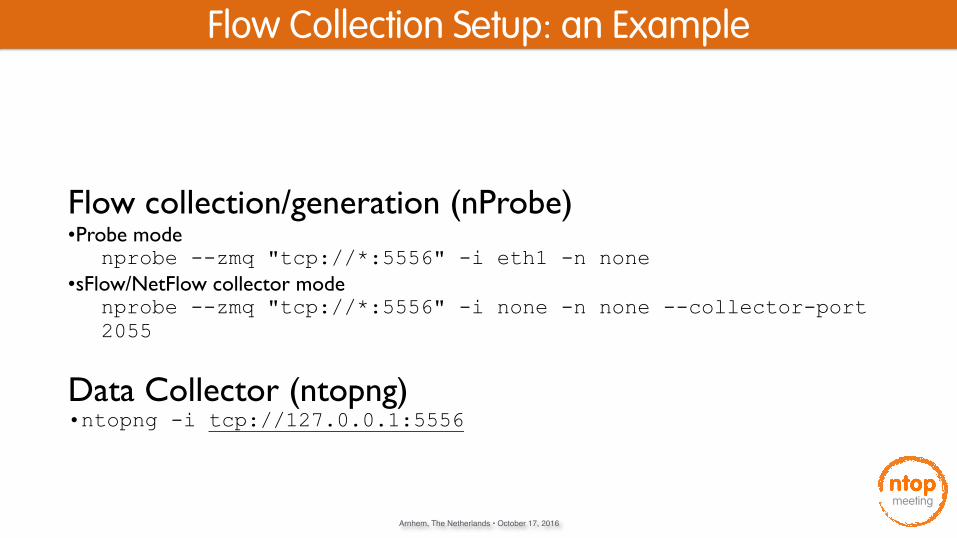
Flow Collection Setup: an Example
Flow collection/generation (nProbe)•Probe mode
nprobe --zmq "tcp://*:5556" -i eth1 -n none•sFlow/NetFlow collector mode
nprobe --zmq "tcp://*:5556" -i none -n none --collector-port 2055
Data Collector (ntopng)•ntopng -i tcp://127.0.0.1:5556

Arnhem, The Netherlands • October 17, 2016
meeting
Advanced Flow Collection with ntopng and nProbe [1/2]
• ntopng uses a poll-mode architecture to fetch flows data from nProbe
• fetched data is pure JSON
• nProbe implements flow protocols (e.g., IPFIX/NetFlow v5-v9-v10 sFlow, etc.) and deals with flow export devices (e.g., routers/switches)
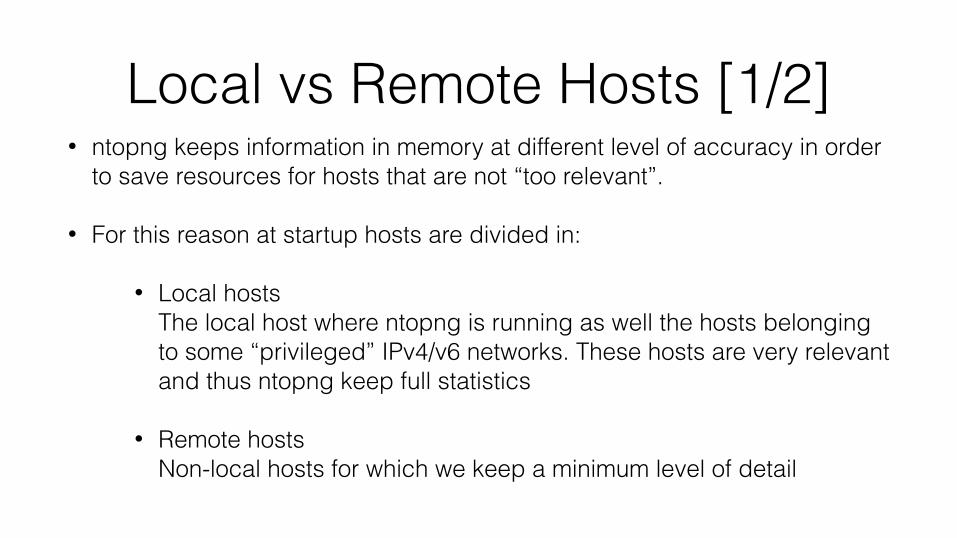
Local vs Remote Hosts [1/2]• ntopng keeps information in memory at different level of accuracy in order
to save resources for hosts that are not “too relevant”.
• For this reason at startup hosts are divided in:
• Local hostsThe local host where ntopng is running as well the hosts belonging to some “privileged” IPv4/v6 networks. These hosts are very relevant and thus ntopng keep full statistics
• Remote hosts Non-local hosts for which we keep a minimum level of detail
Local vs Remote Hosts [2/2]
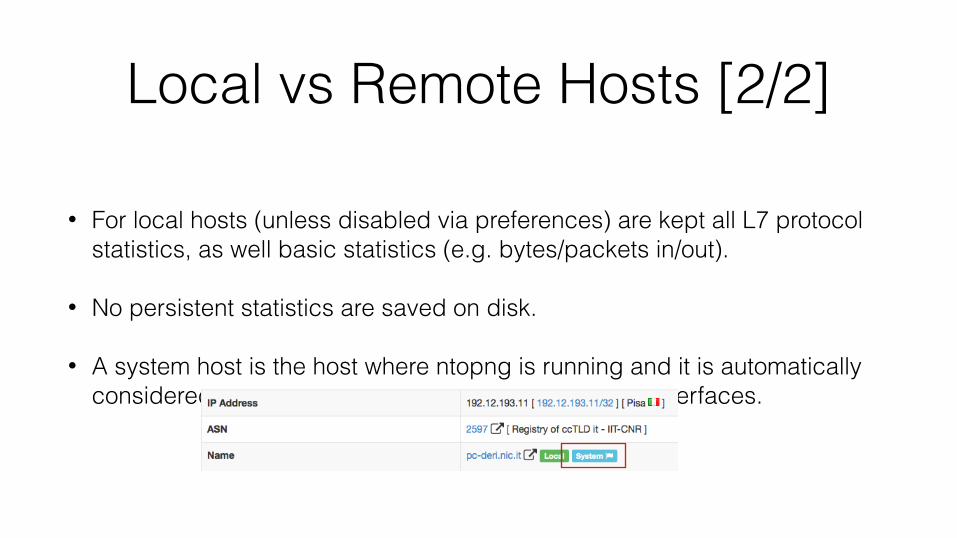
• For local hosts (unless disabled via preferences) are kept all L7 protocol statistics, as well basic statistics (e.g. bytes/packets in/out).
• No persistent statistics are saved on disk.
• A system host is the host where ntopng is running and it is automatically considered local as well the networks of its ethernet interfaces.
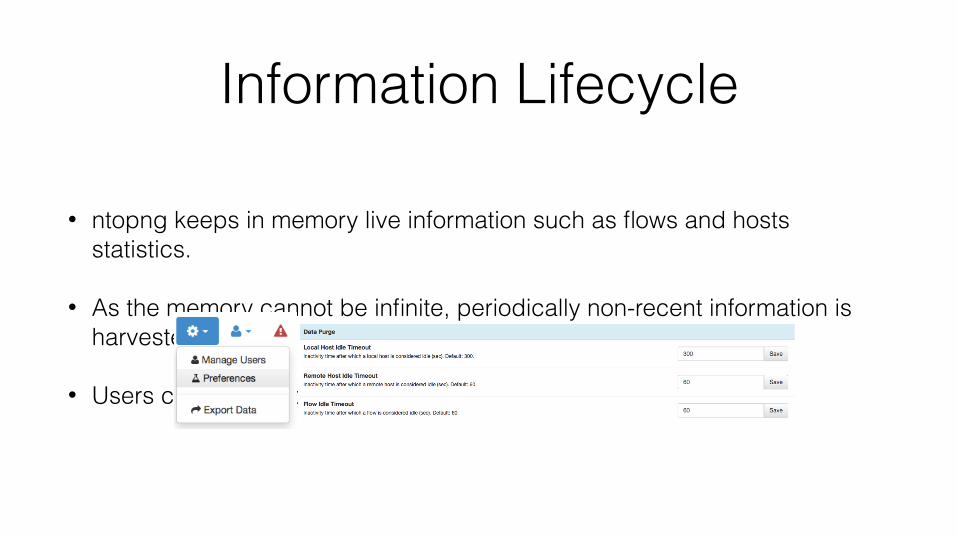
Information Lifecycle
• ntopng keeps in memory live information such as flows and hosts statistics.
• As the memory cannot be infinite, periodically non-recent information is harvested.
• Users can specify preferences for data purge:
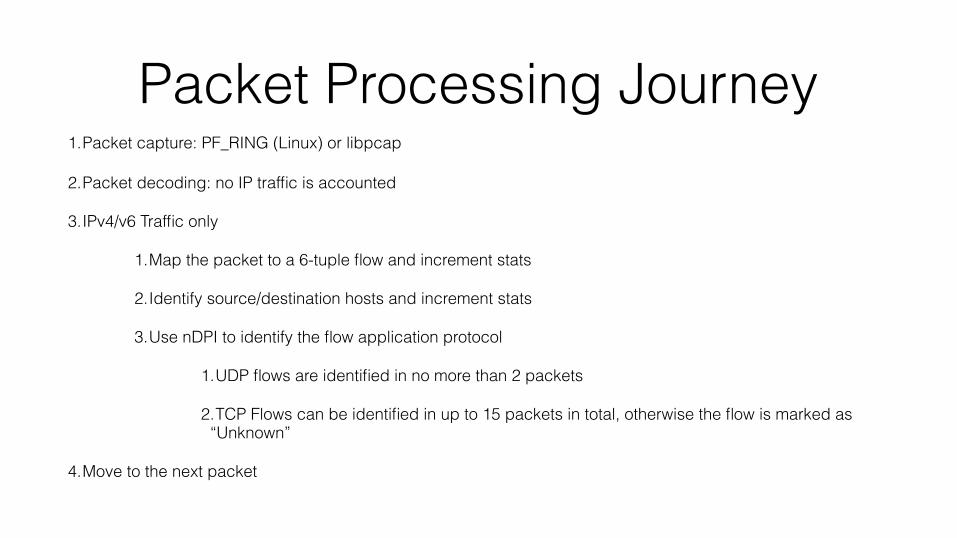
Packet Processing Journey1.Packet capture: PF_RING (Linux) or libpcap
2.Packet decoding: no IP traffic is accounted
3.IPv4/v6 Traffic only
1.Map the packet to a 6-tuple flow and increment stats
2.Identify source/destination hosts and increment stats
3.Use nDPI to identify the flow application protocol
1.UDP flows are identified in no more than 2 packets
2.TCP Flows can be identified in up to 15 packets in total, otherwise the flow is marked as “Unknown”
4.Move to the next packet