web services resilience evaluation using lds load dependent
TRANSCRIPT

Web Services Resilience Evaluation using LDSLoad dependent Server Models
Massimiliano Rak, Rocco Aversa, Beniamino Di Martino, Antonio SguegliaDipartimento di Ingegneria dellInformazione,
Seconda Universita di NapoliAversa(CE), Italy
Email: {massimiliano.rak, rocco.aversa, beniamino.dimartino}@[email protected]
Abstract— In the field of ICT, the term resilience is com-monly used, understanding to mean the ability of a systemto deliver acceptable service in the presence of faults. Weinterpret resilience assessment to mean assessment of ICTsystems in evolving environments and conditions and inthe presence of faults or failures of any kind. ResilienceMeasurement and benchmarking is an open problem, mainlyreferred to security-related problems. In this paper wepropose to model Web Services (WS)as Load DependentServers (LDS), i.e. systems whose response time to a givenrequest depends on the load at the time the request isreceived. Adoption of LDS-based models enable us to have asimple way to represent the System state. We propose to usethis simple representation to quantify the system resiliencecomparing models built using off-line measurement andmodels built using on-line measurement.
Index Terms— SOA, resilience, Load Dependent Server,Denial of Services
I. INTRODUCTION
Service Oriented Computing for the development ofopen, large-scale interoperable systems is becoming acustomary approach. Web Service standards and theirimplementations are widely spreading, and there are manyexamples of “working” solutions. In Service OrientedApplication designs, abstraction layers completely hidethe underlying system to all users (i.e., both to finalusers, system administrators and to service Developers).Due to architecture’s transparency it is very hard forapplication/service developers to perform a quantitativeevaluation at any stage of the system life cycle. This prob-lems can be applied to any non-functional requirements(i.e. performance, security, dependability, availability, . . . ).
In this paper we focus on the resilience, using theterm resilience we refer to the ability of a system todeliver acceptable service, in presence of degraded systemconditions. A quantitative resilience evaluation means thedefinition of an index which represents the perceivedquality of a system, respect to the system state. The maindifference between the Fault tolerance concept and theResilience, is that the first aims at defining techniques andtools able to build up a system able to work in presenceof faults, the latter aims at quantifying the quality of asystem working in fault conditions.
Manuscript received April 29, 2009; revised October 7, 2009; ac-cepted December 1, 2009.
Resilience is referred, not only to system degraded dueto system faults, but even to degradation due to secu-rity problems, as an example the presence of maliciousattacks. At the state of the art ‘Quantitative evaluationtechniques have been mainly used to evaluate the impactof accidental faults on systems dependability, while theevaluation of security has been mainly based on qualita-tive evaluation criteria. Therefore, there is a need for acomprehensive modelling framework that can be used toassess the impact of accidental faults as well as maliciousthreats in an integrated way [1]. As a result a lot ofresearch work exists, aiming at resilience benchmarking.
The common approach to dependability benchmarkaims at modeling the “fault loads”,i.e. the loads generatedby the faults. Usually the dependability benchmark takesplace together with standard performance benchmark(SPEC, TPC), measuring how the performance indexesvary during as an effect of the fault loads. [1]–[3]. Fol-lowing this approach both malicious threats and accidentalfaults are modeled in terms of a load fault, most of thepapers, so, focus on the fault injection techniques and/orin building up emulated security attacks.
The main lack, in this context, is that the proposedapproaches are unable to face all the “qualitative” securityproblems, i.e. the effect of adoption of security mecha-nisms, the administrative policies adopted, . . . . In fact thestate of the art lack in terms of security evaluation metricsand security benchmarking.
The approach we propose in this paper is completelydifferent: instead of focusing on the dependability/securitybenchmarks, we focus on the system: instead of us-ing common, well-assested performance benchmarks andmodels, we wonder if it is possible to build up a bench-marking methodology in order to point out the systembehaviour depending on its (eventually degraded) state.In other words: we aims at proposing a benchmarkingtechnique to discover a performance model which relatesthe user perceived performances to the system state. Ifsuch a technique exists, than we will be able to evaluate inan homogeneous way, accidental faults, malicious threats,security policy and mechanisms effects, . . .
As a result the approach we propose is to developa benchmarking technique which results not in a singleglobal index, but in a Model, i.e. a benchmarked descrip-
JOURNAL OF COMMUNICATIONS, VOL. 5, NO. 1, JANUARY 2010 39
© 2010 ACADEMY PUBLISHERdoi:10.4304/jcm.5.1.39-49

tion of the system, which synthesizes the obtained resultsand can be used to evaluate the system behaviour undergiven conditions.
Moreover we made the following considerations, whichlead to a set of requirements for the benchmarking tech-nique.
Performance benchmark aims at reproducing real work-loads and offer global evaluation in order to have asimple way to compare two different platforms. The mainlack of the common approach is that it is independentfrom the services: they evaluate a standard workloadon a set of standard services. This approach helps theplatform owners, but it is useless for service providers andfinal users: what happens to the target web services andworkload? This consideration leads us to define the firstrequirement for our benchmarking technique: The tech-nique should be Service-centric, i.e. we aims at measuringhow a given service works. The web service platform,i.e.the containers, the server, the hardware platform, is a“parameter” for the WS evaluation. This means that thebenchmarking technique accepts as an input the serviceWSDL.
Moreover, given a specific set of services, it is muchharder to define a standard workloads: it depends onthe services architecture! This means that the benchmarkapproach we propose must be oriented to indirect mea-surement: the second requirement is that the resultsshould be useful for predicting the performance behaviourunder real workloads.
A additional consideration should be done related tothe need of quantifying effect of both malicious at-tacks and faults. Malicious attacks may result in Serverwith gradually degrading performances, i.e. the systemis not in equilibrium (steady state), usually required inbenchmarking. In order to catch the system behaviourin any condition, transients cannot be neglected. Thethird requirement is that the proposed benchmarkingtechnique should be able to catch transitional behaviours.
In order to simplify the approach, as starting point weassume that the services are offered on a dedicated plat-form, and are, for the benchmarking, available for offlinebenchmarking, i.e. we are able to perform our benchmarkswith the assumption that there is no additional load on theservers. After a preliminary off-line measurement we willbe able to perform the same measurement on line Thisassumption limits the technique applicability: we cannotuse it on publicly available services (such as servicesoffered by google, viamichelin, . . . ), we aims at facingthis kind of problems with future extensions.
The paper is organised as follows: next section illus-trates the approach and describes the simple case studyadopted. Section III details the benchmarking techniqueand related problems, using the case study services toillustrate the technique. Section IV describes the bench-marking output model, while section V illustrates someexamples of the model usage and how the results canbe used to evaluate the target environment and how itcan be used to quantify the system resilience. Section VI
illustrates the related work in the scientific community,and section VII summarizes the results and outline thefuture work.
II. APPROACH
As anticipated in introduction the approach we proposein this paper aims at defining a benchmarking techniquewhich helps in discovering a performance model whichrelates the user perceived performances to the systemstate. The analysis we conducted lead us to define thefollowing requirements:
• the technique should be Service-centric, i.e. thebenchmarking technique accept as an input only theservice WSDL;
• the proposed benchmarking technique should be ableto catch transitional behaviours;
• the results should be useful for predicting the per-formance behaviour under real workloads.
Moreover the performance index we will focus on is theservice response time, which is directly related to user-perceived performances.
The main assumption we made in order to build upsuch a technique is that the Web services can be modeledas Load Dependent Servers (LDS), i.e a WS responsetime received at instant t depends on the number (andkind) of requests that the WS platform is elaborating atinstant t. We will demonstrate this assumption in sectionIII. Thanks to this behaviour we are able to model Webservices response time in terms of : RT (request) =f(ServiceState, request), i.e the response time will berepresented as a function of the service state (in termsof number and kind of pending requests) and the actualrequest. This approach introduces the concept of ServiceState: it depends only on the service usage and affectthe performance of the service itself. We will build upthe relationship Service State-Service RT performing aset of ad hoc measurement, performed in a dedicatedenvironment. The result is that the services platform(hardware, operating system, middle-ware) will be takeninto account by the derived model. Any kind of platformdegradation will result in changes between the expectedand the measured behaviour.
The proposed approach open the following questions,which are strictly related each other:
• Are Web Services Load Dependent Servers?• How to represent Service State?• How to represent (model) the relationship Service
State-Service RT• How to measure them?
It is very hard to reply to this question in abstract terms,so we will focus on a simple reference case study, whichwill help us to show the approach and validate it.
A. Test-bed and case study
As case study, we have chosen an application forremote files archiving where the files may contain confi-dential data. Even if the application is relatively simple, it
40 JOURNAL OF COMMUNICATIONS, VOL. 5, NO. 1, JANUARY 2010
© 2010 ACADEMY PUBLISHER
carries out complex tasks (analysis of large log files) andhas to meet desired security requirements, according touser credentials and data confidentiality. The applicationis composed of a set of services to store and to elaboratefiles, allowing the adoption of authentication mechanisms.The services enforce different security policies and im-plement different security mechanisms. According to thedefinition given previously of security level, we can saythat the service can operate at different security levels.In other words, it is possible to search for, to accessand to use a service with different security featuresdepending on the user Requested Policy (RP). The RPcontains information on the credentials the user has, onthe confidentiality of the log file data and/or on otherservice level constraints.
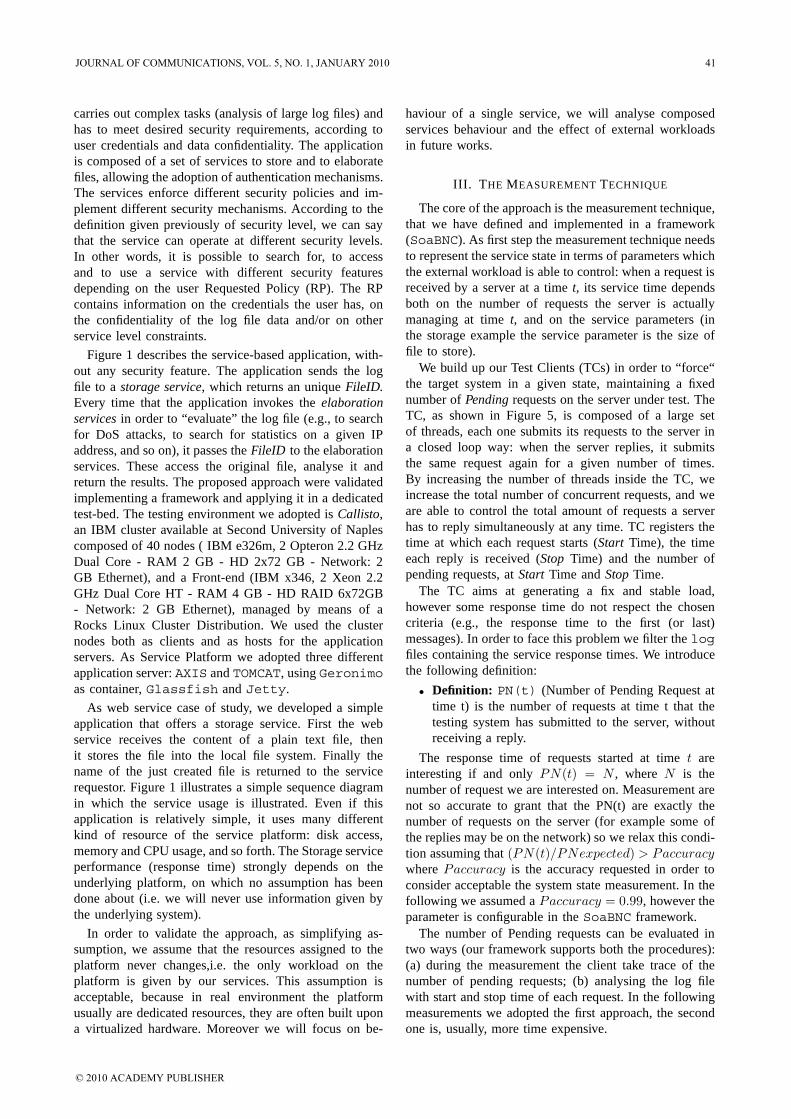
Figure 1 describes the service-based application, with-out any security feature. The application sends the logfile to a storage service, which returns an unique FileID.Every time that the application invokes the elaborationservices in order to “evaluate” the log file (e.g., to searchfor DoS attacks, to search for statistics on a given IPaddress, and so on), it passes the FileID to the elaborationservices. These access the original file, analyse it andreturn the results. The proposed approach were validatedimplementing a framework and applying it in a dedicatedtest-bed. The testing environment we adopted is Callisto,an IBM cluster available at Second University of Naplescomposed of 40 nodes ( IBM e326m, 2 Opteron 2.2 GHzDual Core - RAM 2 GB - HD 2x72 GB - Network: 2GB Ethernet), and a Front-end (IBM x346, 2 Xeon 2.2GHz Dual Core HT - RAM 4 GB - HD RAID 6x72GB- Network: 2 GB Ethernet), managed by means of aRocks Linux Cluster Distribution. We used the clusternodes both as clients and as hosts for the applicationservers. As Service Platform we adopted three differentapplication server: AXIS and TOMCAT, using Geronimoas container, Glassfish and Jetty.
As web service case of study, we developed a simpleapplication that offers a storage service. First the webservice receives the content of a plain text file, thenit stores the file into the local file system. Finally thename of the just created file is returned to the servicerequestor. Figure 1 illustrates a simple sequence diagramin which the service usage is illustrated. Even if thisapplication is relatively simple, it uses many differentkind of resource of the service platform: disk access,memory and CPU usage, and so forth. The Storage serviceperformance (response time) strongly depends on theunderlying platform, on which no assumption has beendone about (i.e. we will never use information given bythe underlying system).
In order to validate the approach, as simplifying as-sumption, we assume that the resources assigned to theplatform never changes,i.e. the only workload on theplatform is given by our services. This assumption isacceptable, because in real environment the platformusually are dedicated resources, they are often built upona virtualized hardware. Moreover we will focus on be-
haviour of a single service, we will analyse composedservices behaviour and the effect of external workloadsin future works.
III. THE MEASUREMENT TECHNIQUE
The core of the approach is the measurement technique,that we have defined and implemented in a framework(SoaBNC). As first step the measurement technique needsto represent the service state in terms of parameters whichthe external workload is able to control: when a request isreceived by a server at a time t, its service time dependsboth on the number of requests the server is actuallymanaging at time t, and on the service parameters (inthe storage example the service parameter is the size offile to store).
We build up our Test Clients (TCs) in order to “force“the target system in a given state, maintaining a fixednumber of Pending requests on the server under test. TheTC, as shown in Figure 5, is composed of a large setof threads, each one submits its requests to the server ina closed loop way: when the server replies, it submitsthe same request again for a given number of times.By increasing the number of threads inside the TC, weincrease the total number of concurrent requests, and weare able to control the total amount of requests a serverhas to reply simultaneously at any time. TC registers thetime at which each request starts (Start Time), the timeeach reply is received (Stop Time) and the number ofpending requests, at Start Time and Stop Time.
The TC aims at generating a fix and stable load,however some response time do not respect the chosencriteria (e.g., the response time to the first (or last)messages). In order to face this problem we filter the logfiles containing the service response times. We introducethe following definition:
• Definition: PN(t) (Number of Pending Request attime t) is the number of requests at time t that thetesting system has submitted to the server, withoutreceiving a reply.
The response time of requests started at time t areinteresting if and only PN(t) = N , where N is thenumber of request we are interested on. Measurement arenot so accurate to grant that the PN(t) are exactly thenumber of requests on the server (for example some ofthe replies may be on the network) so we relax this condi-tion assuming that (PN(t)/PNexpected) > Paccuracywhere Paccuracy is the accuracy requested in order toconsider acceptable the system state measurement. In thefollowing we assumed a Paccuracy = 0.99, however theparameter is configurable in the SoaBNC framework.
The number of Pending requests can be evaluated intwo ways (our framework supports both the procedures):(a) during the measurement the client take trace of thenumber of pending requests; (b) analysing the log filewith start and stop time of each request. In the followingmeasurements we adopted the first approach, the secondone is, usually, more time expensive.
JOURNAL OF COMMUNICATIONS, VOL. 5, NO. 1, JANUARY 2010 41
© 2010 ACADEMY PUBLISHER
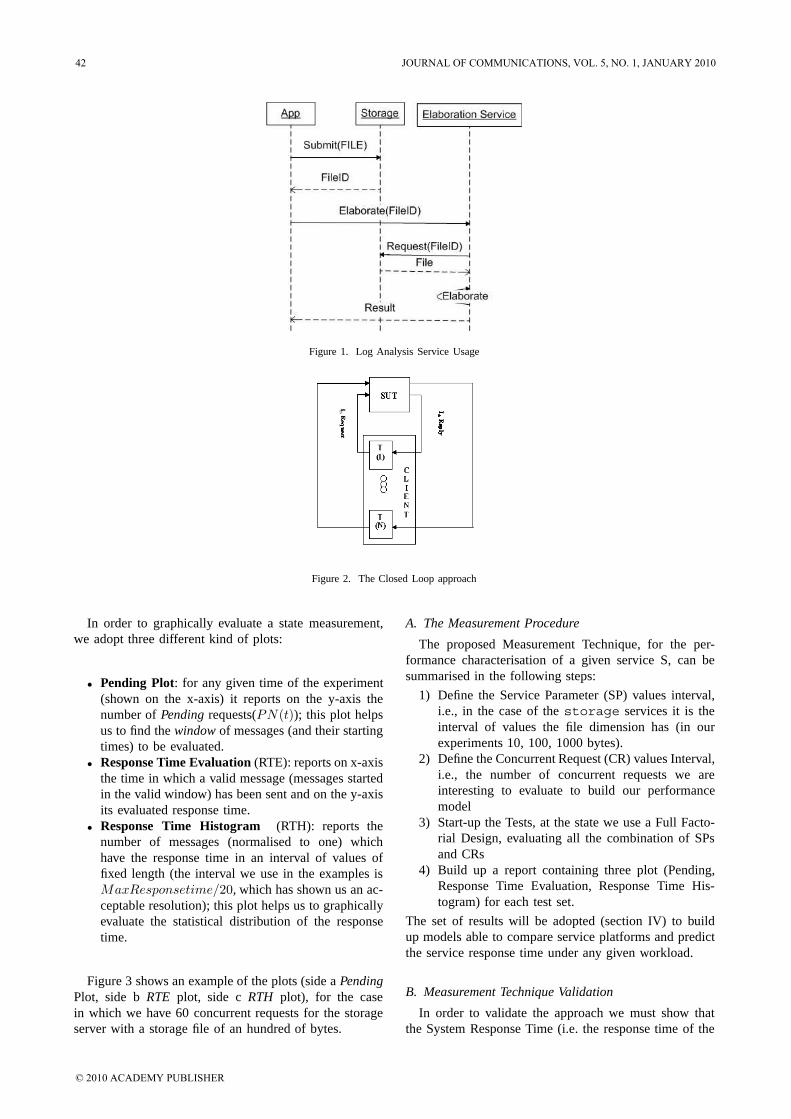
Figure 1. Log Analysis Service Usage
Figure 2. The Closed Loop approach
In order to graphically evaluate a state measurement,we adopt three different kind of plots:
• Pending Plot: for any given time of the experiment(shown on the x-axis) it reports on the y-axis thenumber of Pending requests(PN(t)); this plot helpsus to find the window of messages (and their startingtimes) to be evaluated.
• Response Time Evaluation (RTE): reports on x-axisthe time in which a valid message (messages startedin the valid window) has been sent and on the y-axisits evaluated response time.
• Response Time Histogram (RTH): reports thenumber of messages (normalised to one) whichhave the response time in an interval of values offixed length (the interval we use in the examples isMaxResponsetime/20, which has shown us an ac-ceptable resolution); this plot helps us to graphicallyevaluate the statistical distribution of the responsetime.
Figure 3 shows an example of the plots (side a PendingPlot, side b RTE plot, side c RTH plot), for the casein which we have 60 concurrent requests for the storageserver with a storage file of an hundred of bytes.
A. The Measurement Procedure
The proposed Measurement Technique, for the per-formance characterisation of a given service S, can besummarised in the following steps:
1) Define the Service Parameter (SP) values interval,i.e., in the case of the storage services it is theinterval of values the file dimension has (in ourexperiments 10, 100, 1000 bytes).
2) Define the Concurrent Request (CR) values Interval,i.e., the number of concurrent requests we areinteresting to evaluate to build our performancemodel
3) Start-up the Tests, at the state we use a Full Facto-rial Design, evaluating all the combination of SPsand CRs
4) Build up a report containing three plot (Pending,Response Time Evaluation, Response Time His-togram) for each test set.
The set of results will be adopted (section IV) to buildup models able to compare service platforms and predictthe service response time under any given workload.
B. Measurement Technique Validation
In order to validate the approach we must show thatthe System Response Time (i.e. the response time of the
42 JOURNAL OF COMMUNICATIONS, VOL. 5, NO. 1, JANUARY 2010
© 2010 ACADEMY PUBLISHER

0
10
20
30
40
50
60 0
1e+
06
2e+
06
3e+
06
4e+
06
5e+
06
6e+
06
7e+
06
8e+
06
9e+
06
Pen
ding
req
uest
s
Time (micro sec)
0 200000 400000 600000 800000 1e+06
0
1e+
06
2e+
06
3e+
06
4e+
06
5e+
06
6e+
06
7e+
06
8e+
06
9e+
06
Res
pons
e tim
e (m
icro
sec
)
Time (micro sec)
mean up valuemean down value
0 0.05 0.1
0.15 0.2
0.25 0.3
0.35 0.4
0.45
012
562
2512
437
686
5024
962
811
7537
387
936
1004
9811
3060
1256
2313
8185
1507
4716
3310
1758
7218
8434
2009
9721
3559
2261
2123
8684
2512
46
Like
lihoo
d
Response time (micro sec)
(a) (b) (c)
Figure 3. Evaluation Plots: (a) Pending Plot, (b) Response Time Plot, (c) Histogram Plot
target service on the SUT) depends on the number ofPending requests. This means that the resulting valuesshould be a constant value. Due to measurement error,we have to take into account that the response time has astatistical form, so we expect that it should have a NormalDistribution, whose mean value represents our constant.Standard deviation will help us to understand the accuracyof our measurement.
Due to space limits, in this paper we will illustratethe validation procedure only on the Storage service(even if we made similar consideration on a larger set ofservices and on their compositions), described in detail insection II-A, which accepts as a parameter a file and storeit on the server file system. We modeled its behaviourusing three different file dimension (10 bytes, 100 bytes ,1000 bytes) and varying the number of concurrent requestbetween 5 and 200 (step 5). Figure 4 shows some of theresults obtained, we just selected a set of values from thefull set of results, the first column contains the PendingPlot, the second the RTE plot, while the last the RTHplot. All the result refer to a file dimension of 100 bytes,the first row contains the plots obtained for 40 concurrentrequests, the second for 100 requests and the last one for140 requests.
Some consideration are really useful at this step. Thefirst one is that the Pending plot shows that the system notalways is able to maintain the stable load on the server(sometimes the client becomes too slow, for example dueto page faults or other actions on the client host machine).The Filtering technique let us to find the windows inwhich the values are of interest. Moreover not alwaysthe response time is a single constant value, for 40 and100 concurrent requests, we obtain two different values. Itis interesting to point out that, as show by the histogram(RTH plot) both have a Normal distribution: the serverhas two different behaviour! We will call this the systemDouble Response Time. Moreover it is important to pointout that the two measured behaviour have no relation tothe Pending plot shapes, in fact they are distributed onall the response in all the valid windows. This result hastwo effect on our methodology: the first one (negative)shows that the system has an its own evolution thatis independent from the workload we submit to it, thesecond one (positive) is that this evolution is regular (atthe end we have just two different values) and can bestatistically modeled using the proposed approach! Note
that when the number of the concurrent request growsthe results become more and more stable (from 140concurrent requests to more the result is stable). Moreoverthe lower value is usually more stable than the highervalue (i.e. the standard deviation is lower).
We suppose (but this analysis is unproven, and out ofthe scope of this paper) that the second behaviour (theone with higher response time) depends on the memoryusage: it is the response time of service when the garbagecollector of the JVM under tomcat starts. This will justifythe higher variance of this result.
In order to complete the analysis we have to point outthat some outliers are registered, as shown in the RTEplots, in most of the case this happens just before theclient becomes unable to maintain the load on the server.This can be a third server behaviour (whose response timebecome so slow that the client has some side effects). Inthis second case, we suppose that it depends on anothercyclic phenomenon on the server, for example it could bethe effect of page fault.
Our conclusions are that the proposed technique isable to force the system states, in which the systemis not completely stable, but whose behaviour can beeasily modeled (as we will see in the following sections).Moreover the proposed approach help us to catch animportant behaviour typical of this class of systems,and which characterises the underlying platform. So theproposed technique can be adopted, in future, to evaluateand directly compare the service platforms, independentlyfrom the offered services.
IV. BENCHMARK RESULT
The proposed measurement technique produces a largeset of values, which should be collect in a clear andunderstandable way. Instead of proposing a single per-formance index, we collected all the result in a syntheticrepresentation, named Basic Model (BM). BM is a simpleway to collect the measurement data obtained from thetechnique above illustrated, it represents the system asa simple Response Time vs (Pending Requests,ServiceParameter) table, containing all the measurement results,it can be seen as a tabular description of the function:RT = f(ConcurrentRequests, ServiceLoad). TableI illustrates the Basic Model representing the StorageService in our test-bed environment. The BM can be usedto build up predictive models, it contains all the needed
JOURNAL OF COMMUNICATIONS, VOL. 5, NO. 1, JANUARY 2010 43
© 2010 ACADEMY PUBLISHER

0 5
10 15 20 25 30 35 40
0
1e+
06
2e+
06
3e+
06
4e+
06
5e+
06
6e+
06
7e+
06
Pen
ding
req
uest
s
Time (micro sec)
0 40000 80000
120000 160000 200000 240000
0
1e+
06
2e+
06
3e+
06
4e+
06
5e+
06
6e+
06
Res
pons
e tim
e (m
icro
sec
)
Time (micro sec)
mean up valuemean down value
0
0.05
0.1
0.15
0.2
0.25
0.3
080
2116
042
2406
432
085
4010
648
128
5614
964
171
7219
280
213
8823
596
256
1042
7811
2299
1203
2012
8342
1363
6314
4384
1524
0616
0427
Like
lihoo
d
Response time (micro sec)
0
20
40
60
80
100
0
2e+
06
4e+
06
6e+
06
8e+
06
1e+
07
1.2
e+07
1.4
e+07
Pen
ding
req
uest
s
Time (micro sec)
0 200000 400000 600000 800000 1e+06
0
3e+
06
6e+
06
9e+
06
1.2
e+07
Res
pons
e tim
e (m
icro
sec
)
Time (micro sec)
mean up valuemean down value
0
0.1
0.2
0.3
0.4
0.5
0.6
017
916
3583
253
748
7166
489
580
1074
9612
5412
1433
2816
1244
1791
6019
7076
2149
9223
2908
2508
2426
8741
2866
5730
4573
3224
8934
0405
3583
21
Like
lihoo
d
Response time (micro sec)
0 20 40 60 80
100 120 140
0
2e+
06
4e+
06
6e+
06
8e+
06
1e+
07
1.2
e+07
1.4
e+07
1.6
e+07
1.8
e+07
Pen
ding
req
uest
s
Time (micro sec)
0 200000 400000 600000 800000 1e+06
0
5e+
06
1e+
07
1.5
e+07
2e+
07
Res
pons
e tim
e (m
icro
sec
)
Time (micro sec)
mean up valuemean down value
0 0.05 0.1
0.15 0.2
0.25 0.3
0.35 0.4
0.45
025
554
5110
876
662
1022
1612
7770
1533
2417
8879
2044
3322
9987
2555
4128
1095
3066
4933
2204
3577
5838
3312
4088
6643
4420
4599
7448
5528
5110
83
Like
lihoo
dResponse time (micro sec)
(a) (b) (c)
Figure 4. Storage Service Evaluation Plots, File Dimension=100 byte, column (a) Pending, column (b) RTE,column (b) RTH; row 1) 40 concurrentrequests, row 2) 100 concurrent requests, row 3) 140 concurrent requests
information to build up a regression model or to buildup a simulator, it is out of the scope of this paper todetails the predictive models. In order to build the tablewe need to face two main problem: designing the set ofexperiment we want to perform and collect and managingproblems like the double response time values. About theformer problem, we have a given Service to characterise,and the measurement technique let us to model it in termsof 1) the concurrent requests, 2) the service parameters,we just adopt a Full Factorial Design, collecting all thepossible combination of variable values. The double valueresponse time can be modeled assigning a probability toeach mean response time, to obtain this values we adoptedthe following procedure:
1) analysing the RTH plot we are able to find athreshold between the two normal distributions;
2) we evaluate the total number of messages in thevalid window (Total)
3) we evaluate the number of messages whoseresponse time is under/upper the threshold(Low/High)
4) we evaluate the probability the response timeis under (up) the threshold as : Low/Total(High/Total)
We call First Local Mean Response Time (LMRT1)the mean response time for all the values under thethreshold and First Local Mean Probability (LMP1) theprobability that the response time is under the threshold.
Moreover we will use the name LMRT2 and LMP2(Second Local Mean Response Time and Second LocalMean Probability) for the values up the threshold. At thestate of the art we never meet system with three differentRT, in that case the proposed approach can be easilyextended. As a result we obtain the following table
Note that the proposed table can be used in order tobuild up Regression Models of the target system, beingderived from a Full Factorial Design in which PR andSP are the primary factors and the response time is theresponse variable and in the section IV-A it is explainedhow this models can be created.
In order to consult the BM table we propose a set ofBM Views, i.e. plots which summarise the most usefulinformation extracted from the measurement. This plotcan be easily generated from the BM table. that reportsless information, but helps in the system analysis. Thefirst two kind of plots (we call the the Summary plots)need an additional performance index: Global ResponseTime (GRT) which is the mean response time, it can beeasily evaluated as: GRT = p1 ∗ v1 + p2 ∗ v2, they are:
• Summary Service Parameter Variation Plot(SSPV plot) it is an histogram plot, in which wereport on x-axis the Service Parameter values andon the y-axis the GRT for each Pending Request).
• Summary Pending Requests Variation Plot (SPRVplot) it is an histogram plot, in which we report onx-axis the Pending Request values and on the y-axis
44 JOURNAL OF COMMUNICATIONS, VOL. 5, NO. 1, JANUARY 2010
© 2010 ACADEMY PUBLISHER
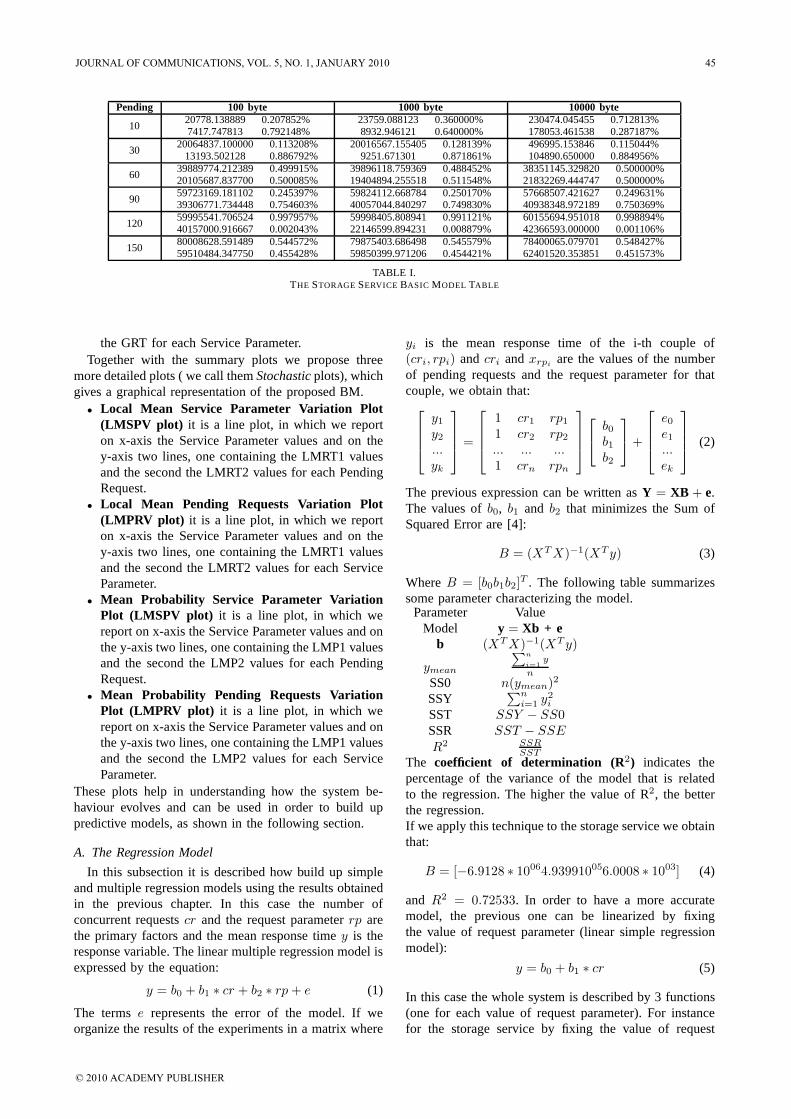
Pending 100 byte 1000 byte 10000 byte
1020778.138889 0.207852%7417.747813 0.792148%
23759.088123 0.360000%8932.946121 0.640000%
230474.045455 0.712813%178053.461538 0.287187%
3020064837.100000 0.113208%
13193.502128 0.886792%20016567.155405 0.128139%
9251.671301 0.871861%496995.153846 0.115044%104890.650000 0.884956%
6039889774.212389 0.499915%20105687.837700 0.500085%
39896118.759369 0.488452%19404894.255518 0.511548%
38351145.329820 0.500000%21832269.444747 0.500000%
9059723169.181102 0.245397%39306771.734448 0.754603%
59824112.668784 0.250170%40057044.840297 0.749830%
57668507.421627 0.249631%40938348.972189 0.750369%
12059995541.706524 0.997957%40157000.916667 0.002043%
59998405.808941 0.991121%22146599.894231 0.008879%
60155694.951018 0.998894%42366593.000000 0.001106%
15080008628.591489 0.544572%59510484.347750 0.455428%
79875403.686498 0.545579%59850399.971206 0.454421%
78400065.079701 0.548427%62401520.353851 0.451573%
TABLE I.THE STORAGE SERVICE BASIC MODEL TABLE
the GRT for each Service Parameter.Together with the summary plots we propose three
more detailed plots ( we call them Stochastic plots), whichgives a graphical representation of the proposed BM.
• Local Mean Service Parameter Variation Plot(LMSPV plot) it is a line plot, in which we reporton x-axis the Service Parameter values and on they-axis two lines, one containing the LMRT1 valuesand the second the LMRT2 values for each PendingRequest.
• Local Mean Pending Requests Variation Plot(LMPRV plot) it is a line plot, in which we reporton x-axis the Service Parameter values and on they-axis two lines, one containing the LMRT1 valuesand the second the LMRT2 values for each ServiceParameter.
• Mean Probability Service Parameter VariationPlot (LMSPV plot) it is a line plot, in which wereport on x-axis the Service Parameter values and onthe y-axis two lines, one containing the LMP1 valuesand the second the LMP2 values for each PendingRequest.
• Mean Probability Pending Requests VariationPlot (LMPRV plot) it is a line plot, in which wereport on x-axis the Service Parameter values and onthe y-axis two lines, one containing the LMP1 valuesand the second the LMP2 values for each ServiceParameter.
These plots help in understanding how the system be-haviour evolves and can be used in order to build uppredictive models, as shown in the following section.
A. The Regression Model
In this subsection it is described how build up simpleand multiple regression models using the results obtainedin the previous chapter. In this case the number ofconcurrent requests cr and the request parameter rp arethe primary factors and the mean response time y is theresponse variable. The linear multiple regression model isexpressed by the equation:
y = b0 + b1 ∗ cr + b2 ∗ rp + e (1)
The terms e represents the error of the model. If weorganize the results of the experiments in a matrix where
yi is the mean response time of the i-th couple of(cri, rpi) and cri and xrpi
are the values of the numberof pending requests and the request parameter for thatcouple, we obtain that:
⎡⎢⎢⎣
y1
y2
...yk
⎤⎥⎥⎦ =
⎡⎢⎢⎣
1 cr1 rp1
1 cr2 rp2
... ... ...1 crn rpn
⎤⎥⎥⎦
⎡⎣
b0
b1
b2
⎤⎦ +
⎡⎢⎢⎣
e0
e1
...ek
⎤⎥⎥⎦ (2)
The previous expression can be written as Y = XB + e.The values of b0, b1 and b2 that minimizes the Sum ofSquared Error are [4]:
B = (XT X)−1(XT y) (3)
Where B = [b0b1b2]T . The following table summarizes
some parameter characterizing the model.Parameter Value
Model y = Xb + eb (XT X)−1(XT y)
ymean
∑n
i=1y
n
SS0 n(ymean)2
SSY∑n
i=1y2
i
SST SSY − SS0SSR SST − SSER2 SSR
SST
The coefficient of determination (R2) indicates thepercentage of the variance of the model that is relatedto the regression. The higher the value of R2, the betterthe regression.If we apply this technique to the storage service we obtainthat:
B = [−6.9128 ∗ 10064.939910056.0008 ∗ 1003] (4)
and R2 = 0.72533. In order to have a more accuratemodel, the previous one can be linearized by fixingthe value of request parameter (linear simple regressionmodel):
y = b0 + b1 ∗ cr (5)
In this case the whole system is described by 3 functions(one for each value of request parameter). For instancefor the storage service by fixing the value of request
JOURNAL OF COMMUNICATIONS, VOL. 5, NO. 1, JANUARY 2010 45
© 2010 ACADEMY PUBLISHER

parameter at 100 the system can be modelled by thefunction 6.
y = −5135804 + 539528 ∗ cr (6)
In this case the value of the coefficient of R2 is 0.98 andthe fig. IV-A shows the relation between the simple linearregression model and the mean response time.
-1e+07 0
1e+07 2e+07 3e+07 4e+07 5e+07 6e+07 7e+07 8e+07
0 20
40
60
80
100
120
140
160
Like
lihoo
d
Response time (micro sec)
Mean response timeLinear multiple regression model
Figure 5. Simple linear regression model
V. RESILIENCE EVALUATION WITH LDS MODELS
The BM is a powerful tool for comparing systembehaviours, in fact it is a tabular representation of thesystem states. In this section we will show how, adoptingthe proposed technique, we are able to offer a clear quan-tification of resilience when degradations are affectingthe system (and in consequence the BM). Moreover theBM helps in isolating the causes of the service qualitydegradation.
A. System Configuration
As first example we compare the measurement aftera system degradation. We assumed that the underlyingweb services platforms (i.e. the hardware, the operatingsystem and the application server) are offered as blackbox, however their configuration (and their degradations)have direct effect on the offered services performance: inthis example we assume that the platform owners changea parameter (the number of threads in the pool for theapplication server), and we will show how this changedirectly affects the BM.
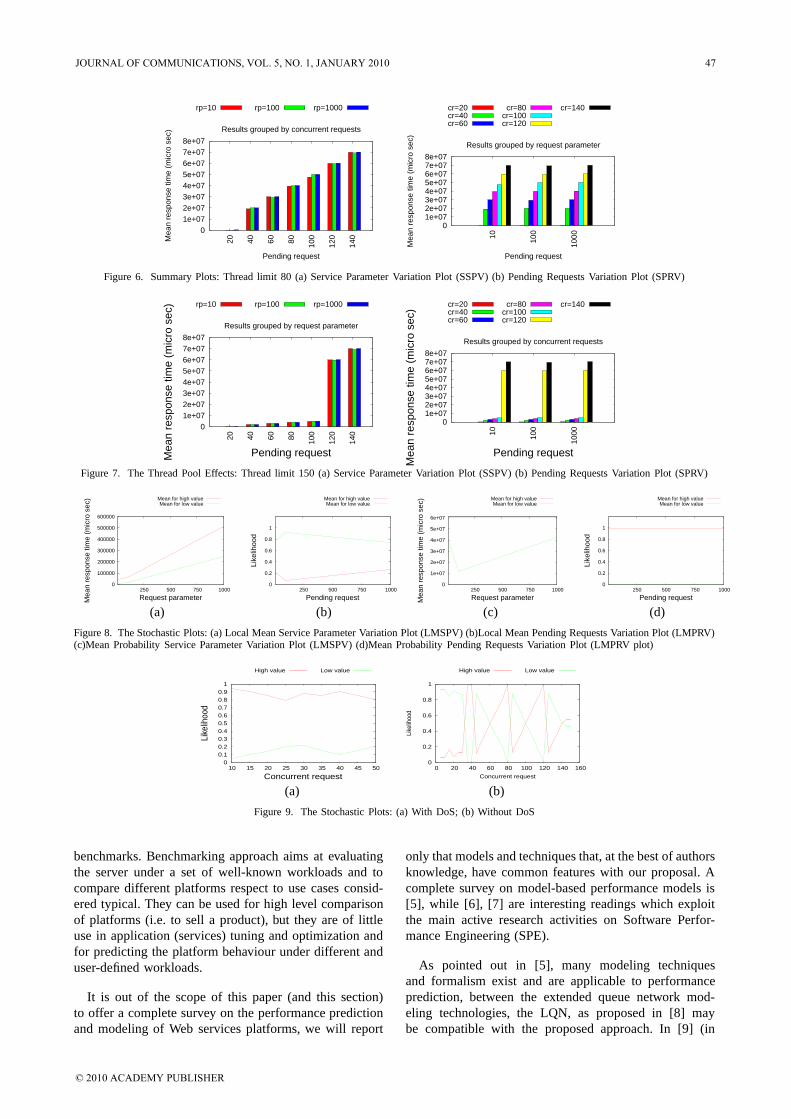
Figures 6 and 7 show the plots SSPV (on side a) andSPRV (on side b) for the storage service. As shown in thefigure, even if these plots are just a summary, they can bereally interesting and they show that our approach is ableto put in evidence details about the system architecture,in fact if we focus on figure 7 we can notice that theservice response has two different behaviour: one beforeand one after a threshold (in our case it is 115 PendingRequests) that differ in term of order of magnitude of themean response time.
In order to put in evidence this behavior, we emulateda system degradation, comparing the results for two theApplication Server thread pool dimension: 80, whose
results are described in figure 6, and 150, whose resultsare described in figure 7. It is interesting to note that thethreshold for the behavior change does not correspond tothe maximum value, but to a value that is a few little: (115for a limit of 150 and 35 for a limit of 80). Moreover bothbefore and after the threshold the behavior are linear.
Figure 8 contains the four stochastic plots for theStorage service. Note how at the Pending threshold value(the one at which the RT mean value changes) we havean inversion of probability between low and high values.
The proposed example put in evidence that the pro-posed benchmarks, together with the resulting model,offer a powerful tool for comparing different platformsstates from the point of view of service performances.
B. Service behaviour changes during a DoS attack
As second example we emulated a simple DoS attack: aclient generates a continuous flood of service invocations,but it never waits for the service completion. The resultis that the application server receives a large number ofuncompleted requests.
We started up the attack emulator and, during theattack, we started up our benchmarks.
The attack we choose to emulate is very simple andhas only a little effect on the server: it represent an initialDoS that will improve in time. We aims at showing thatthe LDS model changes even in this case, helping inidentifying the problem.
We compare the result in two different condition: off-line, i.e. the benchmark takes place in ad-hoc environ-ment, and on-line, i.e. we started up the attack emulatorand, during the attack, we started up our benchmarks.
In order to reduce the benchmark time the on-linemeasurements are focused on a limited set of concurrentrequests (up to 50, while offline measurement offer mea-sures up to 150).
As anticipated the response time in both of the casesis similar, but the stochastic plots show the differencebetween the two different tests, as shown in figure 9,while the probability of up and down values in com-mon condition continuously changes between in the off-line measurement, the presence of the DOS completelychanges the plots.The new behaviour implies that the probability of obtain-ing the better response time (the low value) is alwaysless than the second response value (the worst value).When the attack starts, this result does not affect the finalmean response time, but when the attack increases theperformance loss will be visible.
VI. RELATED WORK
Evaluation and comparison of Web Services (and webservers) platform is a common problem, usually faced, in business world, with the typical benchmarking ap-proach: the platform performances are characterised bya performance index evaluated on a standard workload.SPECweb05 and TPC-App are the most known standard
46 JOURNAL OF COMMUNICATIONS, VOL. 5, NO. 1, JANUARY 2010
© 2010 ACADEMY PUBLISHER
0 1e+07 2e+07 3e+07 4e+07 5e+07 6e+07 7e+07 8e+07
20 40 60 80 100
120
140Mea
n re
spon
se ti
me
(mic
ro s
ec)
Pending request
Results grouped by concurrent requests
rp=10 rp=100 rp=1000
0 1e+07 2e+07 3e+07 4e+07 5e+07 6e+07 7e+07 8e+07
10 100
1000
Mea
n re
spon
se ti
me
(mic
ro s
ec)
Pending request
Results grouped by request parameter
cr=20cr=40cr=60
cr=80cr=100cr=120
cr=140
Figure 6. Summary Plots: Thread limit 80 (a) Service Parameter Variation Plot (SSPV) (b) Pending Requests Variation Plot (SPRV)
0 1e+07 2e+07 3e+07 4e+07 5e+07 6e+07 7e+07 8e+07
20 40 60 80 100
120
140
Mea
n re
spon
se ti
me
(mic
ro s
ec)
Pending request
Results grouped by request parameter
rp=10 rp=100 rp=1000
0 1e+07 2e+07 3e+07 4e+07 5e+07 6e+07 7e+07 8e+07
10 100
1000
Mea
n re
spon
se ti
me
(mic
ro s
ec)
Pending request
Results grouped by concurrent requests
cr=20cr=40cr=60
cr=80cr=100cr=120
cr=140
Figure 7. The Thread Pool Effects: Thread limit 150 (a) Service Parameter Variation Plot (SSPV) (b) Pending Requests Variation Plot (SPRV)
0
100000
200000
300000
400000
500000
600000
250 500 750 1000
Mea
n re
spon
se ti
me
(mic
ro s
ec)
Request parameter
Mean for high valueMean for low value
0
0.2
0.4
0.6
0.8
1
250 500 750 1000
Like
lihoo
d
Pending request
Mean for high valueMean for low value
0
1e+07
2e+07
3e+07
4e+07
5e+07
6e+07
250 500 750 1000
Mea
n re
spon
se ti
me
(mic
ro s
ec)
Request parameter
Mean for high valueMean for low value
0
0.2
0.4
0.6
0.8
1
250 500 750 1000Li
kelih
ood
Pending request
Mean for high valueMean for low value
(a) (b) (c) (d)
Figure 8. The Stochastic Plots: (a) Local Mean Service Parameter Variation Plot (LMSPV) (b)Local Mean Pending Requests Variation Plot (LMPRV)(c)Mean Probability Service Parameter Variation Plot (LMSPV) (d)Mean Probability Pending Requests Variation Plot (LMPRV plot)
0 0.1 0.2 0.3 0.4 0.5 0.6 0.7 0.8 0.9
1
10 15 20 25 30 35 40 45 50
Like
lihoo
d
Concurrent request
High value Low value
0
0.2
0.4
0.6
0.8
1
0 20 40 60 80 100 120 140 160
Like
lihoo
d
Concurrent request
High value Low value
(a) (b)
Figure 9. The Stochastic Plots: (a) With DoS; (b) Without DoS
benchmarks. Benchmarking approach aims at evaluatingthe server under a set of well-known workloads and tocompare different platforms respect to use cases consid-ered typical. They can be used for high level comparisonof platforms (i.e. to sell a product), but they are of littleuse in application (services) tuning and optimization andfor predicting the platform behaviour under different anduser-defined workloads.
It is out of the scope of this paper (and this section)to offer a complete survey on the performance predictionand modeling of Web services platforms, we will report
only that models and techniques that, at the best of authorsknowledge, have common features with our proposal. Acomplete survey on model-based performance models is[5], while [6], [7] are interesting readings which exploitthe main active research activities on Software Perfor-mance Engineering (SPE).
As pointed out in [5], many modeling techniquesand formalism exist and are applicable to performanceprediction, between the extended queue network mod-eling technologies, the LQN, as proposed in [8] maybe compatible with the proposed approach. In [9] (in
JOURNAL OF COMMUNICATIONS, VOL. 5, NO. 1, JANUARY 2010 47
© 2010 ACADEMY PUBLISHER

figure 12) the authors perform some tests repeating thesame calls a fixed number of times (as we do) and infact they have a behaviour similar to the our ones (thedouble value response time, due to the garbage collectionin their analysis) during the validation steps. They areinterested in the system start-up, while we focus on thestable behaviour. Our works try to build up a rigorousapproach to face that kind of problems.
Wu and Woodside in [10], illustrate a framework whichcombines measurement and model, in their approach theworkload is driven by user profiles and on real system us-age. Measurement calibrate the models, while the modelsdefine and manage tests. The main difference with ourapproach is that our measurement defines (discover) themodel and we use user-independent workloads (which weconsider in the simulated predictive model).
The concept of Load Dependent Servers, proposed in[11] (the idea originated in [12], [13]), perfectly matchwith our modeling approach, they use standard benchmark(as workload) and regression models to represent thesystem behaviour, proposing a multi step methodologyfor model calibration. The main differences are the wayin which their models are built and characterised. Theapproach proposed in this paper can be used as analternative way to build up their LDS regression models.
Mathur and Apte, in [14] follow the idea of load-dependent behaviour, modeled by LDS, and study theevolution of LDS, modeling them using queue networks.Note that they focus on simulation analysis, they usemeasurements only to validate their models.
A completely different approach to black box systemmodeling, that should be considered, is the adoption ofcontrol-theoretic feedback loops, some interesting exam-ples of their application to performance of computersystems are [15]–[18].
VII. CONCLUSIONS AND FUTURE WORK
In this paper we proposes a benchmarking technique,which helps both in understanding the behaviour of thehosting platform and in quantifying the system resilience.The approach we adopted in building up the measurementtechnique was to define a target system category (Load de-pendent servers) and force them in a given state, then wederive (in an automated way) the models from the mea-surement. The measurement technique adopted, at the bestof the authors knowledge, even if sporadically adopted,were never defined in this way, and never adopted in orderto build up automatic performance model.
The resulting models were used to compare the servicesbehavior in degraded server conditions, pointing in evi-dence how the benchmarks catch the system degradationand helps in defining their causes.
In our humble opinion a relevant result, obtained ap-plying the technique on the proposed case study, is thediscovering of the LDS multiple behaviour (the double re-sponse time). It is due to the presence of cyclic evolutionsof the server (garbage collections, effects of the memoryhierarchy, ...) and they are (partially) independent from
the workload the server is subject to. This behaviour, incomplex system, may be really hard to discover, but hasa visible effect upon the overall performance evaluationof the target system (the delay introduced sometimes aremany times bigger than the most common response time).This behaviour is very common, but very hard to discoverand reproduce.The next step in the research activity is to use the tech-nique and the models we introduced to create simulationmodels able to predict the system behavior under a givenworkload and in presence of faults. We aims at adoptingthe simulation both in the development stages, in orderto predict how the degradation of a single service couldaffect the behavior of composed services, and at run time,predicting the system evolution under known workloads inorder to optimally tune the system. Moreover we aims atinvestigating more in detail which are the kind of systemsthat can be modeled following the proposed approach,besides web services.
ACKNOWLEDGMENT
We wish to thank prof. Villano and the anonymousreviewers for their comments, which helped us in improvethe paper quality.
REFERENCES
[1] A. van Moorsel et al., “State of the art, Tech. Rep. D2.1.a,February 2009.
[2] B. M. L. S. Don Wilson, “Progress on definingstandardized classes for comparing the dependability ofcomputer systems.” unknown, 2002. [Online]. Available:http://citeseer.ist.psu.edu/570755.html
[3] H. Madeira, “Assessing, measuring, and benchmarkingdependability and resilience,” in LADC, ser. Lecture Notesin Computer Science, A. Bondavalli, F. V. Brasileiro, andS. Rajsbaum, Eds., vol. 4746. Springer, 2007, p. 238.
[4] R. Jain, Ed., The Art of Computer Systems PerformanceAnalysis: Techniques for Experimental Design, Measure-ment, Simulation, and Modeling. Wiley-InterScience, Apr1991.
[5] S. Balsamo, A. D. Marco, P. Inverardi, and M. Simeoni,“Model-based performance prediction in software devel-opment: A survey,” IEEE Trans. Software Eng., vol. 30,no. 5, pp. 295–310, 2004.
[6] C. M. Woodside, G. Franks, and D. C. Petriu, “The futureof software performance engineering,” in FOSE, L. C.Briand and A. L. Wolf, Eds., 2007, pp. 171–187.
[7] C. M. Woodside, “The relationship of performance modelsto data,” in SIPEW, ser. Lecture Notes in Computer Sci-ence, S. Kounev, I. Gorton, and K. Sachs, Eds., vol. 5119.Springer, 2008, pp. 9–28.
[8] C. M. Woodside, J. E. Neilson, D. C. Petriu, and S. Ma-jumdar, “The stochastic rendezvous network model forperformance of synchronous client-server-like distributedsoftware,” IEEE Trans. Computers, vol. 44, no. 1, pp. 20–34, 1995.
[9] J. Xu, A. Oufimtsev, C. M. Woodside, and L. Murphy,“Performance modeling and prediction of enterprise jav-abeans with layered queuing network templates,” ACMSIGSOFT Software Engineering Notes, vol. 31, no. 2,2006.
48 JOURNAL OF COMMUNICATIONS, VOL. 5, NO. 1, JANUARY 2010
© 2010 ACADEMY PUBLISHER

[10] X. Wu and C. M. Woodside, “A calibration frameworkfor capturing and calibrating software performance mod-els,” in EPEW, ser. Lecture Notes in Computer Science,N. Thomas and C. Juiz, Eds., vol. 5261. Springer, 2008,pp. 32–47.
[11] M. Curiel and R. Puigjaner, “Using load dependent serversto reduce the complexity of large client-server simula-tion models,” in Performance Engineering, ser. LectureNotes in Computer Science, R. R. Dumke, C. Rauten-strauch, A. Schmietendorf, and A. Scholz, Eds., vol. 2047.Springer, 2001, pp. 131–147.
[12] J. Zahorjan and E. D. Lazowska, “Incorporating loaddependent servers in approximate mean value analysis,”SIGMETRICS Perform. Eval. Rev., vol. 12, no. 3, pp. 52–62, 1984.
[13] H. Perros, Y. Dallery, and G. Pujolle, “Analysis of aqueueing network model with class dependent windowflow control,” INFOCOM ’92. Eleventh Annual JointConference of the IEEE Computer and CommunicationsSocieties, IEEE, pp. 968–977 vol.2, May 1992.
[14] V. Mathur and V. Apte, “A computational complexity-aware model for performance analysis of software servers,”in MASCOTS, D. DeGroot, P. G. Harrison, H. A. G.Wijshoff, and Z. Segall, Eds. IEEE Computer Society,2004, pp. 537–544.
[15] M. Karlsson and M. Covell, “Dynamic black-box per-formance model estimation for self-tuning regulators,”in ICAC ’05: Proceedings of the Second InternationalConference on Automatic Computing. Washington, DC,USA: IEEE Computer Society, 2005, pp. 172–182.
[16] J. L. Hellerstein, Y. Diao, S. Parek, and D. M. Tilnury,Feedback Control of COmputing Systems. Wiley-IEEEPress, 2004.
[17] C. Lu, Y. Lu, T. Abdelzaher, J. Stankovic, and S. Son,“Feedback control architecture and design methodologyfor service delay guarantees in web servers,” Parallel andDistributed Systems, IEEE Transactions on, vol. 17, no. 9,pp. 1014–1027, Sept. 2006.
[18] T. Abdelzaher, K. Shin, and N. Bhatti, “Performance guar-antees for web server end-systems: a control-theoreticalapproach,” Parallel and Distributed Systems, IEEE Trans-actions on, vol. 13, no. 1, pp. 80–96, Jan 2002.
Massimiliano Rak is an assistant professor at the SecondUniversity Napoli, Italy. His research activities include boththeoretical and experimental issues, in the areas of performanceevaluation of computing systems, parallel and distributed soft-ware engineering, security of information systems. He receivedthe laurea degree in Computer Science Engineering from theUniversity of Napoli Federico II in 1999 and Ph.D. in ComputerEngineering from the Second University of Napoli in 2002.
Rocco Aversa graduated in Electronic Engineering at Univer-sity of Naples sin 1989 and received his Ph.D. in ComputerScience in 1994. He is Associate Professor (Assistant Professorfrom 1995 to 2004)in Computer Science at the Department ofInformation Engineering of the Second University of Naples.His research interests are in the area of parallel and distributedsystems. The research themes include: the use of the mobileagents paradigm in the distributed computing; the design ofsimulation tools for performance analysis of parallel applicationsrunning on heterogeneous computing architectures; the projectand the development of innovative middleware software toenhance the Grid computing platforms. Such scientific activityis documented on scientific journals, international and nationalconference proceedings Rocco Aversa participated to variousresearch projects supported by national organizations (MURST,CNR, ASI) and in collaboration with foreign academic institu-tions. In 2005 he was appointed in the board of the directors of
the consortium ”Centro Regionale Information e Communica-tion Technology” as the representative of the Second Universityof Naples.
Beniamino Di Martino is a Full Professor at the Second Univer-sity of Naples (Italy). He is the author of five international booksand more than 100 publications in international journals andconferences. He served as General and Program Chairman, anda member in programme committees, of several internationalconferences, and as Guest Editor for several journals specialissues. He is an Editorial Board Member and Chair of inter-national journals. He is Vice Chair of the Executive Board ofthe IEEE CS Technical Committee on Scalable Computing. Hisresearch interests include programming and compiler techniquesfor high-performance and grid computing, mobile and intelligentagents, automated program analysis and transformation, reverseengineering, semantic-based information retrieval, the semanticweb and semantic web services.
Antonio Sgueglia is a Ph.D. student at Second University ofNapoli, Italy. His research activities are focused on modelingand on performance evaluation of distributed Business toBusiness SOA architectures. He received the laurea degreein Computer Science Engineering from Second University ofNapoli in 2003. He works as System Engineer at EricssonTelecomunicazioni S.p.A. He worked as senior researcher atCIRA (Italian Aerospace Research Centre)
JOURNAL OF COMMUNICATIONS, VOL. 5, NO. 1, JANUARY 2010 49
© 2010 ACADEMY PUBLISHER