web tables—college costs—a decade of change: 2002-03 …nces.ed.gov/pubs2013/2013170.pdf · a...
TRANSCRIPT

TABLES U.S. DEPARTMENT OF EDUCATION MARCH 2013 NCES 2013-170
College Costs— A Decade of Change: 2002-03 to 2011-12
WEB
This report was prepared for the National Center for Education Statistics under Contract No. ED-IES-09-C-0006 with RTI International. Mention of trade names, commercial products, or organizations does not imply endorsement by the U.S. Government. These Web Tables were authored by Scott Ginder of RTI International and Andrea Sykes of Larium Evaluation Group. The NCES Project Officer was Jessica Shedd. For questions about content or to view this report online, go to http://nces.ed.gov/pubsearch/pubsinfo.asp?pubid=2013170
There is significant interest from a vari-
ety of audiences, including
policymakers and prospective students
and their parents, in college costs and
in understanding how those costs have
changed over time. The Integrated
Postsecondary Education Data System
(IPEDS) collects data on not only the
tuition and required fees charged by
colleges and universities and full cost
of attendance, but the average net
price of attendance (the price after de-
ducting grant/scholarship aid). Net
price data are fairly new data elements
in IPEDS. Institutions began reporting
net price for the 2007-08 academic
year based on requirements in the
Higher Education Opportunity Act
(HEOA). Section 132 of the HEOA re-
quires the Department of Education to
post information on its College Naviga-
tor website about the average net price
for each institution that participates in
the Title IV federal student aid pro-
gram. Under the HEOA, average net
price is reported for full-time, first-time
undergraduate students who received
grant or scholarship aid from federal,
state or local governments, or the insti-
tution. It is calculated by subtracting
the average amount of federal,
state/local government, or institutional
grant or scholarship aid awarded to
those students from the total cost of
attendance. Total cost of attendance is
the sum of published tuition and re-
quired fees, books and supplies, and
room and board and other expenses.
As required by the HEOA, information
on institutions with the highest and
lowest tuition and required fees and
highest and lowest net price in the
most recent academic year, as well as
the highest increase in tuition and re-
quired fees and highest increase in net
price over a three-year period are post-
ed annually in the College Affordability
and Transparency Center
(http://collegecost.ed.gov/catc/). The
information is reported by level and
control of the institutions.
These Web Tables use IPEDS data to provide trends in tuition and required
fees, cost of attendance, and net price
for each of the nine combinations of
control and level of institution, similar
to how such data are presented on the
College Affordability and Transparency
Center. The tables present average tui-
tion and required fee charges for full-
time undergraduate students in each
year from 2002-03 to 2011-12, annual
percentage change, and the ten-year
percentage change by control and lev-
el of institution (table 1 series). Average
in-district tuition and required fees at
public 4- and 2-year institutions are al-
so presented by state, with separate
tables for each institution level (table 2
series).
In addition to tables displaying data for
full-time undergraduates, there are ta-
ble series that display five year trends
in average cost of attendance (table 3
series) and average net price of attend-
ance (table 4 series) for full-time, first-
time undergraduate students. For all
tables presented in these Web Tables,

2
dollar amounts are presented both ad-
justed for inflation and unadjusted.
RELATED NCES REPORTS Knapp, L.G., Kelly-Reid, J.K., Ginder, S.A.
(2012). Postsecondary Institutions and
Price of Attendance in 2011-12; Degrees
and Other Awards Conferred, 2010-11;
and 12-month Enrollment, 2010-11:
First Look (Provisional Data). (NCES-
2012-289rev) U.S. Department of Educa-
tion. Washington, DC: National Center
for Education Statistics. Retrieved No-
vember 2, 2012 from
http://nces.ed.gov/pubsearch.
Wei, C. (2010). What is the price of college?
Total, net, and out of pocket prices in
2007-08 (NCES 2011175). U.S. Depart-
ment of Education. Washington, DC:
National Center for Education Statistics.
Retrieved November 2, 2012, from
http://nces.ed.gov/pubsearch.
DATA Data in these tables were collected
through the Institutional Characteris-
tics and Student Financial Aid
components of the IPEDS survey. The
Institutional Characteristics component
collects basic data on each institution
such as institution name, location, edu-
cational offerings, control or affiliation,
admission requirements, and student
services. It also collects average tuition
and required fees for full-time under-
graduates (overall and for first-time
students) as well as the books and
supplies, room and board, and other
expenses for full-time, first-time un-
dergraduates used in the calculation of
average net price of attendance in the-
se Web Tables. The Student Financial
Aid (SFA) component primarily collects
data on the number of full-time, first-
time undergraduate financial aid recip-
ients and the associated aid amounts
received. In addition, it collects the
counts of students by living arrange-
ment that are needed to calculate the
weighted average needed to generate
the average net price of attendance.
IPEDS is the core postsecondary educa-
tion data collection program for NCES.
Institution-level data are collected from
postsecondary institutions in the Unit-
ed States (50 states and the District of
Columbia) and other U.S. jurisdictions.
For IPEDS, a postsecondary institution
is defined as an organization open to
the public that has the provision of
postsecondary education as one of its
primary missions. IPEDS defines
postsecondary education as formal in-
structional programs with a curriculum
designed primarily for students who
are beyond the compulsory age for
high school. This includes institutions
that offer academic, vocational and
continuing professional education
programs and excludes institutions
that offer only avocational (leisure) and
adult basic education programs. Data
collected via IPEDS cover a variety of
areas, including cost of attendance, en-
rollments, graduation rates, program
completions, student financial aid, in-
stitutional finance, and human
resources.
TECHNICAL NOTES Data presented in these Web Tables
were collected over a ten year period.
While there have been substantial
changes to the IPEDS survey in that
time, the tuition and required fees
items have remained largely un-
changed. Of note, however, is that
prior to 2010-11, non-primarily
postsecondary Title IV institutions were
not required to respond to IPEDS. Many
of these institutions did respond volun-
tarily from 2002-03 to 2009-10, and
their data are included in the tables.
IPEDS collects the cost of attendance
(before aid) for full-time, first-time un-
dergraduate students by living
arrangement—on campus; off campus,
not with family; and off campus, with
family. For each institution, the sepa-
rate costs before aid by living
arrangement were combined into a
single cost before aid using the counts
of students in each living arrangement
reported in the SFA component, as fol-
lows: The cost before aid for each living
arrangement was multiplied by the
proportion of students reported in that
living arrangement. The three products
were then summed to form the single
cost before aid. The institution’s net
price of attendance was then calculat-
ed by subtracting the average grant aid

3
at the institution from the single cost
before aid. The average net price of at-
tendance displayed in these Web
Tables is the per-institution average of
the calculated net price of attendance.
These analyses included Title IV
postsecondary institutions in the Unit-
ed States during the IPEDS data
collections from 2002-03 to 2011-12.
Title IV institutions are those eligible to
participate in the Title IV federal finan-
cial aid programs (e.g. Pell Grants and
Stafford Loans). Title IV institutions in-
clude those that are primarily
postsecondary, such as traditional four
year colleges, as well as institutions
that are not primarily postsecondary.
Not primarily postsecondary institu-
tions are those where the post-
secondary programs are not the main
focus of the institution. Typically these
institutions mainly serve secondary
students, but offer some postsecond-
ary courses or programs of study.
IPEDS DATA CENTER The IPEDS Data Center
(http://nces.ed.gov/ipeds/datacenter)
is the user interface for retrieving and
analyzing IPEDS data on the NCES
website. All IPEDS data are released
through the Data Center. More IPEDS
tables produced by NCES can be found
at the IPEDS Table Library at
http://www.nces.ed.gov/ipeds/tables_l
ibrary/.
For more information, contact
Aurora D’Amico
Postsecondary, Adult, and Career
Education Division
National Center for Education Statistics
1990 K Street NW
Washington, DC 20006-5652
(202) 502-7334

Table 1a.
4-year 2-yearLess than
2-year 4-year 2-yearLess than
2-year 4-year 2-yearLess than
2-year
$4,115 $1,688 $4,364 $14,313 $7,347 $8,896 $11,771 $10,295 $9,6094,621 1,884 4,616 15,128 7,732 8,888 12,037 10,915 9,6854,938 2,020 5,137 16,046 8,241 8,226 13,063 11,248 9,8265,208 2,119 5,167 16,888 8,627 9,384 13,894 11,778 10,6175,494 2,218 5,475 17,943 9,140 8,329 14,261 11,961 11,2255,726 2,297 5,219 19,047 9,500 9,678 14,908 12,357 12,3056,066 2,394 4,903 20,112 10,090 8,980 15,521 13,073 12,6046,402 2,520 5,023 21,050 10,241 8,982 15,701 14,280 12,8076,743 2,729 6,281 22,065 10,784 9,005 15,326 13,679 13,3397,209 2,918 6,469 22,934 12,042 9,901 15,336 14,125 14,307
75.2 72.9 48.2 60.2 63.9 11.3 30.3 37.2 48.9
26.6 25.6 18.4 18.0 17.4 5.5 18.0 14.4 10.516.5 13.0 -5.1 19.1 17.0 -4.3 11.7 11.0 18.718.8 21.9 31.9 14.0 19.3 10.2 -1.2 8.0 13.5
12.3 11.6 5.8 5.7 5.2 -0.1 2.3 6.0 0.86.9 7.2 11.3 6.1 6.6 -7.4 8.5 3.1 1.45.5 4.9 0.6 5.2 4.7 14.1 6.4 4.7 8.15.5 4.6 6.0 6.3 6.0 -11.3 2.6 1.6 5.74.2 3.6 -4.7 6.2 3.9 16.2 4.5 3.3 9.65.9 4.2 -6.1 5.6 6.2 -7.2 4.1 5.8 2.45.5 5.3 2.4 4.7 1.5 # 1.2 9.2 1.65.3 8.3 25.0 4.8 5.3 0.3 -2.4 -4.2 4.26.9 6.9 3.0 3.9 11.7 9.9 0.1 3.3 7.3
2009-10 to 2010-112010-11 to 2011-12
2003-04 to 2004-052004-05 to 2005-062005-06 to 2006-072006-07 to 2007-082007-08 to 2008-09
National Center for Education Statistics
2008-09 to 2009-10
2002-03 to 2005-062005-06 to 2008-092008-09 to 2011-12
2002-03 to 2003-04
Average tuition and required fees (in current dollars) and percentage change for full-time undergraduate students at Title IV institutions, by control and level of institution, and year: United States, academic years 2002-03 to 2011-12
Average tuition and feesYear
2002-032003-04
# Rounds to zero.NOTE: Title IV institutions are those with a written agreement with the Secretary of Education that allows the institution to participate in any of the Title IV federal student financial assistance programs. Tuition and required fees for public institutions are for in-district residency. Tuition and required fees for private institutions are for out-of-state residency. Tuition and required fees are average institutional charges for all full-time students at the institution as reported by the institution, not average amounts paid by students (i.e., charges are not weighted by enrollment). Prior to 2010-11, only Title IV primarily postsecondary institutions were required to respond to the Integrated Postsecondary Education Data System (IPEDS) survey; however, beginning in 2010-11 both primarily postsecondary and not primarily postsecondary institutions were required to respond. For all years reported, not primarily postsecondary institutions are concentrated in the public, less-than-2-year sector. Data for the not primarily postsecondary institutions that responded voluntarily to any of the Institutional Characteristics components prior to fall 2010 are included in the figures displayed here. Data were not imputed for the not primarily postsecondary institutions that did not respond. Response rates for the cells in this table range from 92.3 percent to 100.0 percent. Institutions with academic calendars that differ by program or allow continuous enrollment are not included. U.S. service academies are not included. Definitions for terms used in this table may be found in the IPEDS online glossary located at http://nces.ed.gov/ipeds/glossary/. SOURCE: U.S. Department of Education, National Center for Education Statistics, IPEDS, Fall 2002 - Fall 2011, Institutional Characteristics component.
PrivatePublic Nonprofit For-profit
2004-052005-062006-072007-082008-092009-102010-11
Percentage change
2011-12
2002-03 to 2011-12

Table 1b.
4-year 2-yearLess than
2-year 4-year 2-yearLess than
2-year 4-year 2-yearLess than
2-year
$5,138 $2,108 $5,449 $17,874 $9,174 $11,109 $14,699 $12,856 $11,9995,638 2,299 5,632 18,457 9,433 10,845 14,686 13,317 11,8175,883 2,406 6,120 19,116 9,817 9,800 15,562 13,400 11,7056,001 2,442 5,955 19,460 9,941 10,814 16,011 13,571 12,2346,121 2,471 6,100 19,992 10,184 9,279 15,889 13,326 12,5076,222 2,496 5,672 20,698 10,323 10,517 16,200 13,427 13,3726,311 2,490 5,101 20,924 10,498 9,343 16,148 13,600 13,1136,702 2,639 5,259 22,039 10,722 9,404 16,439 14,952 13,4096,935 2,807 6,460 22,693 11,091 9,261 15,763 14,069 13,7197,209 2,918 6,469 22,934 12,042 9,901 15,336 14,125 14,307
40.3 38.5 18.7 28.3 31.3 -10.9 4.3 9.9 19.2
16.8 15.9 9.3 8.9 8.4 -2.7 8.9 5.6 2.05.2 2.0 -14.3 7.5 5.6 -13.6 0.9 0.2 7.2
14.2 17.2 26.8 9.6 14.7 6.0 -5.0 3.9 9.1
9.7 9.1 3.4 3.3 2.8 -2.4 -0.1 3.6 -1.54.3 4.7 8.7 3.6 4.1 -9.6 6.0 0.6 -0.92.0 1.5 -2.7 1.8 1.3 10.3 2.9 1.3 4.52.0 1.2 2.4 2.7 2.4 -14.2 -0.8 -1.8 2.21.7 1.0 -7.0 3.5 1.4 13.3 2.0 0.8 6.91.4 -0.2 -10.1 1.1 1.7 -11.2 -0.3 1.3 -1.96.2 5.9 3.1 5.3 2.1 0.7 1.8 9.9 2.33.5 6.4 22.8 3.0 3.4 -1.5 -4.1 -5.9 2.33.9 3.9 0.1 1.1 8.6 6.9 -2.7 0.4 4.3
2006-07
Average tuition and required fees (in constant 2011-12 dollars) and percentage change for full-time undergraduate students at Title IV institutions, by control and level of institution, and year: United States, academic years 2002-03 to 2011-12
Year
PrivatePublic Nonprofit For-profit
2002-032003-042004-052005-06
Average tuition and fees
NOTE: Title IV institutions are those with a written agreement with the Secretary of Education that allows the institution to participate in any of the Title IV federal student financial assistance programs. Tuition and required fees for public institutions are for in-district residency. Tuition and required fees for private institutions are for out-of-state residency. Tuition and required fees are average institutional charges for all full-time students at the institution as reported by the institution, not average amounts paid by students (i.e., charges are not weighted by enrollment). Prior to 2010-11, only Title IV primarily postsecondary institutions were required to respond to the Integrated Postsecondary Education Data System (IPEDS) survey; however, beginning in 2010-11 both primarily postsecondary and not primarily postsecondary institutions were required to respond. For all years reported, not primarily postsecondary institutions are concentrated in the public, less-than-2-year sector.Data for the not primarily postsecondary institutions that responded voluntarily to any of the Institutional Characteristics components prior to fall 2010 are included in the figures displayed here. Data were not imputed for the not primarily postsecondary institutions that did not respond. Response rates for the cells in this table range from 92.3 percent to 100.0 percent. All amounts from prior years were converted to 2011-12 dollars using the average Consumer Price Index (CPI) values for the 12-month period ending in October of the academic year the data represent (e.g., October 2002) and the average CPI values for the 12-month period ending in October 2011. Institutions with academic calendars that differ by program or allow continuous enrollment are not included. U.S. service academies are not included. Definitions for terms used in this table may be found in the IPEDS online glossary located at http://nces.ed.gov/ipeds/glossary/. SOURCE: U.S. Department of Education, National Center for Education Statistics, IPEDS, Fall 2002 - Fall 2011, Institutional Characteristics component.
2002-03 to 2003-042003-04 to 2004-052004-05 to 2005-062005-06 to 2006-072006-07 to 2007-082007-08 to 2008-09
Percentage change
National Center for Education Statistics
2008-09 to 2009-102009-10 to 2010-112010-11 to 2011-12
2007-082008-092009-102010-112011-12
2002-03 to 2011-12
2002-03 to 2005-062005-06 to 2008-092008-09 to 2011-12

Table 1c.
4-year 2-yearLess than
2-year 4-year 2-yearLess than
2-year 4-year 2-yearLess than
2-year580 1,106 86 1,290 199 24 218 371 96 584 1,106 102 1,300 204 28 310 401 133 611 1,087 65 1,284 195 26 321 392 152 612 1,074 57 1,294 188 13 373 389 96 619 1,063 53 1,294 180 12 413 382 88 631 1,050 53 1,295 153 17 441 387 79 631 1,038 49 1,303 150 13 480 392 77 652 1,006 45 1,297 140 15 513 436 68 658 985 23 1,302 141 11 595 438 48 661 973 24 1,314 147 12 656 450 57
2006-07
National Center for Education StatisticsNumber of Title IV institutions reporting tuition and required fees for full-time undergraduate students, by control and level of institution, and year: United States, academic years 2002-03 to 2011-12
Year
PrivateNonprofit For-profit
2002-032003-042004-052005-06
Public
NOTE: Title IV institutions are those with a written agreement with the Secretary of Education that allows the institution to participate in any of the Title IV federal student financial assistance programs. Prior to 2010-11, only Title IV primarily postsecondary institutions were required to respond to the Integrated Postsecondary Education Data System (IPEDS) survey; however, beginning in 2010-11 both primarily postsecondary and not primarily postsecondary institutions were required to respond. Not primarily postsecondary institutions that responded voluntarily to any of the Institutional Characteristics components prior to fall 2010 are included in the figures displayed here. For all years reported, not primarily postsecondary institutions are concentrated in the public, less-than-2-year sector. Institutions with academic calendars that differ by program or allow continuous enrollment are not included. U.S. service academies are not included. Definitions for terms used in this table may be found in the IPEDS online glossary located at http://nces.ed.gov/ipeds/glossary/. SOURCE: U.S. Department of Education, National Center for Education Statistics, IPEDS, Fall 2002 - Fall 2011, Institutional Characteristics component.
2007-082008-092009-102010-112011-12

Table 2a.
2002-03 2003-04 2004-05 2005-06 2006-07 2007-08 2008-09 2009-10 2010-11 2011-12$4,115 $4,621 $4,938 $5,208 $5,494 $5,726 $6,066 $6,402 $6,743 $7,209 75.2
3,421 3,830 4,198 4,399 4,485 4,662 5,328 5,830 6,492 7,234 111.43,206 3,477 3,835 4,076 4,445 4,743 5,004 5,249 5,570 5,958 85.92,576 3,574 4,063 4,388 4,597 4,895 5,551 5,284 5,827 6,786 163.43,416 3,731 4,019 4,297 4,662 5,077 5,440 5,592 5,880 6,158 80.34,234 6,172 4,105 4,173 4,173 4,592 4,965 6,107 6,821 8,313 96.3
3,241 3,546 3,798 4,567 4,658 5,186 5,655 6,141 6,531 6,743 108.04,954 5,536 6,112 6,419 6,846 6,775 7,377 7,844 8,290 8,473 71.04,928 5,397 5,965 6,564 6,743 7,148 7,564 7,984 8,470 9,124 85.12,070 2,070 2,070 2,070 2,670 3,140 3,140 5,370 7,000 7,000 238.22,600 2,599 2,664 2,888 2,896 2,868 3,126 3,315 3,529 3,858 48.4
2,669 2,846 3,054 3,274 3,385 3,524 3,763 4,200 4,766 5,297 98.52,592 2,675 2,772 2,445 2,950 3,464 4,038 4,566 5,104 5,661 118.43,004 3,293 3,561 3,889 4,110 4,328 4,556 4,840 5,279 5,642 87.84,538 5,006 5,780 6,466 7,150 7,952 8,844 9,394 9,474 10,099 122.64,050 4,773 5,041 5,212 5,541 5,820 6,128 6,465 6,774 7,026 73.5
4,139 4,979 5,403 5,616 6,036 6,215 6,427 6,704 7,141 7,534 82.02,956 3,416 3,870 3,845 4,178 4,270 4,559 4,878 5,025 5,245 77.43,302 3,757 4,349 4,938 5,562 6,071 6,517 6,816 7,135 7,502 127.22,910 3,014 3,440 3,602 3,657 3,728 3,912 4,113 4,492 4,996 71.74,451 4,836 5,282 5,691 6,201 6,814 7,537 7,964 8,324 8,745 96.5
5,275 6,037 6,439 6,923 6,981 7,086 7,234 7,374 7,651 7,927 50.34,939 5,918 6,635 6,961 7,292 7,552 7,457 8,233 8,596 9,056 83.45,244 5,788 5,942 6,617 7,140 8,027 8,581 9,127 9,417 10,031 91.34,870 5,320 6,037 6,442 7,208 7,339 7,800 8,455 8,953 9,458 94.23,516 3,543 3,798 3,971 4,334 4,609 4,817 4,852 5,174 5,554 58.0
4,253 5,261 5,407 5,427 5,859 6,130 6,336 6,552 6,584 7,033 65.43,810 4,006 4,352 4,700 5,260 5,139 5,181 5,297 5,398 5,643 48.12,800 3,901 4,353 4,443 4,745 5,003 5,374 5,785 6,118 6,344 126.62,249 2,321 2,315 2,481 2,548 2,724 2,976 3,214 3,590 4,048 80.04,811 6,384 6,760 7,219 7,731 8,286 8,831 9,506 10,276 11,604 141.2
6,657 7,224 7,890 8,572 9,257 9,528 10,306 10,623 11,115 11,570 73.82,649 2,772 2,690 2,964 3,153 3,301 3,499 3,716 3,993 4,045 52.74,407 4,973 5,010 5,090 5,090 5,127 5,171 5,834 5,797 6,205 40.82,847 3,006 3,339 3,424 3,802 4,042 4,122 4,300 4,956 5,382 89.03,084 3,467 4,094 4,583 4,919 5,155 5,132 5,368 5,476 5,475 77.5
4,768 5,396 6,210 6,398 6,810 6,287 6,220 6,144 6,436 6,652 39.52,403 2,873 3,195 3,464 3,702 3,927 4,351 4,351 4,605 4,885 103.34,419 5,136 5,662 6,000 6,414 6,612 7,166 7,651 8,078 8,587 94.37,139 7,870 8,449 8,883 9,193 9,629 10,170 10,557 11,026 11,567 62.04,808 5,099 5,546 5,980 6,341 6,720 7,225 7,968 8,731 9,317 93.8
See notes at end of table.
National Center for Education Statistics
California
Average in-district tuition and required fees (in current dollars) and percentage change for full-time undergraduate students at Title IV public 4-year institutions, by state or jurisdiction and year: United States, academic years 2002-03 to 2011-12
State or jurisdiction
AveragePercentage
change 2002-03 to 2011-12
United States
Alabama AlaskaArizonaArkansas
Indiana
Colorado Connecticut DelawareDistrict of Columbia Florida
GeorgiaHawaiiIdahoIllinois
Mississippi
IowaKansas KentuckyLouisianaMaine
Maryland MassachusettsMichiganMinnesota
North Dakota
MissouriMontanaNebraskaNevadaNew Hampshire
New JerseyNew MexicoNew York North Carolina
OhioOklahomaOregonPennsylvaniaRhode Island

Table 2a.
2002-03 2003-04 2004-05 2005-06 2006-07 2007-08 2008-09 2009-10 2010-11 2011-125,443 6,665 6,641 7,059 7,744 8,159 8,867 9,345 10,054 10,304 89.33,563 4,430 4,634 4,523 4,764 5,066 5,446 5,817 6,070 6,655 86.83,506 3,964 4,145 4,655 4,909 5,227 5,524 5,886 6,235 6,797 93.92,950 3,215 3,888 4,053 4,462 4,870 5,325 5,667 5,977 6,339 114.92,468 2,797 3,050 3,307 3,620 3,872 4,100 4,403 4,661 5,032 103.9
6,399 6,780 7,203 7,610 8,034 8,547 9,516 10,119 10,450 10,949 71.14,402 5,437 5,922 6,001 6,564 7,011 7,504 7,907 8,746 9,452 114.74,270 4,587 4,884 5,092 5,185 4,635 4,856 4,983 5,536 6,296 47.52,725 2,983 3,322 3,490 3,797 4,160 4,436 4,578 4,592 4,897 79.73,792 4,502 5,070 5,430 5,783 5,910 6,285 6,664 7,052 7,454 96.62,997 3,090 2,721 2,874 2,951 2,990 3,057 3,162 3,333 3,501 16.8
Utah
South CarolinaSouth DakotaTennesseeTexas
Average in-district tuition and required fees (in current dollars) and percentage change for full-time undergraduate students at Title IV public 4-year institutions, by state or jurisdiction and year: United States, academic years 2002-03 to 2011-12—Continued
State or jurisdiction
AveragePercentage
change 2002-03 to 2011-12
WyomingNOTE: Title IV institutions are those with a written agreement with the Secretary of Education that allows the institution to participate in any of the Title IV federal student financial assistance programs. Tuition and required fees are average institutional charges for all full-time students at the institution as reported by the institution, not average amounts paid by students (i.e., charges are not weighted by enrollment). Prior to 2010-11, only Title IV primarily postsecondary institutions were required to respond to the Integrated Postsecondary Education Data System (IPEDS) survey; however, beginning in 2010-11 both primarily postsecondary and not primarily postsecondary institutions were required to respond. Data for the not primarily postsecondary institutions that responded voluntarily to any of the Institutional Characteristics components prior to fall 2010 are included in the figures displayed here. For all years reported, not primarily postsecondary institutions are concentrated in the public, less-than-2-year sector. Data were not imputed for the not primarily postsecondary institutions that did not respond. Overall response rates for the cells in this table range from 99.5 percent to 100.0 percent. Institutions with academic calendars that differ by program or allow continuous enrollment are not included. U.S. service academies are not included. Definitions for terms used in this table may be found in the IPEDS online glossary located at http://nces.ed.gov/ipeds/glossary/. SOURCE: U.S. Department of Education, National Center for Education Statistics, IPEDS, Fall 2002 - Fall 2011, Institutional Characteristics component.
VermontVirginiaWashingtonWest VirginiaWisconsin

Table 2b.
2002-03 2003-04 2004-05 2005-06 2006-07 2007-08 2008-09 2009-10 2010-11 2011-12$5,138 $5,638 $5,883 $6,001 $6,121 $6,222 $6,311 $6,702 $6,935 $7,209 40.3
4,272 4,673 5,001 5,069 4,996 5,066 5,543 6,104 6,677 7,234 69.34,003 4,242 4,569 4,697 4,952 5,154 5,206 5,495 5,728 5,958 48.83,217 4,360 4,840 5,056 5,121 5,319 5,775 5,532 5,993 6,786 110.94,265 4,553 4,788 4,951 5,194 5,517 5,660 5,855 6,048 6,158 44.45,288 7,531 4,890 4,809 4,650 4,990 5,165 6,394 7,015 8,313 57.2
4,048 4,327 4,524 5,263 5,190 5,635 5,883 6,429 6,717 6,743 66.66,187 6,754 7,281 7,396 7,628 7,362 7,674 8,212 8,526 8,473 37.06,154 6,585 7,106 7,564 7,513 7,767 7,869 8,359 8,711 9,124 48.32,585 2,526 2,466 2,385 2,975 3,412 3,267 5,622 7,199 7,000 170.83,247 3,171 3,173 3,328 3,226 3,117 3,252 3,471 3,629 3,858 18.8
3,332 3,472 3,638 3,773 3,772 3,830 3,915 4,397 4,902 5,297 59.03,237 3,264 3,303 2,817 3,286 3,764 4,200 4,780 5,249 5,661 74.93,751 4,018 4,242 4,481 4,579 4,703 4,740 5,067 5,429 5,642 50.45,666 6,107 6,885 7,451 7,966 8,641 9,201 9,835 9,743 10,099 78.25,057 5,823 6,006 6,006 6,174 6,325 6,375 6,769 6,967 7,026 38.9
5,169 6,075 6,437 6,471 6,725 6,753 6,686 7,019 7,344 7,534 45.73,692 4,168 4,610 4,431 4,655 4,640 4,743 5,107 5,168 5,245 42.14,123 4,584 5,181 5,690 6,196 6,597 6,780 7,136 7,339 7,502 81.93,634 3,677 4,098 4,151 4,074 4,051 4,070 4,307 4,619 4,996 37.55,558 5,900 6,292 6,557 6,908 7,404 7,841 8,339 8,561 8,745 57.3
6,587 7,366 7,671 7,978 7,778 7,700 7,526 7,720 7,869 7,927 20.36,168 7,220 7,904 8,021 8,124 8,207 7,758 8,620 8,841 9,056 46.86,549 7,062 7,079 7,625 7,955 8,722 8,927 9,555 9,685 10,031 53.26,081 6,491 7,192 7,423 8,031 7,975 8,114 8,852 9,208 9,458 55.54,391 4,323 4,524 4,576 4,829 5,009 5,011 5,080 5,321 5,554 26.5
5,311 6,418 6,442 6,253 6,528 6,662 6,592 6,860 6,772 7,033 32.44,757 4,888 5,184 5,416 5,861 5,585 5,390 5,546 5,552 5,643 18.63,496 4,760 5,186 5,120 5,287 5,437 5,591 6,057 6,293 6,344 81.52,808 2,832 2,758 2,859 2,839 2,960 3,096 3,365 3,692 4,048 44.16,008 7,790 8,053 8,318 8,613 9,004 9,188 9,953 10,569 11,604 93.2
8,313 8,815 9,400 9,878 10,313 10,354 10,722 11,122 11,432 11,570 39.23,308 3,382 3,204 3,416 3,513 3,587 3,640 3,891 4,107 4,045 22.35,503 6,068 5,969 5,865 5,671 5,571 5,379 6,109 5,962 6,205 12.83,556 3,667 3,978 3,945 4,236 4,392 4,289 4,502 5,098 5,382 51.43,851 4,230 4,877 5,281 5,480 5,602 5,339 5,620 5,631 5,475 42.2
5,955 6,584 7,398 7,373 7,588 6,831 6,471 6,432 6,619 6,652 11.73,000 3,505 3,806 3,992 4,124 4,267 4,527 4,556 4,737 4,885 62.85,519 6,267 6,746 6,914 7,147 7,185 7,455 8,011 8,308 8,587 55.68,916 9,602 10,066 10,237 10,243 10,463 10,581 11,053 11,340 11,567 29.76,003 6,221 6,607 6,891 7,065 7,302 7,516 8,342 8,980 9,317 55.2
See notes at end of table.
National Center for Education Statistics
California
Average in-district tuition and required fees (in constant 2011-12 dollars) and percentage change for full-time undergraduate students at Title IV public 4-year institutions, by state or jurisdiction and year: United States, academic years 2002-03 to 2011-12
State or jurisdiction
AveragePercentage
change 2002-03 to 2011-12
United States
Alabama AlaskaArizonaArkansas
Indiana
Colorado Connecticut DelawareDistrict of Columbia Florida
GeorgiaHawaiiIdahoIllinois
Mississippi
IowaKansas KentuckyLouisianaMaine
Maryland MassachusettsMichiganMinnesota
North Dakota
MissouriMontanaNebraskaNevadaNew Hampshire
New JerseyNew MexicoNew York North Carolina
OhioOklahomaOregonPennsylvaniaRhode Island

Table 2b.
2002-03 2003-04 2004-05 2005-06 2006-07 2007-08 2008-09 2009-10 2010-11 2011-126,797 8,132 7,911 8,134 8,628 8,867 9,224 9,784 10,341 10,304 51.64,449 5,406 5,521 5,212 5,308 5,505 5,666 6,090 6,243 6,655 49.64,378 4,836 4,938 5,365 5,469 5,680 5,747 6,163 6,413 6,797 55.23,684 3,923 4,631 4,671 4,971 5,292 5,540 5,933 6,148 6,339 72.13,082 3,413 3,634 3,811 4,033 4,207 4,266 4,610 4,794 5,032 63.3
7,991 8,272 8,581 8,770 8,952 9,287 9,900 10,594 10,748 10,949 37.05,497 6,634 7,055 6,915 7,314 7,619 7,807 8,278 8,995 9,452 71.95,332 5,597 5,819 5,868 5,777 5,037 5,052 5,217 5,694 6,296 18.13,403 3,639 3,957 4,022 4,230 4,520 4,615 4,793 4,723 4,897 43.94,735 5,493 6,040 6,257 6,443 6,423 6,539 6,977 7,252 7,454 57.43,743 3,770 3,242 3,312 3,288 3,249 3,180 3,311 3,428 3,501 -6.5
Utah
South CarolinaSouth DakotaTennesseeTexas
Average in-district tuition and required fees (in constant 2011-12 dollars) and percentage change for full-time undergraduate students at Title IV public 4-year institutions, by state or jurisdiction and year: United States, academic years 2002-03 to 2011-12—Continued
State or jurisdiction
AveragePercentage
change 2002-03 to 2011-12
WyomingNOTE: Title IV institutions are those with a written agreement with the Secretary of Education that allows the institution to participate in any of the Title IV federal student financial assistance programs. Tuition and required fees are average institutional charges for all full-time students at the institution as reported by the institution, not average amounts paid by students (i.e., charges are not weighted by enrollment). Prior to 2010-11, only Title IV primarily postsecondary institutions were required to respond to the Integrated Postsecondary Education Data System (IPEDS) survey; however, beginning in 2010-11 both primarily postsecondary and not primarily postsecondary institutions were required to respond. For all years reported, not primarily postsecondary institutions are concentrated in the public, less-than-2-year sector. Data for the not primarily postsecondary institutions that responded voluntarily to any of the Institutional Characteristics components prior to fall 2010 are included in the figures displayed here. Data were not imputed for the not primarily postsecondary institutions that did not respond. Overall response rates for the cells in this table range from 99.5 percent to 100.0 percent. All amounts from prior years were converted to 2011-12 dollars using the average Consumer Price Index (CPI) values for the 12-month period ending in October of the academic year the data represent (e.g., October 2002) and the average CPI values for the 12-month period ending in October 2011. Institutions with academic calendars that differ by program or allow continuous enrollment are not included. U.S. service academies are not included. Definitions for terms used in this table may be found in the IPEDS online glossary located at http://nces.ed.gov/ipeds/glossary/. SOURCE: U.S. Department of Education, National Center for Education Statistics, IPEDS, Fall 2002 - Fall 2011, Institutional Characteristics component.
VermontVirginiaWashingtonWest VirginiaWisconsin

Table 2c.
2002-03 2003-04 2004-05 2005-06 2006-07 2007-08 2008-09 2009-10 2010-11 2011-12580 584 611 612 619 631 631 652 658 661
18 17 16 14 14 14 14 14 14 143 3 3 3 3 3 3 3 3 35 5 5 5 6 6 3 4 4 4
11 11 11 11 11 11 11 11 11 1110 9 31 32 33 33 33 33 33 33
13 13 13 12 12 12 12 12 12 138 8 8 8 8 9 9 9 9 92 2 2 2 2 2 2 2 2 21 1 1 1 1 1 1 1 1 1
11 14 15 15 17 18 19 26 32 33
21 22 21 21 22 24 25 27 27 273 3 3 4 4 4 4 4 4 44 4 4 4 4 4 4 4 4 4
12 12 12 12 12 12 12 12 12 1214 14 14 15 15 15 15 15 15 15
3 3 3 3 3 3 3 3 3 38 8 8 9 9 8 8 8 8 88 8 8 8 8 8 8 8 8 8
14 15 16 15 16 16 16 16 16 168 8 8 8 8 8 8 8 8 8
13 13 13 13 13 13 13 13 13 1314 14 14 14 14 14 13 13 13 1315 15 15 15 15 15 15 15 15 1511 12 12 12 11 11 11 12 12 129 9 9 9 9 9 9 9 9 9
13 14 13 13 13 13 13 13 13 136 6 6 6 6 6 6 6 6 67 7 7 7 7 7 7 7 7 73 4 5 5 5 6 6 6 6 64 5 5 5 5 5 5 5 5 5
13 13 13 13 13 14 14 14 14 147 7 8 8 8 8 8 8 8 9
42 40 40 40 41 41 41 41 41 4116 16 16 16 16 16 16 16 16 167 7 7 7 7 7 8 8 8 9
25 23 25 27 27 28 29 35 35 3514 14 15 15 15 16 16 16 16 169 9 9 9 9 9 9 9 9 9
43 41 41 41 41 41 41 41 41 412 2 2 2 2 2 2 2 2 2
See notes at end of table.
United States
State or jurisdiction
Number
National Center for Education StatisticsNumber of Title IV public 4-year institutions reporting in-district tuition and required fees for full-time undergraduate students, by state or jurisdiction and year: United States, academic years 2002-03 to 2011-12
Florida
Alabama AlaskaArizonaArkansasCalifornia
Colorado Connecticut DelawareDistrict of Columbia
Maine
GeorgiaHawaiiIdahoIllinoisIndiana
IowaKansas KentuckyLouisiana
New Hampshire
Maryland MassachusettsMichiganMinnesotaMississippi
MissouriMontanaNebraskaNevada
Rhode Island
New JerseyNew MexicoNew York North CarolinaNorth Dakota
OhioOklahomaOregonPennsylvania

Table 2c.
2002-03 2003-04 2004-05 2005-06 2006-07 2007-08 2008-09 2009-10 2010-11 2011-1212 12 13 13 13 13 13 13 13 138 9 9 7 7 7 7 7 7 79 9 9 9 9 9 9 9 9 9
39 40 40 43 44 44 44 44 44 446 7 7 7 7 7 7 7 7 6
5 5 5 5 5 5 5 5 5 515 15 15 15 15 15 15 15 15 1511 11 11 8 9 13 13 16 16 1611 11 11 12 11 11 11 12 12 1213 13 13 13 13 14 14 14 14 141 1 1 1 1 1 1 1 1 1
NOTE: Title IV institutions are those with a written agreement with the Secretary of Education that allows the institution to participate in any of the Title IV federal student financial assistance programs. Prior to 2010-11, only Title IV primarily postsecondary institutions were required to respond to the Integrated Postsecondary Education Data System (IPEDS) survey; however, beginning in 2010-11 both primarily postsecondary and not primarily postsecondary institutions were required to respond. Not primarily postsecondary institutions that responded voluntarily to any of the Institutional Characteristics components prior to fall 2010 are included in the figures displayed here. For all years reported, not primarily postsecondary institutions are concentrated in the public, less-than-2-year sector. Institutions with academic calendars that differ by program or allow continuous enrollment are not included. U.S. service academies are not included. Definitions for terms used in this table may be found in the IPEDS online glossary located at http://nces.ed.gov/ipeds/glossary/. SOURCE: U.S. Department of Education, National Center for Education Statistics, IPEDS, Fall 2002 - Fall 2011, Institutional Characteristics component.
Number of Title IV public 4-year institutions reporting in-district tuition and required fees for full-time undergraduate students, by state or jurisdiction and year: United States, academic years 2002-03 to 2011-12—Continued
WashingtonWest VirginiaWisconsinWyoming
Virginia
State or jurisdiction
Number
South CarolinaSouth DakotaTennesseeTexasUtah
Vermont
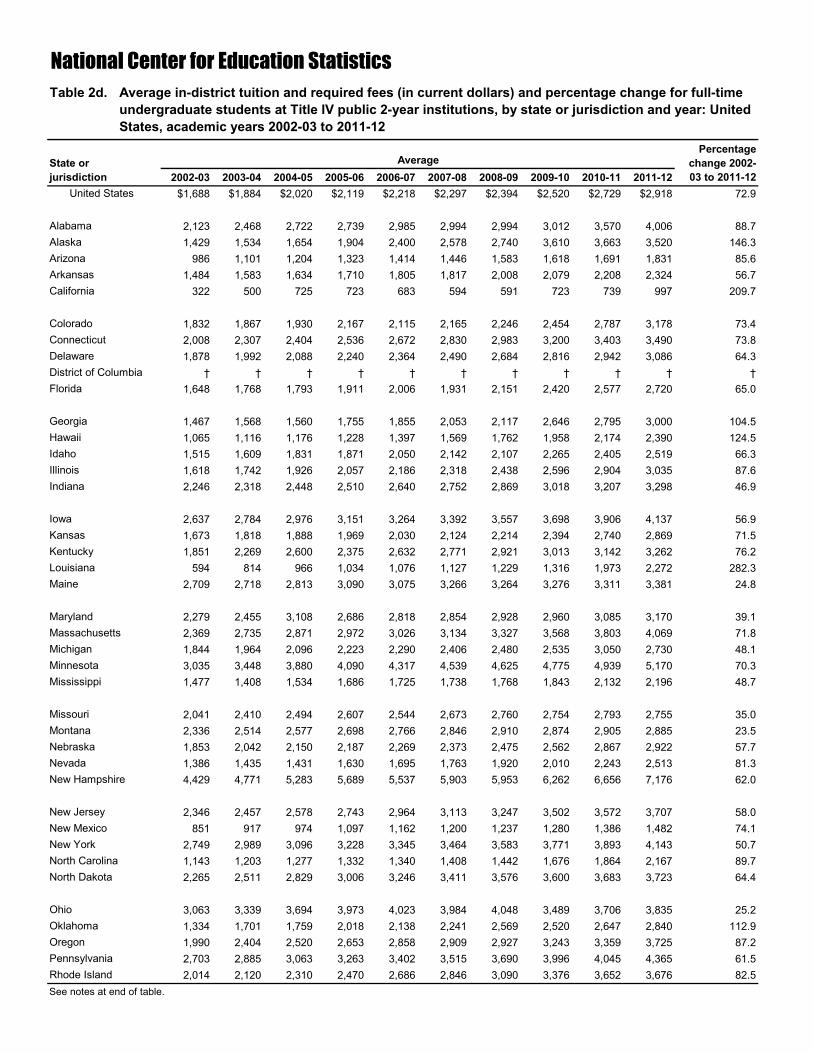
Table 2d.
2002-03 2003-04 2004-05 2005-06 2006-07 2007-08 2008-09 2009-10 2010-11 2011-12$1,688 $1,884 $2,020 $2,119 $2,218 $2,297 $2,394 $2,520 $2,729 $2,918 72.9
2,123 2,468 2,722 2,739 2,985 2,994 2,994 3,012 3,570 4,006 88.71,429 1,534 1,654 1,904 2,400 2,578 2,740 3,610 3,663 3,520 146.3
986 1,101 1,204 1,323 1,414 1,446 1,583 1,618 1,691 1,831 85.61,484 1,583 1,634 1,710 1,805 1,817 2,008 2,079 2,208 2,324 56.7
322 500 725 723 683 594 591 723 739 997 209.7
1,832 1,867 1,930 2,167 2,115 2,165 2,246 2,454 2,787 3,178 73.42,008 2,307 2,404 2,536 2,672 2,830 2,983 3,200 3,403 3,490 73.81,878 1,992 2,088 2,240 2,364 2,490 2,684 2,816 2,942 3,086 64.3
† † † † † † † † † † †1,648 1,768 1,793 1,911 2,006 1,931 2,151 2,420 2,577 2,720 65.0
1,467 1,568 1,560 1,755 1,855 2,053 2,117 2,646 2,795 3,000 104.51,065 1,116 1,176 1,228 1,397 1,569 1,762 1,958 2,174 2,390 124.51,515 1,609 1,831 1,871 2,050 2,142 2,107 2,265 2,405 2,519 66.31,618 1,742 1,926 2,057 2,186 2,318 2,438 2,596 2,904 3,035 87.62,246 2,318 2,448 2,510 2,640 2,752 2,869 3,018 3,207 3,298 46.9
2,637 2,784 2,976 3,151 3,264 3,392 3,557 3,698 3,906 4,137 56.91,673 1,818 1,888 1,969 2,030 2,124 2,214 2,394 2,740 2,869 71.51,851 2,269 2,600 2,375 2,632 2,771 2,921 3,013 3,142 3,262 76.2
594 814 966 1,034 1,076 1,127 1,229 1,316 1,973 2,272 282.32,709 2,718 2,813 3,090 3,075 3,266 3,264 3,276 3,311 3,381 24.8
2,279 2,455 3,108 2,686 2,818 2,854 2,928 2,960 3,085 3,170 39.12,369 2,735 2,871 2,972 3,026 3,134 3,327 3,568 3,803 4,069 71.81,844 1,964 2,096 2,223 2,290 2,406 2,480 2,535 3,050 2,730 48.13,035 3,448 3,880 4,090 4,317 4,539 4,625 4,775 4,939 5,170 70.31,477 1,408 1,534 1,686 1,725 1,738 1,768 1,843 2,132 2,196 48.7
2,041 2,410 2,494 2,607 2,544 2,673 2,760 2,754 2,793 2,755 35.02,336 2,514 2,577 2,698 2,766 2,846 2,910 2,874 2,905 2,885 23.51,853 2,042 2,150 2,187 2,269 2,373 2,475 2,562 2,867 2,922 57.71,386 1,435 1,431 1,630 1,695 1,763 1,920 2,010 2,243 2,513 81.34,429 4,771 5,283 5,689 5,537 5,903 5,953 6,262 6,656 7,176 62.0
2,346 2,457 2,578 2,743 2,964 3,113 3,247 3,502 3,572 3,707 58.0851 917 974 1,097 1,162 1,200 1,237 1,280 1,386 1,482 74.1
2,749 2,989 3,096 3,228 3,345 3,464 3,583 3,771 3,893 4,143 50.71,143 1,203 1,277 1,332 1,340 1,408 1,442 1,676 1,864 2,167 89.72,265 2,511 2,829 3,006 3,246 3,411 3,576 3,600 3,683 3,723 64.4
3,063 3,339 3,694 3,973 4,023 3,984 4,048 3,489 3,706 3,835 25.21,334 1,701 1,759 2,018 2,138 2,241 2,569 2,520 2,647 2,840 112.91,990 2,404 2,520 2,653 2,858 2,909 2,927 3,243 3,359 3,725 87.22,703 2,885 3,063 3,263 3,402 3,515 3,690 3,996 4,045 4,365 61.52,014 2,120 2,310 2,470 2,686 2,846 3,090 3,376 3,652 3,676 82.5
See notes at end of table.
National Center for Education Statistics
California
Average in-district tuition and required fees (in current dollars) and percentage change for full-time undergraduate students at Title IV public 2-year institutions, by state or jurisdiction and year: United States, academic years 2002-03 to 2011-12
State or jurisdiction
AveragePercentage
change 2002-03 to 2011-12
United States
Alabama AlaskaArizonaArkansas
Indiana
Colorado Connecticut DelawareDistrict of Columbia Florida
GeorgiaHawaiiIdahoIllinois
Mississippi
IowaKansas KentuckyLouisianaMaine
Maryland MassachusettsMichiganMinnesota
North Dakota
MissouriMontanaNebraskaNevadaNew Hampshire
New JerseyNew MexicoNew York North Carolina
OhioOklahomaOregonPennsylvaniaRhode Island

Table 2d.
2002-03 2003-04 2004-05 2005-06 2006-07 2007-08 2008-09 2009-10 2010-11 2011-122,339 2,831 2,978 3,100 3,278 3,409 3,588 3,737 3,926 4,032 72.43,158 3,018 3,067 3,350 3,744 3,884 4,144 4,502 4,543 4,857 53.81,749 2,074 2,205 2,394 2,470 2,628 2,775 2,938 3,123 3,377 93.11,082 1,250 1,395 1,412 1,526 1,613 1,725 1,776 1,856 2,069 91.21,709 1,779 1,943 2,076 1,843 2,042 2,126 2,601 2,715 2,961 73.3
3,652 3,604 3,796 4,012 4,204 4,420 4,684 4,876 5,020 5,236 43.41,480 1,840 1,987 2,119 2,321 2,421 2,579 2,772 3,460 3,813 157.62,133 2,265 2,418 2,577 2,696 2,806 2,889 3,085 3,397 3,792 77.81,803 2,239 2,490 2,433 2,537 2,570 2,684 2,805 2,928 3,057 69.62,575 2,513 2,668 2,822 3,032 3,194 3,374 3,402 3,590 3,690 43.31,593 1,633 1,698 1,786 1,829 1,927 2,009 2,119 2,148 2,289 43.6
Utah
South CarolinaSouth DakotaTennesseeTexas
Average in-district tuition and required fees (in current dollars) and percentage change for full-time undergraduate students at Title IV public 2-year institutions, by state or jurisdiction and year: United States, academic years 2002-03 to 2011-12—Continued
State or jurisdiction
AveragePercentage
change 2002-03 to 2011-12
Wyoming† Not applicable.NOTE: Title IV institutions are those with a written agreement with the Secretary of Education that allows the institution to participate in any of the Title IV federal student financial assistance programs. Tuition and required fees are average institutional charges for all full-time students at the institution as reported by the institution, not average amounts paid by students (i.e., charges are not weighted by enrollment). Prior to 2010-11, only Title IV primarily postsecondary institutions were required to respond to the Integrated Postsecondary Education Data System (IPEDS) survey; however, beginning in 2010-11 both primarily postsecondary and not primarily postsecondary institutions were required to respond. For all years reported, not primarily postsecondary institutions are concentrated in the public, less-than-2-year sector. Data for the not primarily postsecondary institutions that responded voluntarily to any of the Institutional Characteristics components prior to fall 2010 are included in the figures displayed here. Data were not imputed for the not primarily postsecondary institutions that did not respond. Overall response rates for the cells in this table range from 99.6 percent to 100.0 percent. Institutions with academic calendars that differ by program or allow continuous enrollment are not included. U.S. service academies are not included. Definitions for terms used in this table may be found in the IPEDS online glossary located at http://nces.ed.gov/ipeds/glossary/. SOURCE: U.S. Department of Education, National Center for Education Statistics, IPEDS, Fall 2002 - Fall 2011, Institutional Characteristics component.
VermontVirginiaWashingtonWest VirginiaWisconsin

Table 2e.
2002-03 2003-04 2004-05 2005-06 2006-07 2007-08 2008-09 2009-10 2010-11 2011-12$2,108 $2,299 $2,406 $2,442 $2,471 $2,496 $2,490 $2,639 $2,807 $2,918 38.5
2,651 3,012 3,243 3,156 3,326 3,253 3,115 3,154 3,672 4,006 51.11,784 1,872 1,970 2,194 2,674 2,801 2,851 3,780 3,767 3,520 97.31,232 1,343 1,435 1,525 1,575 1,572 1,647 1,694 1,740 1,831 48.61,853 1,931 1,947 1,970 2,011 1,974 2,089 2,177 2,270 2,324 25.5
402 611 863 833 761 645 615 757 760 997 148.0
2,288 2,277 2,299 2,497 2,356 2,353 2,336 2,569 2,867 3,178 38.92,508 2,814 2,864 2,922 2,977 3,075 3,103 3,350 3,500 3,490 39.22,345 2,430 2,487 2,581 2,634 2,706 2,792 2,948 3,026 3,086 31.6
† † † † † † † † † † †2,058 2,158 2,136 2,202 2,235 2,099 2,238 2,533 2,651 2,720 32.2
1,831 1,914 1,858 2,022 2,067 2,231 2,203 2,770 2,875 3,000 63.81,329 1,362 1,401 1,414 1,557 1,704 1,833 2,049 2,235 2,390 79.71,891 1,963 2,181 2,156 2,284 2,327 2,192 2,371 2,474 2,519 33.22,020 2,125 2,294 2,371 2,435 2,518 2,537 2,718 2,987 3,035 50.22,804 2,829 2,917 2,892 2,941 2,991 2,985 3,160 3,298 3,298 17.6
3,293 3,397 3,546 3,631 3,637 3,686 3,700 3,872 4,017 4,137 25.62,089 2,218 2,249 2,269 2,261 2,308 2,304 2,506 2,818 2,869 37.32,312 2,769 3,097 2,737 2,932 3,011 3,038 3,155 3,232 3,262 41.1
742 993 1,150 1,191 1,199 1,225 1,279 1,378 2,029 2,272 206.13,383 3,316 3,351 3,561 3,427 3,549 3,396 3,430 3,406 3,381 -0.1
2,846 2,995 3,703 3,095 3,140 3,102 3,046 3,099 3,173 3,170 11.42,958 3,337 3,420 3,424 3,372 3,406 3,461 3,736 3,912 4,069 37.62,303 2,396 2,496 2,561 2,551 2,614 2,580 2,654 3,136 2,730 18.63,790 4,208 4,622 4,713 4,810 4,933 4,812 5,000 5,080 5,170 36.41,845 1,718 1,828 1,943 1,922 1,888 1,839 1,929 2,193 2,196 19.1
2,548 2,941 2,971 3,004 2,835 2,905 2,871 2,883 2,872 2,755 8.12,917 3,067 3,070 3,109 3,082 3,092 3,028 3,009 2,988 2,885 -1.12,314 2,491 2,562 2,520 2,528 2,578 2,575 2,683 2,948 2,922 26.31,731 1,750 1,705 1,878 1,889 1,916 1,997 2,104 2,307 2,513 45.25,531 5,821 6,293 6,556 6,169 6,414 6,193 6,557 6,845 7,176 29.7
2,929 2,998 3,071 3,160 3,303 3,383 3,378 3,666 3,674 3,707 26.51,063 1,119 1,160 1,264 1,295 1,304 1,287 1,340 1,426 1,482 39.43,433 3,647 3,688 3,719 3,727 3,764 3,727 3,948 4,004 4,143 20.71,427 1,468 1,521 1,535 1,493 1,530 1,501 1,755 1,917 2,167 51.92,829 3,063 3,370 3,463 3,616 3,707 3,720 3,769 3,788 3,723 31.6
3,825 4,074 4,401 4,578 4,482 4,329 4,212 3,653 3,811 3,835 0.31,666 2,075 2,096 2,326 2,382 2,435 2,673 2,638 2,723 2,840 70.42,485 2,934 3,002 3,057 3,184 3,161 3,045 3,396 3,454 3,725 49.93,375 3,521 3,649 3,760 3,790 3,820 3,839 4,183 4,160 4,365 29.32,515 2,587 2,752 2,846 2,993 3,093 3,215 3,535 3,756 3,676 46.2
See notes at end of table.
National Center for Education Statistics
California
Average in-district tuition and required fees (in constant 2011-12 dollars) and percentage change for full-time undergraduate students at Title IV public 2-year institutions, by state or jurisdiction and year: United States, academic years 2002-03 to 2011-12
State or jurisdiction
AveragePercentage
change 2002-03 to 2011-12
United States
Alabama AlaskaArizonaArkansas
Indiana
Colorado Connecticut DelawareDistrict of Columbia Florida
GeorgiaHawaiiIdahoIllinois
Mississippi
IowaKansas KentuckyLouisianaMaine
Maryland MassachusettsMichiganMinnesota
North Dakota
MissouriMontanaNebraskaNevadaNew Hampshire
New JerseyNew MexicoNew York North Carolina
OhioOklahomaOregonPennsylvaniaRhode Island

Table 2e.
2002-03 2003-04 2004-05 2005-06 2006-07 2007-08 2008-09 2009-10 2010-11 2011-122,921 3,454 3,547 3,572 3,652 3,705 3,733 3,913 4,038 4,032 38.03,944 3,683 3,654 3,860 4,171 4,220 4,311 4,713 4,672 4,857 23.22,184 2,531 2,627 2,758 2,752 2,856 2,887 3,076 3,212 3,377 54.61,351 1,526 1,662 1,627 1,700 1,753 1,795 1,860 1,908 2,069 53.12,134 2,170 2,315 2,392 2,054 2,219 2,212 2,723 2,792 2,961 38.8
4,560 4,397 4,522 4,623 4,684 4,803 4,873 5,105 5,163 5,236 14.81,848 2,245 2,367 2,442 2,586 2,631 2,684 2,902 3,558 3,813 106.32,663 2,763 2,881 2,970 3,004 3,049 3,006 3,230 3,494 3,792 42.42,251 2,732 2,966 2,803 2,826 2,793 2,792 2,937 3,012 3,057 35.83,216 3,067 3,178 3,251 3,378 3,471 3,511 3,562 3,692 3,690 14.71,990 1,992 2,023 2,058 2,038 2,094 2,091 2,218 2,209 2,289 15.0
Utah
South CarolinaSouth DakotaTennesseeTexas
Average in-district tuition and required fees (in constant 2011-12 dollars) and percentage change for full-time undergraduate students at Title IV public 2-year institutions, by state or jurisdiction and year: United States, academic years 2002-03 to 2011-12—Continued
State or jurisdiction
AveragePercentage
change 2002-03 to 2011-12
Wyoming† Not applicable.NOTE: Title IV institutions are those with a written agreement with the Secretary of Education that allows the institution to participate in any of the Title IV federal student financial assistance programs. Tuition and required fees are average institutional charges for all full-time students at the institution as reported by the institution, not average amounts paid by students (i.e., charges are not weighted by enrollment). Prior to 2010-11, only Title IV primarily postsecondary institutions were required to respond to the Integrated Postsecondary Education Data System (IPEDS) survey; however, beginning in 2010-11 both primarily postsecondary and not primarily postsecondary institutions were required to respond. For all years reported, not primarily postsecondary institutions are concentrated in the public, less-than-2-year sector.Data for the not primarily postsecondary institutions that responded voluntarily to any of the Institutional Characteristics components prior to fall 2010 are included in the figures displayed here. Data were not imputed for the not primarily postsecondary institutions that did not respond. Overall response rates for the cells in this table range from 99.6 percent to 100.0 percent. All amounts from prior years were converted to 2011-12 dollars using the average Consumer Price Index (CPI) values for the 12-month period ending in October of the academic year the data represent (e.g., October 2002) and the average CPI values for the 12-month period ending in October 2011. Institutions with academic calendars that differ by program or allow continuous enrollment are not included. U.S. service academies are not included. Definitions for terms used in this table may be found in the IPEDS online glossary located at http://nces.ed.gov/ipeds/glossary/. SOURCE: U.S. Department of Education, National Center for Education Statistics, IPEDS, Fall 2002 - Fall 2011, Institutional Characteristics component.
VermontVirginiaWashingtonWest VirginiaWisconsin

Table 2f.
2002-03 2003-04 2004-05 2005-06 2006-07 2007-08 2008-09 2009-10 2010-11 2011-121,106 1,106 1,087 1,074 1,063 1,050 1,038 1,006 985 973
29 29 26 25 25 25 25 25 25 252 2 2 2 2 2 2 2 2 2
20 20 20 20 21 21 21 20 20 2022 22 22 22 22 22 22 22 22 22
109 106 110 110 111 111 111 111 112 114
15 15 15 16 15 15 15 16 15 1412 12 12 12 12 12 12 12 12 123 3 3 3 3 3 3 3 3 30 0 0 0 0 0 0 0 0 0
48 43 38 38 32 31 29 22 17 17
53 53 54 54 53 51 49 43 41 407 7 7 6 6 6 6 6 6 63 3 3 3 3 3 3 3 3 3
48 48 49 48 48 48 48 48 48 4816 16 16 15 15 15 15 15 15 15
16 16 16 16 16 16 16 16 16 1623 23 22 21 21 21 21 22 24 2426 26 23 23 16 16 16 16 16 1648 48 48 45 44 40 39 35 22 187 7 7 7 7 7 7 7 7 7
16 16 17 16 16 16 16 16 16 1616 16 16 16 16 16 16 16 16 1629 30 31 31 31 31 31 31 31 3141 40 30 30 31 31 31 31 31 3016 17 16 17 17 17 15 15 15 15
20 22 21 21 21 22 22 22 22 1812 12 12 12 12 12 12 12 12 117 8 8 8 8 8 8 8 8 83 3 2 2 2 1 1 1 1 14 4 4 4 7 7 7 7 7 7
20 20 20 20 20 20 20 20 19 1920 20 20 20 20 20 20 20 20 1935 35 35 35 35 35 35 35 35 3559 59 59 59 59 59 59 59 59 598 8 7 7 7 7 6 6 6 5
35 37 36 34 33 33 32 24 24 2416 16 15 15 15 14 12 12 12 1217 17 17 17 17 17 17 17 17 1722 22 22 22 21 21 21 17 17 171 1 1 1 1 1 1 1 1 1
See notes at end of table.
United States
National Center for Education StatisticsNumber of Title IV public 2-year institutions reporting in-district tuition and required fees for full-time undergraduate students, by state or jurisdiction and year: United States, academic years 2002-03 to 2011-12
State or jurisdiction
Number
Florida
Alabama AlaskaArizonaArkansasCalifornia
Colorado Connecticut DelawareDistrict of Columbia
Maine
GeorgiaHawaiiIdahoIllinoisIndiana
IowaKansas KentuckyLouisiana
New Hampshire
Maryland MassachusettsMichiganMinnesotaMississippi
MissouriMontanaNebraskaNevada
Rhode Island
New JerseyNew MexicoNew York North CarolinaNorth Dakota
OhioOklahomaOregonPennsylvania

Table 2f.
2002-03 2003-04 2004-05 2005-06 2006-07 2007-08 2008-09 2009-10 2010-11 2011-1221 21 20 20 20 20 20 20 20 205 5 5 5 5 5 5 5 5 5
13 13 13 13 13 13 13 13 13 1367 69 68 64 64 64 64 64 63 634 4 3 3 4 4 4 3 3 3
1 1 1 1 1 1 1 1 1 126 24 24 24 24 24 24 24 24 2433 33 35 35 34 30 30 27 27 277 9 11 11 12 12 11 11 10 10
18 18 18 18 18 17 17 17 17 177 7 7 7 7 7 7 7 7 7
Virginia
Number of Title IV public 2-year institutions reporting in-district tuition and required fees for full-time undergraduate students, by state or jurisdiction and year: United States, academic years 2002-03 to 2011-12—Continued
State or jurisdiction
Number
South CarolinaSouth DakotaTennesseeTexasUtah
Vermont
WashingtonWest VirginiaWisconsinWyomingNOTE: Title IV institutions are those with a written agreement with the Secretary of Education that allows the institution to participate in any of the Title IV federal student financial assistance programs. Prior to 2010-11, only Title IV primarily postsecondary institutions were required to respond to the Integrated Postsecondary Education Data System (IPEDS) survey; however, beginning in 2010-11 both primarily postsecondary and not primarily postsecondary institutions were required to respond. For all years reported, not primarily postsecondary institutions are concentrated in the public, less-than-2-year sector. Not primarily postsecondary institutions that responded voluntarily to any of the Institutional Characteristics components prior to fall 2010 are included in the figures displayed here. Institutions with academic calendars that differ by program or allow continuous enrollment are not included. U.S. service academies are not included. Definitions for terms used in this table may be found in the IPEDS online glossary located at http://nces.ed.gov/ipeds/glossary/. SOURCE: U.S. Department of Education, National Center for Education Statistics, IPEDS, Fall 2002 - Fall 2011, Institutional Characteristics component.

Table 3a.
4-year 2-yearLess-than-
2year 4-year 2-yearLess-than-
2year 4-year 2-yearLess-than-
2year
2006-07 $15,950 $10,216 $13,428 $29,200 $20,696 $21,765 $30,222 $25,367 $24,8982007-08 16,758 10,681 8,475 30,835 21,997 27,497 33,029 26,992 25,3172008-09 17,684 11,339 † 32,457 23,446 21,040 35,021 28,828 26,0322009-10 18,606 11,864 † 33,898 23,834 20,597 36,665 29,544 38,2502010-11 19,472 12,441 † 35,656 25,123 22,870 34,717 28,669 †
22.1 21.8 † 22.1 21.4 5.1 14.9 13.0 †
10.9 11.0 † 11.2 13.3 -3.3 15.9 13.6 4.610.1 9.7 † 9.9 7.2 8.7 -0.9 -0.5 †
5.1 4.5 -36.9 5.6 6.3 26.3 9.3 6.4 1.75.5 6.2 † 5.3 6.6 -23.5 6.0 6.8 2.85.2 4.6 † 4.4 1.7 -2.1 4.7 2.5 46.94.7 4.9 † 5.2 5.4 11.0 -5.3 -3.0 †
2006-07 $17,333 $12,816 $13,988 $27,541 $21,254 $21,431 $27,957 $23,449 $22,2542007-08 17,965 13,332 14,544 29,100 22,221 24,150 29,271 24,545 23,5062008-09 19,039 13,995 14,832 30,637 23,763 23,639 30,539 25,649 24,4182009-10 19,888 14,649 15,886 31,715 24,855 22,460 31,347 27,489 25,3092010-11 20,277 15,143 16,264 33,343 25,876 23,762 30,144 27,027 25,976
17.0 18.2 16.3 21.1 21.7 10.9 7.8 15.3 16.7
9.8 9.2 6.0 11.2 11.8 10.3 9.2 9.4 9.76.5 8.2 9.7 8.8 8.9 0.5 -1.3 5.4 6.4
3.6 4.0 4.0 5.7 4.5 12.7 4.7 4.7 5.66.0 5.0 2.0 5.3 6.9 -2.1 4.3 4.5 3.94.5 4.7 7.1 3.5 4.6 -5.0 2.6 7.2 3.62.0 3.4 2.4 5.1 4.1 5.8 -3.8 -1.7 2.6
2006-07 to 2007-08
National Center for Education StatisticsAverage cost of attendance (in current dollars) and percentage change for full-time, first-time undergraduate students at Title IV institutions, by control and level of institution, living arrangement, and year: United States, academic years 2006-07 to 2010-11
Private
Year
Public Nonprofit For-profit
On campus
Percentage change2006-07 to 2010-11
2006-07 to 2008-092008-09 to 2010-11
2009-10 to 2010-11
2007-08 to 2008-092008-09 to 2009-102009-10 to 2010-11
Off campus (not with family)
Percentage change2006-07 to 2010-11
2006-07 to 2008-092008-09 to 2010-11
2006-07 to 2007-082007-08 to 2008-092008-09 to 2009-10
See notes at end of table.

Table 3a.
4-year 2-yearLess-than-
2year 4-year 2-yearLess-than-
2year 4-year 2-yearLess-than-
2year
2006-07 $9,795 $6,531 $9,244 $20,601 $13,764 $15,440 $19,542 $16,625 $15,2852007-08 10,180 6,810 9,276 21,785 14,488 17,284 21,283 17,300 16,4282008-09 10,783 7,174 8,870 22,866 15,520 17,224 22,342 18,219 16,9532009-10 11,343 7,455 9,450 23,643 16,332 15,168 22,769 19,798 17,1102010-11 11,757 7,803 10,721 25,026 16,976 15,362 21,735 19,116 17,545
20.0 19.5 16.0 21.5 23.3 -0.5 11.2 15.0 14.8
10.1 9.8 -4.0 11.0 12.8 11.6 14.3 9.6 10.99.0 8.8 20.9 9.4 9.4 -10.8 -2.7 4.9 3.5
3.9 4.3 0.3 5.7 5.3 11.9 8.9 4.1 7.55.9 5.3 -4.4 5.0 7.1 -0.3 5.0 5.3 3.25.2 3.9 6.5 3.4 5.2 -11.9 1.9 8.7 0.93.7 4.7 13.5 5.8 3.9 1.3 -4.5 -3.4 2.5
Average cost of attendance (in current dollars) and percentage change for full-time, first-time undergraduate students at Title IV institutions, by control and level of institution, living arrangement, and year: United States, academic years 2006-07 to 2010-11—Continued
Private
Year
Public Nonprofit For-profit
2007-08 to 2008-092008-09 to 2009-102009-10 to 2010-11† Not applicable.NOTE: Title IV institutions are those with a written agreement with the Secretary of Education that allows the institution to participate in any of the Title IV federal student financial assistance programs. Tuition and required fees for public institutions are for in-district residency. Tuition and required fees for private institutions are for out-of-state residency. Tuition and required fees are average institutional charges for all full-time students at the institution as reported by the institution, not average amounts paid by students (i.e., charges are not weighted by enrollment). Prior to 2010-11, only Title IV primarily postsecondary institutions were required to respond to the Integrated Postsecondary Education Data System (IPEDS) survey; however, beginning in 2010-11 both primarily postsecondary and not primarily postsecondary institutions were required to respond. Data for the not primarily postsecondary institutions that responded voluntarily to any of the Institutional Characteristics components prior to fall 2010 are included in the figures displayed here. For all years reported, not primarily postsecondary institutions are concentrated in the public, less-than-2-year sector. Data were not imputed for the not primarily postsecondary institutions that did not respond. Response rates for the cells in this table range from 99.1 percent to 100.0 percent. Institutions with academic calendars that differ by program or allow continuous enrollment are not included. U.S. service academies are not included. Definitions for terms used in this table may be found in the IPEDS online glossary located at http://nces.ed.gov/ipeds/glossary/. SOURCE: U.S. Department of Education, National Center for Education Statistics, IPEDS, Fall 2006 - Fall 2010, Institutional Characteristics component.
Off campus (with family)
Percentage change2006-07 to 2010-11
2006-07 to 2008-092008-09 to 2010-11
2006-07 to 2007-08

Table 3b.
4-year 2-yearLess-than-
2year 4-year 2-yearLess-than-
2year 4-year 2-yearLess-than-
2year
2006-07 $17,771 $11,383 $14,961 $32,533 $23,059 $24,250 $33,672 $28,263 $27,7402007-08 18,210 11,606 9,209 33,507 23,904 29,880 35,891 29,331 27,5112008-09 18,397 11,797 † 33,767 24,392 21,889 36,434 29,991 27,0822009-10 19,480 12,422 † 35,491 24,954 21,565 38,388 30,933 40,0482010-11 20,027 12,796 † 36,672 25,839 23,522 35,706 29,486 †
12.7 12.4 † 12.7 12.1 -3.0 6.0 4.3 †
3.5 3.6 † 3.8 5.8 -9.7 8.2 6.1 -2.48.9 8.5 † 8.6 5.9 7.5 -2.0 -1.7 †
2.5 2.0 -38.4 3.0 3.7 23.2 6.6 3.8 -0.81.0 1.6 † 0.8 2.0 -26.7 1.5 2.2 -1.65.9 5.3 † 5.1 2.3 -1.5 5.4 3.1 47.92.8 3.0 † 3.3 3.5 9.1 -7.0 -4.7 †
2006-07 $19,312 $14,280 $15,585 $30,685 $23,680 $23,877 $31,149 $26,125 $24,7942007-08 19,522 14,488 15,805 31,622 24,147 26,243 31,807 26,672 25,5432008-09 19,807 14,560 15,430 31,873 24,721 24,592 31,771 26,685 25,4042009-10 20,823 15,338 16,632 33,205 26,024 23,515 32,820 28,780 26,4982010-11 20,855 15,574 16,727 34,293 26,613 24,439 31,002 27,797 26,716
8.0 9.1 7.3 11.8 12.4 2.4 -0.5 6.4 7.7
2.6 2.0 -1.0 3.9 4.4 3.0 2.0 2.1 2.55.3 7.0 8.4 7.6 7.7 -0.6 -2.4 4.2 5.2
1.1 1.5 1.4 3.1 2.0 9.9 2.1 2.1 3.01.5 0.5 -2.4 0.8 2.4 -6.3 -0.1 # -0.55.1 5.3 7.8 4.2 5.3 -4.4 3.3 7.9 4.30.2 1.5 0.6 3.3 2.3 3.9 -5.5 -3.4 0.8
2006-07 to 2007-08
National Center for Education StatisticsAverage cost of attendance (in constant 2011-12 dollars) and percentage change for full-time, first-time undergraduate students at Title IV institutions, by control and level of institution, living arrangement, and year: United States, academic years 2006-07 to 2010-11
Private
Year
Public Nonprofit For-profit
On campus
Percentage change2006-07 to 2010-11
2006-07 to 2008-092008-09 to 2010-11
2009-10 to 2010-11
2007-08 to 2008-092008-09 to 2009-102009-10 to 2010-11
Off campus (not with family)
Percentage change2006-07 to 2010-11
2006-07 to 2008-092008-09 to 2010-11
2006-07 to 2007-082007-08 to 2008-092008-09 to 2009-10
See notes at end of table.

Table 3b.
4-year 2-yearLess-than-
2year 4-year 2-yearLess-than-
2year 4-year 2-yearLess-than-
2year
2006-07 $10,913 $7,277 $10,300 $22,953 $15,336 $17,202 $21,773 $18,523 $17,0302007-08 11,063 7,401 10,080 23,673 15,744 18,782 23,128 18,799 17,8522008-09 11,218 7,464 9,228 23,789 16,146 17,919 23,243 18,954 17,6372009-10 11,876 7,806 9,894 24,755 17,100 15,881 23,839 20,729 17,9142010-11 12,092 8,025 11,027 25,739 17,459 15,800 22,354 19,661 18,045
10.8 10.3 7.1 12.1 13.8 -8.2 2.7 6.1 6.0
2.8 2.6 -10.4 3.6 5.3 4.2 6.8 2.3 3.67.8 7.5 19.5 8.2 8.1 -11.8 -3.8 3.7 2.3
1.4 1.7 -2.1 3.1 2.7 9.2 6.2 1.5 4.81.4 0.9 -8.5 0.5 2.6 -4.6 0.5 0.8 -1.25.9 4.6 7.2 4.1 5.9 -11.4 2.6 9.4 1.61.8 2.8 11.4 4.0 2.1 -0.5 -6.2 -5.2 0.7
Average cost of attendance (in constant 2011-12 dollars) and percentage change for full-time, first-time undergraduate students at Title IV institutions, by control and level of institution, living arrangement, and year: United States, academic years 2006-07 to 2010-11—Continued
Private
Year
Public Nonprofit For-profit
2007-08 to 2008-092008-09 to 2009-102009-10 to 2010-11† Not applicable.# Rounds to zero.NOTE: Title IV institutions are those with a written agreement with the Secretary of Education that allows the institution to participate in any of the Title IV federal student financial assistance programs. Tuition and required fees for public institutions are for in-district residency. Tuition and required fees for private institutions are for out-of-state residency. Tuition and required fees are average institutional charges for all full-time students at the institution as reported by the institution, not average amounts paid by students (i.e., charges are not weighted by enrollment). Prior to 2010-11, only Title IV primarily postsecondary institutions were required to respond to the Integrated Postsecondary Education Data System (IPEDS) survey; however, beginning in 2010-11 both primarily postsecondary and not primarily postsecondary institutions were required to respond. For all years reported, not primarily postsecondary institutions are concentrated in the public, less-than-2-year sector. Data for the not primarily postsecondary institutions that responded voluntarily to any of the Institutional Characteristics components prior to fall 2010 are included in the figures displayed here. Data were not imputed for the not primarily postsecondary institutions that did not respond. Response rates for the cells in this table range from 99.1 percent to 100.0 percent. All amounts from prior years were converted to 2011-12 dollars using the average Consumer Price Index (CPI) values for the 12-month period ending in October of the academic year the data represent (e.g., October 2002) and the average CPI values for the 12-month period ending in October 2011. Institutions with academic calendars that differ by program or allow continuous enrollment are not included. U.S. service academies are not included. Definitions for terms used in this table may be found in the IPEDS online glossary located at http://nces.ed.gov/ipeds/glossary/. SOURCE: U.S. Department of Education, National Center for Education Statistics, IPEDS, Fall 2006 - Fall 2010, Institutional Characteristics component.
Off campus (with family)
Percentage change2006-07 to 2010-11
2006-07 to 2008-092008-09 to 2010-11
2006-07 to 2007-08

Table 3c.
4-year 2-yearLess-than-
2year 4-year 2-yearLess-than-
2year 4-year 2-yearLess-than-
2year
2006-07 508 230 1 1,103 48 2 51 27 32007-08 512 228 1 1,110 42 4 50 25 22008-09 516 223 0 1,112 40 1 58 22 22009-10 524 227 0 1,113 36 2 61 21 12010-11 527 226 0 1,107 35 1 70 21 0
2006-07 426 1,044 53 802 162 9 396 379 862007-08 421 1,029 52 779 134 14 435 381 792008-09 415 1,017 48 772 125 10 474 386 772009-10 440 988 44 772 107 12 500 421 682010-11 479 968 22 802 107 8 582 430 47
2006-07 426 1,044 53 803 162 9 396 379 862007-08 421 1,029 52 779 134 14 435 381 792008-09 415 1,017 48 772 125 10 474 386 772009-10 440 988 44 772 107 12 500 421 682010-11 479 968 22 802 107 8 582 430 47NOTE: Title IV institutions are those with a written agreement with the Secretary of Education that allows the institution to participate in any of the Title IV federal student financial assistance programs. Prior to 2010-11, only Title IV primarily postsecondary institutions were required to respond to the Integrated Postsecondary Education Data System (IPEDS) survey; however, beginning in 2010-11 both primarily postsecondary and not primarily postsecondary institutions were required to respond. For all years reported, not primarily postsecondary institutions are concentrated in the public, less-than-2-year sector. Not primarily postsecondary institutions that responded voluntarily to any of the Institutional Characteristics components prior to fall 2010 are included in the figures displayed here. Institutions with academic calendars that differ by program or allow continuous enrollment are not included. U.S. service academies are not included. Definitions for terms used in this table may be found in the IPEDS online glossary located at http://nces.ed.gov/ipeds/glossary/. SOURCE: U.S. Department of Education, National Center for Education Statistics, IPEDS, Fall 2006 - Fall 2010, Institutional Characteristics component.
Off campus (with family)
Off campus (not with family)
On campus
National Center for Education StatisticsNumber of institutions reporting average cost of attendance for full-time, first-time undergraduate students at Title IV institutions, by control and level of institution, living arrangement, and year: United States, academic years 2006-07 to 2010-11
Private
Year
Public Nonprofit For-profit

Table 4a.
4-year 2-yearLess than
2-year 4-year 2-yearLess than
2-year 4-year 2-yearLess than
2-year
2006-07 $9,948 $6,413 $8,981 $17,578 $14,004 $15,008 $21,947 $17,500 $16,9022007-08 10,324 6,655 9,337 18,495 14,648 14,805 22,941 18,299 17,3912008-09 10,843 6,793 9,565 19,035 15,382 15,958 23,282 19,604 18,1142009-10 10,643 6,538 7,886 19,152 16,198 17,363 22,322 18,648 18,0422010-11 11,020 6,772 7,590 19,807 16,566 15,471 22,620 19,352 19,011
10.8 5.6 -15.5 12.7 18.3 3.1 3.1 10.6 12.5
9.0 5.9 6.5 8.3 9.8 6.3 6.1 12.0 7.21.6 -0.3 -20.7 4.1 7.7 -3.1 -2.8 -1.3 5.0
3.8 3.8 4.0 5.2 4.6 -1.4 4.5 4.6 2.95.0 2.1 2.4 2.9 5.0 7.8 1.5 7.1 4.2
-1.8 -3.8 -17.6 0.6 5.3 8.8 -4.1 -4.9 -0.43.5 3.6 -3.8 3.4 2.3 -10.9 1.3 3.8 5.4
2007-08 to 2008-092008-09 to 2009-102009-10 to 2010-11
National Center for Education Statistics
NOTE: Title IV institutions are those with a written agreement with the Secretary of Education that allows the institution to participate in any of the Title IV federal student financial assistance programs. The net price of attendance is the price actually charged to full-time, first-time undergraduate students receiving financial aid at an institution after deducting federal, state/local government, and institutional grant and scholarship aid. Average price before aid is calculated using the tuition and required fees, books and supplies, room and board, and other expenses data from the Institutional Characteristics component. A weighted average of on-campus; off-campus, not with family; and off-campus, with family room and board and other expenses values was used to calculate a single average price before aid instead of individual prices by living arrangement. The factors used to generate this weighted average were reported in the Student Financial Aid component separately for the group of students receiving any grant aid and the group of students receiving Title IV aid. Hence, the resulting average price before aid values may differ between the groups. Prior to 2010-11, only Title IV primarily postsecondary institutions were required to respond to the Integrated Postsecondary Education Data System (IPEDS) survey; however, beginning in 2010-11 both primarily postsecondary and not primarily postsecondary institutions were required to respond. For all years reported, not primarily postsecondary institutions are concentrated in the public, less-than-2-year sector. Data for the not primarily postsecondary institutions that responded voluntarily to both the Institutional Characteristics and Student Financial Aid components in any year prior to fall 2010 are included in the figures displayed here. Data were not imputed for the not primarily postsecondary institutions that did not respond. Response rates for the cells in this table range from 83.2 percent to 100.0 percent. Institutions with academic calendars that differ by program or allow continuous enrollment are not included. U.S. service academies are not included. Definitions for terms used in this table may be found in the IPEDS online glossary located at http://nces.ed.gov/ipeds/glossary/. SOURCE: U.S. Department of Education, National Center for Education Statistics, IPEDS, Fall 2009-Fall 2011, Institutional Characteristics components and Spring 2010, Spring 2011, and Winter 2011-12, Student Financial Aid components.
Average net price of attendance (in current dollars) and percentage change for full-time, first-time undergraduate students receiving any grant or scholarship aid at Title IV institutions, by control and level of institution, and year: United States, academic years 2006-07 to 2010-11
Year
PrivatePublic Nonprofit For-profit
Average net price of attendance
Percentage change2006-07 to 2010-11
2006-07 to 2008-092008-09 to 2010-11
2006-07 to 2007-08

Table 4b.
4-year 2-yearLess than
2-year 4-year 2-yearLess than
2-year 4-year 2-yearLess than
2-year
2006-07 $11,083 $7,145 $10,007 $19,585 $15,603 $16,722 $24,453 $19,498 $18,8312007-08 11,219 7,232 10,146 20,098 15,918 16,088 24,929 19,885 18,8982008-09 11,281 7,068 9,951 19,803 16,003 16,602 24,221 20,395 18,8452009-10 11,143 6,845 8,256 20,052 16,959 18,179 23,371 19,524 18,8902010-11 11,334 6,965 7,806 20,371 17,038 15,912 23,265 19,903 19,553
2.3 -2.5 -22.0 4.0 9.2 -4.8 -4.9 2.1 3.8
1.8 -1.1 -0.6 1.1 2.6 -0.7 -0.9 4.6 0.10.5 -1.5 -21.6 2.9 6.5 -4.2 -3.9 -2.4 3.8
1.2 1.2 1.4 2.6 2.0 -3.8 1.9 2.0 0.40.6 -2.3 -1.9 -1.5 0.5 3.2 -2.8 2.6 -0.3
-1.2 -3.1 -17.0 1.3 6.0 9.5 -3.5 -4.3 0.21.7 1.7 -5.5 1.6 0.5 -12.5 -0.5 1.9 3.52009-10 to 2010-11
National Center for Education Statistics
NOTE: Title IV institutions are those with a written agreement with the Secretary of Education that allows the institution to participate in any of the Title IV federal student financial assistance programs. The net price of attendance is the price actually charged to full-time, first-time undergraduate students receiving financial aid at an institution after deducting federal, state/local government, and institutional grant and scholarship aid. Average price before aid is calculated using the tuition and required fees, books and supplies, room and board, and other expenses data from the Institutional Characteristics component. A weighted average of on-campus; off-campus, not with family; and off-campus, with family room and board and other expenses values was used to calculate a single average price before aid instead of individual prices by living arrangement. The factors used to generate this weighted average were reported in the Student Financial Aid component separately for the group of students receiving any grant aid and the group of students receiving Title IV aid. Hence, the resulting average price before aid values may differ between the groups. Prior to 2010-11, only Title IV primarily postsecondary institutions were required to respond to the Integrated Postsecondary Education Data System (IPEDS) survey; however, beginning in 2010-11 both primarily postsecondary and not primarily postsecondary institutions were required to respond. For all years reported, not primarily postsecondary institutions are concentrated in the public, less-than-2-year sector. Data for the not primarily postsecondary institutions that responded voluntarily to both the Institutional Characteristics and Student Financial Aid components in any year prior to fall 2010 are included in the figures displayed here. Data were not imputed for the not primarily postsecondary institutions that did not respond. Response rates for the cells in this table range from 83.2 percent to 100.0 percent. All amounts from prior years were converted to 2011-12 dollars using the average Consumer Price Index (CPI) values for the 12-month period ending in October of the academic year the data represent (e.g., October 2002) and the average CPI values for the 12-month period ending in October 2011. Institutions with academic calendars that differ by program or allow continuous enrollment are not included. U.S. service academies are not included. Definitions for terms used in this table may be found in the IPEDS online glossary located at http://nces.ed.gov/ipeds/glossary/. SOURCE: U.S. Department of Education, National Center for Education Statistics, IPEDS, Fall 2009-Fall 2011, Institutional Characteristics components and Spring 2010, Spring 2011, and Winter 2011-12, Student Financial Aid components.
Average net price of attendance (in constant 2011-12 dollars) and percentage change for full-time, first-time undergraduate students receiving any grant or scholarship aid at Title IV institutions, by control and level of institution, and year: United States, academic years 2006-07 to 2010-11
Year
PrivatePublic Nonprofit For-profit
Average net price of attendance
Percentage change2006-07 to 2010-11
2006-07 to 2008-092008-09 to 2010-11
2006-07 to 2007-082007-08 to 2008-092008-09 to 2009-10

Table 4c.
4-year 2-yearLess than
2-year 4-year 2-yearLess than
2-year 4-year 2-yearLess than
2-year584 1,019 32 1,184 114 10 350 350 48 597 1,008 36 1,188 101 12 381 362 55 602 1,014 39 1,208 108 11 436 386 62 620 977 20 1,214 102 9 491 421 41 627 966 20 1,208 100 9 587 437 41
NOTE: Title IV institutions are those with a written agreement with the Secretary of Education that allows the institution to participate in any of the Title IV federal student financial assistance programs. Prior to 2010-11, only Title IV primarily postsecondary institutions were required to respond to the Integrated Postsecondary Education Data System (IPEDS) survey; however, beginning in 2010-11 both primarily postsecondary and not primarily postsecondary institutions were required to respond. For all years reported, not primarily postsecondary institutions are concentrated in the public, less-than-2-year sector. Not primarily postsecondary institutions that responded voluntarily to both the Institutional Characteristics and Student Financial Aid components in any year prior to fall 2010 are included in the figures displayed here. Institutions with academic calendars that differ by program or allow continuous enrollment are not included. U.S. service academies are not included. Definitions for terms used in this table may be found in the IPEDS online glossary located at http://nces.ed.gov/ipeds/glossary/. SOURCE: U.S. Department of Education, National Center for Education Statistics, IPEDS, Fall 2009-Fall 2011, Institutional Characteristics components and Spring 2010, Spring 2011, and Winter 2011-12, Student Financial Aid components.
National Center for Education StatisticsNumber of Title IV institutions reporting net price of attendance for full-time, first-time undergraduate students receiving any grant or scholarship aid, by control and level of institution, and year: United States, academic years 2006-07 to 2010-11
Year
PrivateNonprofit For-profitPublic
2006-072007-082008-092009-102010-11

LABEL VARIABLE NAME
GLOSSARY G1
Glossary All of the variables used in these tables are described in this glossary. The variables were taken directly from IPEDS data col-lected during the 2002-03 through 2011-12 data collections. These data are availa-ble for download via the IPEDS Data Cen-ter (http://nces.ed.gov/IPEDS/DataCenter). Items are listed here in alphabetical order by the variable label. The name of each variable appears to the right of the variable label.
Control of institution CONTROL This categorical variable on the IC Header component of IPEDS is a classification of whether an institution is operated by publicly elected or appointed officials (public control) or by privately elected or appointed officials and derives its major source of funds from private sources (private control).
1 Public 2 Private nonprofit 3 Private for-profit
In-district cost of attendance CINDON (on-campus) CINDOFF (off-campus) CINDFAM (with family)
The sum of published in-district tuition and required fees, books and supplies, and room and board and other expenses. The data included in this sum are collected on the Institutional Characteristics component of IPEDS.
In-district required fees for full-time undergraduates FEE1 The amount charged by the institution for items not covered by tuition to those students residing in the locality in which they attend school. This may be a lower rate than in-state fees if offered by the institution. This variable is collected on the Institutional Characteristics component of IPEDS.
In-district tuition for full-time undergraduates TUITION1 The amount charged for instructional services by the institution to those students residing in the locality in which they attend school. This may be a lower rate than in-state tuition if offered by the institution. This variable is collected on the Institu-tional Characteristics component of IPEDS.
In-district tuition and required fees for full-time, CHG1AY2 (2009-2011) first-time degree/certificate-seeking undergraduates CHG1AY1 (2008)
CHG1AY0 (2007) The tuition and required fees charged by the institution to full-time, first time de-gree/certificate-seeking undergraduate students residing in the locality in which they attend school. This may be a lower rate than in-state tuition and required fees if offered by the institution. This variable is collected on the Institutional Characteristics component of IPEDS
In-state required fees for full-time undergraduates FEE2 The amount charged by the institution for items not covered by tuition to those students who meet the institution’s or state’s residency requirements. This varia-ble is collected on the Institutional Characteristics component of IPEDS.
In-state tuition for full-time undergraduates TUITION2 The amount charged for instructional services by the institution to those students who meet the institution’s or state’s residency requirements. This variable is col-lected on the Institutional Characteristics component of IPEDS.
Institution enrolls full-time undergraduates FT_UG This indicator on the Institutional Characteristics component of IPEDS is a classifi-cation of whether an institution enrolls full-time undergraduate students. A full-time student is a student enrolled in 12 or more semester credits, or 12 or more

LABEL VARIABLE NAME
GLOSSARY G2
quarter credits, or 24 or more contact hours a week each term. An undergraduate is a student enrolled in a 4- or 5-year bachelor’s degree program, an associate’s degree program, or a vocational or technical program below the baccalaureate.
1 Yes 2 No
Institution enrolls full-time, first-time degree/certificate-seeking undergraduates FT_FTUG This indicator on the Institutional Characteristics component of IPEDS is a classifi-cation of whether an institution enrolls full-time, first-time degree-seeking under-graduate students. A first-time student is a student who has no prior post-secondary experience attending any institution for the first time at the under-graduate level. A degree-seeking student is a student enrolled in courses for cred-it who is recognized by the institution as seeking a degree or other formal award.
1 Yes 2 No
Level of institution ICLEVEL This categorical variable on the IC Header component of IPEDS is a classification of whether an institution’s programs are 4-year or higher (4 year), 2-but-less-than 4-year (2 year), or less than 2-year.
1 Four or more years 2 At least 2 but less than 4 years 3 Less than 2 years (below associate)
Net Price NPIST2, NPGRN2 (2009-2011) NPIST1, NPGRN1 (2008) NPIST0, NPGRN0 (2007) In IPEDS, average institutional net price is generated by subtracting the average amount of federal, state/local government, or institutional grant and scholarship aid from the total cost of attendance. Total cost of attendance is the sum of pub-lished tuition and required fees (lower of in-district or in-state for public institu-tions), books and supplies, and the weighted average for room and board and other expenses. Cost of attendance data are collected in the Institutional Charac-teristics component of IPEDS, and financial aid data are collected in the Student Financial Aid component of IPEDS.
Out-of-state cost of attendance COTSON (on-campus) COTSOFF (off-campus) COTSFAM (with family)
The sum of published out-of-state tuition and required fees, books and supplies, and room and board and other expenses. The data included in this sum are col-lected on the Institutional Characteristics component of IPEDS.
Out-of-state required fees for full-time undergraduates FEE3 The amount charged by the institution for items not covered by tuition to those students who do not meet the institution’s or state’s residency requirements. This variable is collected on the Institutional Characteristics component of IPEDS
Out-of-state tuition for full-time undergraduates TUITION3 The amount charged for instructional services by the institution to those students who do not meet the institution’s or state’s residency requirements. This variable is collected on the Institutional Characteristics component of IPEDS.

LABEL VARIABLE NAME
GLOSSARY G3
Out-of-state tuition and required fees for full-time, CHG3AY3 (2009-2011) first-time undergraduates CHG3AY2 (2008) CHG3AY1 (2007)
The tuition and required fees charged by the institution to full-time, first time un-dergraduate students who do not meet the institution’s or state’s residency re-quirements. This variable is collected on the Institutional Characteristics component of IPEDS.
Title IV postsecondary institution indicator PSET4FLG The purpose of this indicator is to make it easy to select institutions in the IPEDS universe. The categories relevant to these web tables are as follows:
1 Title IV primarily postsecondary institution 3 Title IV not primarily postsecondary institution

GLOSSARY G2
www.ed.gov ies.ed.gov