€¦ · web view9.1.3.6 where seed quantities within areas available for timber harvesting...
TRANSCRIPT
Biodiversity valuesBiodiversity is the name given to the variety of living things: the different flora, fauna and organisms; the genetic information they contain; and the ecosystems they form. Biodiversity values were fundamental in establishing a CAR reserve system under Victorian RFAs and were a focus of the related CRAs.The National Reserve System (NRS) is Australia’s network of public, Indigenous and private protected areas over land and inland freshwater. Its focus is to secure long-term protection for samples of Australia’s diverse ecosystems and the plants and animals they support. The NRS includes the protected areas and reserves established and effectively managed through the collective efforts of the Australian Government, states, territories, local government, Indigenous and private landholders, and non-government organisations.Indicators of biodiversity value can include the number and diversity of flora and fauna species, ecological communities and forest types. These indicators consider the range of flora and fauna species and communities, and the reserves established to protect biodiversity.
71

Indicator 1.1a: Area of forest by forest type and tenure
Forest type assessment in the Comprehensive Regional AssessmentForest type information provided in the CRA documents was described under the Forest Ecosystem Assessment sections of the respective reports and used the EVCs as the basic mapping units. However, no dedicated forest cover (by forest type) was presented. Comparisons of forest type information between the CRA process and the current data are therefore limited to changes in EVC area, and forest productive areas, as presented in Indicator 2.1a.Area of forest, by forest typeDifferences in mapping approachesThe information presented here is drawn from different processes that each contribute to inform the narrative around current forest extent by RFA region. However, the different processes present varying estimates of total forest cover in Victoria. This is important to note, as it explains the inherent uncertainty in landscape-scale landcover analysis. In Table 1, forest type statistics derived from the National Forest Inventory (NFI) are presented for the Victorian RFA regions. Table 2 presents time-series data produced by DELWP and disaggregated based on public and private tenure; however, it does not have forest type information. The total forest cover estimates differ between these processes. In the Victorian context, differences in mapping methodology are likely to be most pronounced in the Mallee, or in similarly naturally fragmented forest types. This is due to complexities in classifying remotely sensed imagery in non-uniform land covers. It is also important to note that the NFI dataset represents forest cover as at 2016, while the Victorian data represents forest cover as at 2013. Australia’s National Forest InventoryThe definition of forest’ used in this report is derived from Australia’s NFI. It can be summarised as an area of single-stemmed woody vegetation with a dominant vegetation with height of greater than 2 metres and canopy cover greater than 20 per cent. While Victoria calculates its own forest type and area estimates through the Victorian Forest Monitoring Program (VFMP), the aggregation of the plot network does not currently allow the data to be disaggregated by RFA region. In consequence, the forest type statistics presented here are derived from the NFI area values as outlined in the ASOFR.1
The ASOFR is a comprehensive synthesis report of national, state and territory data and information on the multiple environmental, economic and social values, benefits and services of Australia’s forests. The fifth report in the ASOFR series, Australia’s state of the forests report 2018, brings together and reports on data and information current to June 2016 (Montréal Process Implementation Group for Australia and NFI Steering Committee 2018).Assembled for ASOFR 2018, the Forests of Australia (2018)2 spatial dataset reports the extent and type of Australia’s forests. Forest extent is calculated using a multiple lines of evidence (MLE) approach3 that analyses multiple forest 1 See agriculture.gov.au/abares/forestsaustralia/sofr2 See agriculture.gov.au/abares/forestsaustralia/Pages/forest-cover.aspx3 See https://apo.org.au/sites/default/files/resource-files/2013/01/apo-nid155511-1212976.pdf
72

cover datasets from national and state sources to delineate forest extent with improved accuracy. This methodology was first used for calculating forest extent for ASOFR 2013 and was again used for ASOFR 2018. Forest typing was determined using a combination of national and state and territory vegetation information datasets. Further information on the data sources used for the MLE and forest typing can be found in Indicator 1.1a of ASOFR 2018 (Montréal Process Implementation Group for Australia and NFI Steering Committee 2018, pp. 45–74).Forests in the NFI and the Forests of Australia (2018) dataset are classed under three broad forest categories of Native forest, Commercial plantation and Other forest. Within the Native forest category there are eight forest types that describe the dominant genera and structure types. These include Acacia, Callitris, Casuarina, Eucalypt, Mangrove, Melaleuca and Rainforest. The eighth type – Other native forest – includes a range of less frequently occurring forest genera and native forests of unknown type. The Eucalypt forest type is further classified into 11 forest subtypes based on the form of dominant trees, mature tree height and crown cover. Further information on forest form, height and crown cover can be found in ASOFR 2018 Indicator 1.1a (ibid.).The Commercial plantation category includes three types: Softwood plantation (mostly pines), Hardwood plantation (mostly eucalypts), and mixed or unknown plantations. The Other forest category includes non-commercial plantations and planted forests.ASOFR 2018 reported 8.2 million hectares of forest occurs in Victoria, including 7.6 million hectares of Native forest, 0.41 million hectares of Commercial plantation, and 0.16 million hectares of Other forest. Of the total forest area in Victoria, 6.2 million hectares of forest occurs in the five Victoria RFA regions, with 5.6 million hectares of Native forest, 0.41 million hectares of Commercial plantation and 0.13 million hectares of Other forest. By RFA region, 1.6 million hectares of forest is in the Gippsland RFA region, 1.4 million hectares in each of the North East and West Victoria regions, 1.1 million hectares is in the East Gippsland region and 0.72 million hectares is in the Central Highlands region.The most common forest type in the Victorian RFA regions is the Eucalypt forest type with 5.4 million hectares, followed by 0.17 million hectares of the Other native forest type. By Eucalypt forest subtypes there are 2.8 million hectares of Eucalypt medium open forest and 1.3 million hectares of the Eucalypt tall open forest subtype (Table 1).
73

Table 1: NFI forest area in Victoria RFA regions, as at 2016Area ('000 ha)
NFI forest typeForest category
Forest, by RFA regiona Central
Highlands
East Gippslan
dGippslan
dNorth East
West Victoria
Total in RFA
regions
Total not in RFA regions
Total in Victoria
Native forestAcacia 0 8 24 2 2 36 1 37Callitris 0 0 0 0 23 23 0 23Casuarina 0 0 0 0 1 1 47 48Eucalypt 688 1,031 1,416 1,270 973 5,378 1,797 7,175
Eucalypt mallee open
0 0 0 0 0 0 11 11
Eucalypt mallee woodland
0 0 0 0 52 53 1,227 1,280
Eucalypt low closed
1 2 2 4 4 14 0 14
Eucalypt low open 4 7 11 30 14 66 3 69Eucalypt low woodland
1 4 3 3 6 16 4 20
Eucalypt medium closed
17 15 20 19 25 96 0 97
Eucalypt medium open
349 457 798 745 414 2,762 331 3,092
Eucalypt medium woodland
36 110 221 91 377 835 202 1,036
Eucalypt tall closed
31 18 26 28 13 116 0 117
Eucalypt tall open 239 398 317 335 58 1,348 19 1,367Eucalypt tall woodland
9 20 17 16 10 72 1 73
Mangrove 0 0 0 0 0 0 0 0Melaleuca 0 0 7 0 8 15 4 19Rainforest 5 10 3 0 2 20 0 20Other native forest 9 55 33 5 65 167 155 322Total native forest 703 1,104 1,483 1,277 1,073 5,640 2,004 7,644
Commercial plantationHardwood plantation 3 3 29 3 158 197 1 198Softwood plantation 9 2 59 53 92 215 1 215Unknown or mixed species
0 0 1 0 0 1 0 1
Total commercial plantation
12 6 89 56 250 412 2 414
Other forestTotal other forest 8 2 26 18 80 134 28 162Total all forest types
723 1,113 1,598 1,350 1,403 6,187 2,034 8,220
a RFA region boundary data supplied by Victoria DELWP.Notes: Totals may not tally due to rounding.
Area derived by ABARES from Forests of Australia (2018) dataset.
74

Forest cover changeForest cover change estimates were made as part of the VSOFR process over two time periods, 2009 and 2013. These figures were published in the 2013 and 2018 VSOFRs respectively. Positive gains were shown in all RFA regions except the North East. Gains in other areas were attributed to regrowth from successive mega-fires in the decade to 2010. It is important to note that these forest area change figures are not related to the forest area described above and in Table 1 and vary on account of the different processes and methodologies used to create the analysis. Area of forest, by tenureAccording to the Victorian forest cover assessment, forest on public land accounts for nearly 6.5 million hectares, with about 1.2 million hectares of forest on private land. Of public land forest, almost half (47 per cent per cent) is in State forests and almost half (47 per cent per cent) is in land tenures focused on conservation. Approximately 77 per cent of forests are located within the RFA regions. The proportion of land in each RFA region that is forested varies. The West RFA region is the largest (over 5.7 million hectares total area) and is 22 per cent forested, whereas the East Gippsland RFA region is the second smallest (1.1 million hectares total area) and is 90 per cent forested.
Figure 1: Forest cover and non-forest from Victoria’s forest cover estimates, 2013Note: Forest cover is shown in green and non-forest is shown in blue.The mix of forest on public and private land also varies between RFA regions. The West RFA region has the highest proportion of forest on private land (36 per cent of total forest in the region), which partly reflects the significant plantation industry in the west of the state. In the Central Highlands RFA region, 17 per cent of forest is on private land, while in other RFA regions the proportion is less than 15 per cent.
75
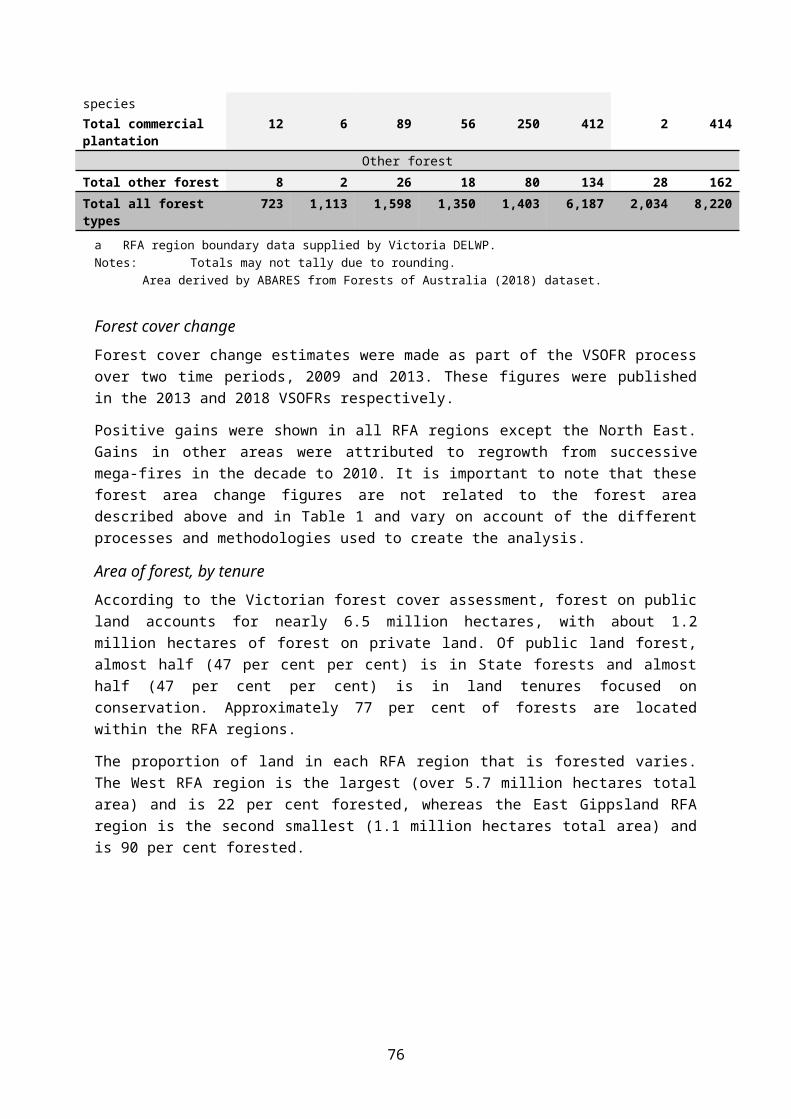
Table 2: Forest cover change by RFA and tenure, 2009–13
2009 2013Forest Non-forest Forest Non-forest
All Land area
Area per cent
Area per cent
All Land
Area per cent
Area per cent
Central HighlandsParks and reserves 174 170 14.9 4 0.3 197 175 15.40 22 0.3State forest 402 395 34.9 7 0.5 145 142 12.53 3 32.4Other Crown land 50 31 2.7 19 1.6 403 35 3.01 368 1.9Private land 509 145 12.8 364 32.2 391 386 34.10 5 0.4Total Central Highlands
1,132 740 65.3 393 34.7 1,132 737 65.04 396 35.0East Gippsland
Parks and reserves 448 436 35.9 12 1.0 447 440 36.21 7 0.6State forest 583 576 47.4 7 0.5 86 78 6.39 8 6.9Other Crown land 27 19 1.5 8 0.6 102 18 1.45 84 0.6Private land 160 75 6.1 85 7.0 582 576 47.49 6 0.4Total East Gippsland
1,213 1,104 90.9 111 9.1 1,213 1,111 91.54 103 8.5Gippsland
Parks and reserves 491 446 16.8 45 1.7 545 466 17.55 79 1.1State forest 864 846 31.8 18 0.7 290 261 9.83 29 34.3Other Crown land 136 59 2.2 77 2.9 1,01 100 3.76 910 3.0Private land 1,170 246 9.2 924 34.8 812 800 30.13 12 0.4Total Gippsland 2,655 1,595 60.0 1,062 40.0 2,655 1,627 61.27 1,029 38.7
North EastParks and reserves 368 332 14.3 36 1.5 418 353 15.23 65 1.1State forest 783 763 32.9 20 0.9 201 175 7.52 26 38.3Other Crown land 110 56 2.4 54 2.3 979 90 3.84 889 2.8Private land 1,060 185 8.0 875 37.7 724 716 30.88 8 0.3
76
2009 2013Forest Non-forest Forest Non-forest
All Land area
Area per cent
Area per cent
All Land
Area per cent
Area per cent
Total North East 2,317 1,335 57.6 984 42.4 2,317 1,332 57.47 986 42.5West
Parks and reserves 517 473 8.2 44 0.7 604 449 7.77 155 0.7State forest 303 282 4.9 21 0.4 575 532 9.20 43 72.7Other Crown land 231 80 1.4 151 2.6 4,291 98 1.68 4,193 2.7Private land 4,725 501 8.7 4,224 73.2 305 293 5.07 12 0.2Total West 5,770 1,334 23.1 4,439 76.9 5,770 1,369 23.73 4,401 76.3
Non-RFAParks and reserves 1,665 1,111 11.5 554 5.7 1,359 1,120 11.62 239 5.9State forest 393 231 2.4 162 1.7 832 264 2.74 568 72.2Other Crown land 376 118 1.2 258 2.7 7,053 92 0.95 6,961 2.5Private land 7,204 247 2.6 6,957 72.2 394 228 2.36 166 1.7Total non-RFA 9,635 1,706 17.7 7,929 82.3 9,635 1,702 17.66 7,933 82.3Grand total 22,72
57,810 34.4 14,915 65.6 22,722 7,8760 34.66 14,846 65.3
Note: Numbers may not add up due to rounding. Source: DELWP – forest cover change maps were produced from Landsat data and processed using the Random Forest Model. The forest masks are derived from 2009 and 2013 imagery to represent the 2013 and 2018 publication years.
77

Indicator 1.1c: Area of forest in protected area categories
In the context of the RFAs, the management of forests in Australia is guided by the NFPS: a set of broad goals agreed to by Commonwealth, state and territory governments. The goal of the NFPS is to implement the concept of sustainable forest management, aiming for Australia’s native forests to conserve biological diversity, heritage and cultural values, while at the same time developing an internationally competitive forest products industry based on native forests that are managed sustainably.Major elements of the NFPS include a commitment to the development of a CAR reserve system, and implementation of strategies to protect old-growth forests and wilderness as part of the reserve system. The CAR reserve system is based on three principles:
including the full range of vegetation communities (comprehensive) ensuring the level of reservation is large enough to maintain species diversity
(adequate) conserving the diversity within each vegetation community, including genetic
diversity (representative).The system identifies the forested areas based on JANIS criteria to protect nature conservation reserves. It contains four categories: formal reserves, informal reserves, areas managed by prescription and areas managed for protection on private land, defined as follows:
Dedicated (Formal) Reserve – including Crown land formally reserved for environmental protection and where timber harvesting is prohibited (such as national parks, state parks, forest parks, nature conservation reserve and other conservation reserves)
Informal Reserve – including public land protected to achieve conservation values while excluding timber harvesting, or protected under an approved management plan; this is mostly defined by areas of SPZ within State forest
Values Protected by Prescription – in Victoria, those prescriptions defined under the Code of practice for timber production 2014, related to areas of steep slopes, or very rare values, values with fragmented distributions, or values naturally occurring in linear form such as riparian vegetation
Private Land – defined by a registered on-title security agreement for third party offset sites as either:
a Trust for Nature offset covenant under the Conservation Trust Act 1972 (Vic.)
a section 69 agreement under the Conservation, Forests and Lands Act 1970 (Vic.)
alternatively, as a Land Management Co-operative Agreement (DELWP).Extent of protected areas in RFA regionsThe area and proportion of forest ecosystems reserved through formal and informal processes, and the changes to that area over time, reflect policy interventions that drive strategies to conserve biodiversity. Additions to the CAR reserve system arise from two main processes: the first being the transfer of State forest to the reserve system (most significantly the Otway National Park in 2004), which forms part of the formal reserve. The second process comes from prescriptions from the Code of Practice, which have seen significant increases in the Central Highlands, which are aligned with efforts to preserve habitat of the critically endangered Leadbeater’s Possum. The CRA process reported a total of 5.3 million hectares of public land area within the boundaries of the five RFA regions. This included 2.96 million hectares in State forest and
78

1.93 million hectares in parks and reserves. A further 2.9 million hectares was private land, and 47 per cent of the area within the RFA areas was forested (Table 3). The total CAR reserve system defined when the RFAs were signed totalled 2.63 million hectares.By 2018, dedicated reserves and SPZs had increased to over 3.3 million hectares. This accounts for the application of an additional 330 thousand hectares of exclusions under the Code, and an increased area with SPZs. This constitutes an overall increase of 730 thousand hectares added to CAR reserves during the period 1999–2018 (Figure 2).
Figure 2: CAR reserves in Victorian RFA areas
79
Table 3: Tenure and protected area categories as represented in the CRA documents (1996 – 1999)
Original RFAs
Central Highland
s(ha)
East Gippslan
d(ha)
Gippsland
(ha)
North East(ha)
West(ha)
Total(ha)
Size of RFA region (ha) 1,132,000
1,213,000
2,655,000
2,317,000
5,770,000
13087000
Private land (ha) 502,800 156,000 1,200,000
1,057,300
4,800,000
7,716,000
Public land (ha) 600,000 1,044,000
1,400,000
1,260,700
1,000,000
5,305,000
State forest (ha) 389,800 637,000 806,000 718,700 411,000 2,962,000
Forest cover (ha) 740,000 1,120,000
1,630,000
1,340,000
1,370,000
6,180,000
Conservation reserves (NP and flora & fauna reserves) (ha) (a)
179,700 409,500 514,700 392,000 437,000 1,933,000
SPZ (b) 109,200 164,300 248,000 7,590* 176,000 705,000Total area of forest protected (a+ b)
288,900
573,800
762,000
399,000
613,000
2,630,000
a Formal protected areab Informal protected area* Taken from 2003 assessment as value not found in the CRA documents.Source: CRAs from original RFA assessment. Numbers may not add up due to rounding.
Table 4: Tenure and protected area categories, 2018
Area/TenureProtected
Central Highland
s(ha)
East Gippslan
d(ha)
Gippsland
(ha)
North East(ha)
West(ha)
Total(ha)
Size of RFA 1,132,000
1,213,000
2,655,000
2,317,000
5,770,000
13087000
Dedicated Reserves (a)
YES 183,556 465,746 549,743 434,099 542,109 2,175,252
Informal reserves (b)
YES 94,727 109,785 252,276 172,566 130,134 759,487
Prescription-ModEx/CFP/RF (c)
YES 84,319 87,833 211,080 233,890 6,514 623,637
Private Land Covenants (d)
YES 330 33 28,933 294 6,380 35,971
Unprotected – GMZ/SMZ
NO 179,709 318,217 325,882 238,395 159,809 1,222,013
Unprotected – Other Public Land/Private
NO 558,976 173,920 1,278,592 1,197,092 4,915,032 8,123,611
Total 2,233,617 2,368,534 5,301,506 4,593,336 11,529,978 26,026,971
80

Total Protected (a+b+c+d)
362,932 663,397 1,042,032 840,849 685,137 3,594,347
Source: Data derived from DELWP corporate spatial layers PLM25, FMZ100 and RFA25.
International Union for Conservation of Nature protected areasThe IUCN is the global authority on the status of the natural world. IUCN defines a protected area as ‘a clearly defined geographical space, recognised, dedicated and managed, through legal or other effective means, to achieve the long-term conservation of nature with associated ecosystem services and cultural values’ (IUCN 2019b).All Victorian formal reserves are assigned an IUCN protected area category based on protection status and primary land management (Figure 3). Informal reserves are not assigned an IUCN protected area category. These categories cover areas of forest and non-forest. IUCN categories are assigned in Victoria by DELWP and submitted to CAPAD. The CAPAD documents for IUCN extend from 1997 to 2016. In the context of the RFA process, the Dedicated Reserve component of the CAR reserve system should be equivalent to Categories I, II, III or IV as defined by the IUCN Commission for National Parks and Protected Areas in 1994 (IUCN 2019a). Definitions of the category system are provided below:
Ia Strict Nature Reserve: Category Ia are strictly protected areas set aside to protect biodiversity and also possibly geological/geomorphic features, where human visitation, use and impacts are strictly controlled and limited to ensure protection of the conservation values.
Ib Wilderness Area: Category Ib protected areas are usually large unmodified or slightly modified areas, retaining their natural character and influence without permanent or significant human habitation, which are protected and managed so as to preserve their natural condition.
II National Park: Category II protected areas are large natural or near natural areas set aside to protect large-scale ecological processes, along with the complement of species and ecosystems characteristic of the area, which also provide a foundation for environmentally and culturally compatible, spiritual, scientific, educational, recreational and visitor opportunities.
III Natural Monument or Feature: Category III protected areas are set aside to protect a specific natural monument, which can be a landform, sea mount, submarine cavern, geological feature such as a cave or even a living feature such as an ancient grove. They are generally quite small protected areas and often have high visitor value.
IV Habitat/Species Management Area: Category IV protected areas aim to protect particular species or habitats and management reflects this priority. Many Category IV protected areas will need regular, active interventions to address the requirements of particular species or to maintain habitats, but this is not a requirement of the category.
V Protected Landscape/Seascape: A protected area where the interaction of people and nature over time has produced an area of distinct character with significant, ecological, biological, cultural and scenic value: and where safeguarding the integrity of this interaction is vital to protecting and sustaining the area and its associated nature conservation and other values.
VI Protected area with sustainable use of natural resources: Category VI protected areas conserve ecosystems and habitats together with associated cultural values and traditional natural resource management systems. They are generally large, with most of the area in a natural condition, where a proportion is under sustainable natural resource management and where low-level non-industrial use of natural
81

resources compatible with nature conservation is seen as one of the main aims of the area.
Figure 3: IUCN protected areas in Victoria as at 2016Source: CAPAD 2016
82
Table 5: IUCN area categories per RFA 2014–16 (forest and non-forest)
IUCN category RFA 2014 (ha) 2016 (ha)
IA Central Highlands 12,339 12,339
East Gippsland 28,924 28,924
Gippsland 36,562 36,565
Non-RFA 234,514 234,442
North East 37,126 37,126
West 69,414 69,366
IB Central Highlands 0 0
East Gippsland 61,193 61,193
Gippsland 107,634 107,634
Non-RFA 536,126 536,125
North East 34,938 34,939
West 0 0
II Central Highlands 159,042 158,970
East Gippsland 316,163 316,161
Gippsland 309,211 309,156
Non-RFA 843,379 842,876
North East 306,444 306,436
West 386,019 385,996
III Central Highlands 2,369 2,366
East Gippsland 17,534 17,514
Gippsland 16,655 16,655
Non-RFA 10,355 10,356
North East 8,839 8,839
West 18,589 18,587
IV Central Highlands 3,371 3,371
East Gippsland 314 314
Gippsland 1,404 1,404
Non-RFA 30,305 30,295
North East 3,015 3,016
West 9,082 9,061
V Central Highlands 5,693 5,693
East Gippsland 34,428 34,428
Gippsland 16,517 16,517
83
IUCN category RFA 2014 (ha) 2016 (ha)
Non-RFA 65,374 65,374
North East 3,384.9 3,384.9
West 9,699.03 9,699.03
VI Central Highlands 0 0
East Gippsland 8,772.39 8,772.39
Gippsland 45,928.08 45,884.79
Non-RFA 45,221.58 43,269.84
North East 24,010.11 24,010.11Source: CAPAD dataset
Extent of RFA forest and non-forest ecosystems in protected areas Assessment of forest ecosystems is important to determine whether representative examples of these ecosystems and the natural ecological processes that support them are maintained throughout their natural range. Ecological vegetation classes are the basic mapping units used for biodiversity planning and conservation assessment at landscape, regional and broader scales in Victoria. They are derived from large-scale forest type4 and vegetation community mapping and are based on the following types of information:
species composition; forest structure; dominant species; ecological information relevant to the species that comprise the communities
(including life history and response to disturbance and reproductive strategies); and physical environmental attributes such as aspect, elevation, geology and soils,
landform, rainfall, salinity and climatic zones. Each EVC represents one or more plant communities that occur in similar types of environments. The communities in each EVC tend to show similar ecological responses to environmental factors such as disturbance (e.g. bushfire). As well as representing plant communities, the EVCs can be used as a guide to the distribution of individual species and groups of species, including animals, and lower plants such as mosses and liverworts.For the purposes of RFAs, EVCs are equivalent to forest ecosystems, as defined in the Nationally Agreed Criteria for the Establishment of a Comprehensive, Adequate and Representative Reserve System for Forests in Australia (Commonwealth of Australia 1997) (JANIS criteria). Current EVC maps for Victoria are publicly accessible on NatureKit5 and the Spatial DatamartComprehensive Regional Assessment The extent of forest ecosystems in the Victorian RFA regions were assessed through the CRA process between 1996 and 1999.6
4 Forest structure and dominant species 5 See http://maps.biodiversity.vic.gov.au/viewer/?viewer=NatureKit 6 Further information on the CRA forest ecosystems classification and mapping projects for the Victorian RFA
regions can be found at .84

Under the CRA process, an assessment of the existing reserve system was undertaken to establish the reservation levels at that time for each EVC as a proportion of its pre-1750 extent. At the time of assessment, a total of 103 extant EVCs were identified as occurring in the Gippsland RFA region. Fourteen EVCs occur predominantly on private land, with the remaining 89 occurring mainly on public land. Fifty-nine were classified as endangered, vulnerable or rare within the Gippsland RFA region.In the North East RFA region, a total of 58 EVCs were identified. Thirty-one occur predominantly on private land, with the remaining 27 occurring mainly on public land. A total of 46 EVCs were classified as endangered, vulnerable or rare. In the West RFA region, a total of 96 EVCs were identified as currently occurring. Twenty of the EVCs occur predominantly on private land, with the remaining 76 occurring mainly on public land. A total of 74 EVCs were classified as endangered, vulnerable or rare. In the East Gippsland RFA region, a total of 49 EVCs were identified. More than 15 per cent of the pre-1750 extent of all but one EVC (Limestone Grassy Woodland) is protected in the conservation reserve system, while for most EVCs in the region, 60 per cent or greater is protected in the conservation reserve system. A total of 20 EVCs were classified as rare. Tables referring to endangered or vulnerable EVCs are missing from the East Gippsland CRA. In the Central Highlands, a total of 43 EVCs were identified. A total of 27 EVCs were classified as endangered, vulnerable or rare. The conservation status of EVCs in all RFA regions was assessed in the CRAs using the Nationally Agreed Criteria for the Establishment of a Comprehensive, Adequate and Representative Reserve System for Forests in Australia (Table 6; JANIS 1997). Table 6: Nationally Agreed Criteria for the Establishment of a Comprehensive, Adequate and Representative Reserve System for Forests in Australia (JANIS 1997)
Status of EVC Criteria
Rare R1. Total range generally less than 10,000 ha.R2. Total area generally less than 1,000 ha.R3. Patch sizes generally less than 100 ha.
Vulnerable V1. Approaching greater than 70 per cent lost (depletion) and remains subject to threatening processes.
V2. Includes EVCs where threatening processes have caused: significant changes in species composition, loss or significant decline in species that play a major role within
the ecosystem, or significant alteration to ecosystem processes.
V3. Not depleted but subject to continuing threatening processes which may reduce its extent.
Endangered E1. Distribution has contracted to less than 10 per cent of original range.
E2. Less than 10 per cent of original area remaining.E3. 90 per cent of area is in small patches subject to threatening
processes and unlikely to persist.
85
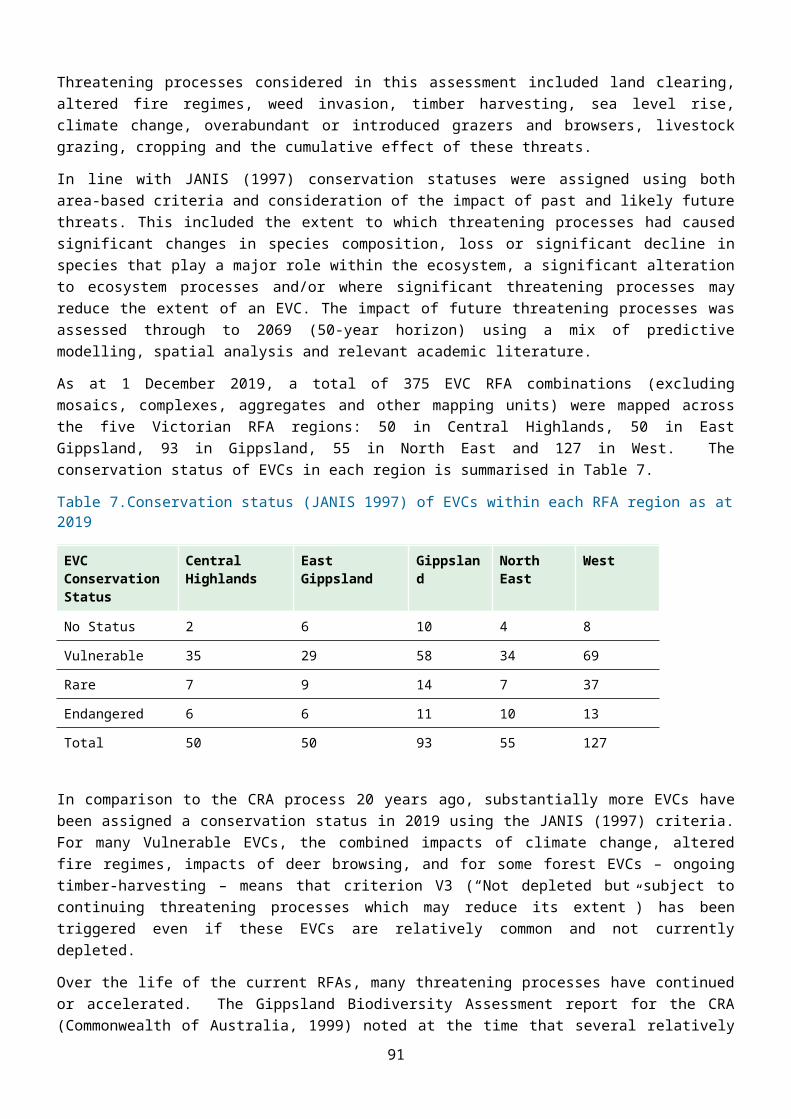
Conservation Status Reassessment The conservation status of EVCs in Victoria’s five RFA regions has been reassessed in line with the national reserve criteria (Table 6; JANIS 1997), presented in Appendix Error:Reference source not found and summarised below. The conservation status reassessment of EVCs was conducted using the best available information and considered the impact of past and potential future threatening processes relevant to EVCs within each RFA region. Threatening processes considered in this assessment included land clearing, altered fire regimes, weed invasion, timber harvesting, sea level rise, climate change, overabundant or introduced grazers and browsers, livestock grazing, cropping and the cumulative effect of these threats. In line with JANIS (1997) conservation statuses were assigned using both area-based criteria and consideration of the impact of past and likely future threats. This included the extent to which threatening processes had caused significant changes in species composition, loss or significant decline in species that play a major role within the ecosystem, a significant alteration to ecosystem processes and/or where significant threatening processes may reduce the extent of an EVC. The impact of future threatening processes was assessed through to 2069 (50-year horizon) using a mix of predictive modelling, spatial analysis and relevant academic literature. As at 1 December 2019, a total of 375 EVC RFA combinations (excluding mosaics, complexes, aggregates and other mapping units) were mapped across the five Victorian RFA regions: 50 in Central Highlands, 50 in East Gippsland, 93 in Gippsland, 55 in North East and 127 in West. The conservation status of EVCs in each region is summarised in Table 7.Table 7.Conservation status (JANIS 1997) of EVCs within each RFA region as at 2019
EVC Conservation Status
Central Highlands
East Gippsland
Gippsland
North East
West
No Status 2 6 10 4 8Vulnerable 35 29 58 34 69Rare 7 9 14 7 37Endangered 6 6 11 10 13Total 50 50 93 55 127
In comparison to the CRA process 20 years ago, substantially more EVCs have been assigned a conservation status in 2019 using the JANIS (1997) criteria. For many Vulnerable EVCs, the combined impacts of climate change, altered fire regimes, impacts of deer browsing, and for some forest EVCs – ongoing timber-harvesting – means that criterion V3 (“Not depleted but subject to continuing threatening processes which may reduce its extent”) has been triggered even if these EVCs are relatively common and not currently depleted. Over the life of the current RFAs, many threatening processes have continued or accelerated. The Gippsland Biodiversity Assessment report for the CRA (Commonwealth of Australia, 1999) noted at the time that several relatively widespread EVCs are subject to a variety of threatening processes but were not judged at that time to be impacted to a sufficiently significant degree (i.e. in extent and/or severity) to be considered endangered,
86

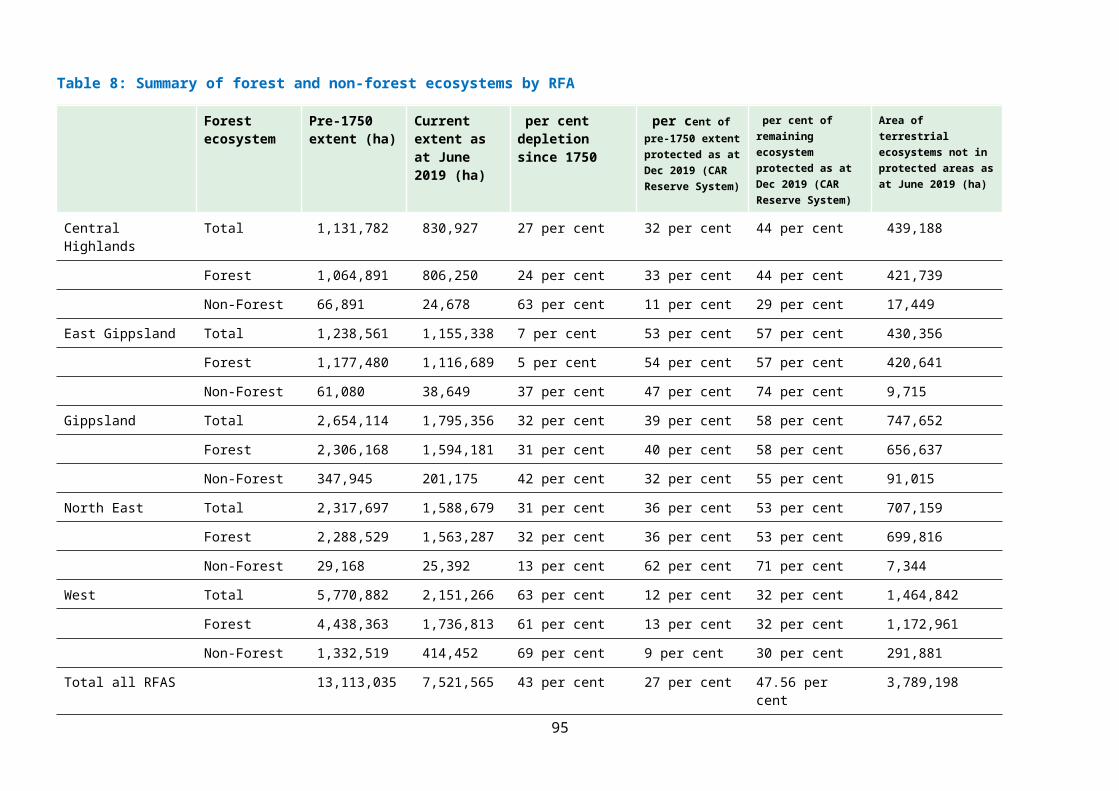
vulnerable or rare in accordance with the JANIS criteria. For example, EVCs with heathy understoreys (Heathy Dry Forest, Heathy Woodland, Granitic Hills Woodland) are particularly sensitive to altered fire regimes and the resultant reduced diversity is commonly identified across the region. The understorey composition of mountain forest EVCs (Damp Forest, Wet Forest, Montane Wet Forest, Shrubby Damp Forest, Shrubby Wet Forest), particularly old individuals of some prominent understorey species (e.g. tree ferns), is significantly impacted by mechanical disturbance associated with timber harvesting. Open fertile EVCs (Montane Grassy Woodland, Sub-alpine Grassland) are favoured for grazing and are relatively more prone to weed invasion. The conservation status of these EVCs at that time was analogous to the “near threatened” category that is applied to some species. Following the reassessment conducted in 2019, a number of these EVCs are now judged as Vulnerable. Stabilising the status of these EVCs relies on a range of management strategies aimed at minimising long-term impacts and is achieved through the CAR Reserve System and complementary active management strategies. Management mechanisms currently available to address the threatening processes listed above includes (but is not limited to): Victorian Government on-ground programs for biodiversity (e.g. weed control), private land conservation mechanisms, regulatory mechanisms (e.g. Code of Practice for Timber Production, Code of Practice for Bushfire Management on Public Land and native vegetation removal regulations). Analysis of forest and non-forest ecosystems by land tenure, including reservation and depletion analysis A reserve system that is comprehensive, adequate and representative in its regional coverage of forest ecosystems is an important component of RFAs. The extent of representation of EVCs in conservation reserves has been used as the basis for evaluating the current reservation status of forest ecosystems in the region and subsequent analysis against the JANIS criteria as required under the RFAs. As a general criterion, 15 per cent of the pre-1750 extent of each forest ecosystem should be protected in the CAR reserve system with flexibility considerations applied according to regional circumstances, and recognising that as far as possible and practicable, the proportion of Dedicated Reserves should be maximised.The conservation status assessment is relevant to JANIS (1997) Criteria 2 and 3 which specify reservation objectives for EVCs classified as endangered, vulnerable or rare which include: all remaining occurrences of rare and endangered EVCs should be reserved or protected by other means as far as is practicable, and at least 60 per cent of the remaining extent of vulnerable EVCs should be reserved. JANIS (1997) contains regional flexibility provisions in consideration of differing regional circumstances to ensure that the CAR reserve system delivers optimal nature conservation outcomes as well as acceptable social and economic outcomes. Therefore, the criteria are to be considered guidelines rather than mandatory targets. Table 8 below summarises the area of terrestrial ecosystems in the Victorian RFA regions and the proportion that is protected as at 2019. Appendix Error: Reference source not found shows the area of all terrestrial ecosystems in each individual RFA region, by individual forest and non-forest ecosystems as at 2019. The EVC map used at the time of the CRAs has since been updated, including updates to the native vegetation extent and progressive improvements in the modelling of EVCs based on new information. The EVC map used in this report is an updated 2019 layer which uses a
87
2015 native vegetation extent and includes an updated rainforest map and minor typology changes.The EVC data 2019 summarised in Table 8 is not directly comparable to the data used in the CRA process (1998-2000) given these updates. Differences between the two data sets include: changes to the method used to generate the pre-1750 EVC model, changes to the method DELWP uses to creates a view of EVC extent (using a new native vegetation extent model and the pre 1750 dataset), applying nomenclature standards to EVCs which may have resulted in the discontinuation of certain EVC names, the splitting of EVCs, reconciliation of mapping units (such as mosaics and complexes), the delineation of new EVC types and spatial adjustments. Of the 7.5 million hectares of terrestrial ecosystems identified in the five RFA regions (current extent), a total of 3.6 million hectares (47 per cent) is protected as at 2019 within the CAR reserve system (formal reserve, informal reserve, prescription and private land covenants). As at 2019, across all RFA regions, forest ecosystems have been depleted on average by 40 per cent and non-forest ecosystems have been depleted by 65 per cent since European settlement. Victoria is the most intensively settled and cleared state in Australia. Large areas of Victoria were cleared for agriculture and although the rate of land clearing has slowed since the introduction of Victoria’s native vegetation regulations in 1989, the quality and extent of native vegetation continues to decline by about 4,000 habitat hectares each year7. This trajectory is largely driven by activities inconsistent with (or in breach of) the regulatory framework (resulting in loss of extent of native vegetation), together with insufficient management of threats (resulting in loss of quality). In response, DELWP has developed a statewide Biodiversity Plan: Protecting Victoria's Environment – Biodiversity 2037 (DELWP 2017c). This document sets out a strategic vision to protect biodiversity and reverse the trajectory of native vegetation decline. In addition, the Office of the Conservation Regulator (OCR) was established early in 2019. The function of the OCR is to provide a central point of coordination and oversight for DELWP’s regulatory functions including the natural environment, timber harvesting, public land use, fire prevention, wildlife and biodiversity. More detail about the OCR is provided on page 304 of this report and in the Overview of Victoria’s Forest Management System 2020.
7 ‘Habitat hectares’ is a method for assessing native vegetation, in terms of both quality and extent. Quality is assessed by scoring habitat attributes at a site in comparison to a reference point (benchmark) for the relevant vegetation type - this provides a ‘habitat score’. The number of habitat hectares of a stand of native vegetation is determined by multiplying the score by the area of vegetation. For example, 10 hectares with a habitat score of 100 per cent is counted as 10 ‘habitat hectares’, whereas 10 hectares of vegetation with a score’ of 50 per cent would be scored as five ‘habitat hectares’
88

Table 8: Summary of forest and non-forest ecosystems by RFA
Forest ecosystem
Pre-1750 extent (ha)
Current extent as at June 2019 (ha)
per cent depletion since 1750
per cent of pre-1750 extent protected as at Dec 2019 (CAR Reserve System)
per cent of remaining ecosystem protected as at Dec 2019 (CAR Reserve System)
Area of terrestrial ecosystems not in protected areas as at June 2019 (ha)
Central Highlands Total 1,131,782 830,927 27 per cent 32 per cent 44 per cent 439,188 Forest 1,064,891 806,250 24 per cent 33 per cent 44 per cent 421,739 Non-Forest 66,891 24,678 63 per cent 11 per cent 29 per cent 17,449
East Gippsland Total 1,238,561 1,155,338 7 per cent 53 per cent 57 per cent 430,356 Forest 1,177,480 1,116,689 5 per cent 54 per cent 57 per cent 420,641 Non-Forest 61,080 38,649 37 per cent 47 per cent 74 per cent 9,715
Gippsland Total 2,654,114 1,795,356 32 per cent 39 per cent 58 per cent 747,652 Forest 2,306,168 1,594,181 31 per cent 40 per cent 58 per cent 656,637 Non-Forest 347,945 201,175 42 per cent 32 per cent 55 per cent 91,015
North East Total 2,317,697 1,588,679 31 per cent 36 per cent 53 per cent 707,159 Forest 2,288,529 1,563,287 32 per cent 36 per cent 53 per cent 699,816 Non-Forest 29,168 25,392 13 per cent 62 per cent 71 per cent 7,344
West Total 5,770,882 2,151,266 63 per cent 12 per cent 32 per cent 1,464,842 Forest 4,438,363 1,736,813 61 per cent 13 per cent 32 per cent 1,172,961 Non-Forest 1,332,519 414,452 69 per cent 9 per cent 30 per cent 291,881
Total all RFAS 13,113,035 7,521,565 43 per cent 27 per cent 47.56 per cent 3,789,198
Notes: The figures shown in this table are based on modelled information mapped at a scale of 1:100,000 derived during the pre-1750 analysis of vegetation types in the Central Highlands and are therefore only approximate. EVC mapping used in 1998 has been revised to ensure the state-wide EVC data set is based on the best
89

available information and integrates new methods of mapping and modelling vegetation across Victoria. As a result, information relating to EVC extent or reservation levels between 1998 and 2019 is not directly comparable and may differ due to the different modelling and mapping approaches.
Protected areas for the purpose of this report include dedicated reserves, SPZs, covenants on private land and mapped Code of Forest Practice exclusions. This dataset is identified in the aggregation of the PLM25 dataset and the Forest Management Zone dataset (FMZ100). In this report, areas protected by prescription are estimated using the spatial layer ‘ModEx’. Source: Data derived from DELWP corporate spatial layers PLM25, FMZ100 and 2019 interim RFA EVC mapping (unpublished).
90
Indicator 1.1d: Fragmentation of forest cover
The VSOFR 2018 described forest fragmentation in the following way:Forest fragmentation is a metric to describe forest quality. It assumes that the highest quality forests are at the centre, and that the larger the area, the more resilient the forest is to disturbances. Forest loss and the deterioration of forest health via increasing fragmentation, pose significant threats to biodiversity, and endanger the sustainability of ecological goods and services from forested land. (Commissioner for Environmental Sustainability Victoria 2019, p. 64)
Change in forest cover and the spatial configuration of gain and loss show the level of fragmentation in Victoria’s forests (Figure 4) and have implications for forest-dependent species.
Figure 4: Forest fragmentation in Victoria (published 2018 reprinting 2013 baseline year) The fragmentation analysis provided here is derived from two forest/non-forest datasets which represent baseline years of 2009 and 2013 and published in 2013 and 2018 respectively. This analysis uses five fragmentation categories. Increasing area of interior forest reflects an improvement, while increases in Patch, Edge and Perforated categories reflect an increasing level of fragmentation (Figure 5).Increases of interior forest across all RFAs largely reflect the significant regeneration from major bushfires that occurred in the decade to 2010, as quantified through this remote-sensing approach. The overall trend for forest
91
fragmentation across the RFA regions between 2009 and 2013 is good, as reflected in the Interior gains; however, site-scale analysis in some areas may provide different results than landscape-level analysis.
Patch Transitional Edge Perforated Interior
-2.0
-1.5
-1.0
-0.5
0.0
0.5
1.0
1.5
2.0
2.5
3.0
CENTRAL HIGHLANDS EAST GIPPSLAND GIPPSLANDNORTH EAST WEST Total
per
cent
chan
ge
Figure 5: Change in fragmentation status between baseline years of 2009 and 2013
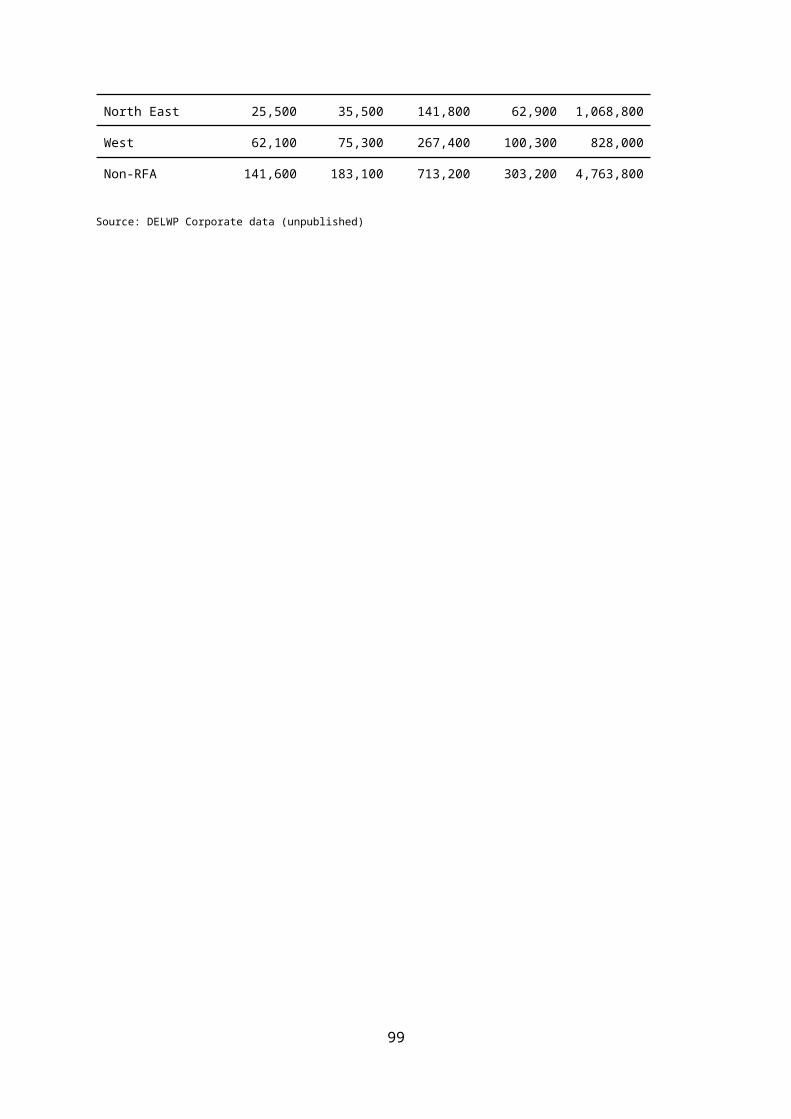
Table 9: Forest fragmentation 2009Forest fragmentation 2009
RFA region Patch(ha)
Transitional
(ha)
Edge(ha)
Perforated(ha)
Interior(ha)
Central Highlands
15,600 22,600 81,900 29,400 590,200
East Gippsland 5,300 9,900 56,400 28,400 1,003,500
Gippsland 33,100 39,800 165,700 82,200 1,273,300
North East 25,500 35,500 141,800 62,900 1,068,800
West 62,100 75,300 267,400 100,300 828,000
Non-RFA 141,600 183,100 713,200 303,200 4,763,800
Source: DELWP Corporate data (unpublished)
92

Table 10: Forest fragmentation 2013Forest fragmentation 2013
RFA region Patch(ha)
Transitional
(ha)
Edge(ha)
Perforated(ha)
Interior(ha)
Central Highlands
17,800 22,100 76,900 29,000 590,400
East Gippsland 4,500 8,700 50,200 27,600 1,019,700
Gippsland 31,100 37,800 146,000 72,400 1,339,400
North East 24,400 32,200 123,600 54,700 1,096,500
West 62,400 74,400 259,900 99,200 873,000
Non-RFA 140,200 175,200 656,600 282,900 4,919,000
Source: DELWP Corporate data (unpublished)
93

Indicator 1.2a Forest-dwelling species for which ecological information is available
This indicator reports the level of information available to manage forest-dwelling species and tracks changes in this knowledge over time. The amount of habitat, disturbance and life history information available to make management decisions indicates the capacity to assess risk to species and implement conservation strategies. The following section outlines the key information sources in Victoria and summarises information where available. Victorian Biodiversity Atlas The VBA species observations is a foundation dataset that feeds into some of the many biodiversity tools used in DELWP’s everyday decision-making, showing where wildlife is now and how this has changed over time. This makes it a core input to the majority of the government processes and programs that impact native species. It is used in conservation status assessments, HDMs that feed into the Strategic Management Prospects and Native Vegetation Removal Regulations and into our public land management, research activities and State of the Environment reporting.The VBA dataset is collated from a wide range of contributors including DELWP biodiversity staff, government agencies and partner organisations, non-government organisations such as BirdLife Australia, ecological consultancies, university students and the many and varied community wildlife survey groups and individuals. The majority of the data is from project-based work where structured surveys were undertaken to assess presence or abundance of targeted species. It also includes all the records from previous department-managed datasets such as the Victorian Rare and Threatened Plant Population monitoring database (VROTpop). As part of the RFA modernisation program, landscape scale surveys are being conducted to collect new field data on high-priority forest-dependent threatened species (both presence and true absence data), which will be stored in the VBA and inform forest management. This process is described in the case study below on page 101.In addition, as part of the Forest Protection Survey Program, surveys are being undertaken in planned timber harvesting areas in State forests in eastern Victoria. These surveys collect data on plants; arboreal and terrestrial mammals; some bird species, frogs, fish and crayfish; and vegetation communities prior to the commencement of harvesting operations. A target of 80% coupes are planned to be surveyed prior to harvesting. The VicForests’ Rolling Operations Plan provides the basic information about what is planned to be harvested and where. This information, along with a wide range of other information such as HDMs and species lists, is used to help prioritise what species will be surveyed where and when. The proposed harvest date is used by DELWP to prioritise the timing and location of surveys. Observations from this survey program will be stored in the VBA.
94
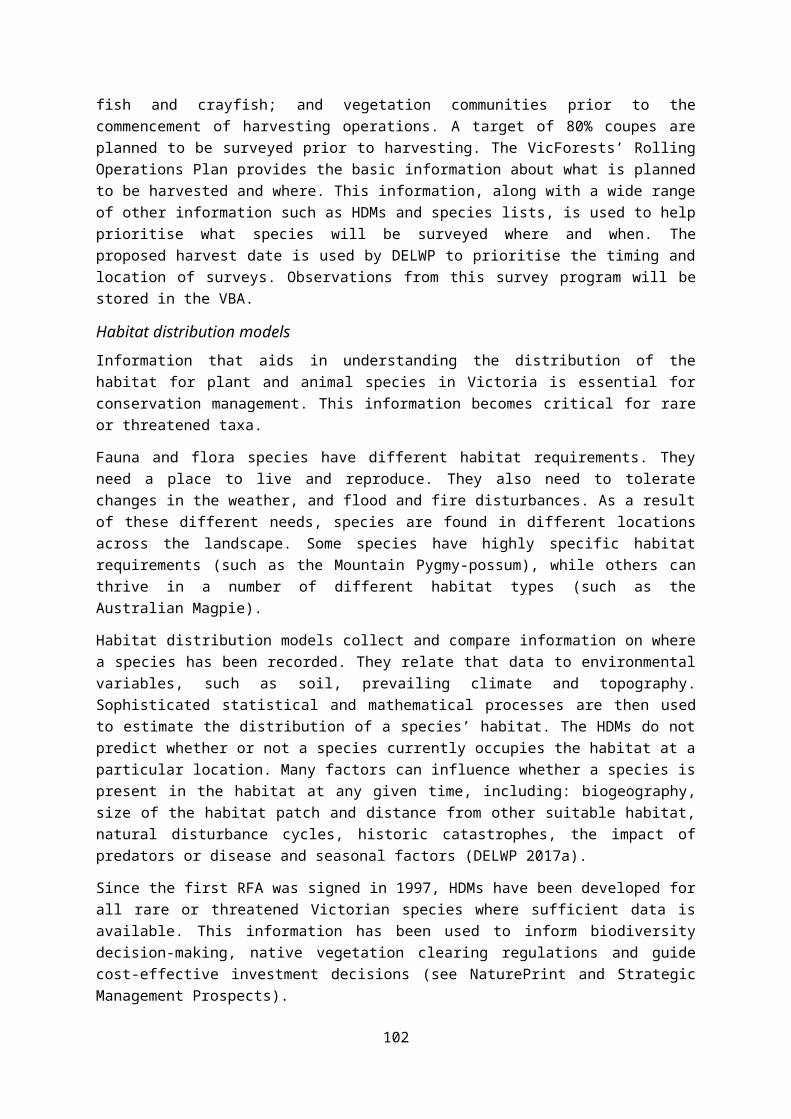
Habitat distribution models Information that aids in understanding the distribution of the habitat for plant and animal species in Victoria is essential for conservation management. This information becomes critical for rare or threatened taxa. Fauna and flora species have different habitat requirements. They need a place to live and reproduce. They also need to tolerate changes in the weather, and flood and fire disturbances. As a result of these different needs, species are found in different locations across the landscape. Some species have highly specific habitat requirements (such as the Mountain Pygmy-possum), while others can thrive in a number of different habitat types (such as the Australian Magpie). Habitat distribution models collect and compare information on where a species has been recorded. They relate that data to environmental variables, such as soil, prevailing climate and topography. Sophisticated statistical and mathematical processes are then used to estimate the distribution of a species’ habitat. The HDMs do not predict whether or not a species currently occupies the habitat at a particular location. Many factors can influence whether a species is present in the habitat at any given time, including: biogeography, size of the habitat patch and distance from other suitable habitat, natural disturbance cycles, historic catastrophes, the impact of predators or disease and seasonal factors (DELWP 2017a). Since the first RFA was signed in 1997, HDMs have been developed for all rare or threatened Victorian species where sufficient data is available. This information has been used to inform biodiversity decision-making, native vegetation clearing regulations and guide cost-effective investment decisions (see NaturePrint andStrategic Management Prospects). Examples of HDMs for the Greater Glider (Petauroides volans), Sooty Owl (Tyto tenebricosa tenebricosa) and Tall Astelia (Astelia australiana), including the VBA survey points used to generate the model, are shown below (Figure 6). The models used to develop the maps in Figure 6 to Figure have a colour gradient applied in the legend to represent the range of habitat values for each species from high (80 and above, represented as one colour) to low (30 and below, represented as one colour) to aid the reader in discerning areas of high and low habitat values.Habitat distribution models can also be used to inform conservation strategies and levels of protection by assessing the area of a species’ modelled suitable habitat that is within the CAR reserve system – an analysis of the HDMs for priority EPBC Act listed species is at Appendix Error: Reference source not found.As part of the RFA modernisation program, HDMs for High-priority species are being updated with new field data and approaches to modelling. This process is described in the case study below on page 101. Currently published HDMs are publicly available on NatureKit.8
8 See http://maps.biodiversity.vic.gov.au/viewer/?viewer=NatureKit
95

Figure 6: Habitat Distribution Model for the Greater Glider (Petauroides volans)
96

Figure 7: Habitat Distribution Model for the Sooty Owl (Tyto tenebricosa tenebricosa)
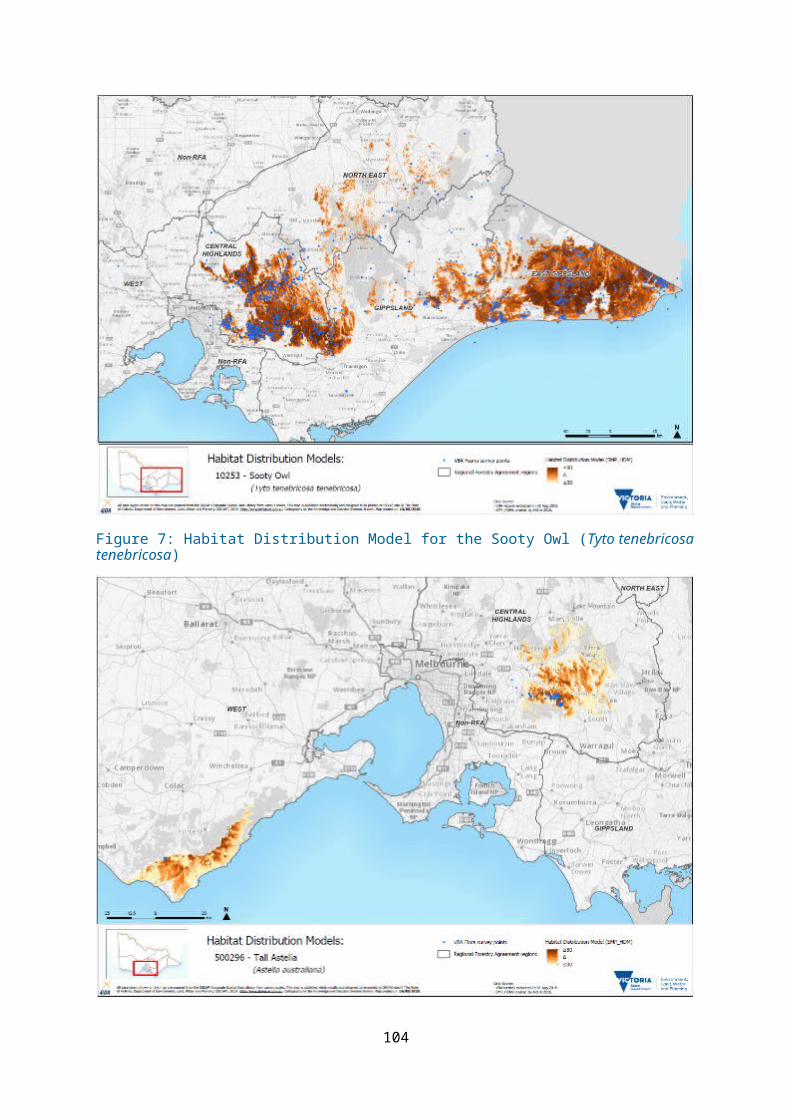
Figure 8: Habitat Distribution Model for the Tall Astelia (Astelia australiana)
97

NaturePrint and Strategic Management Prospects Evidence-based decision-making is critical to improving outcomes for biodiversity. Strategic Management Prospects (SMP) is a decision-support tool that helps biodiversity managers identify and prioritise management options in a transparent, objective and repeatable way. SMP uses a new spatially explicit, landscape-scale approach to identify the most effective and efficient management actions to benefit biodiversity across Victoria (DELWP 2019a). The aim of Biodiversity 2037 is to ‘see an overall improvement, where the majority of habitats and threatened species will be improved, and habitat gains will outweigh losses’ (DELWP 2017c, p. 14).To have the best chance to achieve the greatest outcomes for biodiversity in Victoria we need to compare information about thousands of biodiversity values. There are a range of best-practice methods now available for use. SMP integrates and simultaneously compares information on biodiversity values, threats, effectiveness of management actions and indicative costs of management actions for biodiversity across Victoria (Table 11). Example output is at Figure 9. Habitat distribution models for over 4,000 species are used in the first version of SMP analysis. HDMs have been created for most of Victoria’s vertebrate fauna, threatened vascular flora and some rare or threatened invertebrates. The majority of terrestrial forest-dwelling species are considered in SMP. SMP can be used to make management decisions about forest-dependent species, assess risks to species and implement conservation strategies. When undertaking management actions, it is important to know how those actions benefit different plants and animals in different places. Information on where actions have the greatest benefit, or the greatest prospects for change for particular species, is essential to guide investment or management planning.Benefits can vary in spatial magnitude and temporal scale. Some actions (e.g. caging orchids to protect from herbivores) are only appropriate in unique situations, while other actions (e.g. fox baiting) can provide benefits for a number of species in many places. A common measure of benefit is required to enable comparisons across a wide range of species, threats and actions (DELWP 2017b). Biodiversity 2037 identifies a new measure – Change in Suitable Habitat – that will standardise the measurement of benefit and be used to assess overall progress towards the plan’s targets.In 2018, SMP was used to guide decision-making and investment for 85 new projects for on-ground biodiversity action worth $33.67 million through Biodiversity Response Planning. Funded projects will be delivered over three years, commencing in 2018–19 through to 2020-2021.9
Table 11: Strategic Management Prospects inputs (DELWP 2017b)
9 See https://www.environment.vic.gov.au/biodiversity/biodiversity-response-planning
98
Inputs to SMP Relationships modelledHabitat distribution models
Known observations of species and characteristics of the environment (e.g. terrain, climate).
Threat models Known occurrences of threats (e.g. deer or rabbits) and characteristics of the environment (e.g. terrain, climate).
Benefit of action models Expert opinion of site-specific and situation-specific settings assessed by multiple experts with a standardised method called expert elicitation. These opinions were extrapolated from sites to landscape.
Costs of actions Costs of on-ground operations calculated as dollars per hectare, informed by considering temporal (time-related), spatial (place-related), and cost components (site costs, opportunity costs to private landholders, transaction costs and travel costs).
Figure 9: Strategic Management Prospects cost-effective actions (modelled output)
99

Indicator 1.2c: Representative species from a range of habitats monitored at scales relevant to regional forest management
As outlined above, the VBA is a repository for information on flora and fauna sightings across Victoria. The VBA database includes observations from dedicated monitoring programs implemented by government and non-government entities, as well as sightings from ‘citizen scientists’ (non-professionals who volunteer time and effort for scientific research). The VBA database helps managers understand where wildlife is now, and importantly, where it is not – in the form of absence data. It is a key tool for the government’s processes and programs that manage native species. Specifically, it is used in conservation status assessments, and for the development of HDMs that inform strategic decision-making processes, including Native Vegetation Removal Regulations (Commissioner for Environmental Sustainability Victoria 2019, p. 75).
Figure 10: Monitoring sites across Victoria as recorded in the VBA as at 2018
100
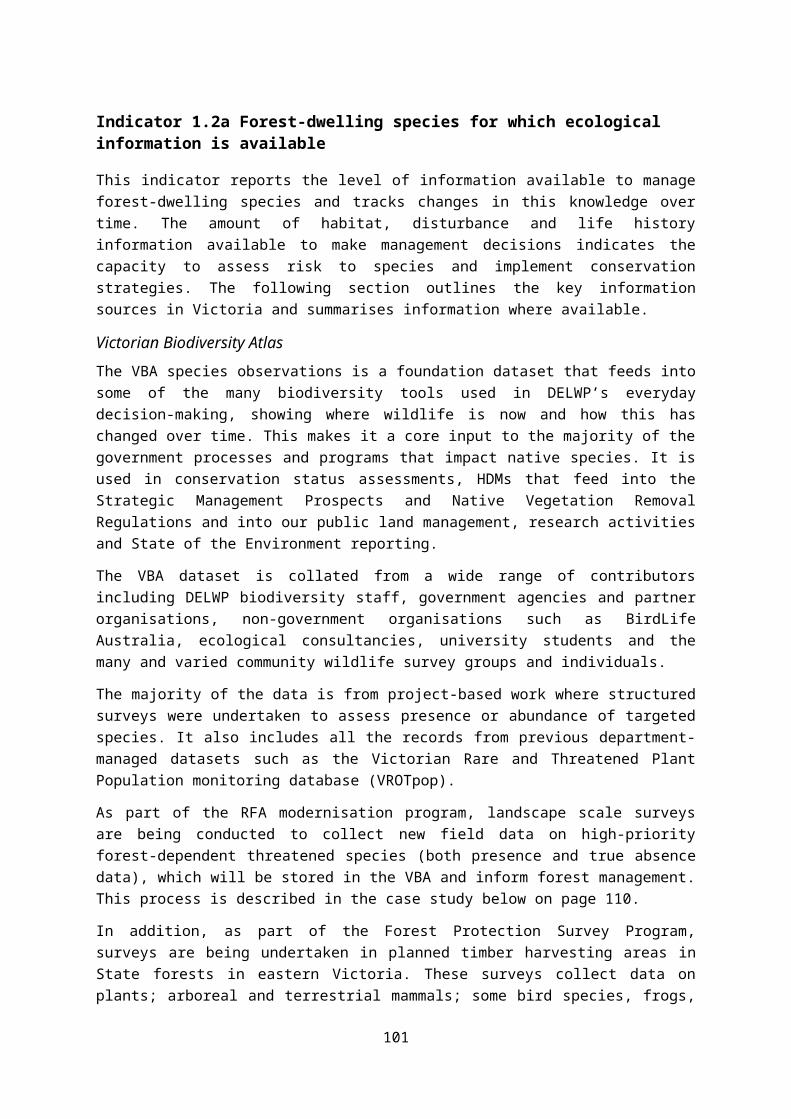
Table 12: Number of species monitored, by taxonomy types, 2013–17
Taxon groupCentral
HighlandsEast
Gippsland Gippsland North East WestAmphibians 14 8 11 4 20Aquatic invertebrates 1 1 0 0 1Fish 7 13 13 7 7Invertebrates 6 2 4 1 5Mammals 42 17 26 12 67Marine birds 1 0 0 0 1Mussels, decapod crustacea
8 13 10 3 8
Non-passerine birds 36 12 18 9 42Passerine birds 29 9 15 11 28Reptiles 21 10 10 5 25Waders 3 0 2 1 4Total 168 85 109 53 208
Source: VBA 2018
Table 13: Number of monitoring projects by year
Year
Central Highland
s
East Gippslan
dGippslan
dNorth East West
2013 29 13 15 11 382014 27 12 18 6 422015 24 15 16 7 442016 22 14 13 6 372017 12 11 12 5 25
Note: ‘Total’ column not included, as many monitoring projects last more than a year, meaning a duplication in counts each year. Data source: VBA 2018
Case study: biodiversity values assessment as part of the Victorian forest modernisation program As part of the RFA modernisation program and Victoria’s broader forest management system reform, DELWP has commissioned a number of projects to improve the current information base and knowledge of threatened forest-dependent species and their habitat. These projects include: Landscape scale surveyThe Arthur Rylah Institute (ARI) is collecting new field data on high-priority forest-dependent threatened species from late 2018 to mid-2020. This new on-ground data will be used to improve DELWP’s understanding of where the species are likely to be found across forests in Victoria. It will also help to fine-tune current HDMs, which are based on records of species distribution and
101
abundance stored in the VBA. Researchers will target 10 terrestrial fauna species for surveys in eastern Victoria, including Leadbeater’s Possum, Long-footed Potoroo, gliders and owls, Glossy Black-cockatoo, Large Brown Tree Frog and Giant Burrowing Frog. In addition, surveys will target up to 15 threatened aquatic species (galaxias and crayfish) and 27 threatened plants to improve our understanding of their distribution and enhance their protection. ARI is using a range of methods including motion-sensor cameras, spotlighting and call playback to survey for species. Survey locations have been chosen to give the greatest information gain for the HDMs. Survey sites will be located across public and private land as well as on the edge of species range to test understanding of where species do not occur and improve model outputs. This is known as confirming true absence data. Surveys are only occurring in eastern Victoria (east of the Hume Highway). All species that are found through this survey work will be recorded in the VBA, helping to improve the understanding of all species, possibly including other threatened species that are not the targets of specific surveys. Updated habitat distribution models for key forest-dependent speciesThrough the RFA modernisation process, ARI is developing a revised set of HDMs for selected forest-dependent threatened species. This project proposes to develop a series of HDMs that better reflects the current distribution of the selected forest-dependent taxa, particularly with respect to an increasing interest in ‘landscape scale’ threatened species management. Population viability analysisResearchers from the University of Melbourne, with input from DELWP, are undertaking a program to develop spatially explicit population viability models for seven key/focus forest-dependent fauna taxa (Greater Glider, Leadbeater's Possum, Long-footed Potoroo, Powerful Owl, Sooty Owl, Baw Baw Frog, Broad-toothed Rat), as well as series of metapopulation analyses for up to 77 other priority forest species. Climate change vulnerability analysis of forest ecosystems Over the next 50 years and beyond, climate change will continue to significantly impact our forests and the ecosystems and species they comprise. While it is known that increasing temperatures, reduced rainfall and increased frequency and severity of bushfires and other extreme weather events will impact forests, the potential changes are not clearly understood. Forest changes due to climate change are a complex web of interacting factors. Climate change impacts in Victoria’s forests are currently difficult to predict due to limited field-based forest experimentation. In addition, many climate change and ecological modelling approaches are still in the early stages of development, particularly regarding their application to Australia’s forests. DELWP has commissioned a project to identify key EVCs and key forest-dependent species impacted by timber harvesting that are most vulnerable to climate change. This information will be brought together to help inform decisions and assist the government in considering measures to better manage and protect those communities and species most vulnerable to the impacts of climate change as part of the RFA modernisation process.
102

A longer-term piece of work is required to determine how Victoria’s forests can be better protected from the impacts of climate change. This includes consideration of the optimal scale and design of a ‘climate smart’ CAR reserve system.There are a number of discrete and complementary analyses that will provide information to help identify and inform the current state of ecological vegetation communities. They can also provide information on those communities and forest-dependent species most vulnerable to climate change over a 50-year outlook, given various climate scenarios. Useful information to be collected is as follows:
current EVC status for recent fire history and tolerable fire interval ecological niche analysis of key forest-based EVCs and key forest-
dependent species under climate scenarios Representative Concentration Pathway (RCP) 2.6, 4.5, 6.0 and 8.5
expert elicitation of climate change vulnerability for key forest-dependent species under climate scenarios RCP 2.6 and 8.5.
Results from the various analyses will provide a current status of the tolerable fire interval of forest-based EVCs, which can be used as a surrogate for ecosystem resilience and potential current vulnerability of these communities. In addition, for key forest-based EVCs a climate niche analysis under a range of RCP climate change scenarios will provide a comparison of the modelled distribution of the ecological niche of EVCs under current climate with future modelled distributions (overlap analysis). This will determine the distribution of current areas that remain suitable under future climate scenarios.Results for key forest-dependent species include a climate niche analysis as for the EVCs for those species able to be modelled under two climate scenarios, combined with expert elicitation. The models and information are considered, if experts choose to, among a range of other information and judgements by experts involved in the elicitation process, to judge key forest-dependent species vulnerability to climate change. The formal elicitation will identify the following across all five RFA regions:
the perceived level of vulnerability to climate change over a 50-year time frame, considering climate scenarios RCP 2.6 and RCP 8.5
the perceived causes of decline candidate protection measures or other conservation actions that may
mitigate risks that could be considered in the short term under the RFA modernisation process and forest management planning process to adequately manage and protect those species and communities most vulnerable to climate change.
Integrated biodiversity values model The purpose of the integrated biodiversity values model (IBVM) is to provide indicative spatial representations of relevant biodiversity ‘value’ which can support structured decision-making relating to forest and fire management planning. This product is a prototype grid-based spatial dataset incorporating attributes of specific biodiversity values (habitat for forest-dependent threatened species, forest ecosystems and old-growth forest – where available) across multiple layers. The IBVM will assist in decision-making around what areas of the forest estate should be prioritised for conservation, given (1) the distribution of
103
biodiversity values, and (2) the predicted future state of biodiversity under scenarios of disturbance. Zonation algorithms are used to consider each grid cell’s relative contribution to net habitat (extent and quality).
104
Indicator 1.3a: Forest associated species at risk from isolation and the loss of genetic variation, and conservation efforts for those species
Risk of isolation and loss of genetic variationThis indicator assesses the risks to loss of forest genetic variation and describes the formal measures designed to mitigate this risk. A loss of genetic diversity in species can result in a decreased ability to adapt to future environmental change, and thus a higher risk of extinction.Information on the number of forest-dependent species at risk from isolation is relatively limited and difficult to consolidate on a statewide scale; however, there are a number of studies that detail some species that are at particular risk, and also discuss some techniques to alleviate that risk. A selection of these studies is outlined in Table 14. Isolated populations of a species are in greater danger of extinction due to genetic drift. Genetic drift is the loss of genetic variation in a small isolated population, which decreases a population’s ability to cope with changes in environment, and increases the effect and prevalence of genetic disease, due to inbreeding within the small population. Amos et al. (2014) showed that a suite of woodland-occupying birds in central Victoria were at risk of genetic decline, largely due to habitat fragmentation. They found that these effects would be greater where habitat fragmentation was greatest and would affect the least dispersive species over more dispersive ones. Genetic rescue – the addition of genes from an external population of the same taxa, but from a different, broader population – has been shown to alleviate some of the consequences of genetic drift and inbreeding, allowing a fitter overall population. In the case of the Mt Buller Mountain Pygmy-possum population, individuals from a larger, more diverse population were introduced to the site, along with more traditional management strategies, such as habitat restoration and construction of corridors linking suitable habitat, greatly increasing the chances of survival of this population. Where a closely related taxon exists and is known to have interbred with the threatened taxon previously (e.g. breeding Helmeted Honeyeater (Lichenostomus melanops cassidix) with another subspecies of the Yellow-tufted Honeyeater (L. m. gippslandicus)), interbreeding may be successful in reducing loss of genetic variety; however, overuse of this technique will result in the threatened population’s genetics being ‘diluted’ by the larger population’s. It is suggested that only four new individuals per generation be introduced to the gene pool to allow for this dilution (Harrison et al. 2016). Weeks, Stoklosa and Hoffman (2016) discuss various management programs for threatened mammals across Australia and demonstrate that managing small populations as separate genetic populations to the remainder of the species may contribute to the decline of these species as a whole. Conversely, Hansen and Taylor (2008) show that an isolated population of Leadbeater’s Possum (Gymnobelideus leadbeateri) may not benefit from genetic
105

rescue, as the population has evolved separately to occupy a markedly different habitat (lowland swamp forests, Eucalyptus camphora, Leptospermum spp. and Melaleuca spp.) to that of the main population (montane wet forests, E. regnans, E. delegatensis, Acacia spp.) Van der Ree et al. (2010) and Soanes et al. (2018) have conducted a long running investigation into the effects of fragmentation, due to a large highway, on the Squirrel Glider (Petaurus norfolcensis). They have shown that large highways can impede isolated populations of the species from interbreeding, but a simple expedient of a rope bridge across the roadway enables individual gliders to cross and therefore allows genetic dispersal. While these studies show that there are forest-dependent species in Victoria at risk from loss of genetic diversity, there are programs in place to reduce or remove some of these problems, both through interbreeding with other populations, and enabling isolated populations to connect with the broader population. More study is required to gain a broader idea of the extent of loss of genetics due to fragmentation, over the forest estate of Victoria.Table 14: Recent studies examining risk from isolation and the loss of genetic variation
Species Common name Reference Various
woodland birds
Amos, JN et al. 2014, ‘Species- and sex-specific connectivity effects of habitat fragmentation in a suite of woodland birds’, Ecology, vol. 95, no. 6, pp. 1556–68.
Gymnobelideus leadbeateri
Leadbeater’s Possum (Yellingbo population)
Hansen, BD & Taylor, AC 2008, ‘Isolated remnant or recent introduction? Estimating the provenance of Yellingbo Leadbeater’s possums by genetic analysis and bottleneck simulation’, Molecular Ecology, vol. 17, pp. 4039–52.
Lichenostomus melanops cassidix
Helmeted Honeyeater
Harrisson, KA et al. 2016, ‘Scope for genetic rescue of an endangered subspecies though re-establishing natural gene flow with another subspecies’, Molecular Ecology, vol. 25, no. 6, 1242–58.
Petaurus norfolcensis
Squirrel Glider Van der Ree, R, Cesarini, S, Sunnucks, P, Moore, JL & Taylor, A 2010, ‘Large gaps in canopy reduce road crossing by a gliding mammal’, Ecology and Society, vol. 15, no. 4: 35.
Soanes, K, Taylor, AC, Sunnucks, P, Vesk, PA, Cesarini, S, van der Ree, R 2018, ‘Evaluating the success of wildlife crossing structures using genetic approaches and an experimental design: lessons from a gliding mammal’, J Appl Ecol., vol. 55, no. 1, pp. 129–38.
Burramys parvus
Mountain Pygmy-possum
Weeks, AR et al. 2017, ‘Genetic rescue increases fitness and aids rapid recovery of an endangered marsupial population’, Nature Communications, vol. 8: 1071.
Endangered endemic mammals
Weeks, AR, Stoklosa, J & Hoffmann, AA 2016, ‘Conservation of genetic uniqueness of populations may increase extinction likelihood of endangered species: the case of Australian mammals’, Frontiers in Zoology, vol. 13:31.
106
Conservation efforts supporting vulnerable speciesDELWP undertakes numerous management actions to promote the conservation of species. Table 15 shows the level of management activity for each forest-dependent threatened species for eight action categories, as provided by DELWP’s regional implementation teams. The categories are:
community engagement; policy and planning; survey and monitoring; habitat protection and restoration; pest and weed control; population manipulation; captive management; and research.
All efforts were made to populate this table as comprehensively as possible; however, it should be viewed as a non-exhaustive list. Indeed, the categories of ‘survey and monitoring’ and ‘research’ may be underrepresented as initiatives from other research institutions or land management agencies implement may not have been captured. Table 15: Management activity for each forest-dependent threatened species, 2013–17
Common name
Com
mun
ity
enga
gem
ent Po
licy
and
plan
ning
Surv
ey a
nd
mon
itor
ing
Hab
itat
pr
otec
tion
an
d re
stor
atio
nPe
st a
nd
wee
d co
ntro
l
Popu
lati
on
man
ipul
ati
on Capt
ive
man
agem
ent Re
sear
ch
Mammals Broad-toothed ratBrush-tailed phascogaleBrush-tailed rock-wallabyEastern horseshoe batGreater gliderGrey-headed flying-foxLeadbeater's possumLong-footed potorooLong-nosed potorooSmoky mouseSpot-tailed quollSquirrel gliderSwamp antechinusWhite-footed dunnartYellow-bellied gliderYellow-bellied sheathtail
107
Common name
Com
mun
ity
enga
gem
ent Po
licy
and
plan
ning
Surv
ey a
nd
mon
itor
ing
Hab
itat
pr
otec
tion
an
d re
stor
atio
nPe
st a
nd
wee
d co
ntro
l
Popu
lati
on
man
ipul
ati
on Capt
ive
man
agem
ent Re
sear
ch
batBirdsBarking owlBrown treecreeperChestnut-rumped heathwrenGlossy black-cockatooGrey goshawkHelmeted honeyeaterHooded robinMasked owlPowerful owlRegent honeyeaterSooty owlSpeckled warblerSpotted quail-thrushSquare-tailed kiteSwift parrotTurquoise parrotWhite-bellied sea-eagleReptilesAlpine bog skink Eastern she-oak skinkLace monitorRosenberg's goannaSwamp skinkAmphibiansBaw Baw frogBooroolong tree frogBrown toadletGiant burrowing frogGreen and golden bell frogLarge brown tree frog
108

Common name
Com
mun
ity
enga
gem
ent Po
licy
and
plan
ning
Surv
ey a
nd
mon
itor
ing
Hab
itat
pr
otec
tion
an
d re
stor
atio
nPe
st a
nd
wee
d co
ntro
l
Popu
lati
on
man
ipul
ati
on Capt
ive
man
agem
ent Re
sear
ch
Martin's toadletSouthern toadletSpotted tree frogFishAustralian graylingBarred galaxiasCox's gudgeonDwarf galaxiasEmpire gudgeonFlat-headed galaxiasMacquarie perchMurray codTrout codInvertebratesOrbost spiny crayPlantsBaw Baw berryBlackfellow's hempBrown guinea-flowerColquhoun grevilleaEastern pomaderrisElegant daisyForest geebungForest phebaliumForest sedgeGippsland stringybarkGully grevilleaLeafless pink-bellsOutcrop guinea-flowerOval fork-fernOval-leaf grevilleaSandfly zieriaSerpent heath
109
Common name
Com
mun
ity
enga
gem
ent Po
licy
and
plan
ning
Surv
ey a
nd
mon
itor
ing
Hab
itat
pr
otec
tion
an
d re
stor
atio
nPe
st a
nd
wee
d co
ntro
l
Popu
lati
on
man
ipul
ati
on Capt
ive
man
agem
ent Re
sear
ch
Slender fork-fernSmall fork-fernSmooth geebungTall asteliaTasmanian wax-flowerToothed leionemaTree geebungUpright pomaderrisVeined pomaderrisVelvety geebung
Note: Yellow cells denote minor activity – routine or ad hoc. Green cells denote substantial activity – targeted or sustained. Blank cells denote no activity.
110

Indicator 1.3b: Native forest and plantations of indigenous timber species which have genetic resource conservation mechanisms in place
Mountain Ash (Eucalyptus regnans) and Alpine Ash (E. delegatensis) forests are at risk of regeneration failure and forest type conversion following bushfires. Forests most at risk are those younger than seed-bearing age (20 years) because they lack their own seed and cannot self-regenerate. This is an increasing class of forest in Victoria due to frequent bushfires in the past 15 years.This risk was acknowledged in June 2018 by the Victorian Auditor-General’s Office (VAGO). In their published follow-up of selected 2012–13 and 2013–14 performance audits, they noted, for the audit titled Managing Victoria’s native forest timber resources, that DELWP ‘still has more to do’ including ‘ensuring there is adequate seed supply for forest regeneration’ (VAGO 2018, p. 27). VAGO went on to note that DELWP has ‘increased its stores of ash seed to close to four tonnes but estimates that it needs 12 tonnes to assist in future fire recovery works’ (ibid., p. 35). In response, DELWP has committed to improve its management of seed policy and seed stores and has established a Statewide Seed Coordination Group under the Forest Fire Operations Division. The aim of this group is to drive improvement in strategic seed management through coordinated liaison with relevant stakeholders and agencies such as VicForests and Parks Victoria. The Management Standards and Procedures for timber harvesting operations in Victorian State forests 2014 defines the protocol for seed collection to support regeneration following timber harvesting. A number of provisions relate to the maintenance of genetic resources. These include (but are not limited to) the following:
9.1.3.1 Prioritise seed collection from within areas available for timber harvesting operations.9.1.3.2 Ensure large hollow‐bearing trees and habitat trees retained during previous timber harvesting operations are not felled for seed collection.9.1.3.3 Collect seed from stands that show no evidence of hybridisation and have experienced a widespread and preferably heavy flowering in which trees with good crops are close together.9.1.3.4 Collect seed only from stands of natural origin or artificially regenerated stands of satisfactory genetic status in which the full, original gene pool of the population is represented. Stands regenerated from seed trees are regarded as of natural origin for seed collection purposes.9.1.3.5 Prioritise using seed collected from the coupe; i.e., regenerate with seed fall from retained trees and/or logging slash, or sow the coupe with seed collected from that coupe. Otherwise, prioritise using seed that meets the following criteria:
(a) the collection site is within 25 km of the coupe to be sown;
111
(b) the mid‐elevation of the collection site is within 350 m above to 150 m below the mid‐elevation of the coupe to be sown;
(c) for slopes >10 ° the collection and sowing sites have similar aspect (separate between ‘drier' aspects (W, NW, N, NE) and ‘moister’ aspects (SW, S, SE, E); and
(d) the collection and sowing sites are of similar soil type and parent material.
9.1.3.6 Where seed quantities within areas available for timber harvesting operations are inadequate to meet regeneration requirements, application may be made to the Minister or delegate to collect seed from standing trees within areas excluded from timber harvesting operations in accordance with section 1.4 and clauses 9.1.3.7 to 9.1.3.10.(Victorian Department of Environment and Primary Industries [DEPI] 2014b, pp. 64–5)
Seed harvests (Table 16) fluctuate depending on environmental factors associated with seed availability. Seed usage remains fairly constant, but collection peaks in times of better seed availability. When there are good crops available it is possible to collect enough to compensate for times of poorer availability. Eucalypts tend to only flower heavily about once every five years or so, with much lighter flowering and consequently poorer seed crops in between.Table 16: Seed harvest
Year
Seed harvest
(kg)2010–11 6,1742011–12 4,4572012–13 1,5262013–14 1,1922014–15 1,3802015–16 4,3172016–17 1,378
Data from VicForests.
The following table details the location of DELWP’s seed holdings for eastern regions as at end of September 2018. A summary of quantity and numbers of stored seed-lots are given, including specific reference to Alpine Ash (AA) and Mountain Ash (MA).
112

Table 17: DELWP’s seed holdings, eastern regions, September 2018
DELWP’s current Ash seed holdings are 2.1 tonnes MA and 1.9 tonnes AA = 4.0 tonnes total.
DELWP’s proposed Ash seed storage target of 14 tonnes = Milestone 2 + 2 additional tonnes.
Stocks of Messmate, Shining Gum and Cut-tail are required, and current stocks are insufficient.
Seed is stored at three locations. Laverton and Mansfield are the high-quality storage facilities.
VicForests’ current Ash seed holdings are 2.1 tonnes MA and 4.5 tonnes AA = 6.6 tonnes total.
Total Victorian Ash current seed stocks = 4.0 + 6.6 = 10.6 tonnes, approaching Milestone 2.
For non-Ash species, it is recommended DELWP maintains a store of 500 kilograms Messmate, and 200 kilograms each of Shining Gum, Errinundra Shining Gum and Cut-tail.
113