€¦ · web viewthe influence of vehicular obstacles on longitudinal ventilation control in...
TRANSCRIPT

FIRE SAFETY JOURNAL
THE INFLUENCE OF VEHICULAR OBSTACLES ON LONGITUDINAL VENTILATION CONTROL IN TUNNEL FIRES
W. Ulises Rojas Alva, Grunde Jomaas, Anne S. Dederichs Civil Engineering Department, Technical University of Denmark, Denmark
KEYWORDSVehicular blockage, critical velocity, longitudinal velocity, confinement velocity, backlayering distance, dimensionless heat release rate regimes
ABSTRACT
The effect of the vehicular blockage in a tunnel under longitudinal ventilation smoke control was systematically studied using a small-scale tunnel (1:30 of a standard tunnel section) with a helium-air mixture as the buoyant plume. The experimental results showed excellent agreement with full-scale data and reference correlations from former studies. When there are vehicular obstacles in the tunnel, the critical velocity decreased as a function of the blockage ratio. Notwithstanding, it was found that the relative size of the vehicular obstacle and the relative location of the fire source can have a reversed effect, inasmuch as the presence vehicular obstacle exerted an influence on the critical and confinement velocities. Moreover, the backlayering distance was evidently affected by the vehicular blockage. A parallel analysis was carried out for the backlayering distance for lower and upper regimes of the dimensionless heat release rate, where the current data was compared against data from other studies. The method and experimental set-up proved their ability to reproduce several phenomena and thus also their capability to supply relevant and valuable information on the effect of the vehicular blockage on tunnel fire dynamics.
NOMENCLATURE
A Cross section area of the tunnel [m2 ] qheSmoke volume flow rate of helium [l/min]
ALocalLocal area of the vehicular blockage [m2 ]
qs Smoke volume flow rate [ m3 /s]
Cp Specific heat capacity of air [J/kgK] T0 Ambient temperature [K]g Gravitational acceleration [ m2 / s¿ Ts Smoke temperature [K]
H Tunnel height [m ] ∆T Temperature difference between the hot gases and the surrounding air [K]
Δ Hc Heat of combustion [J/kg] Vc Critical velocity [m/s]
k Dimensionless coefficient Vc*
Dimensionless critical velocity [-]L Scale relationship V Longitudinal ventilation velocity [m/s]
L Thermal-densimetric scale relationship V* Dimensionless longitudinal ventilation velocity [-]
l Backlayering distance [m] Vctr* Dimensionless critical velocity with
vehicular blockage [-]l* Dimensionless backlayering distance [-] V**
Confinement velocity [-]
l tr* Dimensionless backlayering distance in
tunnel with vehicular blockage [-] Vtr** Confinement velocity with vehicular
blockage [-]m Mass burning rate [kg/ m2 /s] Vb
**Obstructed velocity [-]
Q Heat release rate [kW ] X air Mass fraction rate of air [%]
Qc Convective heat release rate [kW ] X heMass fraction rate of helium [%]
qair Smoke volume flow rate of air [l/min]Greek symbols Subscripts
∆ρ Temperature difference between the hot gases and the surrounding air
❑m Model scale
ρair Air density [kg/ m3] ❑f Full scale
ρhe Helium density [kg/ m3] ❑th Thermal similarity
φ Tunnel blockage ratio ❑ρ Densimetric similarity
Abbreviations
HGV Heavy Goods Vehicles HRR Heat Release Rate [kW or MW]
PIARC Permanent International Association of Road Congresses

1. INTRODUCTIONThe fact that the gases in the smoke pose a major hazard for people present in the tunnel during a fire has unfortunately been confirmed by several relatively recent fire disasters [1–4]. Hence, any potential smoke in a tunnel is nowadays controlled either by transversal or longitudinal smoke control systems, with the latter being most amply implemented, or by a combination of both smoke control schemes [5]. During a fire incident in a tunnel, the combustion process from the fire source will promptly create a buoyant plume of hot smoke that will impinge the tunnel’s ceiling and then the smoke will eventually travel downstream and upstream from the fire source. Under these conditions, the longitudinal ventilation system is triggered by activating jet fans that will push the smoke with a specific “longitudinal velocity” in one direction towards one of the tunnel´s downstream portals for the purpose of restraining the smoke from traveling upstream of the fire source. For a certain longitudinal velocity, there is a corresponding extent of the upstream smoke that is termed as the “backlayering distance” or “backlayering length”. When the backlayering distance disappears, the applied longitudinal air flow from the smoke control system is said to have achieved the “critical velocity”. Consequently, the upstream side of the tunnel (from the fire source) remains free of smoke and hereby tenable criteria are met for occupants in this part of the tunnel.
Nonetheless, once the longitudinal system is activated and provides the corresponding longitudinal air flow to create the critical velocity, a large amount of oxygen is driven to the fire source, and consequently the fire will be more severe. Moreover, the high air velocities will have an impact downstream from the fire source, inasmuch as highly turbulent flows will provoke a non-stratified smoke layer. Hence, it has the potential to jeopardise tunnel occupants located downstream from the fire source [6]. Such a threat can be reduced by reducing the critical velocity to certain longitudinal velocity that allows the backlayering distance to travel a certain distance upwards, and at the same time smoke stratification is ensured downstream from the fire source. This longitudinal velocity is termed the “confinement velocity” [6,7].
Many large-scale fire tests have been performed [4,8], but these are rather expensive and demand a vast amount of resources. Furthermore, given the sheer size of these tests, it is often very difficult to study several parameters systematically and separately. On the contrary, the provided data by these full-scale tests is essential for researchers as a basis for validation. Small-scale tests can solve the latter issues and can also provide valuable information by taking into account the disadvantages of this method. For example, the thermal approach is often used and poses some advantages such as repeatability and the allowance for the use of a wide range of scenarios. As a result, isothermal aeraulic models (using air and helium mixture) have become a useful method for that purpose.
The critical velocity has been studied extensively [7,9–24] using thermal scaling methods, mainly Froude modelling, as well as by means of large-scale tests. As a result, several formulae have been proposed in order to quantify the critical velocity. On the contrary, the backlayering distance has been reported to a lesser extent [6,7,9,25,26]. Furthermore, a large part of the previous studies did
1

not consider the presence of vehicular obstacles in the proximity of the fire source, or the tunnel was simply tested without the presence of vehicles. As such, few studies have been carried out with the purpose of understanding and systematically quantifying the possible effect of vehicular blockage on the tunnel fire characteristics and the longitudinal smoke control system. That is, there is a lack of studies of the critical velocity, backlayering distance and its corresponding longitudinal velocity or confinement velocity [13,19,27,28].
The critical velocity has been demonstrated to have side effects on the tunnel fire dynamics when considered as a safety “parameter”. In recent studies, the ventilation can increase the severity of the fire at critical conditions [4,29–31]. The problem of applying critical velocity lies more on the ventilation strategies that should be defined for each particular tunnel. However, the critical velocity as such cannot be entirely dismissed, because it still could be applicable for certain scenarios. This discussion however is beyond the scope of this study and it deals more with ventilation strategies for each case. The critical velocity should be treated along with the longitudinal velocity when certain backlayering distance is allowed; both parameters are associated and depend on the ventilation system. Thus, both are necessary to fully understand the tunnel fire dynamics and the behaviour of the backlayering distance and its quantification.
The current study was conducted in order to increase the knowledge in relation to the backlayering distance and the effect of the vehicular blockage on the longitudinal ventilation system. Therefore, several experiments were carried out in a model tunnel (scale 1:30) using the air-helium technique developed by Vauquelin and Mégret [32–34] to study the effect of vehicular blockage under several scenarios taking into account different tunnel sections, several blockage ratios, various heat release rates, and the relative position of the fire source with regard to the vehicular blockage position.
2. BACKGROUNDThomas [9] carried out the first study to quantify the critical velocity and the backlayering distance, where he studied the motion of a buoyant flow created by a fire. Several experiments were conducted at 1:40 scale in a 90x90 cm wind tunnel. According to the experimental results, a minimum air velocity was necessary to restrict the buoyant flows (backlayering distance) upstream from the fire source. This velocity, labelled as the critical velocity, was found to be correlated to one third power of the heat release rate. He proposed a new correlation for the critical velocity:
Vc =k (g Q c
ρ0 Cp T0 )13 (1)
Here k is a coefficient that was found to be equal to unity, and it is solely applicable for the corresponding experimental rig since it includes the tunnel geometry (area and height). Thomas also suggested that the critical Froude number is equal to unity when equilibrium occurs between the energy from the incoming force air flow and the energy from the buoyant source at critical conditions when there is no backflow. Nonetheless, this assumption has been proven erroneous inasmuch as it has been found that the critical Froude number is a function of the dimensionless
2

heat release rate, something which entails that the critical Froude number is proportional to unity and not a constant value close to unity [6]. He proposed a relation for the dimensionless backlayering distance:
l* = lH
=gHQρ0 Cp T0 V3 A
(2)
Danzinger and Kennedy [12] analysed the ventilation system for a 1.2 kilometre-long vehicular tunnel with a longitudinal control system in the deserted Glenwood Canyon Tunnel. The following correlation for the critical velocity was drawn based on their experimental results:
Vc =(gHQ4.5ρ0Cp AT )
1 /3
(3)
Where:
T=(QCpρ0 A Vc )+ T0 (4)
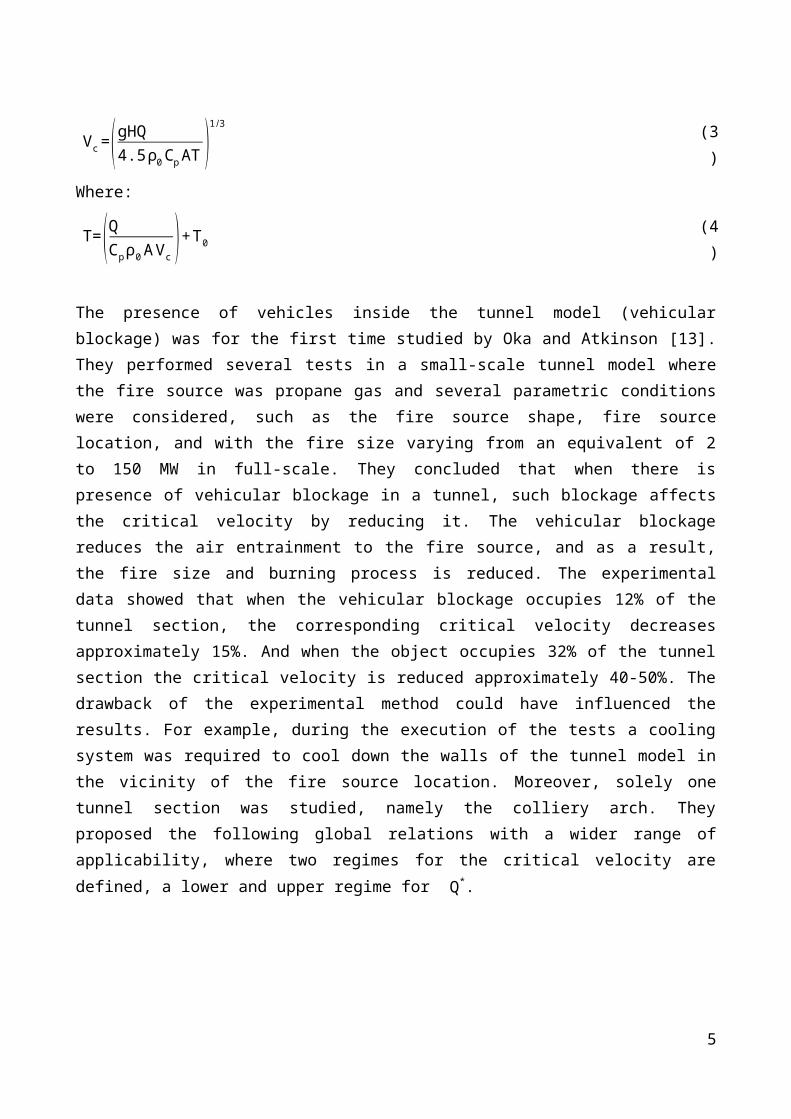
The presence of vehicles inside the tunnel model (vehicular blockage) was for the first time studied by Oka and Atkinson [13]. They performed several tests in a small-scale tunnel model where the fire source was propane gas and several parametric conditions were considered, such as the fire source shape, fire source location, and with the fire size varying from an equivalent of 2 to 150 MW in full-scale. They concluded that when there is presence of vehicular blockage in a tunnel, such blockage affects the critical velocity by reducing it. The vehicular blockage reduces the air entrainment to the fire source, and as a result, the fire size and burning process is reduced. The experimental data showed that when the vehicular blockage occupies 12% of the tunnel section, the corresponding critical velocity decreases approximately 15%. And when the object occupies 32% of the tunnel section the critical velocity is reduced approximately 40-50%. The drawback of the experimental method could have influenced the results. For example, during the execution of the tests a cooling system was required to cool down the walls of the tunnel model in the vicinity of the fire source location. Moreover, solely one tunnel section was studied, namely the colliery arch. They proposed the following global relations with a wider range of applicability, where two regimes for the critical velocity are defined, a lower and upper regime for Q*.
Vc*{= 0.35 (Q*/0.12 )1 /3 , Q* ≤ 0.12
= 0.35, Q* > 0.12 (5)
Here Q* and Vc* are the dimensionless variables for the heat release rate and for the critical velocity,
respectively, and defined as follows:
3
Q* =Q
ρ0Cp T0g12 H
52
(6)
Vc*=
V c
√gH(7)
Based on a physical analysis and several semi-empirical models Kunsch [15] established a global analytical correlation along with a set of formulae that estimates the critical velocity. He suggested that the critical velocity mainly depends on the heat release rate and the tunnel height, and also found that the critical velocity does not depend on the HRR for large heat release rates. In this regime, the velocity is considered to be a “supercritical velocity”, or it can be identified with the upper Q* regime in equation (5).
The term “confinement velocity” was firstly proposed by Vauquelin and Telle [7] and is the induced longitudinal velocity in a tunnel due to the smoke extraction by means of the extraction vents located at the ceiling level (transversal ventilation system). The confinement velocity was then defined when the backlayering distance is less than 4 times the tunnel height upstream at the extraction vent.
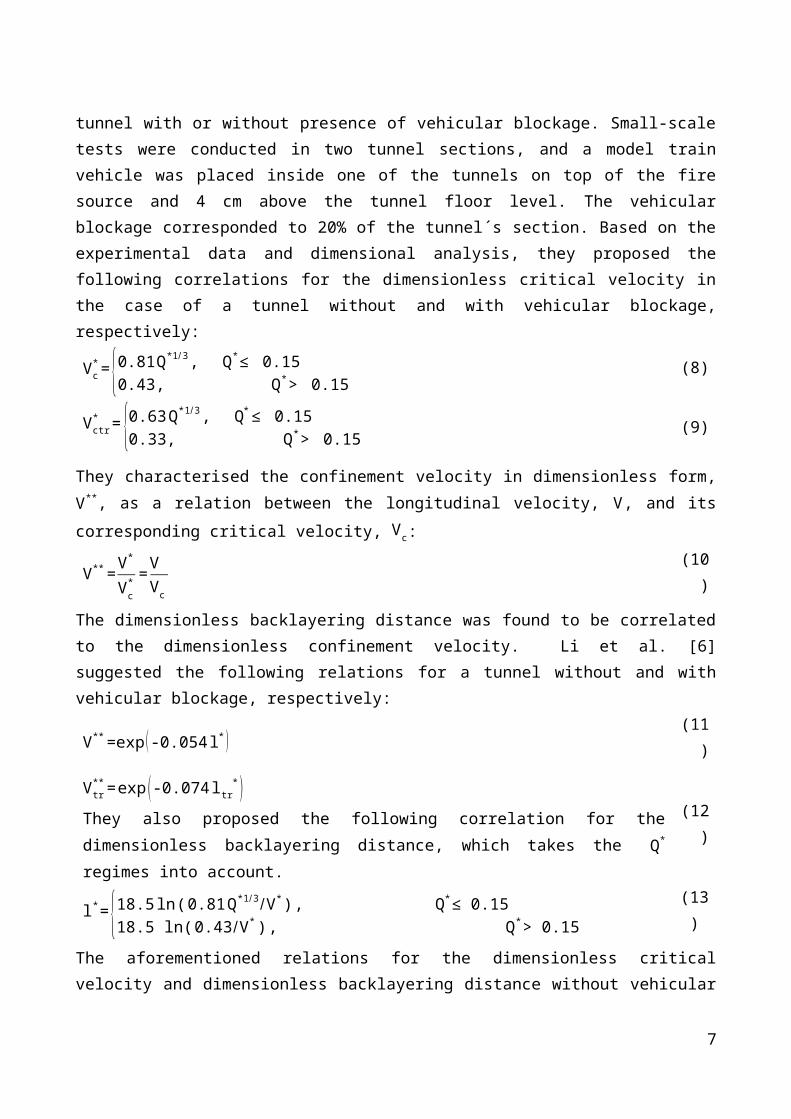
Li et al. [6] redefined the confinement velocity for longitudinal ventilation systems. They carried out an experimental and theoretical analysis in order to investigate the critical velocity, backlayering distance and confinement velocity in a tunnel with or without presence of vehicular blockage. Small-scale tests were conducted in two tunnel sections, and a model train vehicle was placed inside one of the tunnels on top of the fire source and 4 cm above the tunnel floor level. The vehicular blockage corresponded to 20% of the tunnel´s section. Based on the experimental data and dimensional analysis, they proposed the following correlations for the dimensionless critical velocity in the case of a tunnel without and with vehicular blockage, respectively:
Vc*= {0.81Q*1 /3 , Q* ≤ 0.15
0.43, Q* > 0.15(8)
Vctr* = {0.63Q*1 /3 , Q* ≤ 0.15
0.33, Q* > 0.15(9)
They characterised the confinement velocity in dimensionless form, V**, as a relation between the longitudinal velocity, V, and its corresponding critical velocity, Vc:
V**= V*
V c* = V
V c
(10)
The dimensionless backlayering distance was found to be correlated to the dimensionless confinement velocity. Li et al. [6] suggested the following relations for a tunnel without and with vehicular blockage, respectively:
4
V**=exp (-0.054 l* ) (11)
Vtr**= exp (-0.074 ltr
* )They also proposed the following correlation for the dimensionless backlayering distance, which takes the Q* regimes into account.
(12)
l* = {18.5 ln (0.81 Q*1 /3/V *) , Q *≤ 0.15 18.5 ln( 0.43/ V*) , Q* > 0.15
(13)
The aforementioned relations for the dimensionless critical velocity and dimensionless backlayering distance without vehicular blockage were found to be in good agreement with full-scale experimental data. For example, for the presence of vehicular blockage, the results are similar to the experimental data of Oka and Atkinson with respect to the critical velocity [13]. They concluded that the presence of vehicular blockage to some extent affects both the critical velocity and the backlayering distance, although there are no full-scale data for backlayering distance in tunnels with vehicular blockage. In addition, the proposed relations for tunnels with vehicular blockage are based solely on one tunnel section and one model for vehicle blocking.
Ingason and Li carried out 12 fire tests with wood cribs as the fire source to simulate HGV fire loads (high HRR) in a 12 meter long model tunnel (at 1:23 scale) with a longitudinal ventilation system [23]. Several parameters were analysed, and the following correlation was proposed for the backlayering distance:
l* =17.3 ln (0.4 /V* ) (14)
This correlation is similar to equation (13) for the upper regime (Q* > 0.15).
Li et al. conducted a numerical analysis using FDS version 5.5 [27] in order to study the effect of vehicular blockage on the critical velocity in tunnel under longitudinal smoke control. The tunnel case was similar to the tunnel model used in an earlier work [21], with the exception that the fire source was located on top of the tunnel model. They introduced the tunnel blockage ratio, φ, as the ratio of the cross-sectional area of the fire source or vehicular blockage to the cross-sectional area of the tunnel. Hence, the tunnel’s local open area becomes:
Alocal =A (1-φ ) (15)
Based on the numerical and small-scale data, the following correlation was suggested for the dimensionless critical velocity, where the effect of the blockage ratio is included.Vctr = V c (1-φ) (16)
The FDS results showed a ±15% relative error for the critical velocity when compared with the empirical data from former small-scale results. Another similar study by Lee and Tsai found the same correlation [28]. They performed small-scale tests and numerical simulations in order to investigate the effects of vehicular obstacles on the tunnel fire dynamics in a tunnel longitudinally ventilated. The study was parametric-based, where the scenarios encompassed two tunnel cross sections, three vehicular blockage models into two or three arrays. The vehicular blockage ranged
5
from 5 to 31%, and two relative fire source locations with respect to the vehicular obstruction. The fire source was simulated using small gasoline pool fires placed in pans and the fire source varied from fires that correspondingly range from 5 to 10 MW in full-scale. Based on their experimental data, they concluded that the critical velocity is affected by the vehicular blockage in the same range as the vehicular blockage. Still, they observed that the relative position of the fire source can have the opposite effect. Owing to lack of further analysis, the data obtained by Lee and Tsai [28], Ingason and Li [23,35] and the Runehamar experiments [4,36] are analysed further herein, and compared and contrasted with the new experimental results.
3. METHODOLOGYThe theoretical method for the experiments is explained in this sections followed by the experimental procedure.3.1. TheoryIn order to recreate the different phenomena and parameters from a full-scale tunnel fire to a densimetric small-scale fire, three main stages are undertaken. First, a collection of formulae based on a semi-empirical model is used to quantify the involved parameter from a full-scale tunnel fire [33]. Second, two groups of scaling principles based on physical analogies that are dynamic similarities and thermal to densimetric similarities [34], see Figure 1. And finally, the equivalence between a thermal smoke flow rate and a gas densimetric buoyant mixture of helium-air [32].
Figure 1 – Principle of the two step-scaling used for the current study [32,37].
For any given fire occurring in a tunnel, certain physical parameters need to be quantified. Therefore, a semi-empirical model developed by Vauquelin and Mégret [33] to evaluate tunnel fire characteristics is used. The model was validated against PIARC data regarding the smoke flow rate as a function of the heat release rate up to 100 MW. For larger values of HRR, it seems that the semi-empirical model overestimates slightly the reference data. The semi-empirical model is thoroughly explained in the corresponding publication; however, a brief description with a slight modification is introduced herein. The semi-empirical model is based on heptane pool fires, see Figure 2. The diameter of the pool is the baseline parameter of the model and defines the size of the tunnel fire and other implied
6
parameters. For a given pool diameter, the mass burning rate can then be estimated, and also the heat release rate and its convective part, assuming that 70 % is convective heat. The air entrainment ratio is the amount of entrained air by natural convection to the stoichiometric proportion of air necessary to the complete combustion. And only the air entrainment ratio at the tunnel ceiling level is considered. No air entrainment is taken into account along the tunnel height, since this dimension is relatively small compared to the tunnel´s length. And finally, the smoke temperature and smoke flow rate can be estimated, which are the main parameters for the next and last stage.
Figure 2 – Heptane pool model diagram, modified from [33].
The dynamic similarities are based on most widely used Froude scaling, the scaling of the flow equations implies the conservation of the three non-dimensional groups [32,37], referred as: the Reynolds number, the Froude number and the Prandtl number. The first can be difficult to preserve but if kept sufficiently high can assure a minimum turbulent flow, and it is the ratio of inertial force to viscosity forces. The second has to be preserved in order to reproduce effectively the buoyancy phenomenon and the smoke stratification, and it is the ratio of inertial forces to buoyancy forces. And the third is always preserved owing to its independence from the tunnel geometry, and is the ratio of thermal to motion diffusivity. Vauquelin and Mégret [16,33] established a thermal to densimetric analogy to describe the analogue characteristics between a thermal plume and densimetric buoyant plume (light mixture jet of air and helium). As a result, a second group of similarities are drawn. A thermal plume is generated by the overheating of the fluid particles into the flame at temperature T=T0+∆T , issued at the thermal velocity Vth. In contrast, in the densimetric plume the corresponding flow is simulated at ambient temperature, T0, where the flow depends on the relative density difference ∆ρ /ρ and the injection velocity Vρ. The non-dimensional groups must be ensured as in the previous dynamic similarity. In this case, the Reynolds number and densimetric Froude number are preserved, and the preservation of the Prandtl number (thermal plume) is identified with the Schmidt number in terms of diffusivity (densimetric plume). A link was introduced between the thermal and densimetric plumes [32,37], namely the length ratio L. The scaling relationships for both analogies are listed in Table 1.
7

Table 1 – Scaling relationships for both analogies.
Unit typeScaling relations Equation
numberPhysical analogy
Thermal/densimetric analogy
Length ratio [m] L=Lm
LfL =
Lth
Lρ(17), (18)
Velocity [m/s]Vm
Vf= L1 /2 uρ
u th=L (19), (20)
Flow rate [m3/s]qm
q f=L5 /2 qρ
q th=1
L(21), (22)
Densimetric/thermal relation
∆ρρ
=∆TT0
∆ρρ
=L3 ∆TT0
(23), (24)
Heat release rate [MW]
Qm
Qf= L5/2 (25)
The two dimensionless factors, L and L, can allow a mathematical link between the thermal and the densimetric flows. As reported by Vauquelin and Mégret, the geometric scale ratio is without difficulty implemented, but the length ratio L is of major interest inasmuch as it allows simulating a real fire with densimetric gas mixture of helium and air, and it requires changes in the geometrical scale. However, the length ratio L can be taken as the unity in the case the rise temperature is the same during the execution of the experiments.Once the smoke flow rate in reduced scale is estimated, this can be converted into the densimetric model by applying the corresponding helium and air mass fractions. These fractions define the proportion of the respective flow to ensure a total flow rate that can effectively reproduce a hot buoyant plume into a densimetric buoyant mixture. The corresponding mass fractions relations for helium and air are, respectively:
{X he=ρair
ρair -ρhe
∆TT0 +∆T
Xair =1- Xhe (26)
Lastly, the corresponding helium and air volume flows rates can be estimated by the following equations:
{qhe = Xhe qm
qair = Xair qm(27)
Limitations of the model approach and assumptionsHeat losses are relevant with regard to the backlayering distance. In a tunnel fire the heat conduction varies with the different stages of a fire, the fire size, the zone relative to the fire size and the tunnel geometry. For a small fire, convective heat transfer dominates. The radiative heat transfer is dominant in the vicinity of the fire source for relevant fires. Furthermore, the conductive
8
heat transfer plays a significant role in the total heat transfer from the hot gases to the tunnel wall, and as the fire develops the conductive heat transfer increases. The total heat transfer varies along the tunnel, and it is greater close to the fire source and smaller far away from the fire, since ceiling gas temperature decreases with distance [4]. In the paper, for the backlayering distance, small fires were studied ranging from 0.42 to 5.3 MW in full-scale. This also implies that the omission of radiative losses had very limited consequences for the relative small fires. The isothermal model cannot reproduce identically the thermal phenomena from a full-scale fire size; nonetheless, the model has a good physical approach to model the dynamics of the flow [34]. In the case of smoke control, the most relevant aspect is the accurate reproduction of the inertial and buoyant forces [17].
It is assumed that by not taking into account the heat losses, which are inherent to the tunnel geometry and the fire size, both the critical velocity and backlayering distance estimates lie within a conservative side since it represents the worst case in terms of buoyancy strength [38,39]. The buoyant jet simulates the flow rate and buoyancy when the fire plume has reached the tunnel height. Hence the backlayering distance has a higher static pressure difference or buoyancy than in non-isothermal scenarios. As a consequence, the results are expected to be conservative.
3.2. Experimental procedureThe experimental set-up was designed to allow the reproduction of a full-scale smoke fire by releasing a buoyant source (air-helium mixture) into a scaled model tunnel, where the simulated smoke fire was controlled longitudinally. In addition, it was possible to characterise and measure the involved phenomena. The experimental rig consists of a 4.65 m long tunnel model and a longitudinal smoke system that enables the visualisation of the buoyant jet, a great modularity of the tunnel section, a wide variety of heat release rates, the presence of vehicular blockage, and, finally, the repeatability of the tests. The modular tunnel section was achieved by allowing the position of the tunnel´s ceiling and wall to be adjusted. Therefore, several tunnel sections can be achieved (see Figure 3), where the movable parts (c) and (d) are made of transparent Plexiglas that allows the measurement of the backlayering distance. The other tunnel´s wall (a) and the floor (b) are made of wooden. Several wooden traps (e) with different diameter sources were tailored, since the heptane pool model requires several sources of injection to allow a wide range of heat release rates.
9

Figure 3 – Model tunnel cross section and the principle for the modular geometry.
The buoyant jet is a mixture of helium and air gases which are provided at different flow rates, depending on the heptane pool fire size, from 50 l gas cylinders and regulated through Bronkhorst mass flow controllers. The mass flow controller for air has a flow range from 4.4 to 220 l/min and for helium has a range from 10.8 to 540 l/min. A fog generator was used to seed the buoyant mixture in the plenum box, since it was colourless, see Figure 4. The longitudinal ventilation system consisted of an extraction axial fan K100M, with a maximum air flow of 163 m³/h. The fan was located at one end of the tunnel model after the transitional duct and the tranquilisation box. Once the seeded buoyant mixture was released into the tunnel, the axial fan was then activated and the air flow was regulated with a potentiometer. As a result, a wide range of longitudinal air flows were achieved. The critical velocity was achieved by increasing the longitudinal air flow by small steps until the backlayering distance completely disappeared for a period of 5 minutes. In the case of longitudinal velocity, the corresponding backlayering distance was let to travel upstream from the fire source and the air flow was regulated until the backlayering stopped traveling. Then, the distance was measured from the centre of the fire source.Both velocities were determined by measuring the longitudinal air flow at several points of the cross section (in a grid of 5x5 cm), located 0.88 m from the fire source; an average value was then estimated for both velocities. An anemometer Kimo VT100E was used to measure the air velocity.
10

Figure 4 – Schematic of the experimental set-up (not to scale). The tunnel length is 4.65 m.
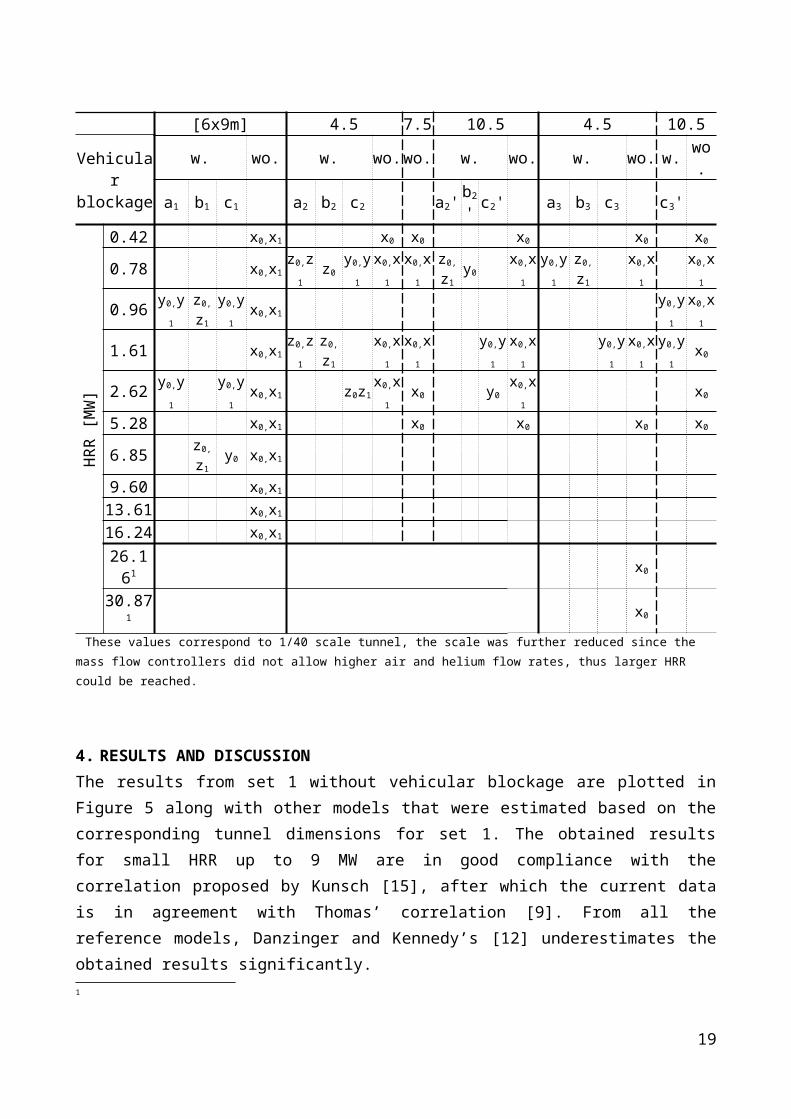
A complete and extensive matrix of all the experiments can be seen in Table 2, which reveals that several HRR were studied, thus simulating a wide range of standard vehicle sizes such as passenger cars and lorries [5]. Further information regarding the air and helium flow gases that correspond to every HRR value can be found in Table A.1 in the appendix. Furthermore, Table 2 is grouped into three main experimental sets. In the first set, the tunnel section dimensions were fixed to a size that corresponds with 9 m width and 6 m height in full-scale. This scenario simulates a standard tunnel section. In the second set, the corresponding non-scaled height was 6 m and the width was variable. And finally, in the last set the height was the varying dimension and the non-scaled equivalent width was fixed to 9 m. The abbreviations “w.” and “wo.” stand for tests with or without presence of vehicular blockage, respectively. The tests without vehicular blockage in first set and the last two HRR in the third set were intended to validate the model and experimental rig against other reference correlations and full-scale test data.
Several blockage ratios were studied and these ranged from 10.3 to 41%, because three types of vehicular blockage were considered with different arrays according to each set and tunnel section. The scaled vehicles represented a standard car (a) with corresponding full-scale dimensions of 1.9 x 1.5 x 1.45 m, a bus (b) with corresponding full-scale dimensions of 2.3 x 3 x 11.4 m, and a train wagon (c) with corresponding full-scale dimensions of 10.3 x 3.7 x 17.4 m. All tunnel sections, along with the different vehicular blockage arrays, can be found in table A.2 in the appendix. All vehicular blockages were located 2 cm before the source of injection.
In Table 2, ‘x0’ means that only critical velocity was measured and ‘x1’ means that the backlayering distance and its corresponding longitudinal velocity were measured. For these tests, the fire source was located in various positions along the tunnel width. In the case of the tests with vehicular
11

blockage, “y” means that the fire source was located behind the vehicular blockage, or in other words, the fire source was partly blocked by the vehicular blockage against the longitudinal ventilation and it is identified as “Obstructed”. When the fire source was placed non-immediately behind the vehicular blockage is identified as “Non-obstructed” or “z” in Table 2. And as in the previous case, subscripts 1 and 2 stand for critical velocity and longitudinal velocity measurements, respectively. For more information, see Figure A.1 in the appendix.
Table 2 – An overview of conducted experiments for several scenarios. The tunnel dimensions, for all sets, are the equivalent heights and widths in full-scale.
Scenarios SET 1 SET 2 SET 3
Dimension Height x Width[6x9m]
Variable Width [m] Variable Height [m]4.5 7.5 10.5 4.5 10.5
Vehicular blockage
w. wo. w. wo. wo. w. wo. w. wo. w. wo.
a1 b1 c1 a2 b2 c2 a2'b2'
c2' a3 b3 c3 c3'
HR
R [M
W]
0.42 x0,x1 x0 x0 x0 x0 x0
0.78 x0,x1 z0,z1 z0 y0,y1 x0,x1 x0,x1 z0,z1 y0 x0,x1 y0,y1 z0,z1 x0,x1 x0,x1
0.96 y0,y1 z0,z1 y0,y1 x0,x1 y0,y1 x0,x1
1.61 x0,x1 z0,z1 z0,z1 x0,x1 x0,x1 y0,y1 x0,x1 y0,y1 x0,x1 y0,y1 x0
2.62 y0,y1 y0,y1 x0,x1 z0z1 x0,x1 x0 y0 x0,x1 x0
5.28 x0,x1 x0 x0 x0 x0
6.85 z0,z1 y0 x0,x1
9.60 x0,x1
13.61 x0,x1
16.24 x0,x1
26.161 x0
30.871 x0
These values correspond to 1/40 scale tunnel, the scale was further reduced since the mass flow controllers did not allow higher air and helium flow rates, thus larger HRR could be reached.
4. RESULTS AND DISCUSSIONThe results from set 1 without vehicular blockage are plotted in Figure 5 along with other models that were estimated based on the corresponding tunnel dimensions for set 1. The obtained results for small HRR up to 9 MW are in good compliance with the correlation proposed by Kunsch [15], after which the current data is in agreement with Thomas’ correlation [9]. From all the reference models, Danzinger and Kennedy’s [12] underestimates the obtained results significantly. Furthermore, the overall results from all sets that correspond to the critical velocity, in the case without vehicular blockage, are plotted in dimensionless form in Figure 6. Also, full-scale data from other studies are plotted. For example, the Memorial fire tunnel tests [4,40], the EUREKA Program [4,14], Buxton Laboratory tests [14], Runehamar tunnel fire tests [4,36], Yuanjiang tunnel tests [41]
1
12

and a reference correlation, see equation (8), proposed by Li et al [6]. The current results are in good compliance with, first the reference correlation, and second the full-scale results. With the latter, the results seem to overestimate slightly the reference correlation, this obeys to the scale technique used for the current experiment. By omitting the thermal losses, the results are conservative, and as a result, the dimensionless critical velocities obtained in this study are higher than those reported by other researchers. Moreover, as other authors have identified two regimes for the critical velocity, the current data comply with both regimes. Most of the current data corresponds to the lower regime (Q* ≤ 0.15), and two data points show slightly the upper regime (Q* > 0.15) as it can be seen in Figure 6.
0 3 6 9 12 15 180.0
1.0
2.0
3.0
4.0
5.0
Current experimentsThomas [9]Oka & Atkinson [13]Danzinger & Kennedy [12]Kunsch [15]
4 >0 : @
Figure 5 – The critical velocity as a function of the HRR in a tunnel without vehicular blockage. Current data (corresponding to set 1) compared to models.
0.001 0.010 0.100 1.000 10.0000.1
1.0
Current experiments Buxton [14]Memorial [4,40] EUREKA [4,14]Runehamar [4,36] Li et al. [6]
Figure 6 – The dimensionless critical velocity as a function of the dimensionless heat release rate. Overall results compared against full-scale data from a reference correlation [22].
It is assumed that both regimes also influence the backlayering distance in a similar manner as for the critical velocity. The current data that correspond to the lower regime is plotted in Figure 7, where the dimensionless backlayering distance is plotted against the ratio of the dimensionless critical velocity to the dimensionless heat release rate. Figure 7 also displays full-scale data from other tests [36,41] and the equation (13) [6], which was used to predict the dimensionless backlayering distance based on the current data and the Yuanjiang tunnel tests data. In the lower regime, the backlayering distance or the smoke layer is mostly dominated by the buoyancy phenomenon, which is dependent on Q*1 /3 from the fire source. As the forced longitudinal air stream is applied, depending on the air velocity, the backlayering distance will stop traveling upstream from the fire source at any point when both forces reach equilibrium. When the forced longitudinal velocity reaches critical condition, the backlayering distance totally disappears. It can
13

be expected that the current data would not fit the reference correlation owing to the limitations of the method. It seems that the reference correlation slightly underestimates the Yuanjiang tunnel tests results. Still, such a correlation is based on only a few tunnel dimensions and it might not entirely be useful for a wider range of scenarios regarding the tunnel geometry.
In the case of the upper Q*regime, data from a study with small-scale thermal experiments, Ingason and Li [23], are plotted in Figure 8, along with full-scale data from Runehamar [36]. In both studies, two logarithmic correlations for the dimensionless backlayering distance were proposed; the two are based on small-scale tests and underestimate the larger values of backlayering distance as it can be seen in Figure 8. In the upper regime, where the high values of Q* are expected, larger flames will impinge the tunnel ceiling and will act as a blockage to the smoke itself and the backlayering distance will become only dependent on the longitudinal velocity, no matter the magnitude of the HRR. This thermal blockage is most likely affected by longitudinal velocity to certain extent where its momentum is strong enough to avoid the backlayering distance travelling upstream. Further studies, in thermal small-scale and large scale, should be carried out in order to find a more suitable correlation for the above correlation for the upper Q*regime.
0 5 10 15 20 25 300.0
0.2
0.4
0.6
0.8
1.0
Current experimentsYuanjiang [41]Runehamar, lower regime [36]
Li et al. [6] )
Figure 7 –The ratio of the dimensionless longitudinal velocity and the cubic root of the dimensionless heat release rate (Lower regime) vs. the dimensionless backlayering distance.
0 5 10 15 200.0
0.2
0.4
0.6
0.8
1.0
Runehamar, upper regime [36]Ingason & Li, data [23]Li et al. Upper regime [6]Inganson & Li, correlation [23]
Oכ
Figure 8 – The dimensionless longitudicnal ventillation velocity as a function of the dimensionless backlayering distance for the upper regime.
The confinement velocity, as a dimensionless concept, is also applicable to understand the longitudinal velocity and its dependency to the backlayering distance. In Figure 9, the corresponding results without vehicular blockage are plotted and for values that correspond to the
14

lower Q* regime, along with the reference correlation (see equation 11), which was suggested by Li et al. [6]. It can be seen that the obtained data follow the same trend as the reference correlation, however, with certain degree of dispersion that can be explained by the experimental set-up. The backlayering distance oscillated ± 5 cm due to the small throw caused by the seeding system. Moreover, the small-scale tunnel used corresponds to 1:30 scale. In other studies, 1:20 and 1:23 scales were used [16,24,34]. In order to effectively reproduce inertial and buoyant forces (conservation of Froude and Richardson numbers and high Reynolds number, the minimum scale should be about 1:30 [17]. With smaller scales, the aforementioned numbers will be hardly preserved and higher degree of dispersion can be expected. In spite the influence of the fluctuations and the scale size, the obtained data is in good compliance with the reference correlation since it shows the same trend. Previously, the critical velocity data showed good agreement.
The presence of vehicular blockage and the placement of the fire source with respect to the vehicular blockage were also considered when the backlayering distance was measured. In this case, the confinement velocity is defined as the ratio of the dimensionless longitudinal velocity in a tunnel with vehicular blockage to the corresponding dimensionless critical velocity in the same tunnel without vehicular blockage, as given by the following relation:
Vtr**= V tr
* / Vc* (30)
The obtained dimensionless backlayering distance data that correspond to several blockage ratios can be seen in as a function of the confinement velocity. In addition, a reference correlation suggested by Li et al. [6] is represented (see equation (12)). As it can be seen, the current data is not in compliance with the reference correlation which might obey to two reasons. First, the current data corresponds to a vehicular blockage ranging from 10.3 to 41 %, whereas the reference correlation corresponds to a vehicular blockage of 20%. Second, the relative location of the fire source for the current data is distinct from the reference correlation. Two fire source locations were considered for this study; “Obstructed,” which means that the fire source was located in front of the vehicular blockage and thus blocked the longitudinal air stream that reached the fire plume, and “Non-obstructed,” which implies that the fire plume is reached along its height by the longitudinal air stream (see Figure A1 in appendix). On the contrary, the reference correlation was obtained based on a train model located 4 cm above the fire source. Hence, the current data cannot be compared against the reference correlation which can be only applicable to similar scenarios in terms of vehicular blockage and fire source location. Nonetheless, this implies that the backlayering distance is affected differently by the vehicular blockage size and by the fire source location with respect to the vehicular blockage. Further small-scale thermal experiments are required to properly quantify the behaviour according to the vehicle size. In Figure 10, one data point appears to be extremely low. This obeys to the limitation of the anemometer which could not measure extremely low air flows.
15

0 1 2 3 4 50.00.20.40.60.81.01.2
Current experimentsLi et al. [6]
Figure 9 – Dimensionless backlayering distance as a function of the confinement velocity for the lower Q* regime.
0 1 2 3 4 5 60.00.20.40.60.81.01.2
Non-obstructedObstructed
Figure 10 – Dimensionless backlayering distance as a function of the confinement velocity in tunnel with vehicular blockage.
The results above discussed are only applicable for the lower regime Q* regime. For the upper regime, data from other study, such as Runehamar [4,36], are plotted in Figure 11 along with a reference correlation from Li et al. [6], see equation (11). The correlation fails to predict the full-scale data. In addition, under the upper regime, the backlayering distance becomes only dependent on the longitudinal velocity which is linked to the confinement velocity. The validity of equation 11 is limited to rather small dimensionless backlayering distances (up to 6).
0 2 4 6 8 10 12 14 16 18 200.00.20.40.60.81.01.2
Runehamar [4,36] Li et al. [6]Li et al., extended [6]
Figure 11 – Dimensionless backlayering distance as a function of the confinement velocity for values of the upper Q* regime.
The experimental data regarding the critical velocity in tunnel with vehicular blockage are plotted in Figure 12 along with data from a similar study with thermal small-scale model, Lee & Tsai [28]. In both figures, the data are plotted as the vehicular blockage ratio (1-φ) as a function of the
16

“obstructed” velocity. This velocity is a ratio between the dimensionless critical velocity in a tunnel with vehicular blockage and the corresponding dimensionless critical velocity in the same tunnel without vehicular blockage. Behind ‘blockage’ this becomes:
Vb**= V ctr
* /V c* (32)
In addition, the graph displays the correlation proposed by Li et al. [27] (see equation (16)). From the figure, it is clear that the corresponding data to the fire source position “obstructed” is not in agreement the reference correlation. On the contrary, the data that corresponds to the fire source position “Non-obstructed” is in compliance with the reference correlation.
When the vehicular blockage is located not directly affecting longitudinal air stream that reaches the fire plume, then the critical velocity decreases proportionally, as the blockage ratio. However, when the fire plume is partly affected by the vehicular blockage, due to its relative size or the relative position of the fire source, the fire plume is partly protected against longitudinal air flow. The tunnel height is then reduced and the smoke quickly infiltrates this zone, see Figure 13. Possibly, the air stream required to prevent the backlayering distance might be higher because the air stream is blocked and thus the required critical velocity will be higher. Nonetheless, this behaviour could also (partly) be affected by another aspect that can favour the smoke to travel upstream, namely the “flow separation” phenomenon or recirculation flow, which can occur when a flow passes an object. Herein, the recirculation zones were not considered, but how this phenomenon would affect the flow dynamic in the vicinity of the vehicular blockage deserves further examination. With the current tunnel model, a PIV system could potentially be used to study the flows formed around the object, but that would be an entirely new study.
In the thermal model, the critical velocity increases since the HRR increases due to enhancement of the feedback from nearby vehicles. However, no enhancement of feedback can occur in the isothermal model since it does not take into consideration the thermal losses. In the isothermal model, the inertial force required to overcome the buoyant gases has to be stronger since the fire plume has been locally protected.
In Lee & Tsai’s work [28] (thermal model), when there is vehicular blockage, the critical velocities increase in some cases up to 20-30%, compared to the respective tunnel without any vehicular obstacle. The largest increases were reported for the case where there were two or three arrays of large vehicles, the fire source was located downstream of the vehicular blockage and the fire source was the larger gasoline pool. The isothermal results show a highest increase of 35% in critical velocity, for the largest vehicular blockage and fire source located downstream from the fire source.
Both approaches suggest that the vehicular blockage affects the critical velocity depending on the fire location with respect to the vehicular blockage. Furthermore, such a coincidence in behaviour from both approaches might suggest that the reduction/increasing of the critical velocity according to the vehicular blockage position with regard to the fire source is strongly influenced by buoyancy
17

forces, in the local area of the vehicular obstruction. However, this conclusion has to be further validated with large-scale experiments.
0.0 0.2 0.4 0.6 0.8 1.00.0
0.2
0.4
0.6
0.8
1.0
1.2
1.4
Obstructed, current experimentsNon-obstructed, current experimentsObstructed, Lee & Tsai [28]Non-obstructed, Lee & Tsai [28]Li et al. (2012) [27]
Figure 12 – Dimensionless critical velocity as a function of 1-φ. Data from experimental results and from Lee and Tsai [28].
Figure 13 – Schematic of tunnel with a vehicular blockage that directly affects the fire
plume.
18

5. CONCLUSIONThe presented method and tunnel model experiments are capable of reproducing several phenomena under a systematic study and can provide valuable semi-quantitative and qualitative information. The buoyancy phenomenon along with inertial forces, the backlayering distance, the critical velocity and the confinement velocity have been reproduced, for low values of Q*(lower regime), due to equipment limitations. For higher Q* values (upper regime), data from other studies have been further analysed in order to fully support this study.
There are two distinct regimes, the lower and upper Q*, for the longitudinal velocity, confinement velocity and for the backlayering distance. In the upper regime, the reference correlation for the confinement velocity was found to underestimate large-scale data. Still, further thermal experiments are recommended in order to find the most appropriate and suitable correlations for both, the dimensionless longitudinal velocity and confinement velocity.
The presence of vehicular blockages inside the tunnel can affect the critical velocity, the longitudinal velocity and the backlayering distance. In the case of the critical velocity, the relationship to the blockage ratio is proportional when the fire plume is directly affected by the longitudinal air stream. Nonetheless, if, owing to the relative position of the fire source and the relative size of the vehicular blockage, the fire plume or buoyant jet might be partly blocked on its way to reach the longitudinal air stream, the critical velocity is higher than in the same case without vehicular blockage. Another plausible explanation is the “flow separation” phenomenon associated with recirculation flow around objects. Such a study would require a substantial undertaking, and was therefore not considered for the current study.
The data concerning the confinement velocity, as a function of the dimensionless backlayering distance in tunnel without vehicular blockage, is in good agreement with a reference correlation proposed by Li et al. [6]. Still, in the case of vehicular blockage, the obtained data do not match the reference correlation proposed by Li et al. [6]. This can be explained by the fact that the reference correlation was proposed for a specific scenario, namely for a 20% vehicular blockage ratio. Herein, several scenarios with different blockage ratios and fire positions were considered, and it was shown that, the vehicular blockage and the relative position of the fire source with respect to vehicular blockage can affect the backlayering distance. Further experiments should be undertaken to fully understand how the backlayering distance is affected.
There is still a lack of knowledge regarding the confinement velocity and longitudinal velocity, and a clear definition of how both Q* regimes influence the aforementioned parameters is also missing. This problem should further be studied in a thermal small-scale model. Moreover, the scaled tunnel model can be further improved to study longer backlayering distances and a wide range of several scenarios, including the effect of the tunnel slope. The results presented herein are limited to the
19

method itself; in other words, the results and conclusions should be carefully treated and not be entirely extrapolated to real-scenarios cases.
ACKNOWLEDGMENTSThe authors would like to acknowledge the help O. Vauquelin and Anders Lönnermark provided during the execution of this study. Thanks also to H. Ingason for his valuable input throughout this study.
BIBLIOGRAPHY[1] Flashback: Kaprun ski train fire, (2004).
http://news.bbc.co.uk/1/hi/world/europe/3502265.stm (accessed August 6, 2014).[2] Land transport accident investigation bureau (BEA-TT), (n.d.). http://www.bea-
tt.equipement.gouv.fr/_affiche_article.php3?id_article=33 (accessed August 6, 2014).[3] A. Lönnermark, On the Characteristics of Fires in Tunnels Doctoral Thesis, Lund University,
2005.[4] H. Ingason, Y.Z. Li, A. Lönnermark, Tunnel Fire Dynamics, 2015th ed., Springer, 2015.
doi:10.1007/978-1-4939-2199-7.[5] PIARC Committee on Road Tunnels, Maitrise des incendies et des fumees dans les tunnels
routiers - Fire and Smoke control in road tunnels, PIARC Committee on Road Tunnels, 1999.[6] Y.Z. Li, B. Lei, H. Ingason, Study of critical velocity and backlayering length in
longitudinally ventilated tunnel fires, Fire Saf. J. 45 (2010) 361–370. doi:10.1016/j.firesaf.2010.07.003.
[7] O. Vauquelin, D. Telle, Definition and experimental evaluation of the smoke “confinement velocity” in tunnel fires, Fire Saf. J. 40 (2005) 320–330. doi:10.1016/j.firesaf.2005.02.004.
[8] A. Beard, R. Carvel, Handbook of tunnel fire safety, 2nd ed., Thomas Teflord Publishing, 2012.
[9] P.H. Thomas, The movement of smoke in horizontal passages against an air flow., Fire Res. Notes 723. (1968).
[10] A.J.M. Heselden, Studies of fire and smoke behaviour relevant to tunnels, in: Second Int. Symp. Aerodyn. Vent. Veh. Tunnels., Cambridge, 1976.
[11] P.L. Hinkley, A preliminary note on the movement of smoke in an enclosed shopping mall, Fire Res. Notes 806. (1970).
[12] N.H. Danzinger, W.D. Kennedy, Longitudinal ventilation analysis for the Glenwood Canyon tunnels, in: Fourrth Int. Symp. Aerodyn. Vent. Veh. Tunnels, BHRA Fluid Engineering., York, U.K., 1982.
[13] Y. Oka, G. T, Atkinson, Control of Smoke flow in Tunnel Fires, 25 (1996) 305–322.[14] Y. Wu, M.Z.A. Bakar, Control of smoke flow in tunnel fires using longitudinal ventilation
systems - a study of the critical velocity, Fire Saf. J. 35 (2000) 363–390. doi:10.1016/S0379-7112(00)00031-X.
[15] J.P. Kunsch, Simple model for control of fire gases in a ventilated tunnel, Fire Saf. J. 37 (2002) 67–81. doi:10.1016/S0379-7112(01)00020-0.
[16] O. Vauquelin, Parametrical study of the back flow occurrence in case of a buoyant release into a rectangular channel, Exp. Therm. Fluid Sci. 29 (2005) 725–731. doi:10.1016/j.expthermflusci.2005.01.002.
[17] O. Vauquelin, Experimental simulations of fire-induced smoke control in tunnels using an “air–helium reduced scale model”: Principle, limitations, results and future, Tunn. Undergr.
20
Sp. Technol. 23 (2008) 171–178. doi:10.1016/j.tust.2007.04.003.[18] O. Vauquelin, Y. Wu, Influence of tunnel width on longitudinal smoke control, Fire Saf. J.
41 (2006) 420–426. doi:10.1016/j.firesaf.2006.02.007.[19] Y.Z. Li, B. Lei, H. Ingason, Theoretical and Experimental Study of Critical Velocity for
Smoke Control in a Tunnel Cross-Passage, Fire Technol. 49 (2010) 435–449. doi:10.1007/s10694-010-0170-0.
[20] H. Ingason, A. Lönnermark, Y.Z. Li, Runehamar Tunnel Fire Tests, BORÅS, Sweden, 2011.[21] H. Ingason, M. Kumm, D. Nilsson, A. Lönnermark, A. Claesson, Y.Z. Li, et al., The Metro
Project, Final Report, Västerås, 2012.[22] H. Ingason, Model scale tunnel fire tests with point extraction ventilation, J. Fire Prot. Eng.
21 (2011) 5–36. doi:10.1177/1042391510394242.[23] H. Ingason, Y. Li, Model scale tunnel fire tests with longitudinal ventilation, BORÅS,
Sweden, 2010. http://www.sciencedirect.com/science/article/pii/S0379711210000664 (accessed March 11, 2014).
[24] H. Ingason, A. Lönnermark, Y.Z. Li, Model of ventilation flows during large tunnel fires, Tunn. Undergr. Sp. Technol. 30 (2012) 64–73. doi:10.1016/j.tust.2012.02.007.
[25] J.P. Vantelon, A. Guelzim, D. Quach, D. Kim Son, D. Gabay, D. Dallest, Investigation of Fire-Induced Smoke Movement in Tunnels and Stations : An Application to the Paris Metro, (1991) 907–918.
[26] P. Deberteix, D. Gabay, D. Blay, Experimental study of fire-induced smoke propagation in a tunnel in the presence of longitudinal ventilation, in: Proceeedings Int. Conf. Tunn. Fires Escape from Tunnels, Washington, 2001: pp. pp. 257–265.
[27] L. Li, X. Cheng, Y. Cui, S. Li, H. Zhang, Effect of blockage ratio on critical velocity in tunnel fires, J. Fire Sci. 30 (2012) 413–427. doi:10.1177/0734904112443508.
[28] Y.-P. Lee, K.-C. Tsai, Effect of vehicular blockage on critical ventilation velocity and tunnel fire behavior in longitudinally ventilated tunnels, Fire Saf. J. 53 (2012) 35–42. doi:10.1016/j.firesaf.2012.06.013.
[29] H. Ingason, A. Lönnermark, Effects of longitudinal ventilation on fire growth and maximum heat release rate, in: S.T.R.I. of Sweden (Ed.), Fourth Int. Symp. Tunn. Saf. Secur., 2010: pp. 395–406.
[30] F. Tarada, New Perspectives on the Critical Velocity for Smoke Control, in: A. Lönnermark, H. Ingason (Eds.), Fourth Int. Symp. Tunn. Saf. Secur., SP Technical Research Institute of Sweden, Frankfurt am Main, Germany, 2010: pp. 419–426.
[31] A. Milford, K. Calder, P. Senez, A. Coles, Computational Study of Tunnel Ventilation Effects on fire development in rapid transit vehicles., in: A. Lönnermark, H. Ingason (Eds.), Sixth Int. Symp. Tunn. Saf. Secur., SP Technical Research Institute of Sweden, Marseille, France, 2014: pp. 381–390.
[32] O. Megret, Etude expérimentale de la propagation des fumées d’incendie en tunnel pour différents systénes de ventilation," PhD Thesis, University of Valencienne, France, 1999.
[33] O. Mégret, O. Vauquelin, A model to evaluate tunnel fire characteristics, Fire Saf. J. 34 (2000) 393–401. doi:10.1016/S0379-7112(00)00010-2.
[34] O. Megret, O. Vauquelin, P. Chasse, A reduced scale tunnel for the study of fire-induced smoke control, in: Proc. 3rd Int. Conf. Saf. Road Rail Tunnels., Nice, France, n.d.: pp. 713–723.
[35] H. Ingason, Model Scale Tunnel Fire Tests Longitudinal ventilation, SP REPORT 2005:49, BORÅS, Sweden, 2005.
[36] H. Ingason, Y.Z. Li, A. Lönnermark, Runehamar tunnel fire tests, Fire Saf. J. 71 (2015) 134–149. doi:10.1016/j.firesaf.2014.11.015.
21

[37] O. Vauquelin, G. Michaux, C. Lucchesi, Scaling laws for a buoyant release used to simulate fire-induced smoke in laboratory experiments, Fire Saf. J. 44 (2009) 665–667. doi:10.1016/j.firesaf.2008.11.001.
[38] F. Colella, G. Rein, R. Borchiellini, J.L. Torero, A Novel Multiscale Methodology for Simulating Tunnel Ventilation Flows During Fires, Fire Technol. 47 (2011) 221–253. doi:10.1007/s10694-010-0144-2.
[39] I. Vermesi, G. Rein, F. Colella, M. Valkvist, Reducing The Computational Requirements for Simulating Tunnel Fires by Combining Multiscale Modelling and Multiple Processor Calculation, Tunn. Undergr. Sp. Technol. (2015) 1–15.
[40] Massachwsetts Highwav Department, Bechtel, P. Brinckerhoff, Memorial Tunnel Fire Ventilation Test Program . Test Report, Massachusetts, 1995.
[41] L.H. Hu, R. Huo, W.K. Chow, Studies on buoyancy-driven back-layering flow in tunnel fires, Exp. Therm. Fluid Sci. 32 (2008) 1468–1483. doi:10.1016/j.expthermflusci.2008.03.005.
22

APPENDIX A
Table A1– Characteristics of the buoyant sources for tunnel with different heights in full scale and their corresponding values in 1/30 scale.
Full-scale values Reduced scale model
Source nr.
D[m]
Q[MW]
Tunnel height 4.5 m.
Tunnel height 6 m.
Tunnel height 10.5
m. D[mm]
Tunnel height 4.5m. Tunnel height 6m. Tunnel height 10.5
Ts
[K]qs
[ m3/s ]Ts
[K]qs
[ m3/s ]Ts
[K]qs
[ m3/s ]X he
qair
[ l /min]qhe
[ l /min]Xhe
qair
[ l /min]qhe
[ l /min]X he
qair
[ l /min]qhe
[ l /min]
1 0.62 0.42 520 1.9 490 2.1 441 2.5 21 0.50 11.6 11.4 0.45 13.7 11.4 0.38 18.9 11.42 0.78 0.78 548 3.3 514 3.6 460 4.3 26 0.53 18.9 21.3 0.49 22.5 21.4 0.41 31.3 21.53 0.84 0.96 558 4.0 522 4.3 466 5.2 28 0.54 22.1 26.0 0.50 26.3 26.1 0.42 36.6 26.24 1.02 1.61 585 6.3 546 6.8 484 8.1 34 0.57 33.0 43.6 0.53 39.4 43.8 0.44 55.0 44.05 1.23 2.62 614 9.8 571 10.6 503 12.5 41 0.60 48.0 71.0 0.55 57.4 71.3 0.47 80.4 71.86 1.62 5.28 662 18.3 612 19.7 534 23.1 54 0.64 81.0 142.1 0.59 97.3 142.8 0.51 137.2 144.07 1.80 6.85 681 23.2 629 24.9 547 29.0 60 0.65 98.1 183.9 0.61 118.0 184.9 0.53 167.0 186.58 2.07 9.6 709 31.4 654 33.7 566 39.1 69 0.67 125.4 257.1 0.63 151.4 258.6 0.55 215.1 261.09 2.40 13.61 741 43.1 681 46.1 587 53.2 80 0.69 160.9 363.2 0.65 194.9 365.6 0.57 278.4 369.310 2.59 16.24 758 50.5 696 53.9 598 62.2 86 0.70 182.2 432.5 0.66 221.2 435.4 0.58 316.7 440.011 2.79 19.24 775 58.9 712 62.8 610 72.2 93 0.71 205.1 511.5 0.67 249.5 515.2 0.59 358.2 520.812 3.20 26.2 809 77.7 80 0.73 123.3 337.513 3.45 30.9 828 90.3 86 0.74 137.9 397.4
23
Table A2 – Overview of the studied tunnel sections with or without vehicular blockage in 1/30 dimensions (in mm).
Height [m] x Width [m] (tunnel set scenario)4.5 x 9 (Set 3) 6 x 9 (Set 1) 6 x 10.5 (Set 2) 10.5 x 9 (Set 3)
6 x 7.5 (Set 2) 6 x 4.5 (Set 2)
24
(a1)
(b1)
(c1)
(a2)
(b2) (b3)
(a2’)❑❑
❑)
(c2’)❑❑
❑)
(b2’)❑❑
❑)
(b3)
(a3)
(c3)
(c3’)
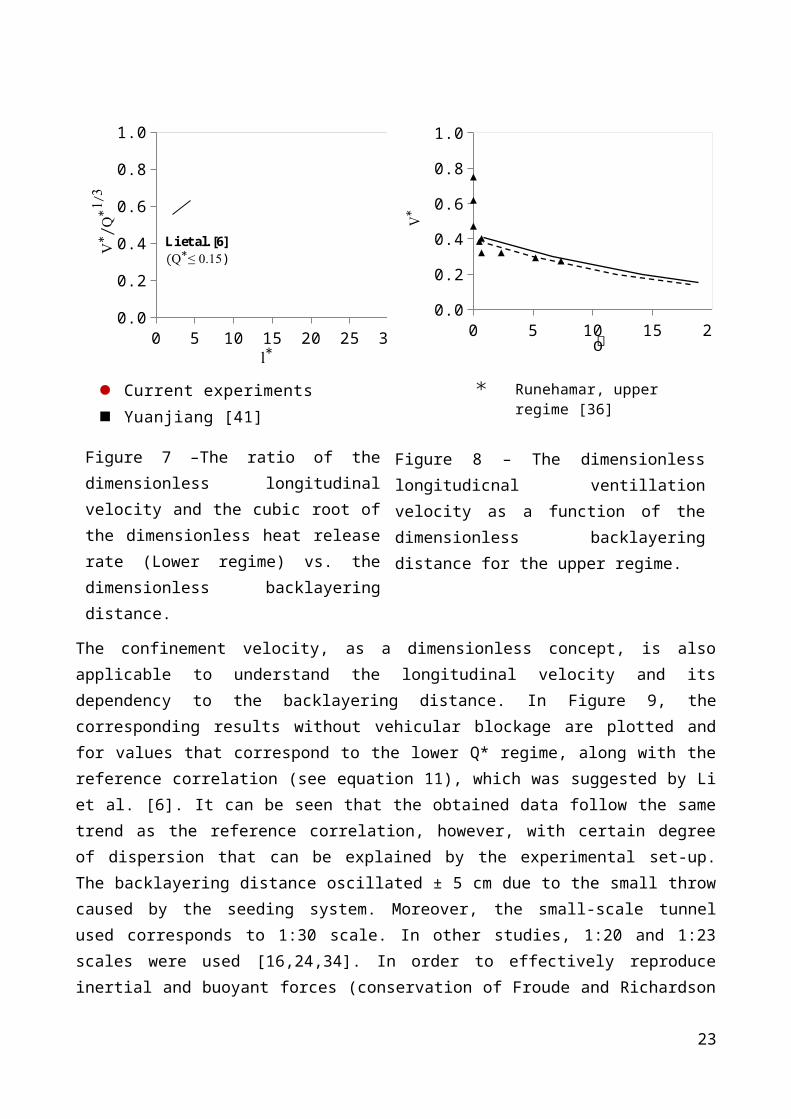
Figure A1 – Fire source locations.
25