needelegation.org · web viewword of the california gold rush had spread around the world,...
TRANSCRIPT

National Economic Education Delegation
Immigration NarrativeDate: May 15, 2023
Instructions to Presenter:
1) This slide deck is intended to be used as:a. A resource for ease of presentation preparation
i. Feel free to use the slides as they are currently assembled, to reduce their number, or to substitute your own w/in the NEED template.
ii. It is vital that the content of the slides not be altered so as to change the nature of the information presented.
1. If you disagree with the content, please feel free to discuss with Jon (NEED’s Executive Director [email protected]). It is entirely possible that a revision is in order.
2. Please do not extend the presentation to content that is not currently included in the slide deck w/o discussing with NEED’s ED. Alternatively, the content can be verbally briefed with the disclaimer mentioned below.
b. An indication of NEED’s statement on the policy issuei. NEED’s statement is not to be put across as an endorsement of any
particular policy, but merely what the economics profession thinks it knows about the policy issue.
2) Statement disclaimera. To the extent that you express views that are not contained in this presentation, it
is very important that you inform the audience the view expressed is your own and not that of NEED.
i. We would like to discourage you from going beyond the slide deck, but understand that it will sometimes be impossible to avoid.
ii. Please try very hard to not be terribly controversial.b. NEED’s slide decks are intended to take the audience to the brink of policy
selection. They are intended to present a common base of understanding in the economics profession.
c. Ethics, morality, and values take you from economics to policy prescription.i. If you make this leap, please be very clear that the view is your own.
Slides:
1. Opening slide
<brief summary and opening>
2. DO NOT DELETE: National Economic Education Delegationa. Brief discussion of what NEED is and NEED doesb. Use your judgement for what should be said.
3. Who we are?a. 44 honorary board – 3 Nobel prize winners, 6 former chairs of council, and 2
former Chairs of the Federal Reserve.b. 364 delegates, one in each state.c. 42 Global Partners
4. Where are we?
5. DO NOT DELETE: Credits and Disclaimer
6. Outline:
7. What is Immigration?
<narrative>
8. Why do People Migrate?
<narrative>
https://www.gilderlehrman.org/content/historical-context-why-do-people-migrate
9. Why do People Migrate?
<narrative>
10. History of U.S. Immigration: 1790-1820
<lifted directly from: https://www.libertyellisfoundation.org/immigration-timeline>
https://www.dhs.gov/immigration-statistics/yearbook/2017/table1 )
Pre - 1790Most scientists believe that human beings first came to America over the Bering Straits about 20,000 years ago. These were the ancestors of the many Native American cultures, which would people the landscape for thousands of years.
Around the year 1000, a small number of Vikings would arrive. Five hundred years later, the great European migration would begin.
Crossing the Atlantic meant two to three months of seasickness, overcrowding, limited food rations, and disease. But the lure of available land and the hope for political and religious freedoms kept the Europeans coming.
In some places, the meeting of Europeans and Native Americans was peaceful. In others, the cultures clashed, leading to violence and disease. Whole tribes were decimated by such newly introduced diseases as small pox, measles, and the plague.
By the end of the 16th century, the Spanish were established in St. Augustine, and by the early 17th century thriving communities dotted the landscape: the British in New England and Virginia, the Dutch in New York and New Jersey, and the Swedish in Delaware.
But the Europeans weren't the only immigrants in these communities. As a freed slave from the 19th Century would recall: "...I looked around the ship...and saw...a multitude of black people of every description chained together, every one of their countenances expressing dejection and sorrow, I no longer doubted my fate..."
Slaves from Africa and the Caribbean were brought forcibly into the New World as early as 1619.
Among the early British settlers were indentured servants willing to trade four to seven years of unpaid labor for a one-way ticket to the colonies and the promise of land. There were also convicts among the newcomers - up to 50,000 transported to the colonies from English jails.
By the mid-18th century, the British colonies had become the most prosperous in North America. But the exodus of skilled laborers from the Old World to the New was becoming a matter of concern for the British Parliament. Some called for a total ban on immigration to the colonies.
But history was moving in quite a different direction.
1790 - 1820In the six years since the United States won the War of Independence, America was becoming, in Thomas Paine's words, "the asylum for the persecuted lovers of civil and religious liberty from every part of Europe."
The first Census was underway, and of the 3.9 million people counted, the English were the largest ethnic group. Nearly 20% were of African heritage. German, Scottish and Irish residents were also well represented. Census takers didn't count Native Americans.
The early Congresses could do little to affect immigration - the Constitution gave that power to the states. However, Congress was given the authority to ban the slave trade after 1808 - which it did - and the authority to establish rules for naturalization.
In 1790, it passed the first Naturalization Act, which stipulated that "…any alien, being a free white person, may be admitted to become a citizen of the United States..."
In the early years of the republic, immigration was light - 6000 people a year on average, including French refugees from the revolt in Haiti. By 1806, the flow of immigration was reduced to a trickle as hostilities between England and Napoleon's France disrupted Atlantic shipping lanes.
The War of 1812 between the United States and Britain slowed immigration even further.
With peace re-established in 1814, immigration from Great Britain, Ireland and Western Europe resumed at a record pace. Major port cities of this era - New York, Boston, Philadelphia, and Charleston - were overwhelmed with newcomers, many of them sick or dying from the long journey.
Congress responded with the Steerage Act of 1819, requiring ship captains to keep detailed passenger records and provide more humane conditions for those on board.
11. History of U.S. Immigration: 1820-1880
<lifted directly from: https://www.libertyellisfoundation.org/immigration-timeline>
1820 – 1880
(You might use my slide 2, United States Immigration 1820-1880. I tried to highlight those years but once again, maybe others can make it look nicer.)
The Industrial Revolution had begun, the slave trade was nearing its end, and America was pushing westward. Thousands of immigrants found work on the trans-continental railroad, settling in towns along the way. Word of the California Gold Rush had spread around the world, drawing immigrants from both Asia and Europe.
Although many new immigrants came in pursuit of a dream, nearly all the Irish immigrants from the 1840's and 1850's came to escape a nightmare - a devastating famine back home. As one immigrant recalled, "I saw the crop. I smelt the fearful stench…the death sign of each field of potatoes…the luxuriant stalks soon withered, the leaves decayed…" The Great Hunger would leave 1.5 million dead, and just as many would flee to America.
The Irish weren't the only newcomers. Rapid population growth, changes in land distribution, and industrialization had stripped many European peasants and artisans of their livelihoods. Departing from Liverpool and Hamburg, they came in through the major Eastern ports, and New Orleans. Chinese immigrants began to arrive in the 1850's, entering through San Francisco.

As in the past, the immigrants of this period were welcome neighbors while the economy was strong. During the Civil War, both the Union and Confederate armies relied on their strength. But during hard times, the immigrants were cast out and accused of stealing jobs from American workers. Some of the loudest protests came from the Know-Nothings, a political party of the 1850's famous for its anti-immigrant and anti-Catholic leanings.
But it was the pro-immigrant voices of this era that would be most influential. The Republican platform of 1864 stated, "Foreign immigration which in the past has added so much to the wealth, resources, and increase of power to the nation…should be fostered and encouraged."
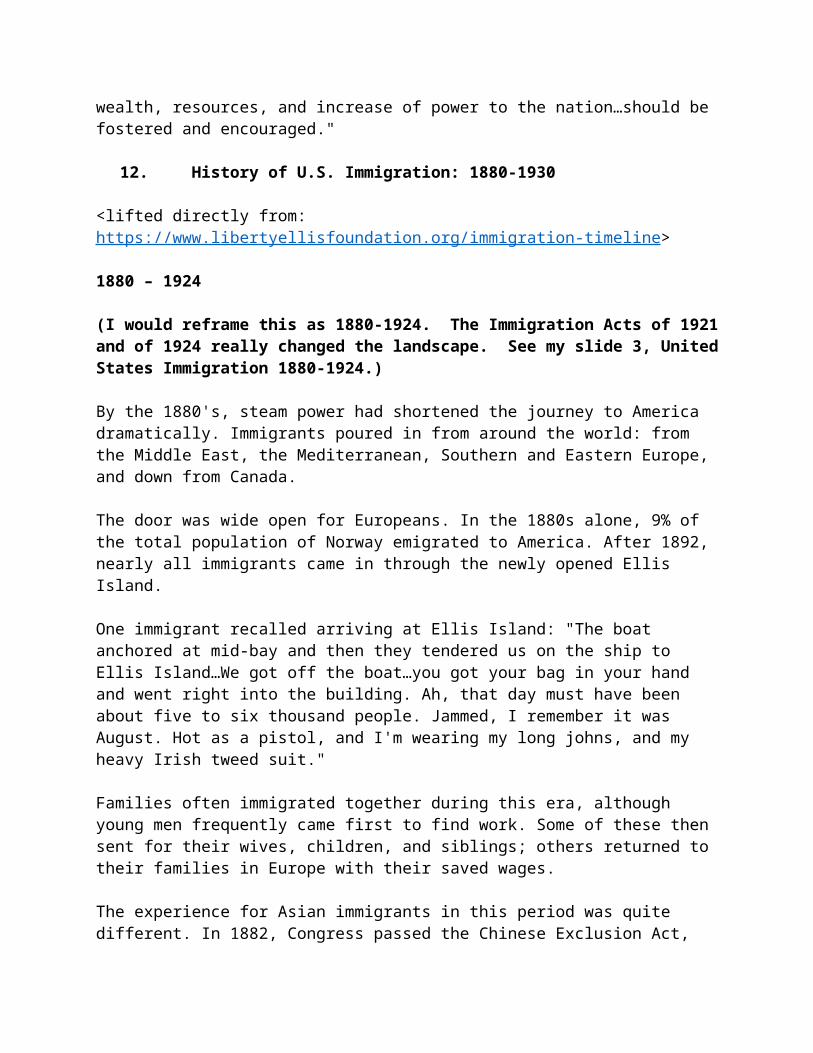
12. History of U.S. Immigration: 1880-1930
<lifted directly from: https://www.libertyellisfoundation.org/immigration-timeline>
1880 – 1924
(I would reframe this as 1880-1924. The Immigration Acts of 1921 and of 1924 really changed the landscape. See my slide 3, United States Immigration 1880-1924.)
By the 1880's, steam power had shortened the journey to America dramatically. Immigrants poured in from around the world: from the Middle East, the Mediterranean, Southern and Eastern Europe, and down from Canada.
The door was wide open for Europeans. In the 1880s alone, 9% of the total population of Norway emigrated to America. After 1892, nearly all immigrants came in through the newly opened Ellis Island.
One immigrant recalled arriving at Ellis Island: "The boat anchored at mid-bay and then they tendered us on the ship to Ellis Island…We got off the boat…you got your bag in your hand and went right into the building. Ah, that day must have been about five to six thousand people. Jammed, I remember it was August. Hot as a pistol, and I'm wearing my long johns, and my heavy Irish tweed suit."
Families often immigrated together during this era, although young men frequently came first to find work. Some of these then sent for their wives, children, and siblings; others returned to their families in Europe with their saved wages.
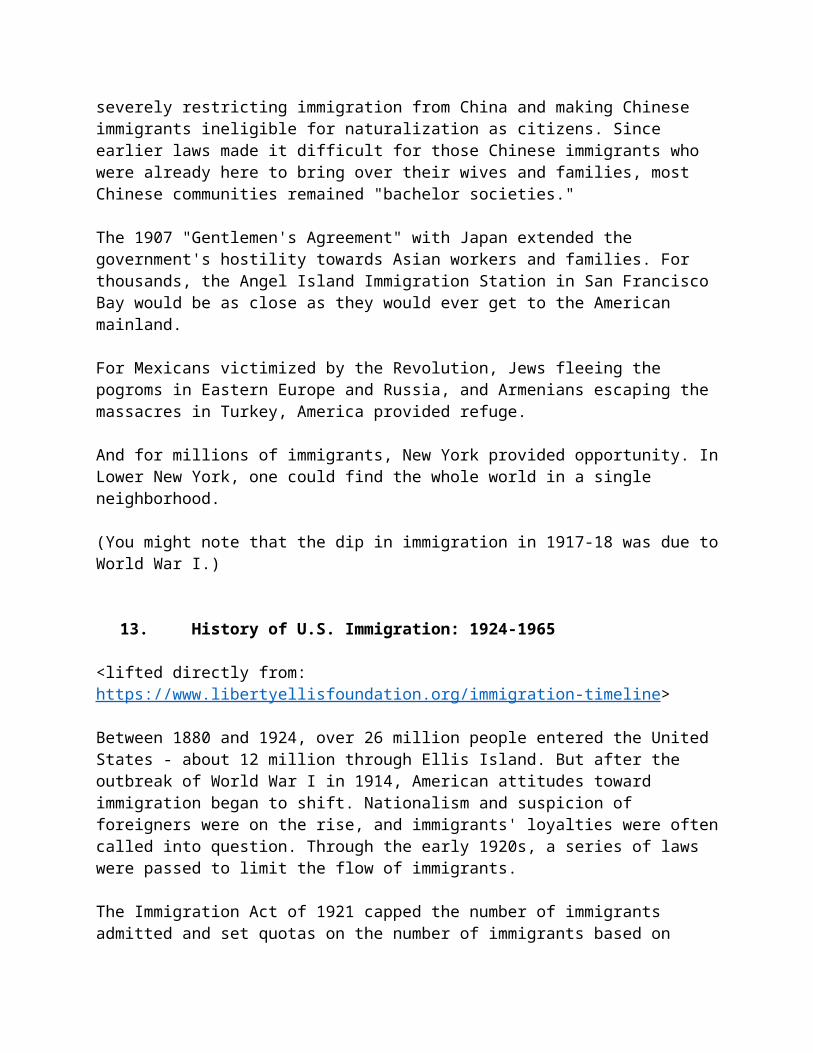
The experience for Asian immigrants in this period was quite different. In 1882, Congress passed the Chinese Exclusion Act, severely restricting immigration from China and making Chinese immigrants ineligible for naturalization as citizens. Since earlier laws made it difficult for those Chinese immigrants who were already here to bring over their wives and families, most Chinese communities remained "bachelor societies."
The 1907 "Gentlemen's Agreement" with Japan extended the government's hostility towards Asian workers and families. For thousands, the Angel Island Immigration Station in San Francisco Bay would be as close as they would ever get to the American mainland.
For Mexicans victimized by the Revolution, Jews fleeing the pogroms in Eastern Europe and Russia, and Armenians escaping the massacres in Turkey, America provided refuge.
And for millions of immigrants, New York provided opportunity. In Lower New York, one could find the whole world in a single neighborhood.
(You might note that the dip in immigration in 1917-18 was due to World War I.)
13. History of U.S. Immigration: 1924-1965
<lifted directly from: https://www.libertyellisfoundation.org/immigration-timeline>
Between 1880 and 1924, over 26 million people entered the United States - about 12 million through Ellis Island. But after the outbreak of World War I in 1914, American attitudes toward immigration began to shift. Nationalism and suspicion of foreigners were on the rise, and immigrants' loyalties were often called into question. Through the early 1920s, a series of laws were passed to limit the flow of immigrants.
The Immigration Act of 1921 capped the number of immigrants admitted and set quotas on the number of immigrants based on their nation of origin. The Act was amended by the Immigration Act of 1924 which capped immigration at 165,000 compared to the 800,000 that had been admitted in 1920 and even larger annual numbers in the period 1890-1910.
14. Nationality of US Immigrants
The Act of 1924 also set quotas based on the immigrant population of the United States in 1890, 34 years earlier. The effectd was to shift the nations of origin back from Eastern and Southern Europe to Western and Northern Europe.)
In 1929 The Great Depression had begun, leaving few with the means or incentive to come to the United States. Many recent immigrants returned to their native lands, including hundreds of thousands of Mexicans, many against their will. The restrictive immigration policies of the 1920s persisted.
In the late 1930s, with World War II accelerating in Europe, a new kind of immigrant began to challenge the quota system and the American conscience. A small number of refugees fleeing Nazi persecution arrived under the quota system, but most were turned away.
Once the US declared war against the Axis Powers, German and Italian resident aliens were detained; but for the Japanese, the policies were more extreme: both resident aliens and
American-born citizens of Japanese descent were interned. Congress would officially apologize for the Japanese Internment in 1988.
15. Signing up for the Bracero Program
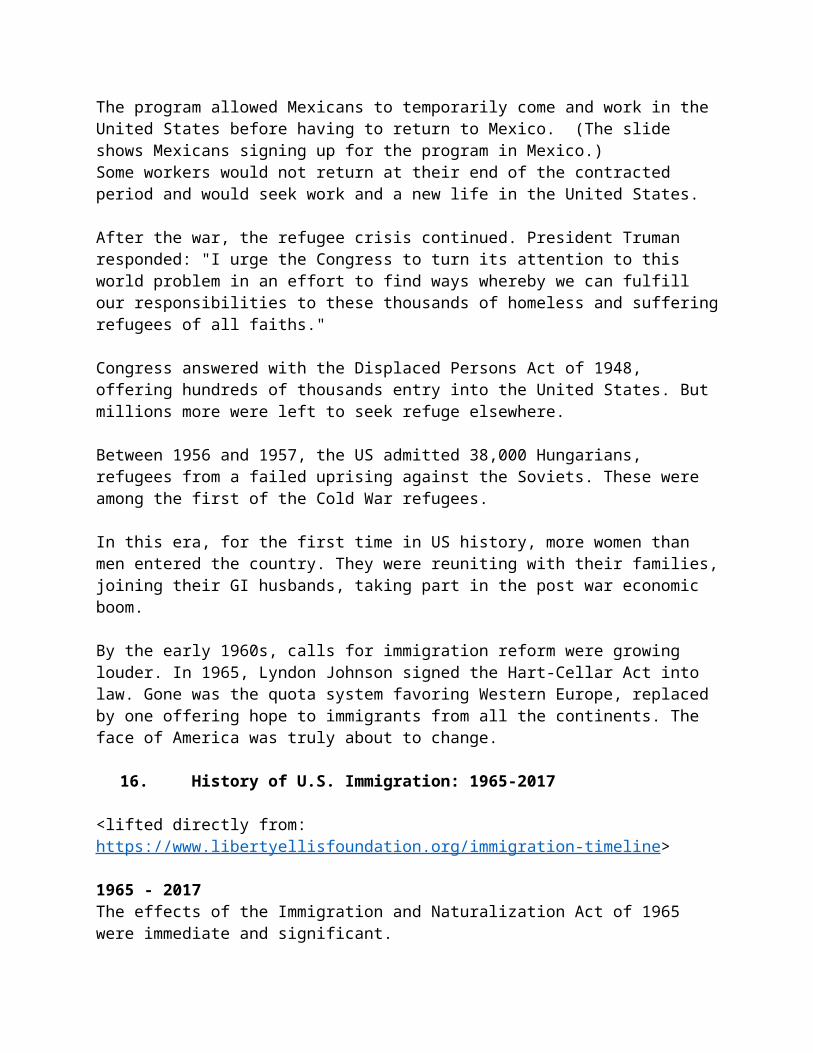
In response to the domestic labor shortages with World War II, the Bracero program was started in 1942. (The Spanish term bracero is based on brazos, i.e. arm. One hires “arms” rather than “hands” in Spanish.
The program allowed Mexicans to temporarily come and work in the United States before having to return to Mexico. (The slide shows Mexicans signing up for the program in Mexico.)Some workers would not return at their end of the contracted period and would seek work and a new life in the United States.
After the war, the refugee crisis continued. President Truman responded: "I urge the Congress to turn its attention to this world problem in an effort to find ways whereby we can fulfill our responsibilities to these thousands of homeless and suffering refugees of all faiths."
Congress answered with the Displaced Persons Act of 1948, offering hundreds of thousands entry into the United States. But millions more were left to seek refuge elsewhere.
Between 1956 and 1957, the US admitted 38,000 Hungarians, refugees from a failed uprising against the Soviets. These were among the first of the Cold War refugees.
In this era, for the first time in US history, more women than men entered the country. They were reuniting with their families, joining their GI husbands, taking part in the post war economic boom.
By the early 1960s, calls for immigration reform were growing louder. In 1965, Lyndon Johnson signed the Hart-Cellar Act into law. Gone was the quota system favoring Western Europe, replaced by one offering hope to immigrants from all the continents. The face of America was truly about to change.
16. History of U.S. Immigration: 1965-2017
<lifted directly from: https://www.libertyellisfoundation.org/immigration-timeline>
1965 - 2017The effects of the Immigration and Naturalization Act of 1965 were immediate and significant. The Act dramatically increased the number of immigrants allowed in and changed the criteria for entry.
The number of immigrants rose to levels of 800,000 to over one million annually, levels not seen since the turn of the previous century.
Family reunification became the most important criterion for entry serving as the basis for immigration for over two-thirds of immigrants today. Employment and education preferences place a distant second as the basis for less than 15 % of immigrants.
17. Historical Trends in Authorized Immigration
<This slide is helpful when time might be limited and walking through the individual epochs is not feasible.>
18. Recent Trends in Authorized Immigration
narrative
19. Persons Obtaining Lawful Permanent Resident Status by Region of Birth, 2017
Within five years of the passage of the act, Asian immigration would more than quadruple. This trend was magnified even further by the surge in refugees from the war in Southeast Asia. Today we receive more immigrants from Asia than North America (Mexico and Central America) with Africa having passed Europe for third place.
California now stands at the crossroads of America's newest cultures, receiving most of the immigrants from the Asian mainland and the Philippines, Mexico, and Central America. Their influence is felt from the Imperial Valley to Silicon Valley.
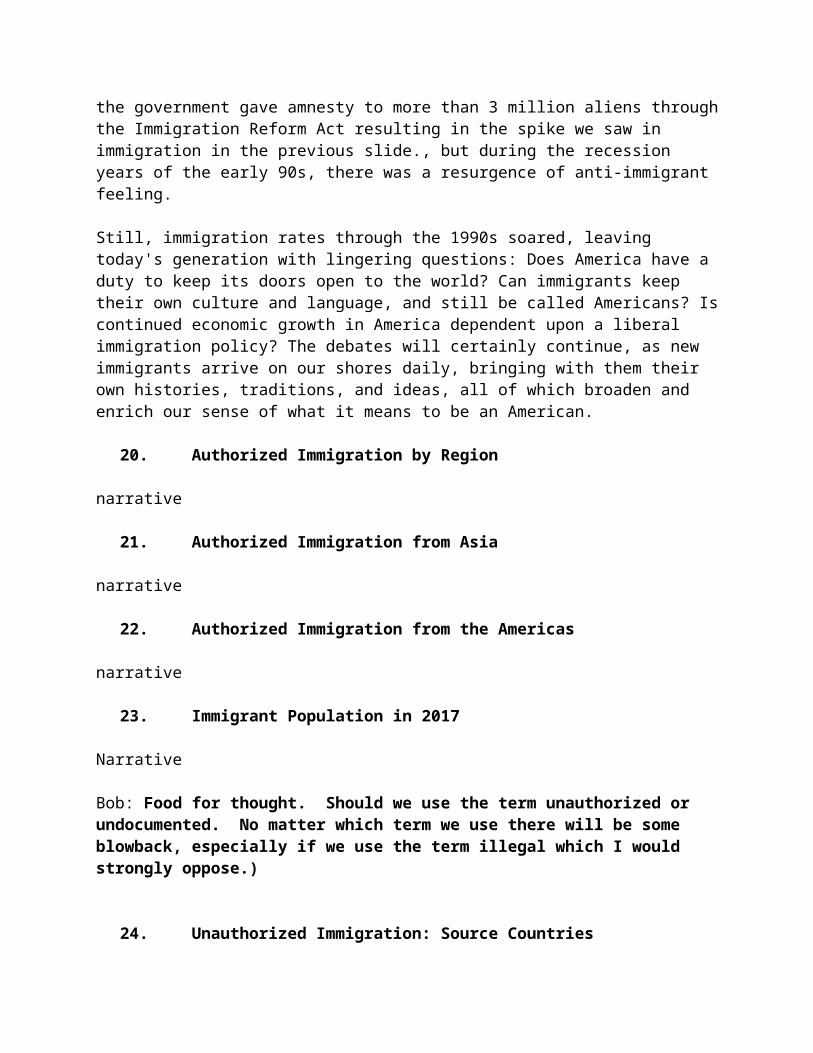
Immigrants can enter the country by air, by sea, and by land routes through Canada and Mexico, making it easier than ever to enter the country illegally. Through the 80s and 90s, illegal immigration was a constant topic of political debate. In 1986, the government gave amnesty to more than 3 million aliens through the Immigration Reform Act resulting in the spike we saw in immigration in the previous slide., but during the recession years of the early 90s, there was a resurgence of anti-immigrant feeling.
Still, immigration rates through the 1990s soared, leaving today's generation with lingering questions: Does America have a duty to keep its doors open to the world? Can immigrants keep their own culture and language, and still be called Americans? Is continued economic growth in America dependent upon a liberal immigration policy? The debates will certainly continue, as new immigrants arrive on our shores daily, bringing with them their own histories, traditions, and ideas, all of which broaden and enrich our sense of what it means to be an American.
20. Authorized Immigration by Region
narrative
21. Authorized Immigration from Asia
narrative

22. Authorized Immigration from the Americas
narrative
23. Immigrant Population in 2017
Narrative
Bob: Food for thought. Should we use the term unauthorized or undocumented. No matter which term we use there will be some blowback, especially if we use the term illegal which I would strongly oppose.)
24. Unauthorized Immigration: Source Countries
Narrative
25. Unauthorized Immigration: 2012-2016
Narrative
26. Unauthorized Immigration: Where They Live
Narrative
27. U.S. Unauthorized Immigration Totals
Narrative
28. Why Do We Care? Economic Implications
Narrative
29. Two Sets of Implications
From a theoretical point of view, economists focus on two sets of predictions regarding the impact through economic channels. These two sets of predictions relate to, respectively: aggregate effects (“the size of the pie”); income distribution effects (“the slices of the pie”).
30. GDP Effects
Narrative
31. GDP: How Does This Work?
Narrative
32. Immigration and Labor Markets
Aggregate effects Income distribution effects Other issues: effects working through productivity changes; innovation; and
specialization into different tasks
33. Labor Market Implications: Complicated
Narrative
34. Immigration is Similar to Trade
Narrative
35. Labor Market Implications
Narrative
36. Labor Market Implications: Base Case
Narrative
37. Labor Market Implications: Low Skilled Labor
Narrative
38. Labor Market Implications: General Principles
Narrative
39. Labor Market Implications: The Surplus
Narrative

40. Labor Market Implications: Evidence of Surplus
Narrative
41. Summary of Labor Market Effects
Narrative
42. Much more here….
Narrative
43. Pathway of Wage and Employment Effects1
Narrative
44. Pattern of Immigration
Narrative
45. Comparison with US Workers, 2012
Narrative
46. Educational Attainment and Immigration
Narrative
47. Recent Immigrants are Well Educations
Narrative
48. Discuss Innovation
Narrative
49. Discuss Entrepreneurship and Fortune 500 CEOs
Narrative
50. Logos of immigrant founded fortune 500 firms
Narrative
1 Blau and Mackle (2015), section 5.7, page 264
51. Fortune 500: 1st and 2nd Generation Founders
Narrative
52. Share of Fortune 500 Companies, but groups.
Narrative
53. Immigration and Inequality
Immigration has received a lot of attention, and many believe that immigrant workers contribute to an increase in income inequality. The notion is relatively intuitive. A large share of immigrants, arguably those receiving most of the attention, are the less-educated, low-income workers. As more of these workers come into the economy, they drive down the wages of other low-wage earners, decreasing the income of those at the bottom of the income distribution. To the extent that more-educated immigrants create complementary jobs for other more educated workers, this increases the income of higher-income more-educated workers also adding to income inequality. The figure on the slide backs this up.2 If you look at the distribution of income without immigrants, it is more equal than with them, but not by very much.
It is important to notice from the graph that the trends of the two lines are very similar. Immigration may well add to inequality, but there is little evidence that it is adding significantly to the trend in income inequality when we consider the number of immigrants and the pattern of immigration.
Things are a little bit different once the influence on wages of an increase in immigration is taken into account.
54. A Summary of Immigration and Inequality
To recap, if we look at the simple numbers, it seems as though immigration, both legal and illegal, would have a potentially significant effect on income inequality. Between 1970 and 2016, the share of the U.S. population made up of immigrants increased significantly. In 1970, it was just 5%. By 2016, it was 14%.3 The figure in 2016 is roughly consistent with much of U.S. history. Between 1860 and 1920, immigrants made up between 13% and 15% of the population. The share declined through 1970.
Although there is likely an impact, efforts to measure the size of the effect find that the impact is quite small. One estimate is that between 1980 and 2000, just 5% of the increase in income inequality in the United States can be attributed to immigration.4
2 See http://blogs.lse.ac.uk/usappblog/2015/10/14/how-immigration-makes-income-inequality-worse-in-the-us/.3 See https://www.migrationpolicy.org/programs/data-hub/us-immigration-trends#history.4 David Card, “Immigration and Inequality,” NBER Working Paper 14684, January 2009, http://www.nber.org/papers/w14683.pdf.
Immigration does increase income inequality, but it is generally agreed that it is not a significant source of growing income inequality in the United States.
55. Immigration and Prices5
Narrative
56. Prices: Distributional Consequences
Narrative Cortes (2008)
57. Prices and Economic Expansion6
Narrative
58. Housing?
Narrative
59. Government Revenues and Expenditures
Welfare-state channel (considering the dimensions of the welfare state that redistribute income from the rich to the poor)
Aggregate effects:
o An inflow of low-skilled immigrants is more likely to represent a cost for the destination country’s welfare state, hence to reduce the size of the pie through this channel.
o An inflow of high-skilled immigrants is more likely to represent a positive contribution for the destination country’s welfare state, hence to increase the size of the pie through this channel.
Welfare-state channel (considering the dimensions of the welfare state that redistribute income from the rich to the poor)
Income-distribution effects (assuming a redistributive fiscal system)
[I don’t think a specific paper has worked out these income-distribution effects. But I wanted to include this page in the presentation because I want to give a balanced view of immigration 5 For prices, see Lach (2007) and Cortes (2008)..6 For labor supply evidence: Farre et al. (2011), Cortes and Tessada (2011), and Barone and Mocetti (2011).
through the welfare-state channel. In many destination countries, immigrants tend to be low-skilled but also young (relative to the native population). Therefore, although their skill level makes them more likely to be a net cost for the destination country’s welfare state, their age structure makes them more likely to represent a positive net contribution)]
The welfare state of the host country can respond to an inflow of immigrants through two alternative adjustment mechanisms (note that adjustment is required to balance the government’s budget, which might go into deficit or surplus):
o Tax adjustment mechanism: following immigration, tax rates adjust while per capita benefits (either their number or their quality) do not change:
1. When immigrants are low-skilled, everybody is likely to be negatively affected since tax rates increase. However, high-income individuals are more negatively affected than low-income individuals.
2. When immigrants are high-skilled, everybody is likely to be positively affected since tax rates decrease. However, high-income individuals are more positively affected than low-income individuals.
3. In general, in the tax adjustment model, immigration has a larger impact on individuals at the top of the income distribution, since these individuals are more affected by changes in tax rates.
o Benefit adjustment mechanism: following immigration, per capita benefits (either their number or their quality adjust) while tax rates do not change:
1. When immigrants are low-skilled, everybody is likely to be negatively affected since per capita benefits decrease. However, low-income individuals are more negatively affected than high-income individuals.
2. When immigrants are high-skilled, everybody is likely to be positively affected since per capita benefits increase. However, low-income individuals are more positively affected than high-income individuals.
3. In general, in the tax adjustment model, immigration has a larger impact on individuals at the bottom of the income distribution, since these individuals are more affected by changes in per capita benefits.
o In general: in practice the adjustment mechanism is likely to be a combination of the two adjustment mechanisms above. However, the one which dominates will determine the direction of the income-distribution effects.


60. Why is this important?
Narrative
61. Topics?
Narrative
62. Age-Specific Taxes and Benefits
NOTE: All public spending is included in benefits except pure public goods (defense, interest on the debt, subsidies). Data are per capita age schedules based on Current Population Survey data, smoothed and adjusted to National Product and Income Accounts annual totals. SOURCE: Panel analysis of Current Population Survey data.
63. What Do We Know?
Narrative roughly page 330 in Blau and Mackie
64. Bottom Line/Consensus of Estimates
Narrative
65. Receipts/outlays ratios
Not sure about including this.
Blau & Mackie, pg 392
66. Net Fiscal Impacts
Blau & Mackie, pg 437
67. Implications for Major Federal Programs
Narrative
68. The Aging US Population
Narrative
69. Implications for Social Security
Narrative

70. Prices
Aggregate effects
Positive, to the extent that immigration lowers the price of immigrants-intensive sectors.
Income-distribution effects
If individuals belonging to different income groups are characterized by different consumption baskets, immigration will have income distribution effects through the price channel.
71. Prices: Theory
Aggregate effects
Positive, to the extent that immigration lowers the price of immigrants-intensive sectors.
Income-distribution effects
If individuals belonging to different income groups are characterized by different consumption baskets, immigration will have income distribution effects through the price channel.
72. Prices: Empirics
Cortes (2006) uses highly disaggregated U.S. data at the city level. She finds that immigration affects the prices of non-traded goods and services, however her evidence suggests that the effect of immigration on the cost of living indices does not differ substantially across income groups. In particular, across US cities the average decrease in the cost of living due to immigration in the ninenties is very similar for high school dropouts, high school graduates and college graduates (0.92, 0.94 and 0.96 percent, respectively, see Table 14 in the appendix of the paper).
73. Exports and FDI
Narrative
74. Exports and FDI: Theory
Aggregate effects
Income-distribution effects
75. Exports and FDI: Empirics

76. Non-economic Implications
This all begs the question of why we care so much about immigration. One major fear is the extent to which immigration will change the country. There are a wide variety of metrics that are referenced when concern is expressed.
Here is a set of 8, which leaves out the biggest of all: <click> Crime.
But there are concerns about immigrants coming and not integrating well into the U.S. culture. By most of the metrics, immigrants, by the third generation look a lot like native-born citizens.
With respect to crime, however, the story is different.
77. Crime
As hypotheses, both of these are reasonable. Immigrants tend to have demographic characteristics that are tied to higher rates of crime among the native population: they tend to be male and young. They also tend to have lower education levels and wages than the rest of the population.7 All of these characteristics tend to be correlated with higher rates of criminal activity.8
78. Crime: Incarceration Rates in California79. Crime: Incarceration Rates in California80. MSAs: Growing Immigration and Crime81. Politics
Narrative
82. Culture
Narrative
83. National Identity
Narrative
84. Thank you
85. Available NEED Topics Include
And so on…..
7 Butcher and Piehl (1998a and 1998b).8 Harris and Shaw (2000)

References
the welfare-state channel (related literature: Facchini and Mayda 2009, Boeri, Hanson, and McCormick 2002, Borjas and Hilton 1996, Razin and Sadka 1999, Razin, Sadka, and Swagel 2002);
the price channel (related literature: Cortes 2008)
the political channel (related literature: Scheve and Slaughter2001) Hanson, Scheve and Slaughter (2007, Mayda 2008, Facchini and Mayda 2008, 2009, Mayda 2008, Baerg, Hotchkiss, and Quispe-Agnoli 2018, Mayda, Peri and Steingress 2019);
Barker, Rachel, Marek Gootman, and Max Bouchet, “Welcoming Communities make for globally competitive city-regions,” Brookings, The Avenue, August 5, 2019. https://www.brookings.edu/blog/the-avenue/2019/08/05/welcoming-communities-make-for-globally-competitive-city-regions/?utm_campaign=Brookings%20Brief&utm_source=hs_email&utm_medium=email&utm_content=75421135
Barone, G., and Mocetti, S. (2011). “With a Little Help from Abroad: The Effect of Low skilled Immigration on the Female Labour Supply”, Labour Economics, Vol. 18, pp. 664–675.
Borjas, G.J. (2014a). Immigration Economics. Cambridge, MA. Harvard University Press.
Borjas, G.J. (2014b). The Slowdown in the Economic Assimilation of Immigrants: Aging and Cohort Effects Revisited Again. NBER Working Paper No. 19116. Cambridge, MA: National Bureau of Economic Research. Available: http://www.uib.no/sites/w3.uib.no/ files/attachments/slowdown_of_assimilation_january_2014.pdf [January 2016].
Borjas, G.J. (2013). Immigration and the American Worker: A Review of the Academic Literature. Washington, DC: Center for Immigration Studies. Available: http://cis.org/immigration-and-the-american-worker-review-academic-literature [November 2015].
Borjas, George J., (2005), “The Labour-Market Impact of High-Skill Immigration”, American Economic Review, Vol. 95, Issue 2, pp. 56–60.
Burchardi, Konrad, Chaney, Thomas and Hassan, Tarek (2018), “Migrants, Ancestors, and Foreign Investments”, Review of Economic Studies, pp. 1–39.
Butcher, K.F., and Piehl, A.M. (1998a). Recent immigrants: Unexpected implications for crime and incarceration. Industrial and Labor Relations Review, 51(4), 654-679.
Butcher, K.F., and Piehl, A.M. (1998b). Cross-city evidence on the relationship between im- migration and crime. Journal of Policy Analysis and Management, 17(3), 457-493.

Butcher, K.F., and Piehl, A. M. (2007). Why Are Immigrants’ Incarceration Rates so Low? Evidence on Selective Immigration, Deterrence, and Deportation. NBER No. 13229. Cambridge, MA: National Bureau of Economic Research.
Butcher, K.F., and Piehl, A.M. (2008). Crime, Corrections, and California: What Does Immigration Have to Do with It? San Francisco: Public Policy Institute of California. Available: http://www.ppic.org/main/publication.asp?i=776 [October 2015].
Cohen, L., U. G. Gurun, and C. Malloy (2017), Resident Networks and Corporate Connections: Evidence from World War II Internment Camps. Journal of Finance Vol. 72, Issue 1, pp. 207–248.
Cortes, Patricia (2008), “The Effect of Low-skilled Immigration on US Prices: Evidence from CPI Data”, Journal of Political Economy, Vol. 116, Issue 3, pp. 381-42.
Cortes, P., and Pan, J. (2013). Outsourcing household production: Foreign domestic helpers and native labor supply in Hong Kong. Journal of Labor Economics, 31(2), 327-371.
Cortes, P., and Tessada, J. (2011), “Low-skilled Immigration and the Labour Supply of Highly Skilled Women”, American Economic Journal: Applied Economics, Vol. 3, pp. 88–123.
Doran, Kirk, Alexander Gelber, and Adam Isen, (2014), “The Effect of High-Skilled Immigration on Patenting and Employment: Evidence from H-1B Visa Lotteries”, NBER Working Papers 20668.
Farre, L., González, L., and Ortega, F. (2011), “Immigration, Family Responsibilities and the Labour Supply of Skilled Native Women”, The BE Journal of Economic Analysis & Policy, Volume 11, Article 34.
Gould, D. M. (1994), “Immigrant links to the home country: Empirical implications for U.S. bilateral trade flows,” The Review of Economics and Statistics, Vol. 76, Issue 2, pp. 302–16.
Harris, A.R., and Shaw, J.A.W. (2000). Looking for patterns: Race, class, and crime. In J.F. Sheley (Ed.), Criminology: A Contemporary Handbook (3rd ed., pp. 129-163). Belmont, CA: Wadsworth.
Hong, G., and McLaren, J. (2015, April). Are Immigrants a Shot in the Arm for the Local Economy? NBER Working Paper No. 21123. JEL No. F22, F66. Cambridge, MA. Available: http://www.nber.org/papers/w21123 [January 2016].
Hunt, Jennifer and Gauthier-Loiselle, Marjolaine (2011) “How Much Does Immigration Boost Innovation?”, American Economic Journal: Macroeconomics, Volume 2, Issue 2, pp. 31–56.
Javorcik, Beata, Ozden, Caglar, Spatareanu, and Neagu (2011), “Migrant networks and foreign direct investment”, Journal of Development Economics, Vol. 94, Issue 2, pp. 231-241.
Kerr, W. R., and Lincoln, W. F. (2010), “The Supply Side of Innovation: H-1B Visa Reforms and US Ethnic Invention”, Journal of Labour Economics, Volume 28, pp. 473–508.

Lach, Saul (2007), “Immigration and Prices”, Journal of Political Economy, Vol. 115, pp. 548–87.
Mayda, Orefice and Santoni (2019), “The Impact of High-Skilled Migration on Innovation: Empirical Evidence from France”.
Mayda, Anna Maria, Parsons, Christopher and Vezina, Pierre-Louis (2019), “Refugees and Foreign Investment: Quasi-Experimental Evidence from the US Refugee Resettlement Program”.
National Academies of Sciences, Engineering, and Medicine 2017. The Economic and Fiscal Consequences of Immigration. Washington, DC: The National Academies Press. https://doi.org/10.17226/23550.
National Academies of Sciences, Engineering, and Medicine 2015. The Integration of Immigrants into American Society. Washington, DC: The National Academies Press. https://doi.org/10.17226/21746.
Parrotta, Pierpaolo, Pozzoli, Dario and Pytlikova, Mariola (2014), “The nexus between labor diversity and firms innovation”, Journal of Population Economics, Volume 27, Issue 2, pp. 303-364.
Parsons, C. and P.-L. Vezina (2018), “Migrant networks and trade: The vietnamese boat people as a natural experiment,” The Economic Journal 128.
Rauch, J. E. (1999), “Networks versus markets in international trade,” Journal of International Economics, Vol. 48, Issue 1, pp. 7–35.
Wadhwa, Vivek, Saxenian, Anna Lee, Rissing, Ben A. and Gereffi, G. (2007), “America’s New Immigrant Entrepreneurs: Part I”, Technical Report 23, Duke Science, Technology Innovation Papers.