algebra2applications.wikispaces.comalgebra2applications.wikispaces.com/file/view/...rev+… · web...
TRANSCRIPT

Algebra 2 Applications Lesson Plan OutlineLesson Title: Profit Modeling Lesson 1 - The Business Model: Introduction to Profit Modeling
Washington State Algebra 2 Standard Name(s) and Number(s): (For Unit) A2.3.A - Translate between the standard form of a quadratic function, the vertex form, and the factored form; graph and interpret the meaning of each form.A2.3.B - Determine the number and nature of the roots of a quadratic function.A2.3.C - Solve quadratic equations and inequalities, including equations with complex roots.
Learning objective:Students will be able to use the profit model, profit, P, equals revenue, R, minus costs, C. P(x) = R(x) – C(x) and basic business vocabulary by creating a simple function to model a business idea and explaining the components.
Prerequisite Skills:Addition and subtraction of polynomial expressions
Material for Students:K-W-L Worksheet, Vocabulary Organizer
Teaching Aids:Whole-class K-W-L Chart (document camera, board, poster, etc.)
Estimated Time For Completion:One 55-minute class period
References:
I. PREASSESSMENT:Students practice subtracting polynomials.
II. INTRODUCTION: Students will be introduced to the ideas of profit modeling through a K-W-L (What do you know, what do you want to know, and what have you learned) exercise.
1. Individual: Each student should have the Business Model K-W-L chart above. Give students several minutes to fill in their individual K-W-L charts.
2. Pairs: Have students share their list with a partner. They should have several minutes to discuss their thoughts and update their individual lists.
III. LESSON: Continue introductory exercise by flowing into a whole-class discussion of business model and profit modeling. Make sure to hit targeted vocabulary
1. Whole class: Students share items form their lists. Teacher creates class K-W-L chart on board, document camera, wall poster, etc.
a. Drive discussion of business model to include:i. Fixed costsii. Variable costsiii. Revenueiv. Profit v. Market analysisvi. Price determination
b. The class should derive the model that includes profit, P, equals revenue, R, minus costs, C. P(x) = R(x) – C(x)
2. Vocabulary: students fill in a vocabulary graphic organizer for the words defined above.3. Teacher may use any one of a variety of vocabulary graphic organizers, such as the one
included above. 4. Organizer may be printed on the back of the Business Model K-W-L worksheet. 5. Add to the word list as the unit progresses.
Draft 7-21-2010

IV. APPLICATION a. Now the student gets to practice under the supervision of you the facilitator. b. Describe what the students do in order to practice or apply what they have learned.c. Active participation by the students.d. Collaborative learning activity?
Groups of students think of a product to sell. Identify the revenue and costs. Share ideas with the whole-class. Seek input from other groups.
V. ASSESSMENTAssess student understanding with an Exit Quiz or Journal Reflection
1. EXIT Quiz/Reflection: Teacher gives students several minutes to answer the following questions and turn in as they exit the room or put in their notebooks.
a. You are thinking about going into business and selling CDs of your friend’s band to earn money so you can buy a new guitar.
i. What are some of the costs associated with this business plan? ii. Are these costs fixed or variable? Explain.iii. Describe how you might decide how much to charge for the CD.iv. How do you calculate the profit from your venture?
VI. EXTENSIONS
Based on: CURRICULUM GUIDE FOR PROFESSIONAL TECHNICAL COLLEGE INSTRUCTORSTEACHING & FACILITATING LEARNING - LEVEL I
Draft 7-21-2010

Profit Modeling - Class Project
The Business Model:
K-W-L Worksheet
Think about your favorite store or restaurant. Did you ever think about the things that factor
into the price you pay for the items in the store or restaurant? What does the store or
restaurant owner have to consider so that they make a profit?
1. In the chart below, list all the things you know about the actual process of running a
business, the things you think are part of the business model, and the things you want
to know about the financial side of running a business.
What do I KNOW or THINK I know?
What do I WANT to know? What did I LEARN?
Draft 7-21-2010

Vocabulary Organizer
Word Definition & Characteristics Examples Non-Examples
Draft 7-21-2010

The Business Model:
Teacher Notes
3. Individual: Each student should have the Business Model K-W-L chart above. Give
students several minutes to fill in their individual K-W-L charts.
4. Pairs: Have students share their list with a partner. They should have several minutes to
discuss their thoughts and update their individual lists.
5. Whole class: Students share items form their lists. Teacher creates class K-W-L chart on
board, document camera, wall poster, etc.
a. Drive discussion of business model to include:
i. Fixed costs
ii. Variable costs
iii. Revenue
iv. Profit
v. Market analysis
vi. Price determination
b. The class should derive the model that includes profit, P, equals revenue, R,
minus costs, C. P(x) = R(x) – C(x)
6. Vocabulary: students fill in a vocabulary graphic organizer for the words defined above.
a. Teacher may use any one of a variety of vocabulary graphic organizers, such as
the one included above.
b. Organizer may be printed on the back of the Business Model K-W-L worksheet.
c. Add to the word list as the unit progresses.
7. EXIT Quiz/Reflection: Teacher gives students several minutes to answer the following
questions and turn in as they exit the room or put in their notebooks.
a. You are thinking about going into business and selling CDs of your friend’s band
to earn money so you can buy a new guitar.
i. What are some of the costs associated with this business plan?
ii. Are these costs fixed or variable? Explain.
iii. Describe how you might decide how much to charge for the CD.
iv. How do you calculate the profit from your venture?
Draft 7-21-2010

Algebra 2 Applications Lesson Plan OutlineLesson Title: Profit Modeling Lesson 2 – Modeling Linear Relationships
Washington State Algebra 2 Standard Name(s) and Number(s): (For Unit)A2.3.A - Translate between the standard form of a quadratic function, the vertex form, and the factored form; graph and interpret the meaning of each form.A2.3.B - Determine the number and nature of the roots of a quadratic function.A2.3.C - Solve quadratic equations and inequalities, including equations with complex roots.
Learning objective:Students will be able to model a linear relationship with a linear equation and describe the relationship between the variables.
Prerequisite Skills:
Material for Students:Linear Regression WorksheetGraph paperGraphing calculators
Estimated Time For Completion:One 55-minute period
References:I. PREASSESSMENT:
Review manipulating and responding variables, domain and range for linear functions and how these are represented in a linear equation.
II. INTRODUCTION: Linear Regression Worksheet Problem #1.1. Students work in groups of 2 to 4.2. Think-Pair-Share:
a. Have students examine the data and think about question 1. b. After a minute, they should share their thoughts with their partner. c. Following pairs conferring, lead a whole class discussion regarding the relationship. d. Answer: As the price increases $5, the number of shirts sold decreases by 10.
III. LESSON: Complete Linear Regression Worksheet.1. Students individually graph the relationship and draw a line of best fit. 2. Students use their line of best fit to calculate a function that relates cost of the t-shirt to the
predicted number of t-shirts sold.
a. Answer: n=−2 p+100b. Will the slope of the function always be negative? Why?
3. [Optional] Students enter data into their graphing calculators and use a linear regression tool to determine the line of best fit. Compare the function they got using graph paper and using the graphing calculator regression program.
IV. APPLICATION
V. ASSESSMENT1. Class Discussion: Lead class discussion that reiterates the process of graphing a scatter plot,
finding a line of best fit, and finding the function that relates the two variables. Have students add the process in their own words to their Math Journals.
VI. EXTENSIONS
Based on: CURRICULUM GUIDE FOR PROFESSIONAL TECHNICAL COLLEGE INSTRUCTORS
Draft 7-21-2010

TEACHING & FACILITATING LEARNING - LEVEL I
Draft 7-21-2010

Discovering the Price / Number Relationship:
Linear Regression Worksheet
The Senior Class ASB decided to sell Spirit Gear t-shirts during Spirit Week as a fund-raiser for
senior graduation activities. In a marketing survey, the ASB officers asked students whether
they would buy a t-shirt for a specific price. The group summarized the data below:
Price of t-shirts, p Number of t-shirtssold, n (predicted)
$10 82$15 69$20 60$25 51$30 42$35 29$40 21
1. Analyze the data. Describe the relationship between the price of the t-shirts and the
number of t-shirts they predict will be sold.
2. Graph the relation between price and number of t-shirts they predict they will sell.
3. Find the function that models the relationship between the price in dollars, p and the
number of t-shirts, n.
a. Is the function linear? How do you know?
b. Is this a good model for the relationship? Explain.
4. Optional: Use a graphing calculator to plot the data. Use the linear regression functions
to find the equation that relates price of the t-shirt with the number of t-shirts.
Compare the results you got between the methods.
Draft 7-21-2010

Discovering the Price / Number Relationship:
Linear Regression Worksheet Teacher Notes
Students work in groups of 2 to 4.
1. Think-Pair-Share:
a. Have students examine the data and think about question 1.
b. After a minute, they should share their thoughts with their partner.
c. Following pairs conferring, lead a whole class discussion regarding the
relationship.
d. Answer: As the price increases $5, the number of shirts sold decreases by 10.
2. Students individually graph the relationship and draw a line of best fit.
3. Students use their line of best fit to calculate a function that relates cost of the t-shirt to
the predicted number of t-shirts sold.
a. Answer: n=−2 p+100
b. Will the slope of the function always be negative? Why?
4. [Optional] Students enter data into their graphing calculators and use a linear regression
tool to determine the line of best fit. Compare the function they got using graph paper
and using the graphing calculator regression program.
5. Class Discussion: Lead class discussion that reiterates the process of graphing a scatter
plot, finding a line of best fit, and finding the function that relates the two variables.
Draft 7-21-2010

Algebra 2 Applications Lesson Plan OutlineLesson Title: Profit Modeling Lesson 3 – Deriving the Revenue Function
Washington State Algebra 2 Standard Name(s) and Number(s): (For Unit)A2.3.A - Translate between the standard form of a quadratic function, the vertex form, and the factored form; graph and interpret the meaning of each form.A2.3.B - Determine the number and nature of the roots of a quadratic function.A2.3.C - Solve quadratic equations and inequalities, including equations with complex roots.
Learning objective:Students will be able to model revenue with a quadratic equation in standard form.
Prerequisite Skills:Multiplying polynomials
Material for Students:Revenue Function WorksheetGraph paperGraphing Calculators
Teaching Aids:
Estimated Time For Completion:One 55-minute period
References:I. PREASSESSMENT:
Review multiplying polynomials. Review standard form of a linear equation. How will the standard form of a quadratic equation be similar? How will it be different?
II. INTRODUCTION: 1. Students recall linear function that related the price and number of t-shirts from Day 2. 2. Think-Pair-Share:
a. How do you determine revenue if you do not know the price you will charge for an item?
III. LESSON: Complete Revenue Function Worksheet
1. Students work in groups of 2 to 4.2. Think-Pair-Share:
a. Students individually think about question 1 and jot down their ideas.b. After a minute, they should share their thoughts with their partner. c. Following pairs conferring, lead a whole class discussion regarding the relationship.
i. Answers: 1. Revenue = (price of t-shirt)(number of t-shirts sold)
2. R=p⋅n
3. R( p )=p(−2 p+100 ) ; R( p )=−2 p2+100 p3. Student groups graph the Revenue function.
a. What do you notice about the graph? b. How does it compare to the graph of the Price/Number sold function?
Draft 7-21-2010

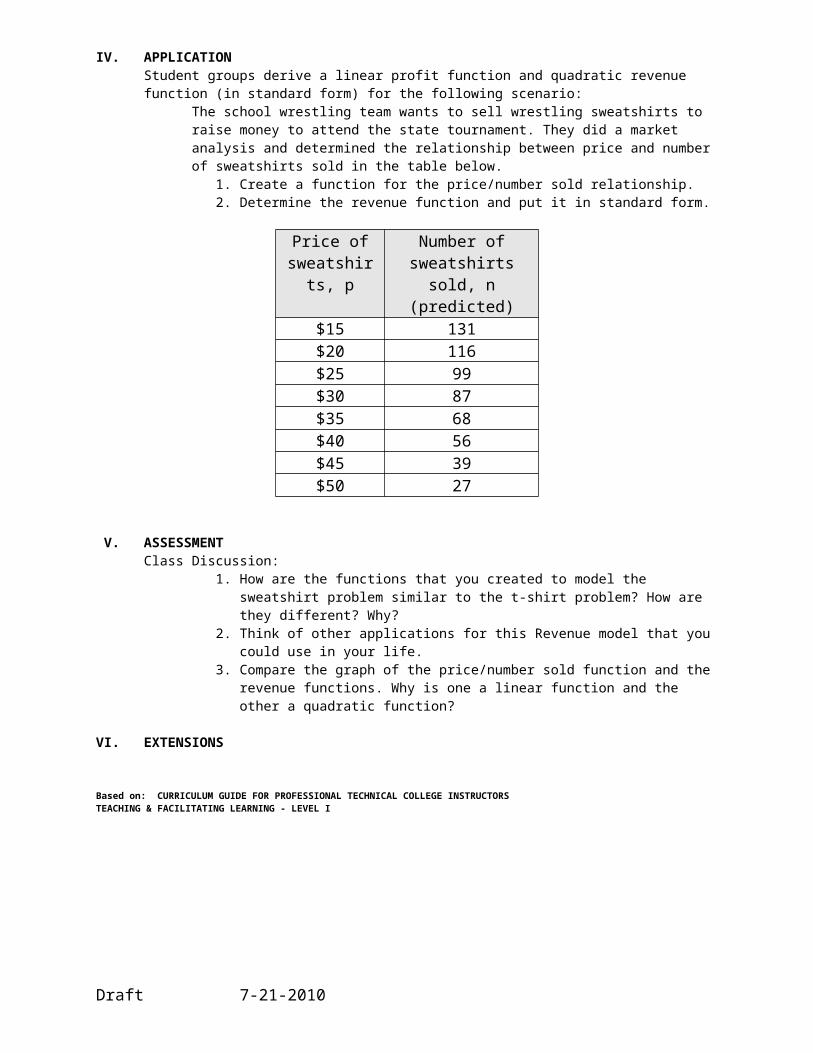
IV. APPLICATION Student groups derive a linear profit function and quadratic revenue function (in standard form) for the following scenario:
The school wrestling team wants to sell wrestling sweatshirts to raise money to attend the state tournament. They did a market analysis and determined the relationship between price and number of sweatshirts sold in the table below.
1. Create a function for the price/number sold relationship. 2. Determine the revenue function and put it in standard form.
Price of sweatshirts, p
Number of sweatshirts
sold, n (predicted)$15 131$20 116$25 99$30 87$35 68$40 56$45 39$50 27
V. ASSESSMENTClass Discussion:
1. How are the functions that you created to model the sweatshirt problem similar to the t-shirt problem? How are they different? Why?
2. Think of other applications for this Revenue model that you could use in your life. 3. Compare the graph of the price/number sold function and the revenue functions.
Why is one a linear function and the other a quadratic function?
VI. EXTENSIONS
Based on: CURRICULUM GUIDE FOR PROFESSIONAL TECHNICAL COLLEGE INSTRUCTORSTEACHING & FACILITATING LEARNING - LEVEL I
Draft 7-21-2010

Deriving the Revenue Function:
Revenue Function Worksheet
Think about the Business Model. How will the Senior Class ASB determine the amount of
revenue generated by the sales of t-shirts?
1. Describe the how you determine revenue.
2. Share your thoughts with your partner and be prepared to share with the class.
3. With your partner, create an equation to model the revenue using the letter names p
for price of t-shirt, n for number of t-shirts sold, and R for revenue. Be prepared to
explain how you got the components of your function equation.
4. Rewrite the Revenue function in terms of price, p, using the price / number relationship
you found earlier. Simplify your equation. Explain how you arrived at the equation.
5. Graph the Revenue function. What do you notice about the graph? How does it
compare to the graph of the Price/Number sold function?
Draft 7-21-2010

Deriving the Revenue Function:
Teacher Notes –Revenue Function Worksheet
1. Students work in groups of 2 to 4.
2. Think-Pair-Share:
c. Students individually think about question 1 and jot down their ideas.
d. After a minute, they should share their thoughts with their partner.
e. Following pairs conferring, lead a whole class discussion regarding the
relationship.
i. Answers:
1. Revenue = (price of t-shirt)(number of t-shirts sold)
2. R=p⋅n
3. R( p )=p(−2 p+100 ); R( p )=−2 p2+100 p
Draft 7-21-2010

Algebra 2 Applications Lesson Plan OutlineLesson Title: Profit Modeling Lesson 4 – Maximizing Revenue
Washington State Algebra 2 Standard Name(s) and Number(s): (For Unit)A2.3.A - Translate between the standard form of a quadratic function, the vertex form, and the factored form; graph and interpret the meaning of each form.A2.3.B - Determine the number and nature of the roots of a quadratic function.A2.3.C - Solve quadratic equations and inequalities, including equations with complex roots.
Learning objective:Students will model the revenue of a project using a quadratic function. Students will maximize the revenue function by finding the vertex of the graph of the quadratic equation. Students will solve the quadratic function to find the feasible region using graphing, Zero Product Property, and Quadratic Formula.Students will determine the number and nature of the roots of a quadratic function.Students will translate a quadratic equation from standard form to vertex form and factored form.
Prerequisite Skills:Graph a simple quadratic functionFactor the greatest common factor from a polynomial expressionComplete the square
Material for Students:Maximizing Revenue WorksheetGraph paperGraphing CalculatorsAlgebra Tiles
Teaching Aids:Additional skill practice worksheets
Estimated Time For Completion:Two to three 55-minute periods depending upon context of class
References:I. PREASSESSMENT:
1. Have students graph a quadratic function such as y=−3x2+6 x−1 . Review components of the graph such as the line of symmetry, vertex, and zeros.
2. Factor −2 x2+10 x .
3. Solve x2+8 x−20=0 by completing the square.
II. INTRODUCTION: Maximizing Revenue Worksheet – Problem #1
Have students graph the function, and then discuss where they think the graph represents the maximum revenue. Discuss why the graph is quadratic, rather than linear.
III. LESSON: Maximizing Revenue Worksheet – Problems #2 & #3
4. Students work in groups of 2 to 4.5. Teach students how to translate standard form to vertex form by completing the square. f ( x )=a ( x−h )2+k .
a. Algebra tiles are an option to help the visual learner see the process.
Draft 7-21-2010

b. The vertex form of the function isR( p )=−2 (p−25 )2+1250 . The vertex is still (25, 1250). The vertex form of the equation gives the maximum value of the function directly.
i. Why is the vertex form preferable to the standard form to maximize revenue? 6. Teach students how to translate from standard form to factored form by factoring the greatest
common factor. Show them how to use the Zero Product Property to solve for the zeros of the function.
a. The factored form of the function isR( p )=−2 p ( p−50 ) . With this form, you can use the Zero Product Property to find the feasible region of t-shirt prices.
i. Why is this the feasible region to set the price of the t- shirts? ii. What do you do if you cannot factor the polynomial?
7. Teach students how to solve using the quadratic formula. a. Evaluate the discriminant to determine the number and nature of the roots.b. Discuss implications for irrational and complex roots within the Profit Modeling
scenario. i. What would you do if your revenue model had irrational or complex roots? ii. What could you adjust to make the model feasible to create a profit for your
company?8. Additional practice (worksheets, etc.): Homework, etc.
a. Translating from standard form to vertex and factored forms of quadratic equation. b. Solving quadratic equation using Zero Product Property and Quadratic Formula.
IV. APPLICATION:Maximizing Revenue Worksheet – Problems #4 & #51. Show students how to use the TABLE function of the graphing calculator to find the values
where the revenue will be at least $1,050. Compare to the graph. c. Answer: According to the model, the project will make at least $1,050 if the price of
the t-shirts is between $15 and $352. Encourage students to use all forms of the equations, the graph of the function with important
points labeled as evidence. Possibly assign Question 5 as homework.
V. ASSESSMENT:1. EXIT Quiz/Reflection: Teacher gives students several minutes to answer the following
questions and turn in as they exit the room or put in their notebooks.
a. Given f ( x )=−3x2+225x . Translate the function to vertex form. What is the location of the vertex? Explain the significance of the vertex of the function.
b. Given f ( x )=−3x2+225x . Translate the function to factored form. What are the zeros of the function? What is the significance of the zeros of the function?
c. Graph the function f ( x )=−3x2+225x using the vertex and the zeros.
VI. EXTENSIONS:
Based on: CURRICULUM GUIDE FOR PROFESSIONAL TECHNICAL COLLEGE INSTRUCTORSTEACHING & FACILITATING LEARNING - LEVEL I
Draft 7-21-2010

Maximizing Revenue:
Maximizing Revenue Worksheet
The ASB wants to predict the maximum revenue they could expect from the business model.
1. Use a graphing calculator to graph the Revenue function found in yesterday’s lesson.
Sketch your graph on graph paper using the following components of the graph:
a. Find the vertex of the graph. Use the CALC function of the graphing calculator to
find the maximum.
b. What is the real-world meaning of the vertex?
c. Where does the graph cross the x-axis? Use the CALC function of the graphing
calculator to find the Zeros.
d. What is the real-world meaning of the zeros?
2. Translate the standard form of the Revenue function to vertex form.
a. Explain how this equation can help you in your quest to maximize the revenue
generated by the t-shirt sales. What information can you get from the vertex
form of the equation?
b. Graph the vertex form with your graphing calculator. How does the graph
compare to the one you drew in question 1a? Should it change? Why?
Draft 7-21-2010
3. Translate the standard form of the Revenue function to the factored form.
a. Explain how this equation can help you in your quest to find the feasible region
of the t-shirt prices.
b. Graph the factored form with your graphing calculator. How does the graph
compare to the one you drew in question 1a? Should it change? Why?
4. The ASB discussed the feasibility of their business model. They decided to use the model
to decide how much to charge for the t-shirts if they want to make at least $1,050, the
cost of the D-jay for Senior Prom. What is the price range for the t-shirts that should
generate enough revenue to cover the cost of the d-jay? Explain how you decided.
5. Write a recommendation to the Senior Class Advisor regarding the price the Senior Class
ASB should charge for the t-shirts and the expected revenue that will be generated. Be
sure to support your recommendation with evidence to support your decision.
Draft 7-21-2010

Teacher Notes – Maximizing Revenue
1. Notes:
a. Encourage students to explore with window settings so they can see the
important components of the graph. Setting the window at Xmin = -2, Xmax = 55,
Ymin = -200, Ymax = 1300 will reveal the entire graph.
i. Why did we have to zoom the window out so far?
ii. What do the size of the graph components (y-intercept, x-intercepts,
vertex) mean to our model?
b. The vertex is at (25, 1250). This point of the graph represents the maximum
revenue of $1,250 when the price of the t-shirts is $25.
c. The x-intercepts are at 0 and 50. Discussion should include:
i. Why is this the feasible region?
1. The revenue between these points is positive. You cannot charge
less than $0. If you charge $50, nobody will purchase a t-shirt, so
you will not make any revenue at this price or higher.
ii. What would happen if the solutions where different such as one
solution? Negative solutions? No real solution?
2. The vertex form of the function is R( p )=−2 (p−25 )2+1250 . The vertex is still (25,
1250). The vertex form of the equation gives the maximum value of the function
directly.
3. The factored form of the function is R( p )=−2 p ( p−50 ) . With this form, you can use
the Zero Product Property to find the feasible region of t-shirt prices.
4. Show students how to use the TABLE function of the graphing calculator to find the
values where the revenue will be at least $1,050. Compare to the graph.
a. Answer: According to the model, the project will make at least $1,050 if the price
of the t-shirts is between $15 and $35.
5. Encourage students to use all forms of the equations, the graph of the function with
important points labeled as evidence. Possibly assign Question 5 as homework.
6. EXIT Quiz/Reflection: Teacher gives students several minutes to answer the following
questions and turn in as they exit the room or put in their notebooks.
Draft 7-21-2010

d. Given f ( x )=−3x2+225x . Translate the function to vertex form. What is the
location of the vertex? Explain the significance of the vertex of the function.
e. Given f ( x )=−3x2+225x . Translate the function to factored form. What are
the zeros of the function? What is the significance of the zeros of the function?
f. Graph the function f ( x )=−3x2+225x using the vertex and the zeros.
7. Additional practice (worksheets, etc.): Homework, etc.
a. Translating from standard form to vertex and factored forms of quadratic equation.
b. Solving quadratic equation using Zero Product Property and Quadratic Formula.
Draft 7-21-2010

Algebra 2 Applications Lesson Plan OutlineLesson Title: Profit Modeling Culminating Project: Maximizing Profit
Washington State Algebra 2 Standard Name(s) and Number(s): (For Unit)A2.3.A - Translate between the standard form of a quadratic function, the vertex form, and the factored form; graph and interpret the meaning of each form.A2.3.B - Determine the number and nature of the roots of a quadratic function.A2.3.C - Solve quadratic equations and inequalities, including equations with complex roots.
Learning objective:Students will model the profit of a project using a quadratic function. Students will maximize the profit function by finding the vertex of the graph of the quadratic equation. Students will solve the quadratic function to find the feasible region.Students will translate a quadratic equation from standard form to vertex form and factored form.
Prerequisite Skills:Graph a quadratic function. Find vertex and zeros of a quadratic function. Translate between standard form and vertex form and factored form of a quadratic function.
Material for Students:Culminating Project Worksheet and RubricGraph paperGraphing Calculators
Teaching Aids:
Estimated Time For Completion:Two 55-minute periods
References:VII. PREASSESSMENT:
Have students graph a quadratic function such as y=x2−x−20 . Review components of the
graph such as the line of symmetry, vertex, and roots.
VIII. INTRODUCTION: Go over the Culminating Project Worksheet with the class. Stress the similarities in the process that created and maximized the Revenue function.
IX. LESSON:
X. APPLICATION
XI. ASSESSMENTStudents work individually to complete the Culminating Project as final unit assessment.
XII. EXTENSIONS
Based on: CURRICULUM GUIDE FOR PROFESSIONAL TECHNICAL COLLEGE INSTRUCTORSTEACHING & FACILITATING LEARNING - LEVEL I
Draft 7-21-2010

Culminating Project Worksheet: The Profit Function
The Senior Class ASB took their data and information to the Senior Class Advisor, Mrs. Smith,
for her approval of the project. Mrs. Smith studied their work and noticed a serious omission –
the report does not consider any costs!
Spirit Week is nearing and the ASB officers must hurry. They called several t-shirt shops and
settled on Sunshine Printing Company. They determined that the shirts would cost $2 each.
There is also a set – up fee of $188. The set-up fee is due to the printer as soon as the order is
place, regardless of the number of shirts printed.
Your job is to create a new model for the t-shirt project and analyze the model to determine
the maximum amount of projected profit. You will write a report (minimum of two-pages) that
summarizes your recommendations. The report will include evidence in the form of graphs and
equations in various forms to support your findings. You will also want to comment on the
reasonableness of your model and the projected outcome. Note how confident you are in
actually making this amount of money.
This is an individual assessment of your ability to create and analyze quadratic functions. Your
report should include, but not limited to:
1. Cost function
2. Profit function (standard form)
3. Maximize profit (vertex form of Profit function)
4. Break-even analysis (factored form of Profit function)
5. Graph of Profit function with key components labeled
6. Written analysis
Draft 7-21-2010

Culminating Project Rubric
Objective Beginning Approaching Meeting ExceedingModel profit using a quadratic function.
Student creates model of linear cost function and quadratic profit function with conceptual error. Supporting work not included.
Student creates model of linear cost function and quadratic profit function with minor error. Supporting work missing elements.
Student creates model of linear cost function and quadratic profit function. Supporting work demonstrates understanding, but may be missing elements.
Student creates model of linear cost function and quadratic profit function. Supporting work and analysis demonstrates understanding.
Analyze components of quadratic function to find maximum profit and feasible production region.
Student finds vertex and roots of profit function with conceptual error. Supporting work not included.
Student maximizes profit function by finding vertex. Finds roots of profit function to find feasible production region.Work has minor error. Supporting work missing elements.
Student maximizes profit function by finding vertex. Finds roots of profit function to find feasible production region. Supporting work demonstrates understanding, but may be missing elements.
Student maximizes profit function by finding vertex. Finds roots of profit function to find feasible production region. Supporting work and analysis demonstrates understanding.
Translate from standard form to vertex form and factored form of a quadratic equation.
Student translates quadratic equation from standard form to vertex form and factored form with conceptual error. Supporting work not included.
Student translates quadratic equation from standard form to vertex form and factored form with minor error. Supporting work missing elements.
Student translates quadratic equation from standard form to vertex form and factored form. Supporting work demonstrates understanding, but may be missing elements.
Student translates quadratic equation from standard form to vertex form and factored form. Supporting work and analysis demonstrates understanding of process as well as advantages to each form.
Draft 7-21-2010

Algebra 2 Applications Lesson Plan OutlineLesson Title: Profit Modeling – Skills Test Assessment
Washington State Algebra 2 Standard Name(s) and Number(s): (For Unit)A2.3.A - Translate between the standard form of a quadratic function, the vertex form, and the factored form; graph and interpret the meaning of each form.A2.3.B - Determine the number and nature of the roots of a quadratic function.A2.3.C - Solve quadratic equations and inequalities, including equations with complex roots.
Learning objective:Students will model the profit of a project using a quadratic function. Students will maximize the profit function by finding the vertex of the graph of the quadratic equation. Students will solve the quadratic function to find the feasible region.Students will translate a quadratic equation from standard form to vertex form and factored form.
Prerequisite Skills:
Material for Students:Pencil and paper skills testGraph paperGraphing Calculators
Teaching Aids:
Estimated Time For Completion:One 55-minute period
References:I. PREASSESSMENT:
II. INTRODUCTION:
III. LESSON:
IV. APPLICATION:
V. ASSESSMENT:Students complete pencil and paper skills test per district curriculum.
VI. EXTENSIONS:
Based on: CURRICULUM GUIDE FOR PROFESSIONAL TECHNICAL COLLEGE INSTRUCTORSTEACHING & FACILITATING LEARNING - LEVEL I
Draft 7-21-2010