webinar: how social media activity predicts concert ticket sales
TRANSCRIPT
www.facegroup.com
www.pulsarplatform.com
SOCIAL SALES STUDY How social media activity connects to concert ticket sales
by Jessica Owens & Sameer Shah

What we did
We partnered with an events
company to demonstrate how
levels of social media activity can
predict ticket sales.
The hypothesis: social media
drives awareness that can
contribute to increased sales.
We used Pulsar, our proprietary
Social Data Intelligence platform,
to track the social media
discussion around three specific
concerts.
We analysed the entire online
ecosystem, including Twitter,
Facebook, Tumblr, YouTube, as
well as forums, blogs and news
sites.
We explored the correlation
between the volume of social
media messages about concerts
and ticket sales for these events.
Our method then used R-
squared statistical tests on data
normalised logarithmically to
control for irregular distributions.:
UK tour of a top
female pop artist
(female audience,
aged 18-24)
A 1970’s rock band
(predominantly
male audience,
30s-50s)
A 2014 rock
festival
www.facegroup.com
www.pulsarplatform.com

The rock festival: The daily level of social media activity spikes dramatically
when acts are announced
0
2000
4000
6000
8000
10000
12000
14-Oct 21-Oct 28-Oct 04-Nov 11-Nov 18-Nov 25-Nov 02-Dec 09-Dec 16-Dec 23-Dec 30-Dec
Social mediamessages
3rd announcement
of acts
2nd announcement
of acts
1st announcement of acts,
plus early-bird tickets
notification
Source: Festival 2014 data, Date range: 14 Oct – 31 Dec 2013
www.facegroup.com
www.pulsarplatform.com
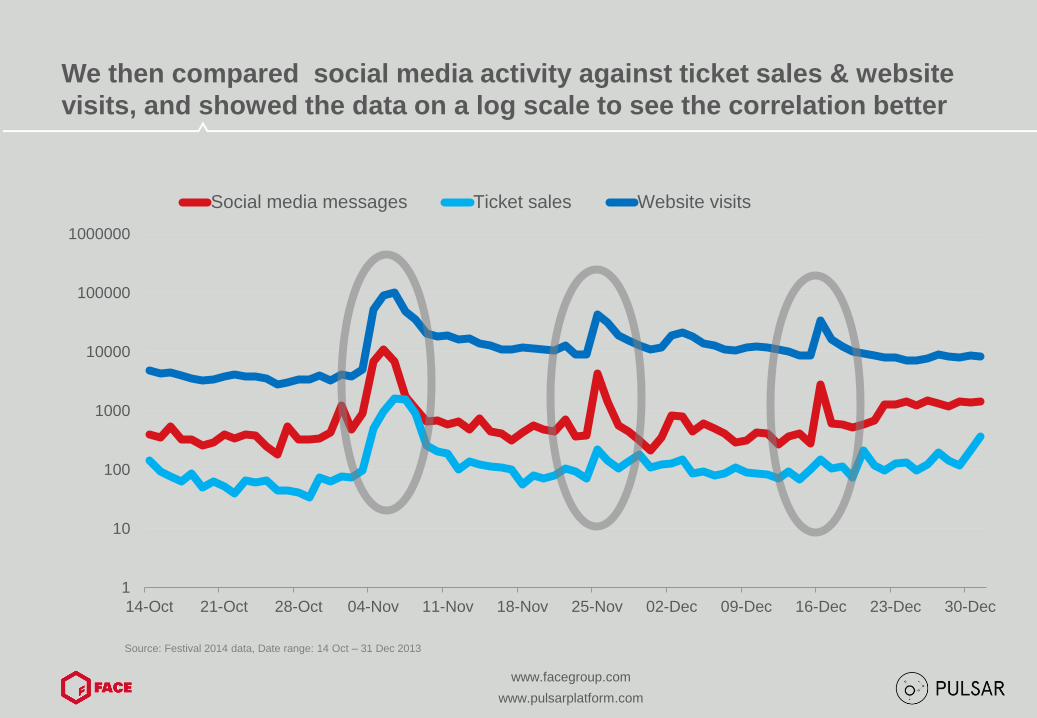
We then compared social media activity against ticket sales & website
visits, and showed the data on a log scale to see the correlation better
1
10
100
1000
10000
100000
1000000
14-Oct 21-Oct 28-Oct 04-Nov 11-Nov 18-Nov 25-Nov 02-Dec 09-Dec 16-Dec 23-Dec 30-Dec
Social media messages Ticket sales Website visits
Source: Festival 2014 data, Date range: 14 Oct – 31 Dec 2013
www.facegroup.com
www.pulsarplatform.com

Plotting each day's "pair" of social volumes & ticket sales shows there
is a 53% correlation between ticket sales and social media conversation
R² = 0.5259
0.0
0.5
1.0
1.5
2.0
2.5
3.0
3.5
0.0 0.5 1.0 1.5 2.0 2.5 3.0 3.5 4.0 4.5
Social media messages (log)
Ticket sales (log)
Source: Festival 2014 data,
Date range: 14 Oct – 31 Dec 2013
www.facegroup.com
www.pulsarplatform.com

To put this in context… Social media activity links to ticket sales almost as
strongly as visits to the ticket sales website (61% correlation)
Source: Festival 2014 data,
Date range: 14 Oct – 31 Dec 2013
61% 53%
Website visits Social media messages
www.facegroup.com
www.pulsarplatform.com
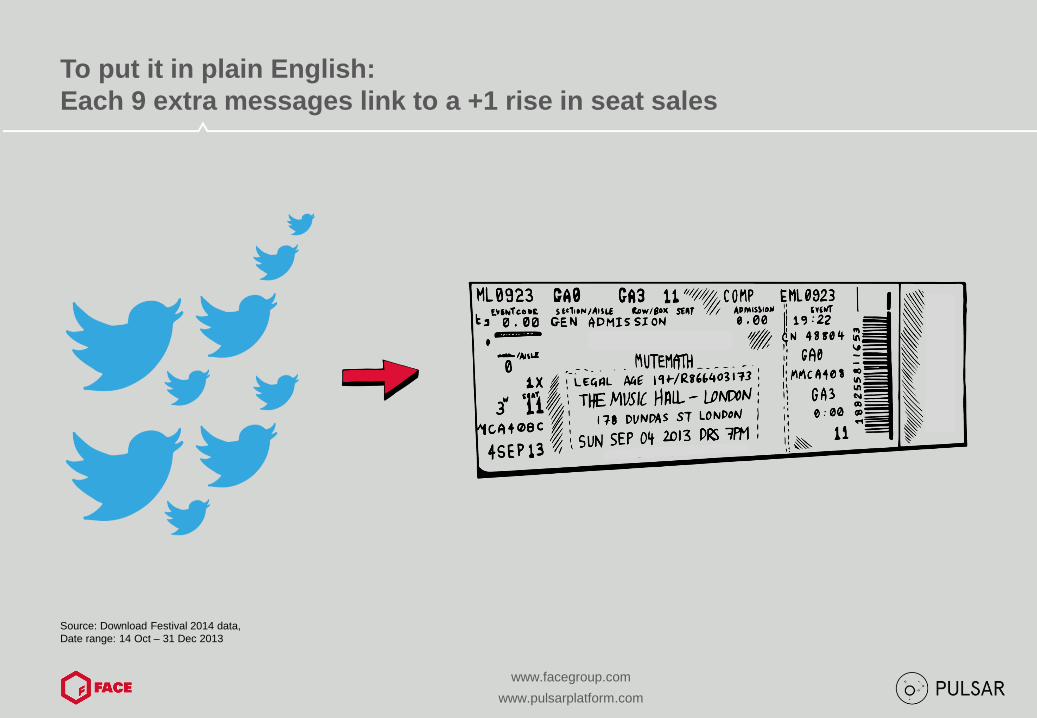
To put it in plain English:
Each 9 extra messages link to a +1 rise in seat sales
Source: Download Festival 2014 data,
Date range: 14 Oct – 31 Dec 2013
www.facegroup.com
www.pulsarplatform.com
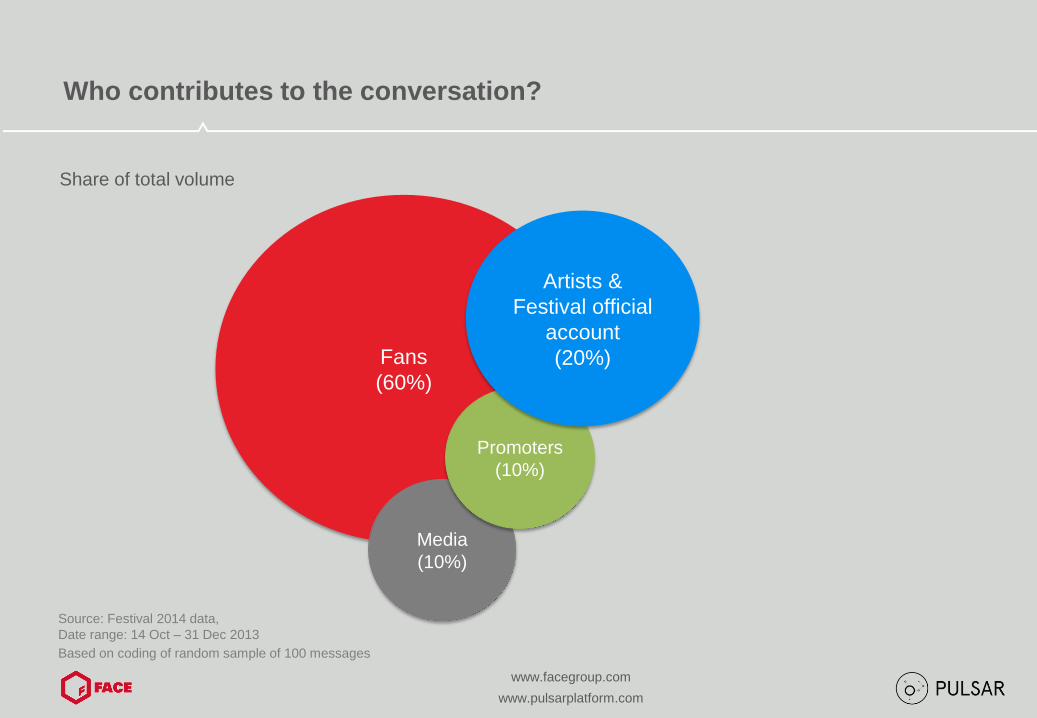
Who contributes to the conversation?
Source: Festival 2014 data,
Date range: 14 Oct – 31 Dec 2013
Share of total volume
www.facegroup.com
www.pulsarplatform.com
Fans
(60%)
Based on coding of random sample of 100 messages
Media
(10%)
Promoters
(10%)
Artists &
Festival official
account
(20%)
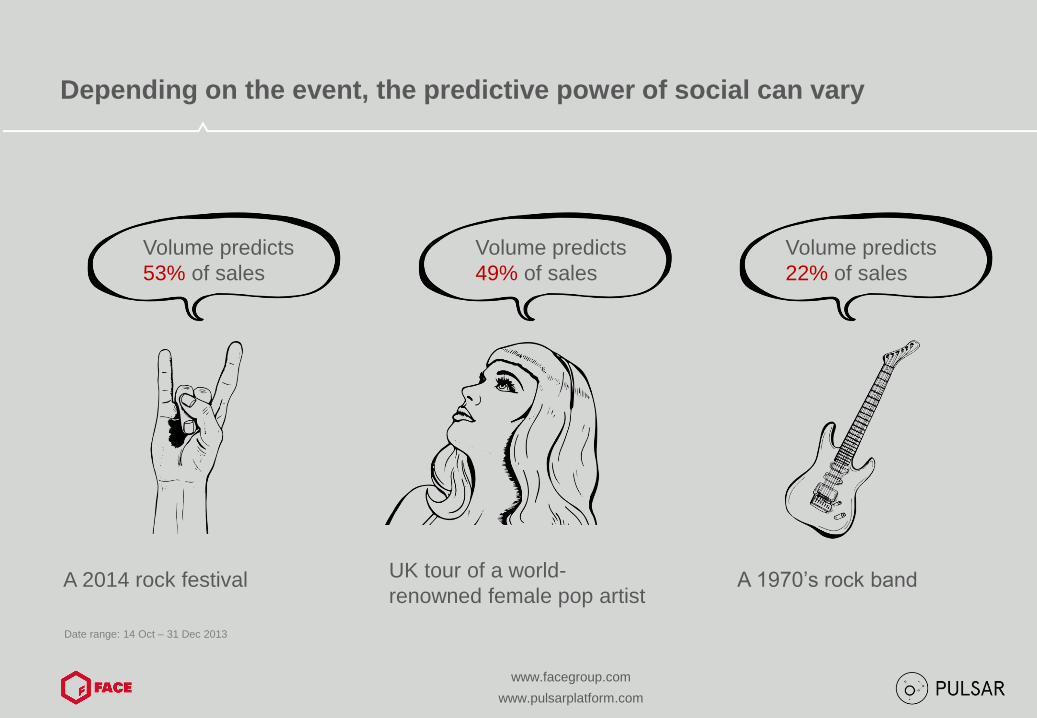
Depending on the event, the predictive power of social can vary
Date range: 14 Oct – 31 Dec 2013
UK tour of a world-
renowned female pop artist A 1970’s rock band A 2014 rock festival
Volume predicts
53% of sales
Volume predicts
49% of sales
Volume predicts
22% of sales
www.facegroup.com
www.pulsarplatform.com

Reason 1: Relevance
Social media discussion has to be tightly focused on the event itself
www.facegroup.com
www.pulsarplatform.com
All discussion about the rock festival is about the concert event. There's no
other way people can mention it. So this even saw the strongest correlation
with sales figures (53%).
But for our pop artist, initial analysis of all social media buzz
about the artist found no correlation with UK tour sales at all.
It's only when we narrowed the social data down to specific
mentions of the tour by name, and in the UK only, that the
strongest relationship with social media data emerged.
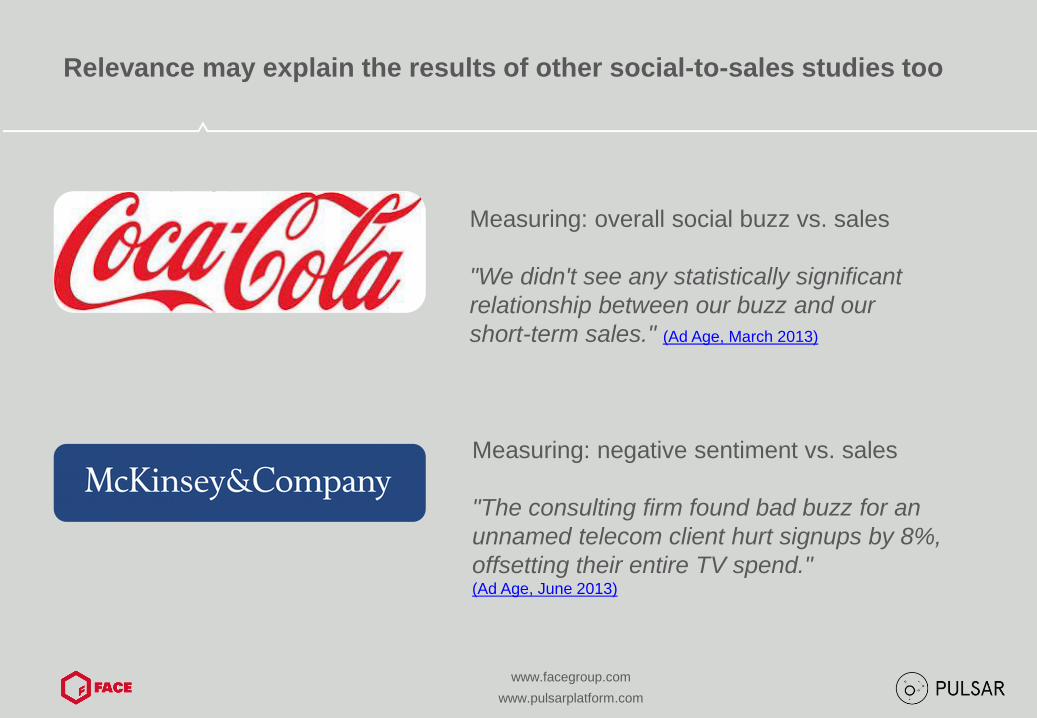
Relevance may explain the results of other social-to-sales studies too
www.facegroup.com
www.pulsarplatform.com
Measuring: overall social buzz vs. sales
"We didn't see any statistically significant
relationship between our buzz and our
short-term sales." (Ad Age, March 2013)
Measuring: negative sentiment vs. sales
"The consulting firm found bad buzz for an
unnamed telecom client hurt signups by 8%,
offsetting their entire TV spend." (Ad Age, June 2013)

Reason 2: Demographics
Social predicts sales best for a younger audience who use it more
Source: Kantar & TNS Omnibus study for eMarketer, 2013
Age 65+
26% use
social
networks
6%
use
Age 18-24
95% use social networks
39% use Twitter
Social media demographics by age:
www.facegroup.com
www.pulsarplatform.com

In the case of the 1970’s rock band, news visibility is the most predictive
factor – still indicating that awareness is still key to sales
Source: A 1970s Rock band data,
Date range: Date range: 13 Nov – 15 Jan
R² = 0.298
0.0
0.5
1.0
1.5
2.0
2.5
3.0
3.5
4.0
4.5
0.0 0.5 1.0 1.5 2.0 2.5 3.0 3.5 4.0 4.5
UK visibility (log)
Ticket sales (log)
The older audience is less present on social networks like Twitter or Facebook – news may be
a more relevant channel. News sites tend to have high visibility, Pulsar's proprietary metric for
establishing content's influence and reach.
While social media volumes correlated only 22% with sales, that rises to 30% when using
visibility, which weights the impact of the media most relevant to this audience more highly.
www.facegroup.com
www.pulsarplatform.com

Other studies have also found stronger relationships when they look
beyond just social media volume
www.facegroup.com
www.pulsarplatform.com
Measuring: social media shares vs. sales
In the UK:
A Facebook share generates £2.25 in
additional gross ticket sales
Twitter - £1.80
LinkedIn - £1.24 (Techcrunch, April 2012)
Measuring: influencers' messages vs. sales
"The number of overall Twitter mentions is a
poor predictor of box office sales [for Hollywood
films]. What did correlate to box office success
was the number of tweets from influential
tastemakers." (Readwrite.com, Dec 2012)
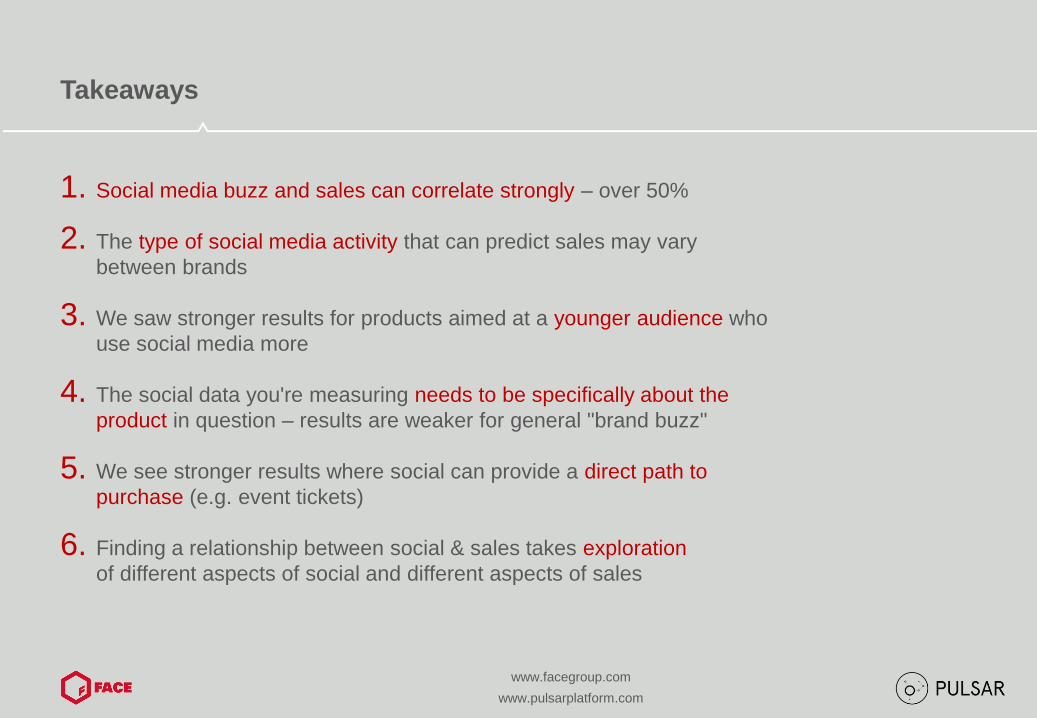
Takeaways
1. Social media buzz and sales can correlate strongly – over 50%
2. The type of social media activity that can predict sales may vary
between brands
3. We saw stronger results for products aimed at a younger audience who
use social media more
4. The social data you're measuring needs to be specifically about the
product in question – results are weaker for general "brand buzz"
5. We see stronger results where social can provide a direct path to
purchase (e.g. event tickets)
6. Finding a relationship between social & sales takes exploration
of different aspects of social and different aspects of sales
www.facegroup.com
www.pulsarplatform.com
THANK YOU
Research team:
Jessica Owens (@hautepop)
Sameer Shah (@thesquidboylike)
If you want to find out more about this study
or about our research in general, please get
in touch at [email protected].