webreep online consumer behaviour country comparison report
TRANSCRIPT

Webreep Online Consumer Behaviour Country Comparison Report
2011-2012
www.webreep.com
2
Country Comparison 2011-2012
Contents Introduction ................................................................................................................................................... 4
About Webreep .......................................................................................................................................... 4
The Webreep Model .................................................................................................................................. 4
Spain .......................................................................................................................................................... 7
Low Visual Attractiveness (and high correlation with satisfaction) ......................................................... 8
High Ease of Use/High Ease of Search ....................................................................................................... 8
Low Information Quality ............................................................................................................................ 9
France ......................................................................................................................................................10
High Word of Mouth .................................................................................................................................11
Strong Correlation between Attractiveness and Satisfaction ..................................................................11
High Quality of Information ......................................................................................................................11
Germany ..................................................................................................................................................12
Low Information Quality ...........................................................................................................................13
Low Page Load Scores ...............................................................................................................................13
High Correlation between Word-of-mouth and Satisfaction ...................................................................13
USA ..........................................................................................................................................................15
High Level of Trust ....................................................................................................................................16
High Perceptions of Website Attractiveness ............................................................................................16
Low Quality of Information.......................................................................................................................16
Ease-of-use, Satisfaction, Word-of-Mouth, and Loyalty ..........................................................................16
Australia...................................................................................................................................................18
High Ease of Use, Low Satisfaction ..........................................................................................................19
Low Trust ..................................................................................................................................................19
Low Loading Speed ...................................................................................................................................20
China ........................................................................................................................................................21
Low Page Load Speed Tolerance ..............................................................................................................22
Very High correlation between Information Quality and Satisfaction .....................................................22
Strong correlation between trust and satisfaction ...................................................................................22
High Loyalty ..............................................................................................................................................22
Russia .......................................................................................................................................................23
High Ease of Use/but not Correlation with Satisfaction .........................................................................24
Low Correlation between Trust and Satisfaction ....................................................................................24
General Observations ...................................................................................................................................25
Reference List ...............................................................................................................................................27

3
Country Comparison 2011-2012
4
Country Comparison 2011-2012
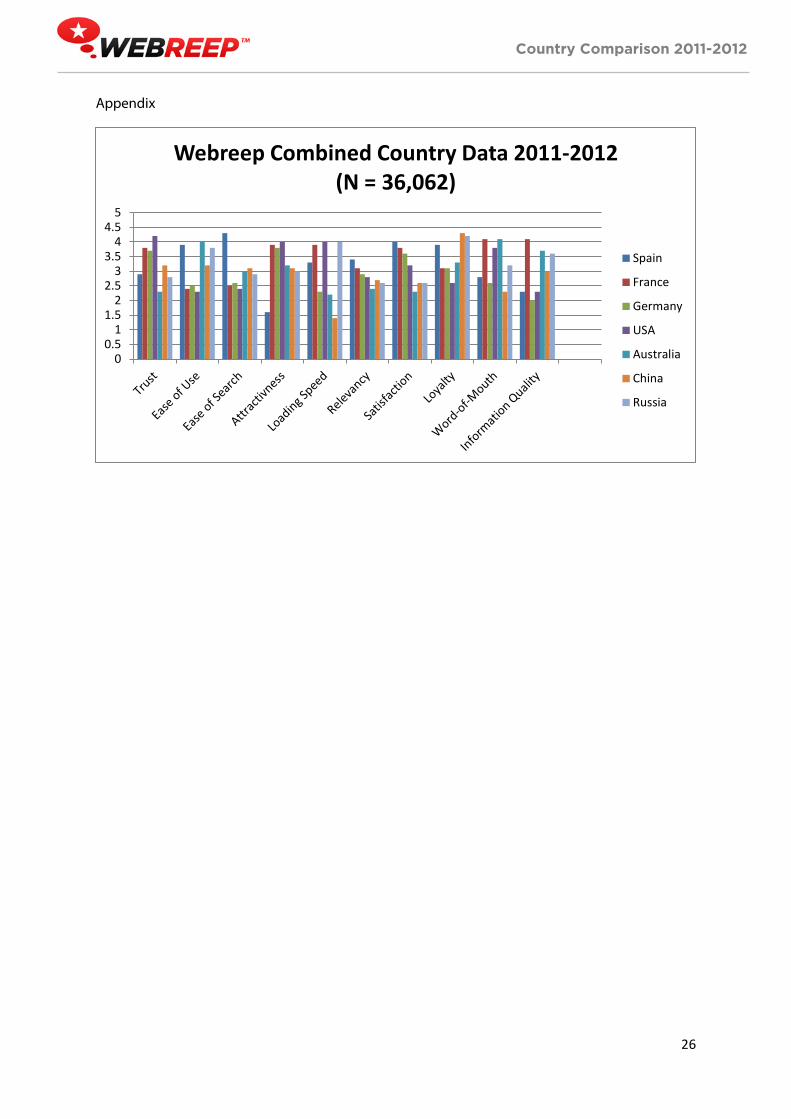
Introduction The following report analyses and compares the behaviour of 36,062 online consumers from around the world. Data were collected between May 2011 and May 2012 using the Webreep website feedback tool (www.webreep.com). Seven countries, referred to herein as the reference countries, are included in the analysis. The purpose of this report is to identify region specific behavioural differences between the reference countries.
About Webreep Webreep is a customer feedback tool that collects customer experience data from websites spanning 30 different industries across the internet. The primary method of data collection is through customer feedback survey, though foot-printing methods are also used. Using a complex array of algorithms based on the Webreep model, the purpose of Webreep is to detect website dissatisfaction, identify what factors cause loyalty and word-of-mouth, and identify how websites in different industries compare to each other. Webreep is a multiple language tool, operating in North America, Latin America, Western Europe, United Kingdom, and Chinese speaking countries in Asia.
The Webreep Model The Webreep customer feedback tool is based on The Webreep Model, developed by Dr Brent Coker from the University of Melbourne1. The purpose of the Webreep model is to identify how consumers behave when they visit a website, with emphasis on explaining and predicting satisfaction, loyalty, and likelihood of referral. The Webreep Model is depicted in Figure 1.
5
Country Comparison 2011-2012
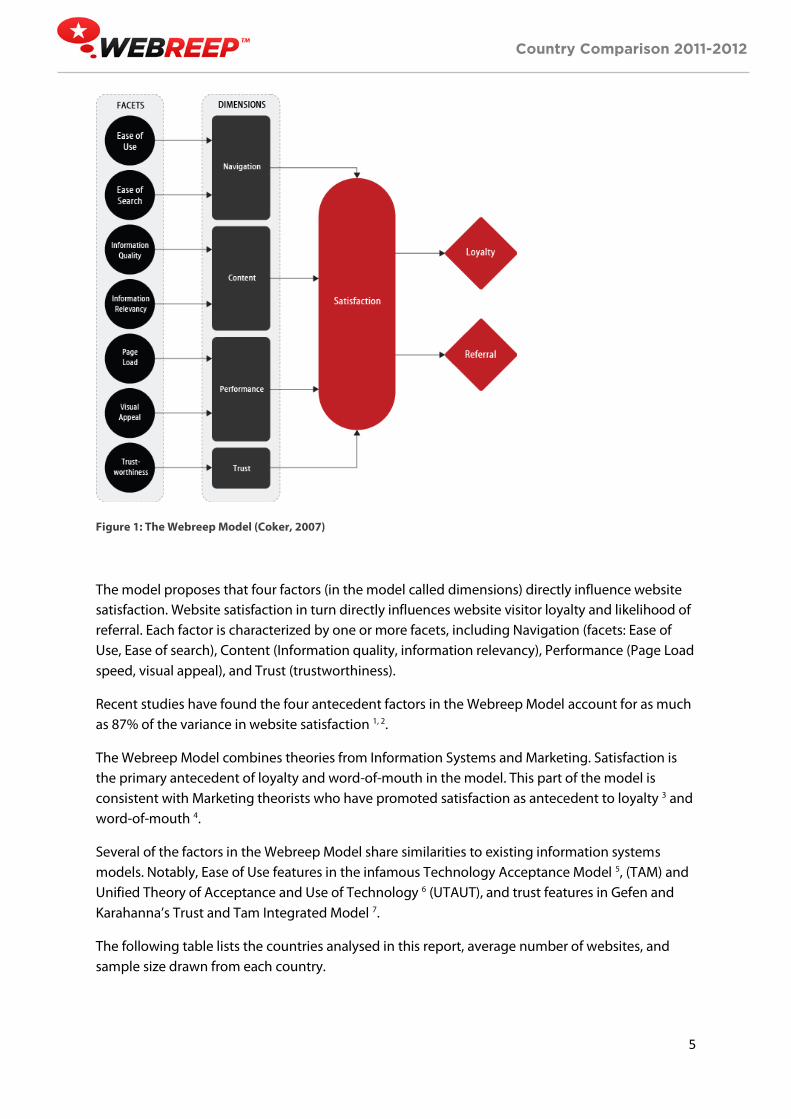
Figure 1: The Webreep Model (Coker, 2007)
The model proposes that four factors (in the model called dimensions) directly influence website satisfaction. Website satisfaction in turn directly influences website visitor loyalty and likelihood of referral. Each factor is characterized by one or more facets, including Navigation (facets: Ease of Use, Ease of search), Content (Information quality, information relevancy), Performance (Page Load speed, visual appeal), and Trust (trustworthiness).
Recent studies have found the four antecedent factors in the Webreep Model account for as much as 87% of the variance in website satisfaction 1, 2.
The Webreep Model combines theories from Information Systems and Marketing. Satisfaction is the primary antecedent of loyalty and word-of-mouth in the model. This part of the model is consistent with Marketing theorists who have promoted satisfaction as antecedent to loyalty 3 and word-of-mouth 4.
Several of the factors in the Webreep Model share similarities to existing information systems models. Notably, Ease of Use features in the infamous Technology Acceptance Model 5, (TAM) and Unified Theory of Acceptance and Use of Technology 6 (UTAUT), and trust features in Gefen and Karahanna’s Trust and Tam Integrated Model 7.
The following table lists the countries analysed in this report, average number of websites, and sample size drawn from each country.
6
Country Comparison 2011-2012
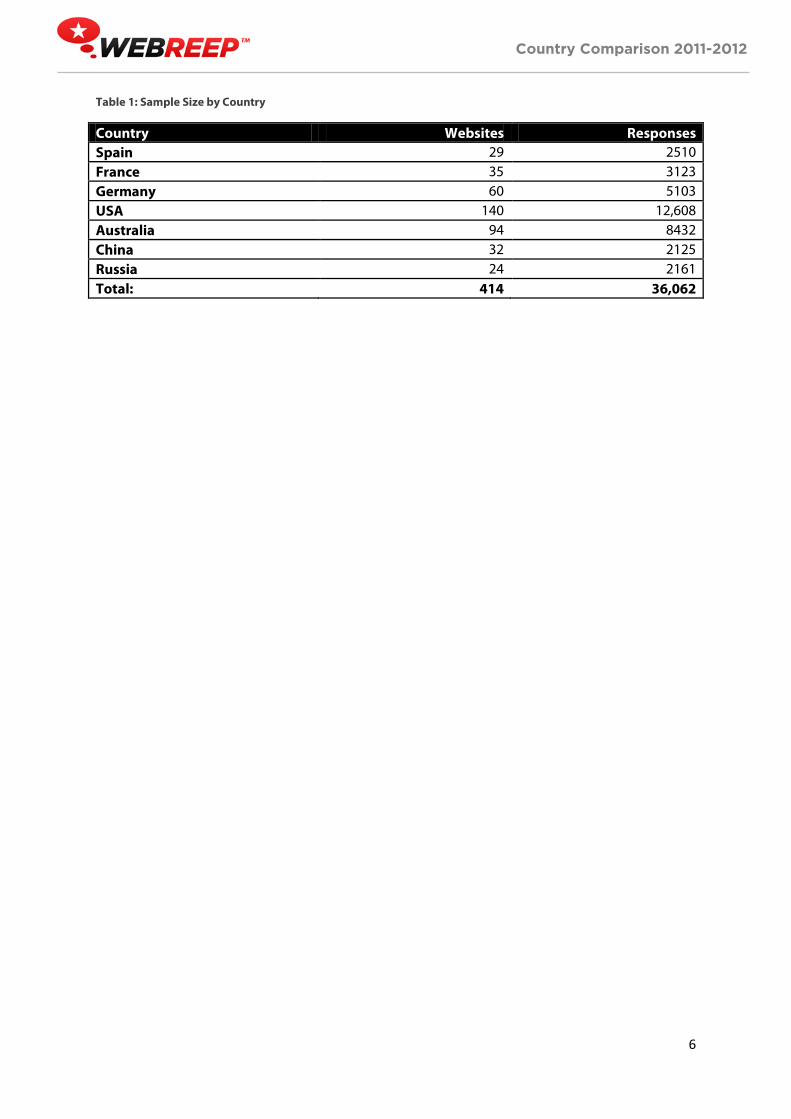
Table 1: Sample Size by Country
Country Websites Responses Spain 29 2510 France 35 3123 Germany 60 5103 USA 140 12,608 Australia 94 8432 China 32 2125 Russia 24 2161 Total: 414 36,062
7
Country Comparison 2011-2012
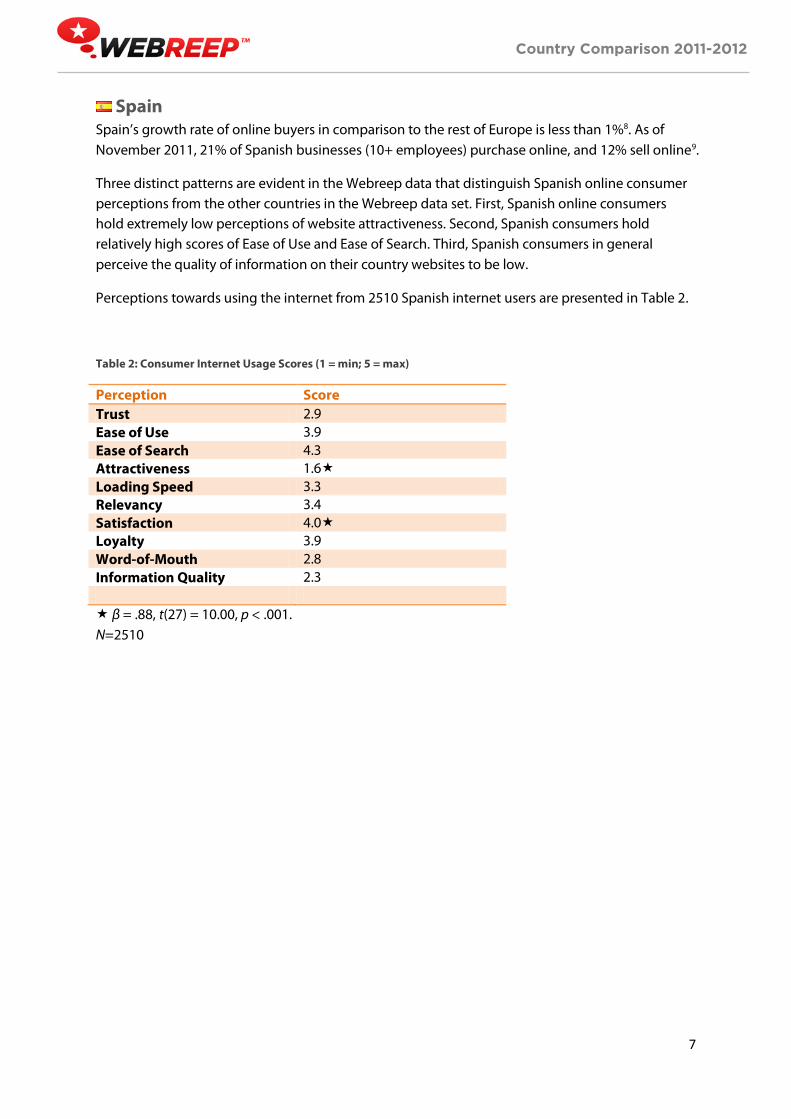
Spain Spain’s growth rate of online buyers in comparison to the rest of Europe is less than 1%8. As of November 2011, 21% of Spanish businesses (10+ employees) purchase online, and 12% sell online9.
Three distinct patterns are evident in the Webreep data that distinguish Spanish online consumer perceptions from the other countries in the Webreep data set. First, Spanish online consumers hold extremely low perceptions of website attractiveness. Second, Spanish consumers hold relatively high scores of Ease of Use and Ease of Search. Third, Spanish consumers in general perceive the quality of information on their country websites to be low.
Perceptions towards using the internet from 2510 Spanish internet users are presented in Table 2.
Table 2: Consumer Internet Usage Scores (1 = min; 5 = max)
Perception Score Trust 2.9 Ease of Use 3.9 Ease of Search 4.3 Attractiveness 1.6 Loading Speed 3.3 Relevancy 3.4 Satisfaction 4.0 Loyalty 3.9 Word-of-Mouth 2.8 Information Quality 2.3 β = .88, t(27) = 10.00, p < .001. N=2510

8
Country Comparison 2011-2012
Figure 2: Bar graph comparison of website quality perceptions and intentions
Low Visual Attractiveness (and high correlation with satisfaction) The Spanish score for website attractiveness is 1.6 out of 5. This is the lowest website attractiveness score out of all the countries included in this report, 59% lower than France, 57% lower than the Germans, and 60% lower than the Americans.
Interestingly, attractiveness is also very strongly correlated with satisfaction. In comparison to the other reference countries, this suggests that the Spanish are unusually critical towards website design since attractiveness results in a much stronger sense of satisfaction. There is no evidence to suggest that Spanish websites are overall less attractive than the websites of other nationalities, adding weight to this interpretation.
Good design done well evokes a strong sense of satisfaction, while mediocre or poor design evokes a strong sense of dissatisfaction. Interestingly, this interpretation shares similarities to Spain’s unique cultural and business philosophy. Spain’s retail success Zara for example exemplifies high quality design and business execution, consistent with Spain’s cultural sense of style and pride. The low attractiveness website evaluations combined with a sense of satisfaction suggests the Spanish have a well-developed sense of style, with little tolerance for websites that do not meet stylistic expectations.
High Ease of Use/High Ease of Search The Spanish also have very high Ease-of-Use and Ease-of-Search scores. This suggests that the Spanish are quite sophisticated in the way that they use the internet in comparison to the reference countries. The Spanish culture is traditionally dominated by speed, from motor car racing to the quick reactions and focus of bull fighters. This is an interesting parallel to Spain’s apparently quick mastery of the internet.
00.5
11.5
22.5
33.5
44.5
5
Spain
Spain
9
Country Comparison 2011-2012
Low Information Quality The Spanish on the whole view the quality of information on their websites as low, despite no evidence to suggest that Spanish websites provide lower quality information than the rest of the world. In light of the high ease-of-use and ease-of-search scores this further highlights Spain’s degree of sophistication with regards to internet usage. Spain’s unusually high criticality of the internet suggests they are nation who not only have a well-developed sense of style, but also know exactly what they want.

10
Country Comparison 2011-2012
France France has a relatively advanced broadband network, performing above the EU average in terms of development and internet connections. France also has one of the highest growth rates in the EU for online shopping adoption, and one of the biggest percentages of population who buy online8. Nineteen percent of French businesses with more than 10 employees purchase online, while 12% sell online9.
Two distinct patterns unique to France are evident in the cross country comparison data. The first is that French have significantly higher word-of-mouth scores. The second is that the French have an unusually high correlation between website attractiveness and satisfaction.
Perceptions towards using the internet from 3123 French internet users are presented in Table 3.
Table 3: Consumer Internet Usage Scores (1 = min; 5 = max)
Perception Score Trust 3.8 Ease of Use 2.4 Ease of Search 2.5 Attractiveness 3.9 Loading Speed 3.9 Relevancy 3.1 Satisfaction 3.8 Loyalty 3.1 Word-of-Mouth 4.1 Information Quality 4.1 β = .88, t(32) = 11.02, p < .001. N=3123

11
Country Comparison 2011-2012
Figure 3: Bar graph comparison of website quality perceptions and intentions
High Word of Mouth The data suggests the French have the highest word-of-mouth scores shared with Australia. The French are compared to any of the other reference countries. They are 36% more talkative that the Germans, 32% more talkative than the Spanish.
This unique characteristic about French online consumer behaviour appears counter to stereotypical assumptions of the French being reserved in their willingness to share or communicate with others. The data suggests that, on the internet at least, French people are very sharing and friendly, more likely to communicate with other people than any other country.
Strong Correlation between Attractiveness and Satisfaction Of further interest is the very strong correlation between website attractiveness and satisfaction. Both website attractiveness, and general satisfaction scores are very high. Given a lack of evidence suggesting that French websites are objectively any more attractive than any other countries websites, then it must be assumed some other factors have influenced this unique result. The strong correlation between attractiveness and satisfaction suggests perhaps that the French derive abnormal amounts of satisfaction from attractiveness. Moreover, since French attractiveness scores are the highest out of all countries analysed, it appears the French might have a more liberal interpretation of attractiveness. If this interpretation is correct, then it would appear that the French stereotype of being romantic might actually hold some truth.
High Quality of Information The French are content with the quality of information online, perceiving it to be 51% better than the Germans, and 43% better than the Spanish and Americans.
00.5
11.5
22.5
33.5
44.5
5
France
France

12
Country Comparison 2011-2012
Germany Germany has a well-developed internet infrastructure, with annual growth of access to broadband exceeding the EU average. Forty percent of German businesses with 10 or more employees purchase online, and 22% of businesses sell online9. Adoption of the internet for shopping however remains stagnant at less than 1% per year8.
Three unique points of difference exist in the Webreep data. First, perceptions of internet information quality are extremely low. Second, page-load scores are extremely low, despite well-developed broad-band infrastructure and access. Third, there is a very high correlation between online word-of-mouth, and satisfaction.
Perceptions towards using the internet from 5103 German internet users are presented in Table 4 below.
Table 4: Consumer Internet Usage Scores (1 = min; 5 = max)
Perception Score Trust 3.7 Ease of Use 2.5 Ease of Search 2.6 Attractiveness 4.2 Loading Speed 4.3 Relevancy 2.9 Satisfaction 3.6 Loyalty 3.1 Word-of-Mouth 2.6 Information Quality 2.0 β = .76, t(58) = 9.04, p < .001. N=5103
13
Country Comparison 2011-2012
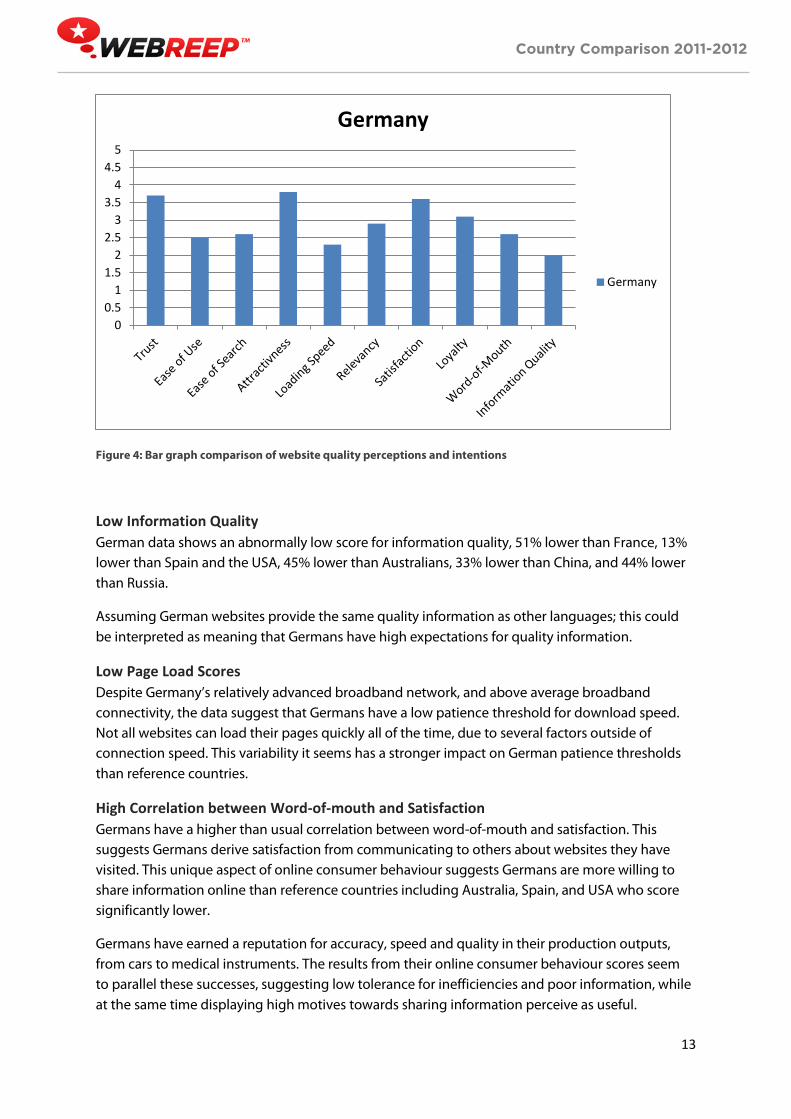
Figure 4: Bar graph comparison of website quality perceptions and intentions
Low Information Quality German data shows an abnormally low score for information quality, 51% lower than France, 13% lower than Spain and the USA, 45% lower than Australians, 33% lower than China, and 44% lower than Russia.
Assuming German websites provide the same quality information as other languages; this could be interpreted as meaning that Germans have high expectations for quality information.
Low Page Load Scores Despite Germany’s relatively advanced broadband network, and above average broadband connectivity, the data suggest that Germans have a low patience threshold for download speed. Not all websites can load their pages quickly all of the time, due to several factors outside of connection speed. This variability it seems has a stronger impact on German patience thresholds than reference countries.
High Correlation between Word-of-mouth and Satisfaction Germans have a higher than usual correlation between word-of-mouth and satisfaction. This suggests Germans derive satisfaction from communicating to others about websites they have visited. This unique aspect of online consumer behaviour suggests Germans are more willing to share information online than reference countries including Australia, Spain, and USA who score significantly lower.
Germans have earned a reputation for accuracy, speed and quality in their production outputs, from cars to medical instruments. The results from their online consumer behaviour scores seem to parallel these successes, suggesting low tolerance for inefficiencies and poor information, while at the same time displaying high motives towards sharing information perceive as useful.
00.5
11.5
22.5
33.5
44.5
5
Germany
Germany
14
Country Comparison 2011-2012

15
Country Comparison 2011-2012
USA According to the US Census bureau, the US continues to show strong growth in e-commerce, with retail sales accounting for 4.4% of total sales in 2010. This represents 16% increase in sales from 200910.
The notable difference in USA Webreep data compared to the reference countries is the unusually high level of trust, relatively high perceptions of website attractiveness, and low information quality perceptions. Also unique is a relatively high correlation between Ease-of-Use and Satisfaction, Ease-of-Use and loyalty, and Ease-of-Use and word-of-mouth.
Perceptions towards using the internet from 12,608 American internet users are presented in Table 5 below.
Table 5: Consumer Internet Usage Scores (1 = min; 5 = max)
Perception Score Trust 4.2 Ease of Use 2.3 †‡ Ease of Search 2.4 Attractiveness 4 Loading Speed 4 Relevancy 2.8 Satisfaction 3.2 Loyalty 2.6 † Word-of-Mouth 3.8 ‡ Information Quality 2.3 β = .53, t(138) = 5.60, p < .001. † β = .64, t(138) = 9.14, p < .001. ‡ β = .70, t(138) = 11.62, p < .001. N=12,608
16
Country Comparison 2011-2012
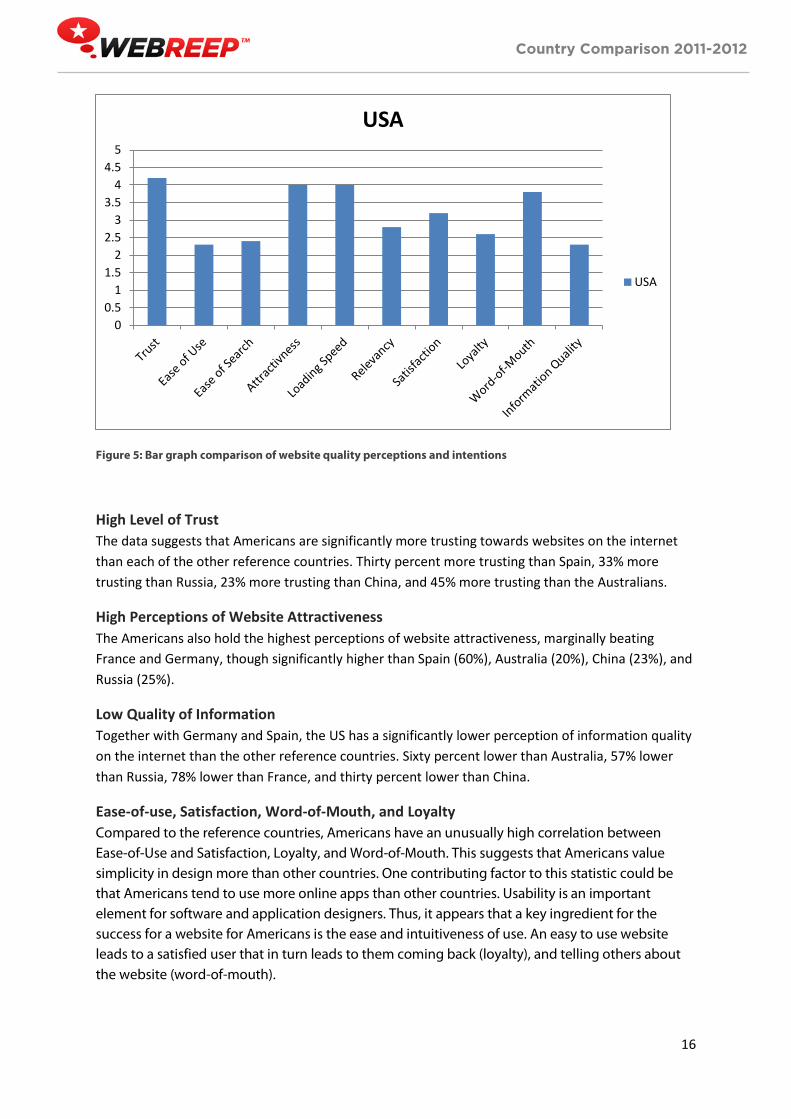
Figure 5: Bar graph comparison of website quality perceptions and intentions
High Level of Trust The data suggests that Americans are significantly more trusting towards websites on the internet than each of the other reference countries. Thirty percent more trusting than Spain, 33% more trusting than Russia, 23% more trusting than China, and 45% more trusting than the Australians.
High Perceptions of Website Attractiveness The Americans also hold the highest perceptions of website attractiveness, marginally beating France and Germany, though significantly higher than Spain (60%), Australia (20%), China (23%), and Russia (25%).
Low Quality of Information Together with Germany and Spain, the US has a significantly lower perception of information quality on the internet than the other reference countries. Sixty percent lower than Australia, 57% lower than Russia, 78% lower than France, and thirty percent lower than China.
Ease-of-use, Satisfaction, Word-of-Mouth, and Loyalty Compared to the reference countries, Americans have an unusually high correlation between Ease-of-Use and Satisfaction, Loyalty, and Word-of-Mouth. This suggests that Americans value simplicity in design more than other countries. One contributing factor to this statistic could be that Americans tend to use more online apps than other countries. Usability is an important element for software and application designers. Thus, it appears that a key ingredient for the success for a website for Americans is the ease and intuitiveness of use. An easy to use website leads to a satisfied user that in turn leads to them coming back (loyalty), and telling others about the website (word-of-mouth).
00.5
11.5
22.5
33.5
44.5
5
USA
USA
17
Country Comparison 2011-2012
This unique aspect of American online behaviour is consistent with previously released data that has found that a major source of frustration on the internet is inability to find information on a website 1. Ease-of-search and Ease-of-use are oftentimes correlated. The present data suggests that the websites we tend to want to visit again are also the easiest to use.
18
Country Comparison 2011-2012
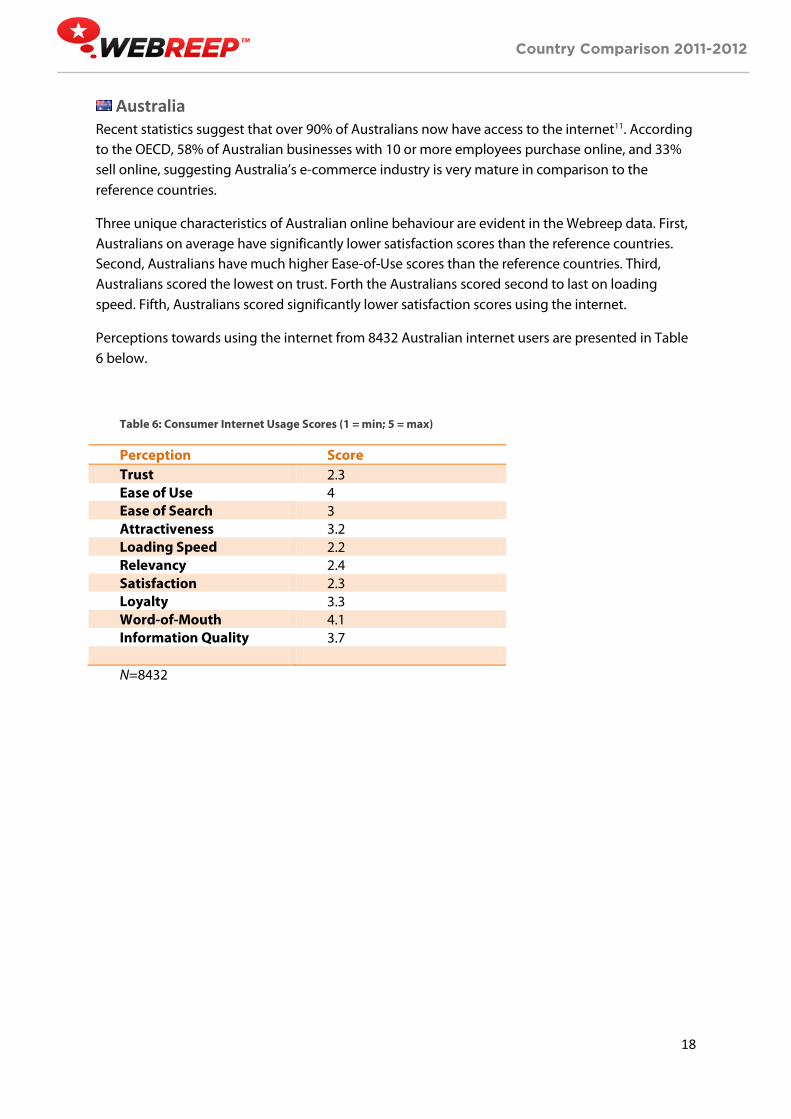
Australia Recent statistics suggest that over 90% of Australians now have access to the internet11. According to the OECD, 58% of Australian businesses with 10 or more employees purchase online, and 33% sell online, suggesting Australia’s e-commerce industry is very mature in comparison to the reference countries.
Three unique characteristics of Australian online behaviour are evident in the Webreep data. First, Australians on average have significantly lower satisfaction scores than the reference countries. Second, Australians have much higher Ease-of-Use scores than the reference countries. Third, Australians scored the lowest on trust. Forth the Australians scored second to last on loading speed. Fifth, Australians scored significantly lower satisfaction scores using the internet.
Perceptions towards using the internet from 8432 Australian internet users are presented in Table 6 below.
Table 6: Consumer Internet Usage Scores (1 = min; 5 = max)
Perception Score Trust 2.3 Ease of Use 4 Ease of Search 3 Attractiveness 3.2 Loading Speed 2.2 Relevancy 2.4 Satisfaction 2.3 Loyalty 3.3 Word-of-Mouth 4.1 Information Quality 3.7 N=8432
19
Country Comparison 2011-2012
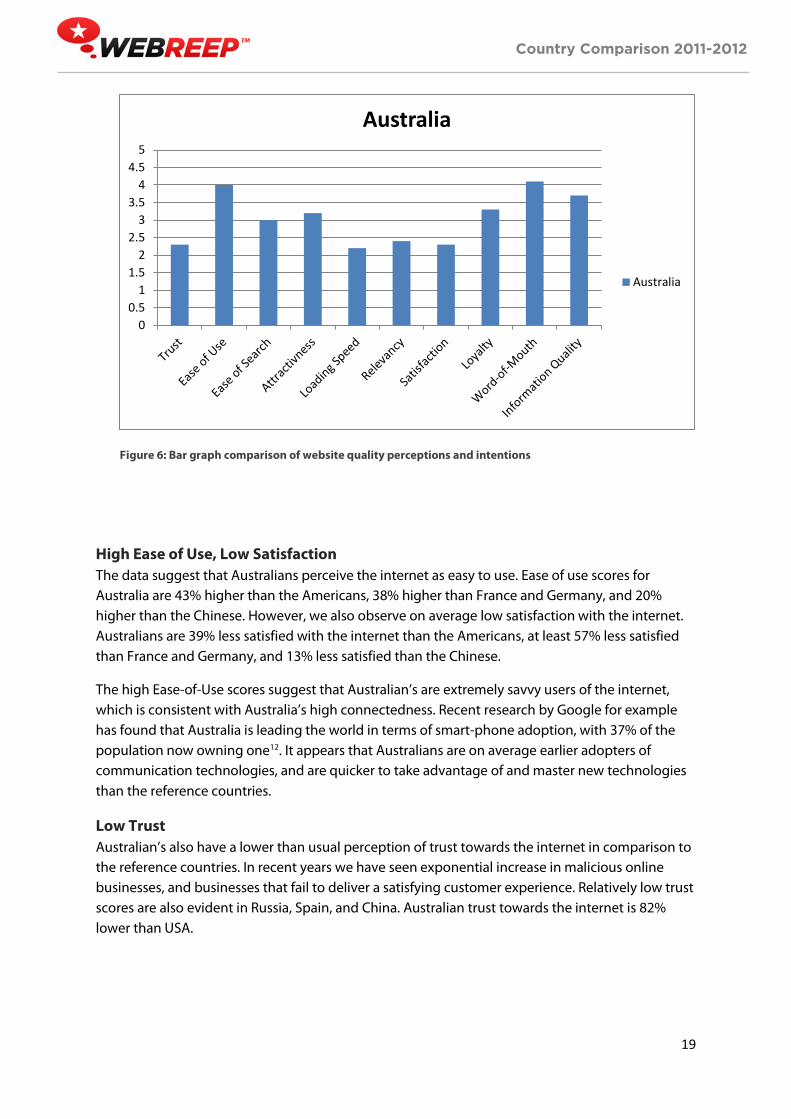
Figure 6: Bar graph comparison of website quality perceptions and intentions
High Ease of Use, Low Satisfaction The data suggest that Australians perceive the internet as easy to use. Ease of use scores for Australia are 43% higher than the Americans, 38% higher than France and Germany, and 20% higher than the Chinese. However, we also observe on average low satisfaction with the internet. Australians are 39% less satisfied with the internet than the Americans, at least 57% less satisfied than France and Germany, and 13% less satisfied than the Chinese.
The high Ease-of-Use scores suggest that Australian’s are extremely savvy users of the internet, which is consistent with Australia’s high connectedness. Recent research by Google for example has found that Australia is leading the world in terms of smart-phone adoption, with 37% of the population now owning one12. It appears that Australians are on average earlier adopters of communication technologies, and are quicker to take advantage of and master new technologies than the reference countries.
Low Trust Australian’s also have a lower than usual perception of trust towards the internet in comparison to the reference countries. In recent years we have seen exponential increase in malicious online businesses, and businesses that fail to deliver a satisfying customer experience. Relatively low trust scores are also evident in Russia, Spain, and China. Australian trust towards the internet is 82% lower than USA.
00.5
11.5
22.5
33.5
44.5
5
Australia
Australia
20
Country Comparison 2011-2012
Low Loading Speed Australia has a copper cable broadband system, with significant investment in a fibre optic national broadband network underway. Generally, perceptions of download speed are low in Australia, suggesting speeds are technically slower due to network constraints and geographic location, or Australian’s are more sensitive to slower loading websites.
21
Country Comparison 2011-2012
China As at June 2011, China had 190 million online shoppers, and 2.8 million websites13. China now has more internet users than any other country in the world at 512 million.
Four unique trends are evident in the Chinese data. First, the number one cause of dissatisfaction for the Chinese is slow download speeds. Second, there is a very strong correlation between information quality and satisfaction. Third, the Chinese are the least likely to share information about websites through word of mouth. Forth, there is a very high correlation between trust and satisfaction.
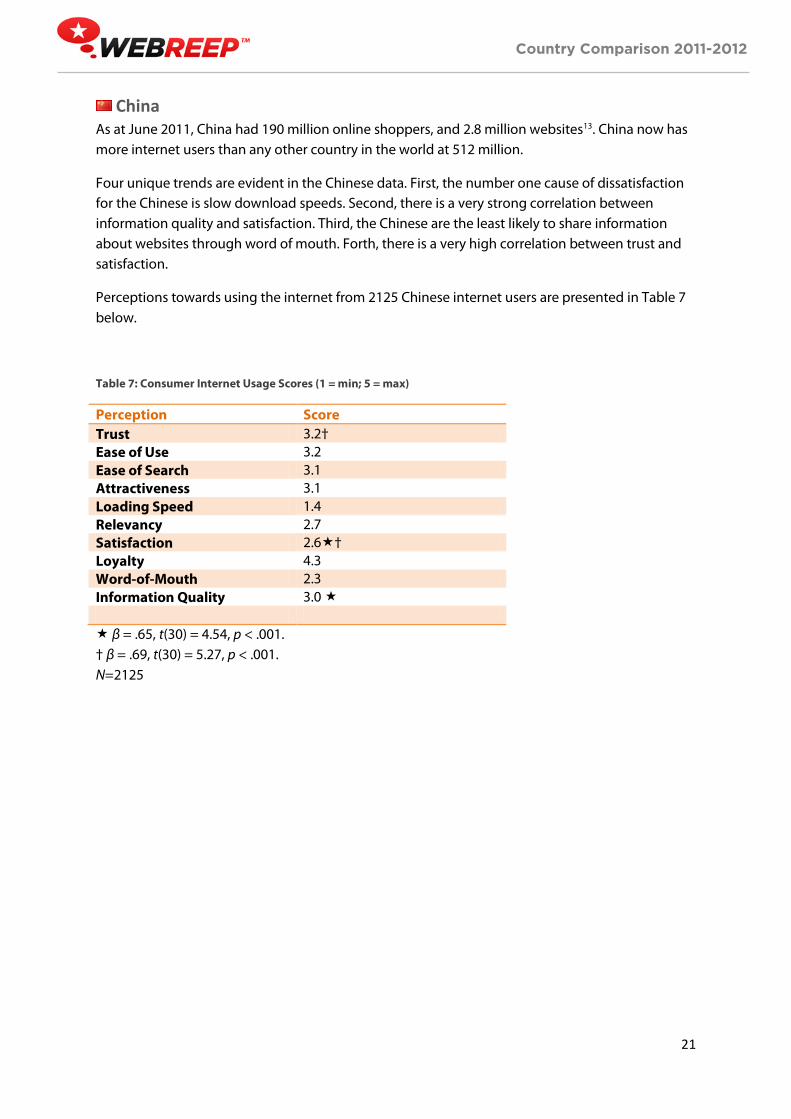
Perceptions towards using the internet from 2125 Chinese internet users are presented in Table 7 below.
Table 7: Consumer Internet Usage Scores (1 = min; 5 = max)
Perception Score Trust 3.2† Ease of Use 3.2 Ease of Search 3.1 Attractiveness 3.1 Loading Speed 1.4 Relevancy 2.7 Satisfaction 2.6† Loyalty 4.3 Word-of-Mouth 2.3 Information Quality 3.0 β = .65, t(30) = 4.54, p < .001. † β = .69, t(30) = 5.27, p < .001. N=2125
22
Country Comparison 2011-2012
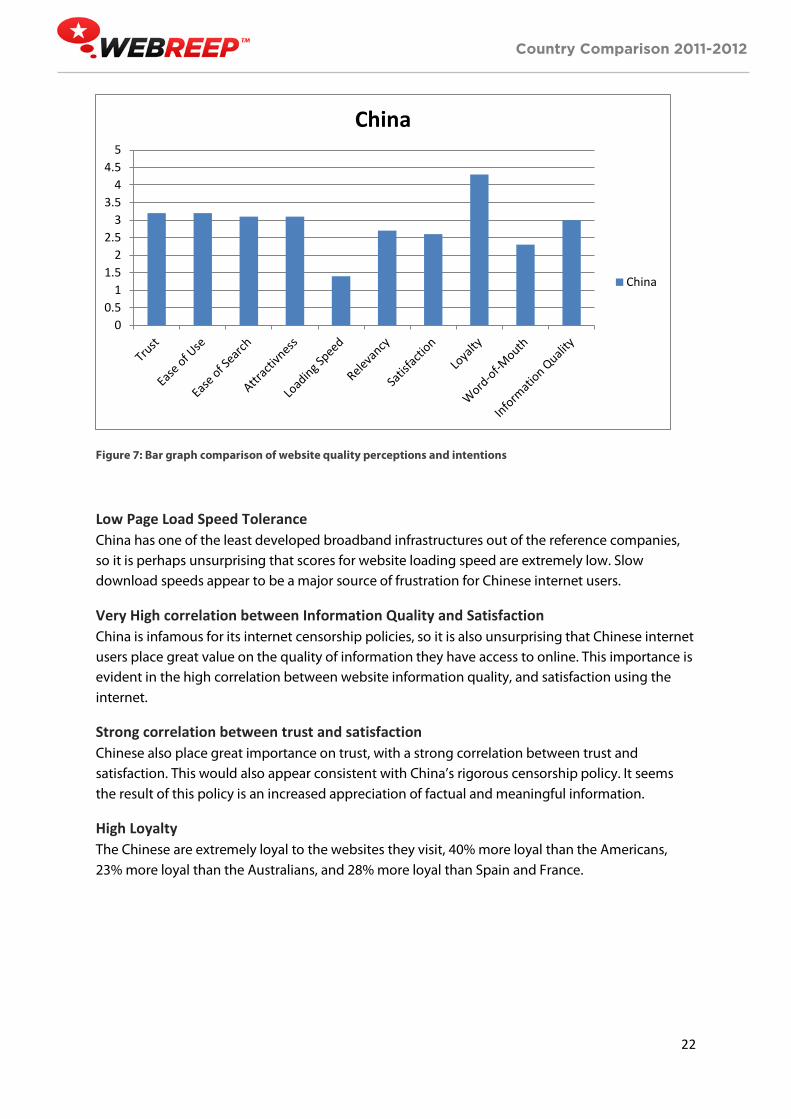
Figure 7: Bar graph comparison of website quality perceptions and intentions
Low Page Load Speed Tolerance China has one of the least developed broadband infrastructures out of the reference companies, so it is perhaps unsurprising that scores for website loading speed are extremely low. Slow download speeds appear to be a major source of frustration for Chinese internet users.
Very High correlation between Information Quality and Satisfaction China is infamous for its internet censorship policies, so it is also unsurprising that Chinese internet users place great value on the quality of information they have access to online. This importance is evident in the high correlation between website information quality, and satisfaction using the internet.
Strong correlation between trust and satisfaction Chinese also place great importance on trust, with a strong correlation between trust and satisfaction. This would also appear consistent with China’s rigorous censorship policy. It seems the result of this policy is an increased appreciation of factual and meaningful information.
High Loyalty The Chinese are extremely loyal to the websites they visit, 40% more loyal than the Americans, 23% more loyal than the Australians, and 28% more loyal than Spain and France.
00.5
11.5
22.5
33.5
44.5
5
China
China

23
Country Comparison 2011-2012
Russia Approximately 37% of the Russian population are connected to the internet, with 76% of those who have internet access having broadband14. Russians in general are very cautious about revealing credit card information online because of a rudimentary national credit card processing ability, and online fraud. Two distinctions are evident in the Russian data suggesting uniqueness in the way Russians perceive the internet. The first is that Russians have relatively high ease of use scores, with no correlation to satisfaction. Second, there is no correlation between trust and satisfaction.
Perceptions towards using the internet from 2161 Russian internet users are presented in Table 7 below.
Table 8: Consumer Internet Usage Scores (1 = min; 5 = max)
Perception Score Trust 2.8 Ease of Use 3.8 Ease of Search 2.9 Attractiveness 3.0 Loading Speed 4.0 Relevancy 2.6 Satisfaction 2.6 Loyalty 4.2 Word-of-Mouth 3.2 Information Quality 3.6 N=2161
24
Country Comparison 2011-2012
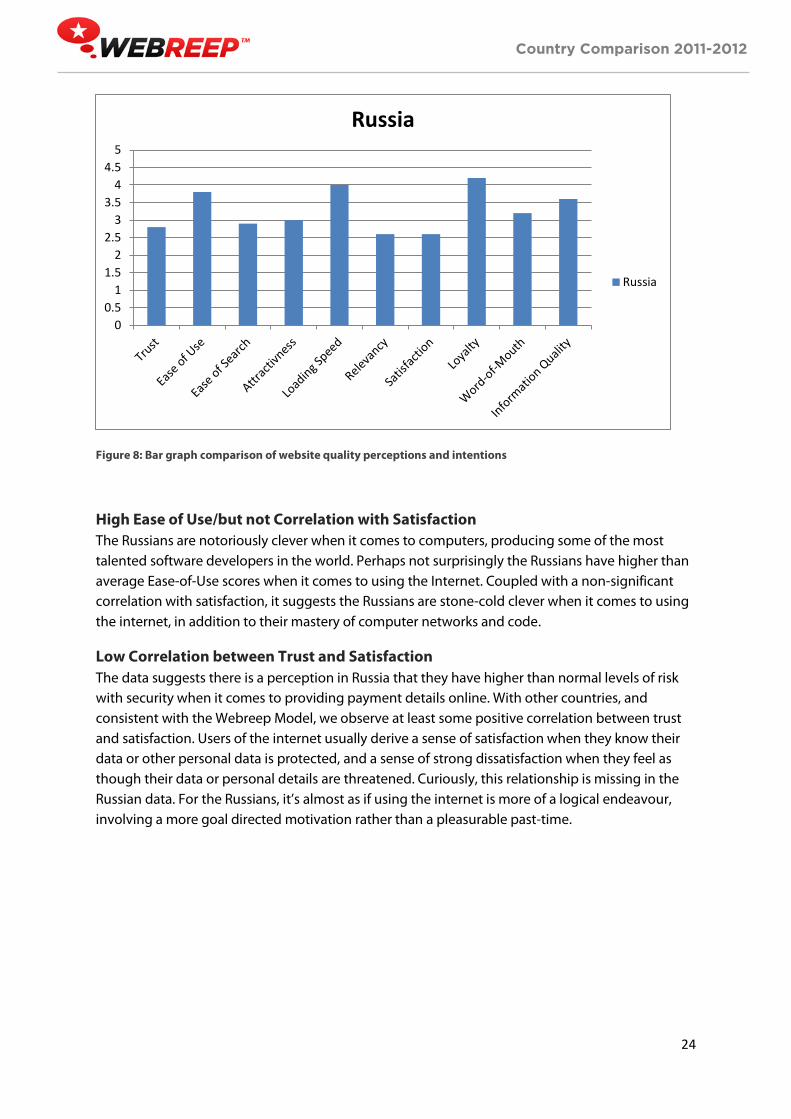
Figure 8: Bar graph comparison of website quality perceptions and intentions
High Ease of Use/but not Correlation with Satisfaction The Russians are notoriously clever when it comes to computers, producing some of the most talented software developers in the world. Perhaps not surprisingly the Russians have higher than average Ease-of-Use scores when it comes to using the Internet. Coupled with a non-significant correlation with satisfaction, it suggests the Russians are stone-cold clever when it comes to using the internet, in addition to their mastery of computer networks and code.
Low Correlation between Trust and Satisfaction The data suggests there is a perception in Russia that they have higher than normal levels of risk with security when it comes to providing payment details online. With other countries, and consistent with the Webreep Model, we observe at least some positive correlation between trust and satisfaction. Users of the internet usually derive a sense of satisfaction when they know their data or other personal data is protected, and a sense of strong dissatisfaction when they feel as though their data or personal details are threatened. Curiously, this relationship is missing in the Russian data. For the Russians, it’s almost as if using the internet is more of a logical endeavour, involving a more goal directed motivation rather than a pleasurable past-time.
00.5
11.5
22.5
33.5
44.5
5
Russia
Russia
25
Country Comparison 2011-2012
General Observations There are several observations to make about this set of Webreep data, that in general transfer to all regions and nationalities included in this report. Consistent with previous analysis conducted on the Webreep model, the fit and explained variance is psychometrically sound. Thus, although we note some significant differences between the countries included in this report, overall the Webreep model relations remain robust and generalizable across each population.
Taking into account the overall dataset included in this report, several patterns are evident. Notably, we can draw some conclusions about what makes a successful website in terms of achieving high amounts of loyalty, high motives to refer (word-of-mouth), and strong overall quality of experience (satisfaction).
The top performing websites overall tend to have abnormally high scores of Ease of Use and Ease-of-Search, and high trust scores as mandatory. Since we know that the number one source of frustration on the internet is inability to find information in a timely manner, this pattern makes sense. Those websites that are difficult to navigate and find information on quickly cause frustration, motivating the user to move on and potentially never to return. Therefore, word-of-mouth referral and loyalty become increasingly unlikely as ease-of-use and ease-of-search decease.
Websites with the highest loyalty have associated high satisfaction scores, driven by high scores across the board. Consistent with the Webreep model, high satisfaction is a function of all constructs combined, that in turn lead to high loyalty and word-of-mouth.
Websites that generate the greatest word of mouth demonstrate high scores on attractiveness and ease of use. Other factors in the model also have a positive effect, but it appears to be these two constructs specifically that tend to have the greatest impact. Aside from Spain, Australia, and Russia, most countries demonstrate low ease-of-use suggesting much could be done in these countries to improve the internet experience. Attractiveness also has a strong effect on word-of-mouth, though as this report shows, attractiveness appears to be highly subjective in many countries, and therefore perhaps more difficult to control.
Websites that cause the most frustration share a pattern of low Ease-of-Use, and low Ease-of-Search. Trust appears to be a dichotomous barrier to website traffic; a website needs a minimum level of trust before satisfaction and loyalty have a positive impact on traffic.
26
Country Comparison 2011-2012
Appendix
00.5
11.5
22.5
33.5
44.5
5
Webreep Combined Country Data 2011-2012 (N = 36,062)
Spain
France
Germany
USA
Australia
China
Russia
27
Country Comparison 2011-2012
Reference List 1. Coker B, Leong KH. Development and testing of the webreep online feedback instrument.
in WORLDCOMP. 2011. Las Vegas, Nevada: CSREA Press. 2. Coker BLS, Predicting internet purchase intention: Theoretical reasoning and empirical
results, in School of Information Systems. 2007, Victoria University Wellington: Wellington. 3. Anderson RE, Srinivasan SS. E-satisfaction and e-loyalty: A contingency framework.
Psychology & Marketing 2003; 20: 123-138. 4. Anderson EW. Customer satisfaction and word of mouth. Journal of Service Research 1998;
1: 5-17. 5. Davis FD, Bagozzi RP, Warshaw PR. User acceptance of computer technology: A
comparison of two theoretical models. Management Science 1989; 35: 982-1003. 6. Venkatesh V, Morris MG, Davis GB, Davis FD. User acceptance of information technology:
Toward a unified view. MIS Quarterly 2003; 27: 425-478. 7. Gefen D, Karahanna E, Straub DW. Trust and tam in online shopping: An integrated model.
MIS Quarterly 2003; 27: 51-90. 8. European Commission Eurostat, Information society statistics at regional level. 2011,
European Commission. 9. OECD, Oecd key ict indicators. 2012, OECD. 10. U. S. Census Bureau, U.S. Census bureau e-stats. 2012, U S Department of Commerce. 11. Australian Government, Benchmarking australia's future digital economy. 2012,
Department of Broadband Communications and the Digital Economy. 12. Google, Our mobile planet: Australia, in Understanding the mobile consumer. 2012,
Google Inc. 13. China Internet Network Information Center, Internet fundamental data (by june 30, 2010).
2012. 14. Infact.com. What is known about russian internet? 2012; Available from:
http://www.infact.ru/.