wecc cmpldw new phase 2 - nerc€¦ · • the old phase 2 parameters used vstall= 0.55 to 0.60 –...
TRANSCRIPT

WECC CMPLDW Phase 2 Study update
LMTFApril 18th, 2017
Atlanta, GA
Background
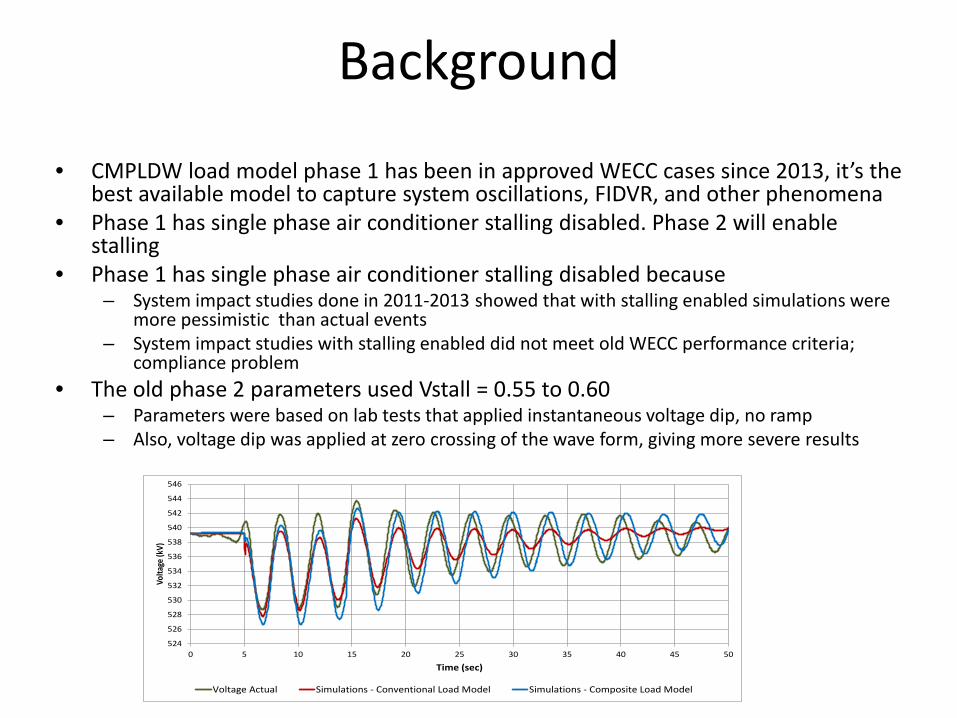
• CMPLDW load model phase 1 has been in approved WECC cases since 2013, it’s the best available model to capture system oscillations, FIDVR, and other phenomena
• Phase 1 has single phase air conditioner stalling disabled. Phase 2 will enable stalling
• Phase 1 has single phase air conditioner stalling disabled because– System impact studies done in 2011-2013 showed that with stalling enabled simulations were
more pessimistic than actual events– System impact studies with stalling enabled did not meet old WECC performance criteria;
compliance problem• The old phase 2 parameters used Vstall = 0.55 to 0.60
– Parameters were based on lab tests that applied instantaneous voltage dip, no ramp– Also, voltage dip was applied at zero crossing of the wave form, giving more severe results
524
526
528
530
532
534
536
538
540
542
544
546
0 5 10 15 20 25 30 35 40 45 50
Volta
ge (k
V)
Time (sec)
Voltage Actual Simulations - Conventional Load Model Simulations - Composite Load Model
New Phase 2 parameters• In August 2016, WECC LMTF proposed a new
set of CMPLDW phase 2 parameters because– New lab tests show stall threshold depends
many factors (ramp duration, sag duration, sag magnitude, POW, recovery voltage, temperature)
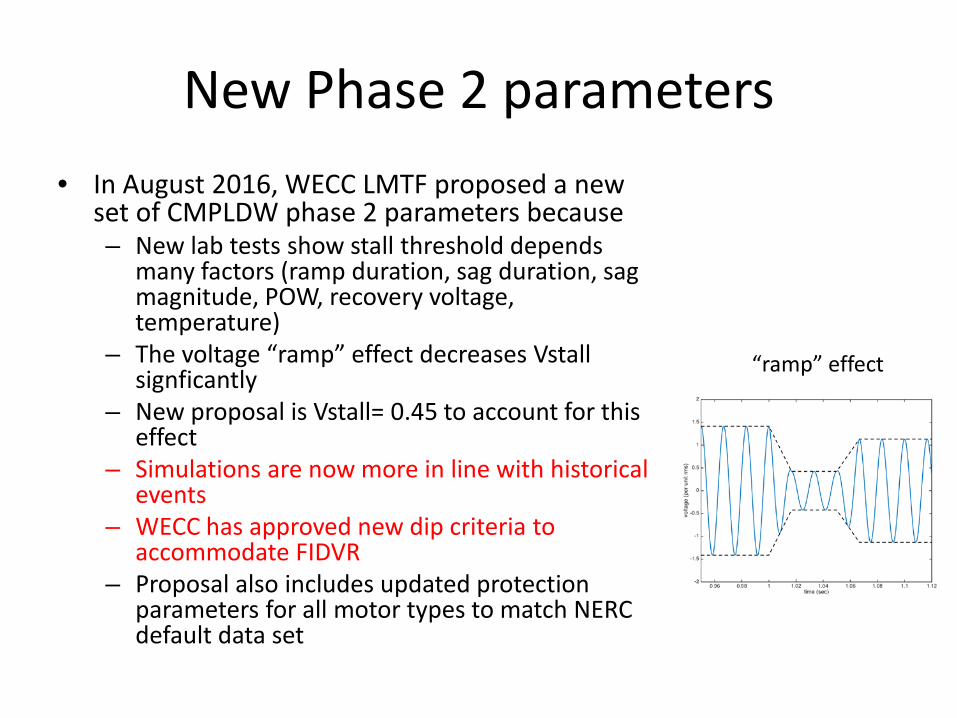
– The voltage “ramp” effect decreases Vstallsignficantly
– New proposal is Vstall= 0.45 to account for this effect
– Simulations are now more in line with historical events
– WECC has approved new dip criteria to accommodate FIDVR
– Proposal also includes updated protection parameters for all motor types to match NERC default data set
“ramp” effect

Proposed new parameters

AC Stall, Instantaneous Voltage Dip
5
Zero Crossing
45°
Peak
Previous assumption
Source: Bernie Lesieutre, University of Wisconsin

AC Stall: 1 Cycle Voltage Ramp Down
6
Peak
Zero Crossing45°
Previous assumption
Source: Bernie Lesieutre, University of Wisconsin
New assumption

Phase 2 timeline
• WECC LMTF presented results of new phase 2 studies at the November 2016 MVWG meeting
• March MVWG approval• May TSS approval • Seek approval of phase 2 parameters in time
for 2018 study program
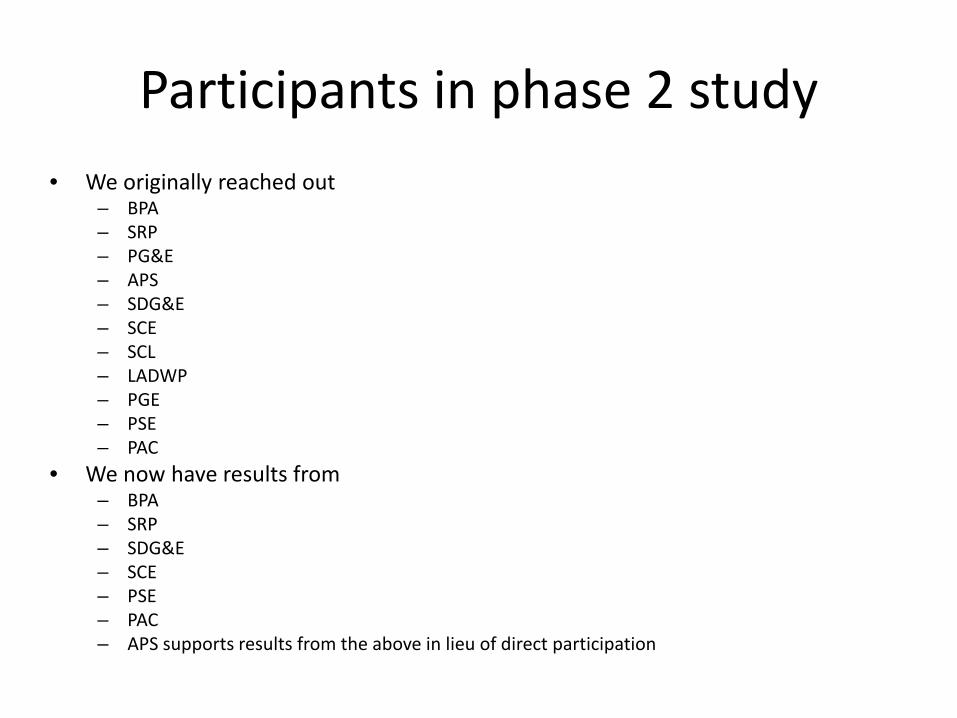
Participants in phase 2 study• We originally reached out
– BPA– SRP– PG&E– APS– SDG&E– SCE– SCL– LADWP– PGE– PSE– PAC
• We now have results from– BPA– SRP– SDG&E– SCE– PSE– PAC– APS supports results from the above in lieu of direct participation

Analysis for phase 2 study
• Had each participant choose most severe base cases and contingencies for their area
• Varied Vstall from 0.4 to 0.6• Compared simulations in principle with historic events• Compared events to new WECC performance criteria• Analyzed voltage and frequency at critical buses• Went through large number of results Nov. 2016
MVWG meeting• The results were well received by MVWG. Approval is
expected in March 2017

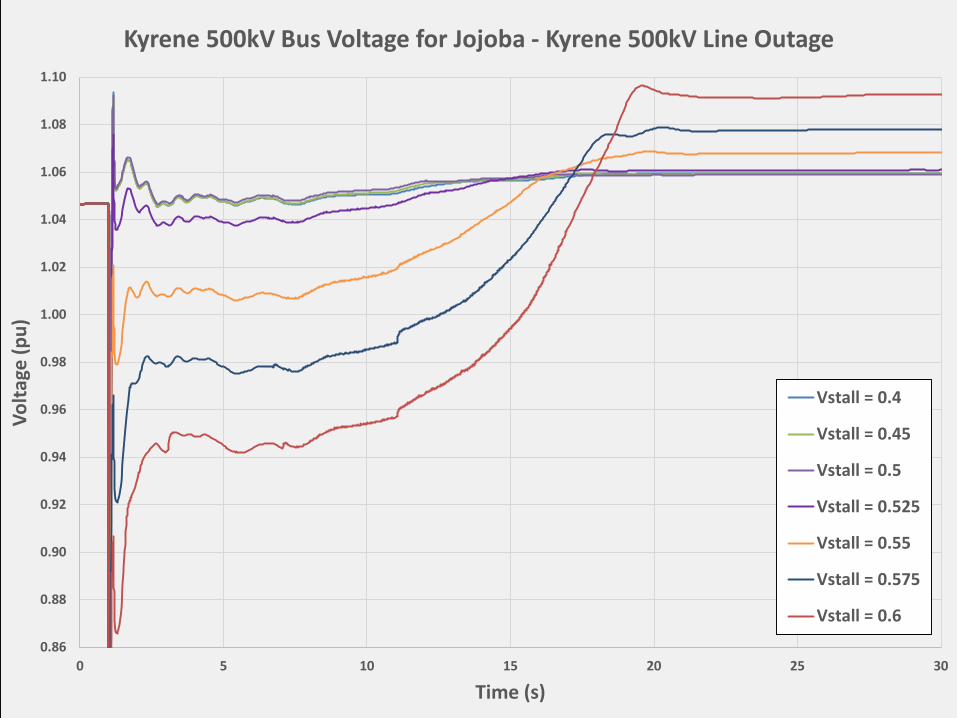
SRP Study Details• Studied 2018 summer case on PSLF version 19.0_02 • Outages:
– Jojoba – Kyrene 500kV Line Outage– Palo Verde Outage: 2 Units Trip
• Vstall Parameters– Studied Vstall at 0.4, 0.45, 0.5, 0.525, 0.55, 0.575, & 0.6– Noticed big jump from 0.5 to 0.6, so additional Vstall
parameters were investigated– Set Tstall to 0.032 for all load models– Had issues with “0.45 Trip”; PSLF would crash
• Monitored Jojoba, Kyrene, & Palo Verde bus voltages and frequencies for 30 seconds
10
0.86
0.88
0.90
0.92
0.94
0.96
0.98
1.00
1.02
1.04
1.06
1.08
1.10
0 5 10 15 20 25 30
Volta
ge (p
u)
Time (s)
Kyrene 500kV Bus Voltage for Jojoba - Kyrene 500kV Line Outage
Vstall = 0.4
Vstall = 0.45
Vstall = 0.5
Vstall = 0.525
Vstall = 0.55
Vstall = 0.575
Vstall = 0.6

SCE Setup and Assumptions
• Tstall enabled at 0.032 seconds• Vstall varied as follows: 0.40, 0.45, 0.50, 0.55 and 0.60• Contingencies placed at 500kV 3ph, Normal Clearing.• 4 contingencies:
– Devers – Valley– Valley – Devers– Lugo – Miraloma– Serrano – Valley
• Voltage and Active Power for selected locations monitored

SCE Summary of Results• Phase-2 Vstall (0.40, 0.45) contrast significantly with Phase-
1 (0.55-0.6).• Adopting Phase 2 will effectively eliminate stalling in some
buses that are not necessarily electrically close to faults• FIDVR is still observed for certain conditions especially
close-in faults.• From a high-level perspective, implementation of Phase 2
parameters seem adequate as it eliminates excessive FIDVR and Tripping while capture FIDVR in other locations.
• Additional tests may need to be carried out to cover other conditions not evaluated with this assessment.

PSE Results
• Ran normal and delayed clearing faults on a 2018 Heavy Summer Case
• Used Power World Simulator• Vstall varied as follows: 0.40, 0.45, 0.50, 0.55
and 0.60• Performance is significantly better for Vstall
0.45 compared to Vstall 0.60
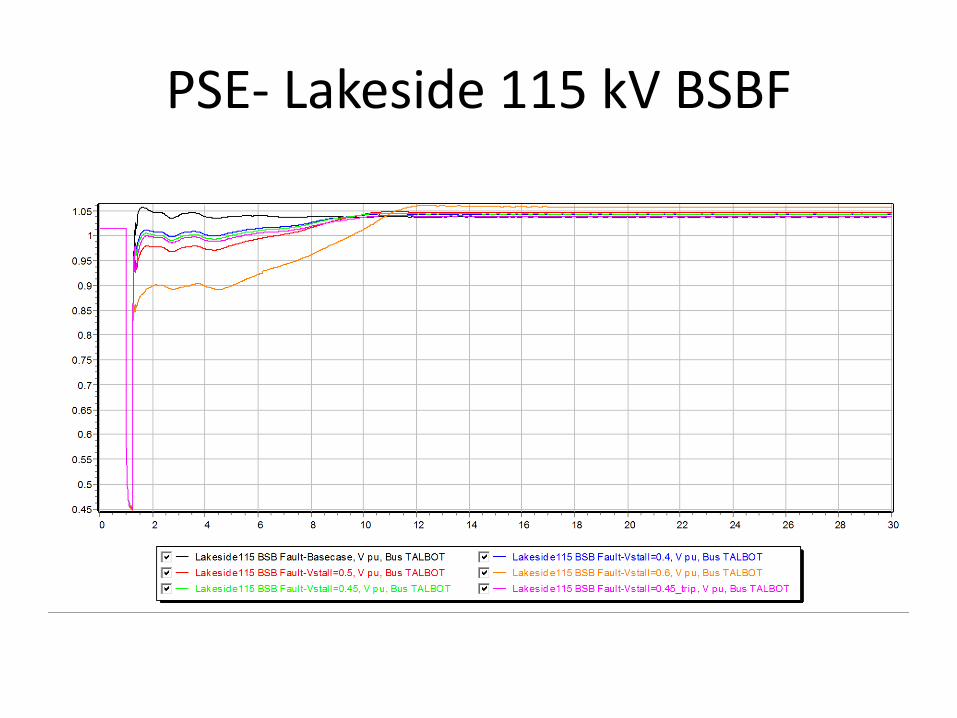
PSE- Lakeside 115 kV BSBF

PAC Results
• Used PSSE• Song Wang ran studies

Any Questions?
October 2016
Zak Baumann, Senior EngineerSalt River Project
Transmission Compliance & Modeling
CMPLDW Phase 2 Test Bench ResultsWECC MVWG Load Modeling Task Force
Closing Remarks• There is no one “correct” set of parameters; lab tests show
that a range of values are reasonable• The latest lab tests from Nov. 2016 support Vstall=0.45 and
Tstall=0.032 s as reasonable, conservative default values. – A more optimistic sensitivity study can use Vstall=0.40, Tstall=3
cycles or Vstall=0.45 and Tstall=5 cycles• Simulation results from 6 major utilities across WECC show
satisfactory performance with these default values• We would like to get these new default values approved for
the 2018 study program• Scripts are available to insert the new parameters. We
encourage anyone interested to reach out to WECC LMTF to do additional testing now.

Questions?
Extra Results slides
• These slides were presented at the Nov. 2016 MVWG meeting– SRP– PAC– SCE– PSE

CMPLDW Phase 2 Test Bench Results
October 2016
Zak Baumann, Senior EngineerSalt River Project
Transmission Compliance & Modeling
WECC MVWGLoad Modeling Task Force

Study Details• Studied 2018 summer case on PSLF version 19.0_02 • Outages:
– Jojoba – Kyrene 500kV Line Outage– Palo Verde Outage: 2 Units Trip
• Vstall Parameters– Studied Vstall at 0.4, 0.45, 0.5, 0.525, 0.55, 0.575, & 0.6– Noticed big jump from 0.5 to 0.6, so additional Vstall
parameters were investigated– Set Tstall to 0.032 for all load models– Had issues with “0.45 Trip”; PSLF would crash
• Monitored Jojoba, Kyrene, & Palo Verde bus voltages and frequencies for 30 seconds
22

0.86
0.88
0.90
0.92
0.94
0.96
0.98
1.00
1.02
1.04
1.06
1.08
1.10
0 5 10 15 20 25 30
Volta
ge (p
u)
Time (s)
Jojoba 500kV Bus Voltage for Jojoba - Kyrene 500kV Line Outage
Vstall = 0.4
Vstall = 0.45
Vstall = 0.5
Vstall = 0.525
Vstall = 0.55
Vstall = 0.575
Vstall = 0.6

0.86
0.88
0.90
0.92
0.94
0.96
0.98
1.00
1.02
1.04
1.06
1.08
1.10
0 5 10 15 20 25 30
Volta
ge (p
u)
Time (s)
Kyrene 500kV Bus Voltage for Jojoba - Kyrene 500kV Line Outage
Vstall = 0.4
Vstall = 0.45
Vstall = 0.5
Vstall = 0.525
Vstall = 0.55
Vstall = 0.575
Vstall = 0.6

59.96
59.98
60.00
60.02
60.04
60.06
60.08
60.10
60.12
60.14
60.16
60.18
60.20
60.22
60.24
60.26
0 5 10 15 20 25 30
Freq
uenc
y (H
z)
Time (s)
Jojoba 500kV Bus Frequency for Jojoba - Kyrene 500kV Line Outage
Vstall = 0.4
Vstall = 0.45
Vstall = 0.5
Vstall = 0.525
Vstall = 0.55
Vstall = 0.575
Vstall = 0.6

59.96
59.98
60.00
60.02
60.04
60.06
60.08
60.10
60.12
60.14
60.16
60.18
60.20
60.22
60.24
60.26
0 5 10 15 20 25 30
Freq
uenc
y (H
z)
Time (s)
Kyrene 500kV Bus Frequency for Jojoba - Kyrene 500kV Line Outage
Vstall = 0.4
Vstall = 0.45
Vstall = 0.5
Vstall = 0.525
Vstall = 0.55
Vstall = 0.575
Vstall = 0.6

0.86
0.88
0.90
0.92
0.94
0.96
0.98
1.00
1.02
1.04
1.06
1.08
1.10
1.12
0 5 10 15 20 25 30
Volta
ge (p
u)
Time (s)
Palo Verde 500kV Bus Voltage for 2 Palo Verde Unit Outage
Vstall = 0.4
Vstall = 0.45
Vstall = 0.5
Vstall = 0.55
Vstall = 0.6

59.84
59.86
59.88
59.90
59.92
59.94
59.96
59.98
60.00
60.02
60.04
60.06
60.08
60.10
60.12
60.14
60.16
60.18
60.20
60.22
60.24
60.26
60.28
0 5 10 15 20 25 30
Freq
uenc
y (H
z)
Time (s)
Palo Verde 500kV Bus Frequency for 2 Palo Verde Unit Outage
Vstall = 0.4
Vstall = 0.45
Vstall = 0.5
Vstall = 0.55
Vstall = 0.6

Conclusions• Very little
difference when varying Vstallfrom 0.4 to 0.5.
• More delayed voltage recovery when Vstall is 0.55 or higher.
290.86
0.88
0.90
0.92
0.94
0.96
0.98
1.00
1.02
1.04
1.06
1.08
1.10
0 5 10 15 20 25 30
Volta
ge (p
u)
Time (s)
Kyrene 500kV Bus Voltage for Jojoba -Kyrene 500kV Line Outage
Vstall = 0.4
Vstall = 0.45
Vstall = 0.5
Vstall = 0.525
Vstall = 0.55
Vstall = 0.575
Vstall = 0.6
Any Questions?
October 2016
Zak Baumann, Senior EngineerSalt River Project
Transmission Compliance & Modeling
CMPLDW Phase 2 Test Bench ResultsWECC MVWG Load Modeling Task Force
CMPLDW Phase 2 Validation
Raul E. Perez-GuerreroAdvanced Technology
Southern California Edison
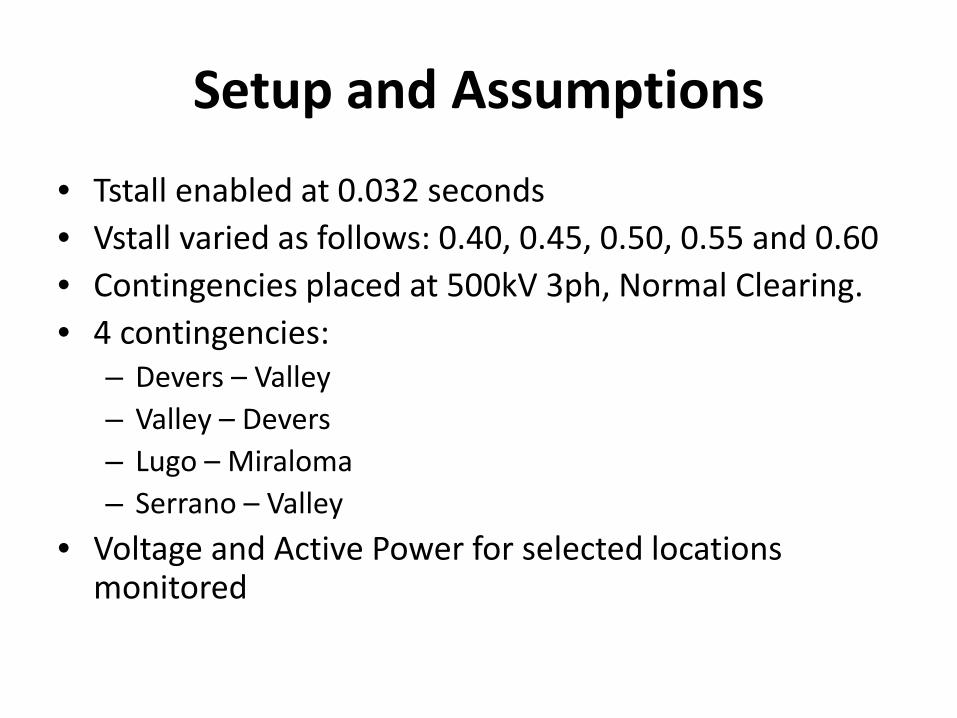
Setup and Assumptions
• Tstall enabled at 0.032 seconds• Vstall varied as follows: 0.40, 0.45, 0.50, 0.55 and 0.60• Contingencies placed at 500kV 3ph, Normal Clearing.• 4 contingencies:
– Devers – Valley– Valley – Devers– Lugo – Miraloma– Serrano – Valley
• Voltage and Active Power for selected locations monitored
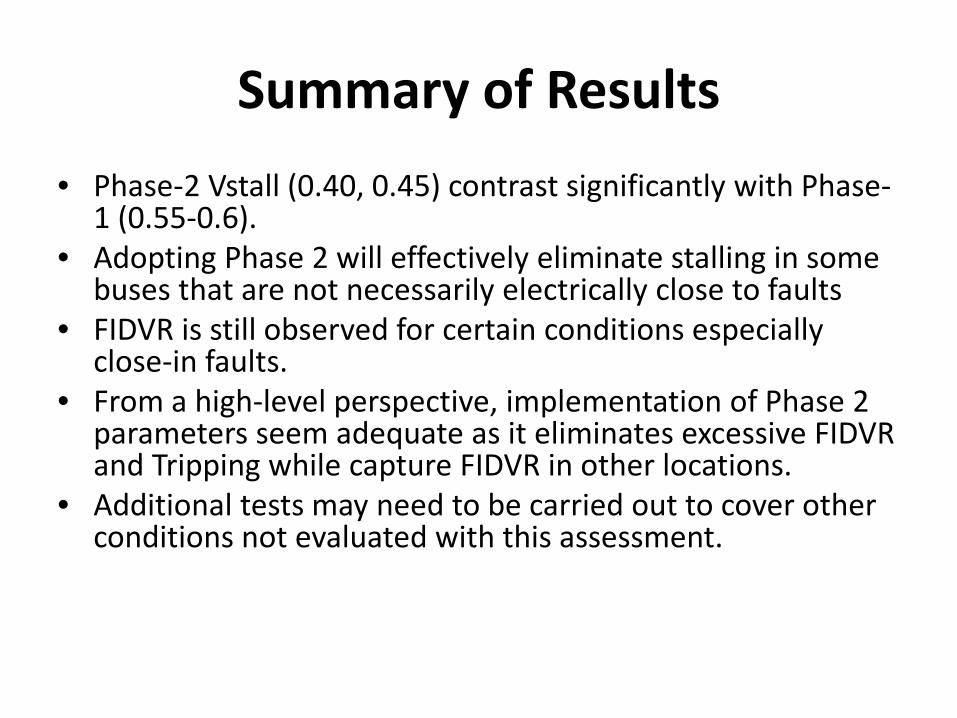
Summary of Results• Phase-2 Vstall (0.40, 0.45) contrast significantly with Phase-
1 (0.55-0.6).• Adopting Phase 2 will effectively eliminate stalling in some
buses that are not necessarily electrically close to faults• FIDVR is still observed for certain conditions especially
close-in faults.• From a high-level perspective, implementation of Phase 2
parameters seem adequate as it eliminates excessive FIDVR and Tripping while capture FIDVR in other locations.
• Additional tests may need to be carried out to cover other conditions not evaluated with this assessment.

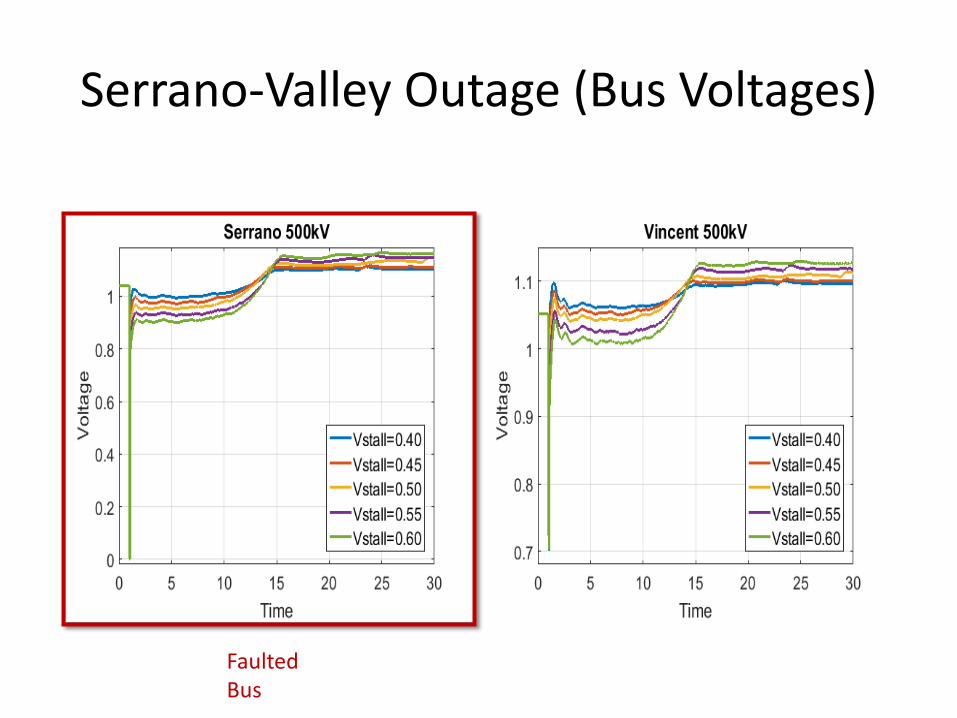
Serrano-Valley Outage
• 3ph Fault at Serrano – Valley 500 kV line near Serrano
• Fault cleared in normal clearing time

Serrano-Valley Outage (Bus Voltages)

Serrano-Valley Outage (Bus Voltages)
Serrano-Valley Outage (Bus Voltages)
Faulted Bus

Serrano-Valley Outage (Active Power -Load)

Serrano-Valley Outage (Active Power -Load)

Serrano-Valley Outage (Active Power -Load)

Valley-Devers Outage
• 3ph Fault at Valley – Devers 500 kV line near Valley
• Fault cleared in normal clearing time

Valley-Devers Outage (Bus Voltages)
Faulted Bus

Valley-Devers Outage (Bus Voltages)

Valley-Devers Outage (Bus Voltages)

Valley-Devers Outage (Active Power -Load)
Faulted Bus
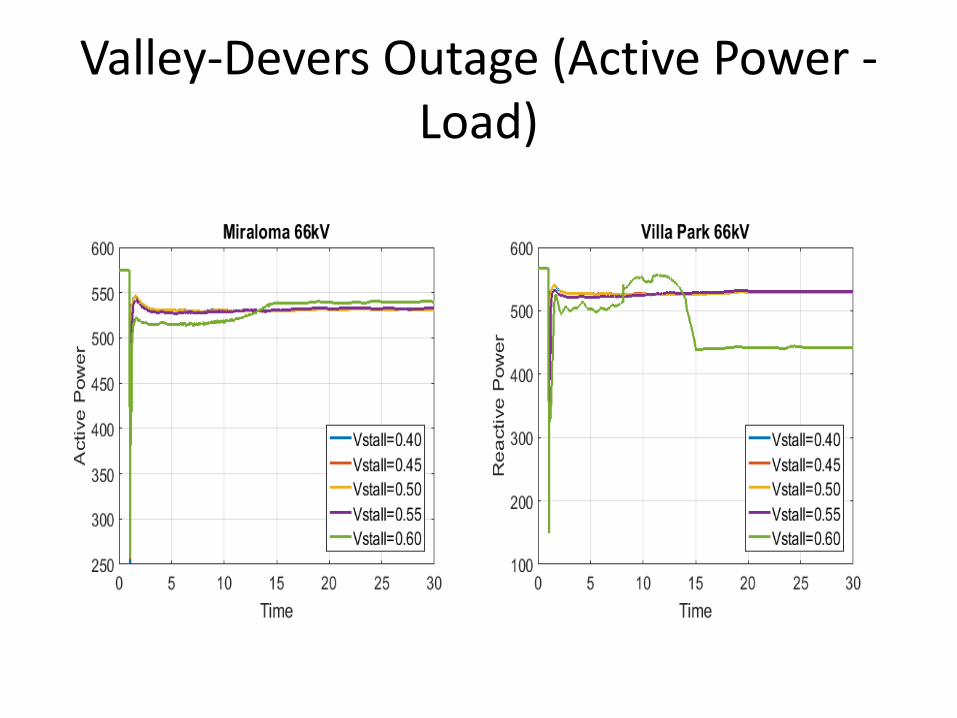
Valley-Devers Outage (Active Power -Load)

Valley-Devers Outage (Active Power -Load)

Devers – Valley Outage
• 3ph Fault at Devers – Valley 500 kV line near Devers
• Fault cleared in normal clearing time

Devers – Valley Outage (Bus Voltages)

Devers – Valley Outage (Bus Voltages)
Faulted Bus

Devers – Valley Outage (Bus Voltages)

Devers – Valley Outage (Active Power -Load)

Devers – Valley Outage (Active Power -Load)
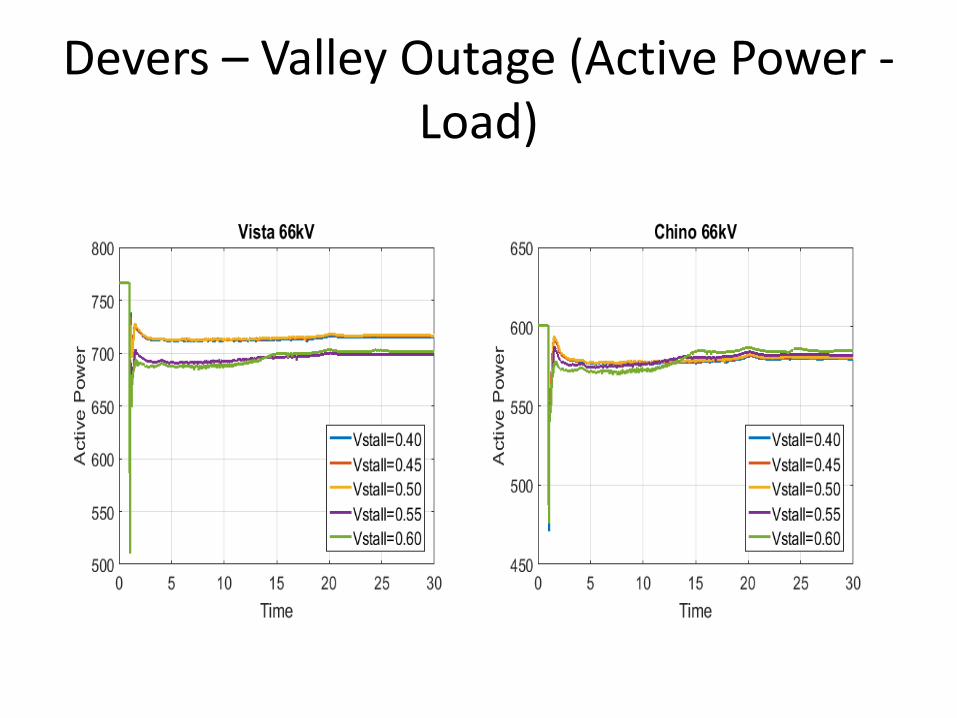
Devers – Valley Outage (Active Power -Load)

Lugo-Miraloma Outage
• 3ph Fault at Lugo – Miraloma 500 kV line near Lugo
• Fault cleared in normal clearing time

Lugo-Miraloma Outage (Bus Voltages)
Faulted Bus

Lugo-Miraloma Outage (Bus Voltages)

Lugo-Miraloma Outage (Bus Voltages)

Lugo-Miraloma Outage (Active Power -Load)

Lugo-Miraloma Outage (Active Power -Load)

Lugo-Miraloma Outage (Active Power -Load)
