wecc planning data white paper is responsible for coordinating and promoting electric system...
TRANSCRIPT

Version R1 (Clean/8Sep08)
WECC Planning Data
White Paper
A. Executive Summary The Western Electricity Coordinating Council (“WECC”) maintains three separate planning datasets used by Loads and Resources Subcommittee (“LRS”), Technical Studies Subcommittee (“TSS”) and Transmission Expansion Planning Policy Committee (“TEPPC”). During 2007, concern was expressed during review of TEPPC’s study work that there was an apparent mismatch between the LRS and TEPPC figures for load and generation. Discussion of this concern raised data issues related to credibility of data and duplication of effort. To address these concerns, this paper discusses the nature of the three WECC planning datasets, the differences between the datasets, the reasons these differences exist, data consistency among the datasets, and possibilities for improving data collection efficiency by minimizing duplication. This paper concludes that:
1. Although data terminology among the planning groups is similar, the data used is not identical. Each group uses a level of electrical system modeling detail that fits the time scale of the events being evaluated. As a result, each group uses a different analytic tool that requires data not employed by the other two groups. Each group also must make adjustments to common data in order to represent the system conditions being analyzed. The following are short descriptions of the work related to the three planning groups.
a. TSS System Review Work Group (SRWG) prepares base cases (TSS Data) which have detailed electrical models of generators and transmission system use for establishing the boundaries of reliable system operations. SRWG cases are scenario specific. Load and generator outputs are adjusted to produce transmission network stress for evaluating dynamic stability events that occur within seconds or steady state conditions within a given hour. TSS uses the General Electric Company – Positive Sequence Load Flow model (GE-PSLF) for these studies.
b. TEPPC studies use an economic production cost model of the system generators and a very simple electrical model of the transmission system (TSS Data) to study system congestion as generation is dispatched to meet coincident load for each hour of a given year. For these studies, TEPPC uses the Ventyx Promod model, a production cost simulation tool.
c. LRS collects generation and load data each year (LRS Data) to support a system-wide analysis of reserve margins in WECC. This is accomplished by comparing forecasted loads, including a planning reserve margin, with expected generation. The Supply Adequacy Model (SAM) is one of the tools used to create the Power Supply Assessment (PSA) and the Long-term Reliability Assessment (LTRA). These studies evaluate the adequacy of generation supply for the peak summer and winter demand over a ten-year period. Their evaluation deals with non-coincident peaks in generation bubbles and capacity of interconnections using a
Page 1 of 26

Version R1 (Clean/8Sep08)
transportation model that does not consider the electrical characteristics of the transmission system and the resulting power flow distribution.
2. Because of the difference in focus of each planning group, a single dataset is not
practical, however, where possible data collected by TSS and LRS is used by TEPPC. a. TEPPC’s network model for a given year is extracted from an appropriate TSS
basecase. TEPPC also uses the bus load distribution factors from TSS base cases. b. TEPPC’s load model begins with LRS load forecasts, however, with current
hydro modeling, loads must be adjusted for the Pacific Northwest to synchronized load and hydro generation profiles. TEPPC also opted to use a modified forecast for California. TEPPC also uses a more detailed (granular) representation of loads, so the LRS data must be processed before use.
c. TEPPC’s generation model uses the LRS generation data and proposed generation classifications to supplement the generator information during the annual updates. Other sources are used to add the economic dispatch factors (heat rate, fuel costs, start/stop times, minimum run times, minimum output, etc), emissions data and bus locations that are needed for the TEPPC studies.
3. When comparing the LRS and TEPPC data for consistency, some caution is required
because of differences in data and adjustments made by TEPPC for use in Promod. For example:
a. The hourly TEPPC studies use coincidental loads and the LRS’s PSA and LTRA
use non-coincidental loads; b. To simulate hourly dispatch, some loads in the TEPPC dataset are modeled as
negative generators which creates a difference in total load between the LRS and TEPPC datasets;
c. To simplify their modeling and maintain consistency with the TSS power flow data, the pumping loads in California are modeled as generators;
d. Different methodologies are used for seasonal de-rating of resources; and e. Aggregation of resources in TEPPC makes it difficult to conduct unit level
comparisons.
4. In Table 1, a summary comparison is made between the data used for the 2007 LRS reports and the 2007 TEPPC study report. For comparison purposes the TEPPC peak load is shown on both a coincidental and a non-coincidental basis. The significance of coincidence is described in detail in section D. The base generation capacity in Table 1 includes the existing generation as well as the Class 1 & 2 additions. The de-rates were backed out of the L&R data for the comparison.
Page 2 of 26

Version R1 (Clean/8Sep08)
Table 1. Comparison of LRS & TEPPC Data
Data Description LRS TEPPC Variance from LRS
Variance (%)
Peak Load Comparison Non-Coincidental Peak Load (NCP) - July 2017 (MW)
191,0791 187,611 3,468 1.8
Coincidental Peak Load (CP) – July 2017 (MW) N/A 175,5782 --- ---
Load diversity between NCP and CP N/A 12,033 --- ---
Energy Load Comparison Annual Energy (GWH) 1,050,786 1,021,289 29,497 2.8
Generation Comparison Base Generation Capacity (Non Derated) (MW)
226,608 225,912 696 0.3
a. The largest variance shown in Table 1 is for annual energy. The energy variance
is primarily a result of the following TEPPC modeling decisions. i. In order to produce reasonable hourly simulation results with the current
hydro-generation models available in Promod, it is necessary to make adjustments to loads to match the median water year hydro generation forecast used for the Pacific Northwest. This adjustment totaled a 1,566 GWh reduction in energy consumption. This results in the substitution of individual Balancing Authority data collected by LRS for the Northwest with a consolidated forecast produced by the Northwest Power and Conservation Council (“NWPCC”).
ii. TEPPC also made reductions in California loads (19,927 GWh) to account for increased energy conservation and the impacts on loads and generation of pumping loads.3
iii. An updated load forecast for Utah, Idaho and Wyoming, reducing energy consumption by 7,267 GWh, was also used to distribute loads to the larger number of load bubbles used by TEPPC.
b. The variances in peak load data can also be reconciled based on the same three
modeling decisions:
1 Where not explicitly provided in the data submissions, the 2017 LRS peak load forecasts in Table 1 were derived by applying the percentage change from 2015 to 2016 to the forecasted load for 2016. The 2017 LRS energy forecasts were derived by escalating the forecasts for 2010 through 2016. The 2006 LRS data request asked for 10 years and the first 3 months of the 11th year of forecasted load data which included 2007 through March 2017. The 2017 LRS energy forecasts were derived by escalating the forecasts for 2010 through 2016. 2 TEPPC peak load forecast for coincident peak hour 13Jul2017 HE 16 from study prepared 11Jan2008. 3 These are dispatchable pumping load, both pumped storage and California water projects, where pondage in canals provides opportunities to shift pumping to low load periods thereby reducing system peaks.
Page 3 of 26

Version R1 (Clean/8Sep08)
i. A 204 MW difference results from the use of the Northwest Power and Conservation Council’s load forecast for hydro-generation modeling.
ii. California demand was reduced 1,704 MW to model pumping loads, efficiency programs, and rooftop solar.
iii. A 1,560 MW PacifiCorp difference is attributable to adjustments made as part of increasing the load bubble granularity.
Given the uncertainty of all long range forecasts and the need for differences in modeling for different types of analysis, the variances shown in Table 1 are well within a reasonable tolerance for planning studies for a 10 year period. The energy figures differ by only 2.8%. The Non-coincidental Peak load figures differ by 1.8%, and the base generation capacity represented differ by only 0.3%. The 8%+ difference between the July coincidental peak used by TEPPC and the LRS July non-coincidental represents an expected amount of load diversity.
5. Given the data linkages among the three groups, improvements can be made. It is
recommended that: a. TEPPC and LRS work together to align load and generation data, with LRS
considering collection of load data using TEPPC’s more granular bubble model. b. TSS, TEPPC and LRS consider establishing a unique identification of all
generators. The best choice would be to use Geographic Information System (GIS) coordinates, i.e., latitude and longitude. GIS coordinate for each machine would allow the WECC Staff to compare and validate the representations between datasets, even though each group may use different aggregations of individual generators for their studies. The GIS coordinates need not be released to the public, if the WECC Board determines that such release would compromise network security.
c. TEPPC, LRS and PCC should investigate the value of future adoption of a common planning database structure, with particular consideration given to (1) the importance of tracking data changes across time, (2) the need to provide a user-friendly member interface for gathering and reviewing data, (3) the practical utility of a unified database, and (4) and the benefits and costs of developing and using a unified database structure.
Page 4 of 26

Version R1 (Clean/8Sep08)
Page 5 of 26
B. Introduction to Planning Functions WECC is responsible for coordinating and promoting electric system reliability for the Western Interconnection. Three groups within WECC are responsible for long-term planning of a reliable system. The LRS is responsible for studying resource adequacy for the Western Interconnection. The TSS is tasked with the preparation of power flow and dynamic stability base cases reliability evaluations. The TEPPC studies economic expansion of the transmission system. The LRS and TSS subcommittees function under the direction of the Planning Coordination Committee (“PCC”). Both TEPPC and PCC report to the WECC Board. The WECC Staff supports these committees and it also supplies data and reports to NERC and DOE to meet WECC’s regulatory reporting responsibilities. This paper was initiated by TEPPC and LRS to describe the planning functions and the data each planning function uses. In addition to providing a reference for data users, this paper also addresses data alignment questions raised during the development of the TEPPC study cases in 2007. It has been said that, “A problem well stated is half solved.4 ” Therefore, this paper first clarifies the key issues before examining data consistency and considering opportunities for (and challenges of ) consolidating one or more of the datasets and their associated data collection activities. These key issues are:
• The purpose and scope of each of WECC’s planning datasets, • The nature of the data used for each planning dataset, • The relationship among the datasets, and • The reasons for difference between the datasets.
LRS and SRWG have a long history with their dataset collection and preparation processes. The TEPPC dataset is much newer and was derived from work done previously by the Seams Steering Group – Western Interconnection (“SSG-WI”) and the Rocky Mountain Area Transmission Study (“RMATS”). TEPPC is still refining its dataset and associated preparation processes. It is important to note that while there are synergies among these three activities, there are also important differences that must be understood. While TEPPC uses LRS load and resource data and TSS transmission data to avoid duplication of collection to the extent possible, some differences exist because of modeling requirements. For example, the LRS topology allocates load to 26 regional bubbles and the TEPPC uses 42 bubbles to allocate its load. The reason for populating and maintaining three separate datasets becomes clearer as the purposes and details of each planning function are examined. Figure 1 below shows the different types of analysis involved in the planning of an electric power system. Each type of analysis focuses on a different analytic time frame, and different planning groups have the responsibility for studies within the four time frames as shown in Figure 1.
4 Charles F. Kettering (1876-1958) was a leader in the development of industrial research processes in the United States. He was also a founder of whatt became the Memorial Sloan-Kettering Cancer Center, based on the premise that American industrial research techniques could be applied to cancer research. He held some 300 patents and his early work produced the first automotive self-starter and electrical systems for automobiles. ( http://en.wikipedia.org/wiki/Charles_Kettering )

Version R1 (Clean/8Sep08)
Page 6 of 26
Figure 1. Planning Study Activity Events ScaleFigure 1. Planning Study Activity Events Scale
PPoutout
t t
1µsec 1msec 1sec 1hour 1day 1yr
DDSS
pp
VVbusbus
t t
Switching Transients
Power Flow & Dynamic Stability
Production CostEconomics
10 yr
Power SupplyAdequacy
LoadLoad
hrhr
Events Analyzed:• Lightning• Switching responses• Sub-synchronous
resonanceObjectives:• Evaluate insulation
performance • Determine transient
voltages & currents Generation Model:
• Electro-magnetic representation
Transmission:• AC three-phase model
using, detailed multi-element electro-magnetic models
Events Analyzed:• Generator outages• Line faults & outages.Objectives:• Evaluate steady state
and dynamic response to contingencies
Generation Model:• Electro-magnetic
representation• Gross output range
(station service separately modeled)
Transmission:• AC single phase model
using series & shunt reactance for each line segment
Events Analyzed:• Hourly dispatch over a
period (e.g. a year) minimizing cost subject to operating constraints
Objectives:• Evaluate transmission
congestion’s effect upon economic dispatch
Generation Model:• Net power output range
and economic operations factors (fuel cost, heat rate, start-up cost, etc.)
Transmission:• Simplified DC power flow
using only the series reactance of each line segment
Events Analyzed:• Load-Resource balance
for seasonal and monthly peaks over a ten year period.
Objectives:• Evaluate ability to meet
peak loads Generation Model:• Expected outputTransmission:• Bubble-to-bubble
transportation model
TSSTSS TEPPCTEPPC LRSLRSTransmission Transmission
OwnersOwners
Scope of WECC PlanningScope of WECC Planning

Version R1 (Clean/8Sep08)
Studies with the shortest time frame consider events that are associated with high speed transients – events occurring within just a few milliseconds. The next time frame extends from fractions of seconds up to an hour duration. The evaluation of dynamic stability after disturbances is examined for a few seconds, while power flow studies evaluate steady state conditions within a given hour. The next study time frame covers the economics of production cost and extends from a single hour (or sometimes parts of hours) up to a full year for given future year chosen for study (for instance the 5th or 10th year of the planning period). Finally the longest time frame covers parts of a year up to 10 years or more for the evaluation of power supply adequacy. A different degree of detail is needed for each of these types of analysis based on the characteristic of the system performance being evaluated. The lower part of Figure 1 compares the level of detail used for system evaluation models. As the time scale of events becomes longer, less physical detail is needed.
1. Time Frame 1 – Transmission Owner Studies. • Transmission owners are responsible for the study of high speed transients as part
of their detailed equipment design for specific transmission lines and substations, i.e, lighting strikes, switching, sub-synchronous oscillations, etc. This analysis requires three electrical phase models to represent electromagnetic coupling between the individual conductors and differing characteristics of the multiple segments that make up a single transmission line. WECC committees have no direct connection to these studies. They are shown in Figure 1 only to provide a more complete time frame perspective for WECC’s study activities.
2. Time Frames 2, 3 and 4 – Scope of WECC Planning Activities • TSS is responsible for the preparation of the datasets used for power flow and
dynamic stability analysis. These studies, usually performed by WECC members rather than by the Staff, are used to establish the transmission system ratings and to evaluate the system’s ability to respond to contingencies such as the loss of one or more line or generators. These studies establish the boundaries within which reliable operation can occur. Because high speed transients disappeared before the power flow consequences of switching events manifest themselves, power flow and stability analysis can use a single phase equivalent for each transmission line segment.
• TEPPC is responsible for conducting studies of the transmission system congestion using production cost economics techniques. This is the newest of the WECC planning activities with a study methodology that is still evolving. TEPPC’s studies look at system wide impacts of transmission congestion, i.e., the ability of the transmission system to deliver energy within the bounds of reliable operation. Even less transmission line detail is needed for production cost studies, where a single reactance figure is used to represent a transmission line.
• LRS is responsible for the evaluation of power supply adequacy with a focus on the ability of planned resources to meet expected load at peak periods. Power supply adequacy does not use an electrical model of the transmission sytem, instead it uses only the ratings and connection paths between groups of loads (a transportation model) which does not consider the flow distribution within the transmission system.
Page 7 of 26

Version R1 (Clean/8Sep08)
Given the differences in analytic focus and associated system modeling, a set of questions arises regarding possible consolidation of datasets.
• What data is shared and is its use the same between groups? • What data is unique and is needed by only one group? • Would linkages between different datasets provide more efficient and accurate data
collection? • Can or should the multiple types of data be combined into a single dataset? • Would use of a single dataset create a maintenance burden greater than the benefit
achieved? To evaluate these questions we need to consider the nature of the data that is currently collected and used.
Page 8 of 26

Version R1 (Clean/8Sep08)
C. Description WECC Planning Datasets
1. Loads and Resources (LRS). LRS collects two related sets of data.
(a) The Loads and Resources (LRS) data is collected from Balancing Authorities on an annual cycle with minor updates each spring and fall. The data includes monthly peak demands, energy loads, generating capacity, facility additions, etc. The data is used for a number of purposes including, but not limited to, the following reports and submittals: • Summary of Estimated Loads and Resources, • Existing Generation and Significant Additions and Changes to System Facilities, • Power Supply Assessment (PSA), • Information Summary, • 10 Year Coordinated Plan Summary, • Long Term Reliability Assessment (LTRA), a NERC Report, and • Seasonal Assessments (Summer and Winter) • Additional NERC Reports.
LRS studies are targeted at the hour of peak demand for each month or season over a ten year period. The data supports the analysis of a peak hour load/resource balance and the ability of each sub-region to meet its load requirements.
(b) The Hourly Demand Data (HDD) is collected from Balancing Authorities at the beginning of each year for the previous year. The data represents the load for each hour of the previous year for each Balancing Authority and/or Planning Authority. It is similar to the hourly load data that FERC collects for its Form 714 filings. Prior to 2007 the data was collected by WECC and submitted to FERC on behalf of the WECC Balancing Authorities. The data is used for the following purposes. • Cross check of LRS actual peak demand and energy data for previous year, • Cross check of WECC budget assessment data, and • Hourly load shapes for TEPPC dataset.
2. Power Flow and Dynamic Stability (TSS). Each year SRWG develops eleven base cases
that are used by WECC staff and by WECC members to study system stability and dynamic system response. Each base case represents a single hour snapshot of the system that is used to evaluate specified stressed conditions. Load and generation levels are set to stress the transmission system in a specific way to meet study objectives. The load and generation output levels will not, as a general rule, match the expected load and generation output used for TEPPC or LRS studies. The TSS/SRWG activities include the following.
(a) SRWG compiles a ten-year data bank of power flow base cases and associated stability data.
Page 9 of 26

Version R1 (Clean/8Sep08)
• SRWG proposes the cases to be included in the data bank and prepares the case descriptions specifying system configurations and operating conditions;
• SRWG proposes and coordinates the schedules for data compilation, distribution review, and approval of cases.
• SRWG monitors data submission for appropriateness and coordinate as required with members.
(b) SRWG conducts an annual assessment of near-term and longer-term system performance. • SRWG’s assessments are based on TSS instructions covering general areas of
question, types of operating and transfer conditions, and type of disturbances to be studied.
• SRWG prepares an outline of the study plan and descriptions of power flow and stability cases to be run.
• SRWG reviews study results and prepare reports.
(c) SRWG defines the system representation in WECC power flow and stability studies. • SRWG prepares and maintains system representation guidelines for use by
WECC Members in submitting data and monitor compliance, and • SRWG participates as requested by TSS in WECC computer program
development and testing.
The TSS base cases are vital to the WECC Path Rating Process that is defined in the Regional Planning overview document.
“The WECC has established a three-phase procedure for rating proposed transmission projects (the ‘Rating Process’) to enable project sponsors to attain a WECC ‘Accepted Rating’ and demonstrate how their projects will meet NERC and WECC planning standards.”
The rating studies needed for the Path Rating Process are conducted by the organization sponsoring a project with participation from other WECC members, who have an interest in the process acting as study reviewers. In preparing these studies load and generation outputs are altered from that of the base cases to stress the portion of the network being evaluated in order to establish the outer limits of reliable system operation. Sometimes confusion occurs among stakeholders who are not transmission system engineers because the base cases loads are thought to represent normal operating conditions. They do not. In fact, power flow and dynamic stability studies examine scenarios in which the system is heavily stressed in order to find the limits at which the system can be reliably operated with acceptable responses for given types of contingencies. For planning purposes, if the cases represented normal expected operating practice, nothing of value would be learned from the studies.
Page 10 of 26

Version R1 (Clean/8Sep08)
3. Transmission Expansion Planning (TEPPC). The TEPPC data was converted from the SSG-WI data in late 2006.5 The SSG-WI dataset began with earlier work done by the RMATS group and was compiled using submissions from WECC members. The transmission network, bus locations and base generation data were derived from a TSS power flow case and the loads were derived from the LRS subregion-level load forecasts. During 2007 the TEPPC dataset was updated to support studies for a 2017 study year based on direction from the TEPPC support committees. A new network was imported from a TSS power flow case. The existing generation was reviewed and updated, and the incremental generation was tied more closely with the LRS planned generation. The load forecasts and fuel prices were updated as were the thermal generator operating characteristics (heat rates, ramp rates, start-up costs, etc.). The TEPPC dataset is publicly available for use by other organizations for studies of specific proposals or subregional evaluations. In order to make this a public dataset, TEPPC used only sources that were considered non-confidential.
The TEPPC dataset is used in production cost simulation models to evaluate transmission system congestion. These simulations are optimization exercises that minimize the overall production cost to serve loads subject to transmission and generator operating constraints. Transmission congestion is an indication that power flow from one area to another area is restricted. Congestion is often associated with resource shortages or a price differential between areas. When congestion occurs it means that system constraints prevent the use of a lower cost resource because it cannot be delivered. Instead higher cost resources must be dispatched to serve loads, resulting in an increase of overall system production cost. The congestion studies consider different resource portfolios and transmission scenarios that may exist in the future. The TEPPC studies usually involve an hourly simulation for an entire future year, e.g. the 5th or 10th year of a planning period. Simulation models economically dispatch generation for all 8,760 hours to meet the hourly loads in the study year based upon minimizing energy cost for each hour.
The TEPPC dataset is very large and complex. To minimize duplication of effort, TEPPC has established procedures that take advantage of synergies with the other planning functions. The LRS data is used to establish peak loads and load profiles and the TSS power flow data is used to describe the transmission network (busses, lines and transformers). However, there is other data needed by TEPPC, which is not used by others, to describe the economic performance of generators such as start-up time, minimum run-time, ramp-rates, start-up cost, operational cost, unit heat-rate, etc. LRS and TEPPC are considering requesting information for the same areas in the LRS annual data request which would simplify the collection process and improve use of common data.
5 PacifiCorp did most of the initial compilation work for the SSG-WI dataset. The formation of TEPPC provided for ongoing maintenance when responsibility for the dataset was transferred to WECC.
Page 11 of 26

Version R1 (Clean/8Sep08)
Page 12 of 26
D. Load Data Observations and Comparisons
The differing use of load data by the three planning functions is explained in this section. Further detail on differences in terminology, collection cycles by data type and a comparison of data types by planning function are provided in Appendices C, D and E respectively. The most significant difference between the LRS load and the TEPPC load is the peak coincidence factors. The LRS studies assume that all of the individual bubble peak loads occur at the same time each month for purposes of load summations or aggregations. This is a non-coincidental approach and tends to overstate regional or system load summaries because it ignores the natural time diversity in peaking behavior across the interconnection. Figure 2 is a hypothetical example of peaking diversity that shows how the loads of three separate areas vary over a nine day period with the total peak load occurring at a different time than any of the individual area peaks.
0
50
100
150
200
250
300
350
1 9 17 25 33 41 49 57 65 73 81 89 97 105 113 121 129 137 145 153 161 169 177 185 193 201 209
Time, Hours
Are
a an
d To
tal L
oads
, M
W
Non-coincidental Peak Load = 300 MW = Peak Area A + Peak Area B + Peak Area
Area A Area B Area C Coincidental Load Non-Concidental Load
Total Coincidental Peak Load = 275
C
Peak Area B =100 MW
Peak Area A =100 MW
Figure 2. Example of Load CoincidenceFigure 2. Example of Load Coincidence
Peak Area C =100 MW
The three areas shown (A, B and C) have loads that peak at 100 MW at different times of the period. The sum of their individual area peaks (the non-coincidental peak) is 300 MW. However for this period the maximum combined total load of all three areas (the coincidental peak) is 275 MW which occurs at a different time than any of the area load peaks. Thus at the

Version R1 (Clean/8Sep08)
coincidental peak there is 25 MW of load diversity that provides opportunities to share generation. The effect of coincidence in the load data used by LRS and TEPPC in the 2007 data collection cycles is shown in Table 2. This table does not compare data used by TSS, because the TSS load figures serve a different purpose, i.e., produce a given system stress condition, and cannot be compared on a one-for-one basis with LRS and TEPPC data. The LRS forecast is a 1-in-2 forecast, i.e., a forecast with a 50% probability of not being exceeded. The TEPPC forecast is a similar type forecast.
Table 2. 2017 Total Peak Load Forecasts (MW)
Data Description LRS TEPPC Variance from LRS
Variance (%)
Summer Peak Comparisons Non-Coincidental Peak Load (NCP) - Jul 2017 (MW)
191,0796 187,611 3,468 1.8
Coincidental Peak Load (CP) – Jul 2017 (MW) N/A 175,5787 --- ---
Load diversity NCP and CP – Jul 2017 N/A 12,033 --- ---
Winter Peak Comparisons Non-Coincidental Peak Load – Dec 2017 (MW) 156,9433 154,275 2,668 1.7
Coincidental Peak Load – Dec 2017 (MW) N/A 147,4838 --- ---
Load diversity NCP and CP – Dec 2017 N/A 6,792 --- ---
The variances in peak load data occur because of TEPPC modeling decisions. For instance, for the July 2017 peaks the variance can be attributed to three factors: (1) A 204 MW difference results from the use of the Northwest Power and Conservation Council’s load forecast for hydro-generation modeling. (2) California demand was reduced 1,704 MW to model pumping loads, efficiency programs, and rooftop solar. (3) A 1,560 MW PacifiCorp difference is attributable to adjustments made as part of increasing the load bubble granularity. The energy load forecasts are also different as shown in Table 3. It should be noted that the LRS 2017 forecast was escalated from the previous year values because 2017 values were not provided.
6 Where the optional 2017 LRS peak load forecasts were not provided the 2017 forecasts are escalations based on the percentage change from 2015 to 2016 and applied to the forecasted load number for 2016. 7 TEPPC peak load forecasts for the coincident peak hour July 13, 2017 HE 16 from study prepared 11Jan2008. 8 TEPPC peak load forecasts for the coincident peak hour December 13, 2017 HE 19 from study prepared 11Jan2008
Page 13 of 26

Version R1 (Clean/8Sep08)
Table 3. 2017 Total Energy Forecasts (GWh)
Year LRS TEPPC Variance from LRS
Variance (%)
2017 (GWh) 1,050,786 1,021,289 29,497 2.8
As Table 3 shows, there is a larger variance in the energy forecast than the peak forecasts. This difference is mainly due to the decision of the TEPPC group to modify the LRS data to reflect energy changes associated with the changes discussed above for peak forecasts from California, the Pacific Northwest, and the Pacificorp area of Utah/Wyoming. These three differences account for 28,760 GWh or 97.5% of the 29,497 GWh variance. The major load adjustments were:
a. California (19,927 GWh) i. The CEC and CAISO provided a modified load forecast that accounted for
rooftop solar, efficiency programs, and pumping loads. ii. The pumping loads9 are entered as negative generators in TEPPC to
maintain consistency with the power flow data and the bus type designations and to prevent Promod from applying the hourly shape to the pump loads.
b. Pacific Northwest (1,566 GWh) i. Northwest loads are closely linked with the fixed hydro data and it is
necessary to also correlate the load forecasts with the hydro data. This is accomplished by using the NWPCC forecasts. These forecasts also adjust for coincident peak loads.
ii. Idaho Power Company has chosen to divide their loads into more granular areas.
b. Utah and Wyoming (7,267 GWh) i. Pacificorp provided an updated forecast decreasing the Utah and Wyoming
energy load forecast. ii. Pacificorp also supplied a more granular load forecast for each area or
bubble in their footprint.
In Promod, load must be specified by bubble but is applied to individual buses by the model. The load forecast is developed by LRS and modified by TEPPC on a bubble basis. In order to distribute loads from bubbles to specific bus locations, bus distribution factors must be calculated. When TEPPC imports the transmission network data from a TSS base case, it also imports the bus loads. The TSS bus loads are used to calculate the bus load distribution factors. No other use is made of the TSS load figures. Promod uses the hourly load shapes for each bubble, the monthly peak and energy forecasts, and bus load distributions factors to calculate bus level loads for each hour of the study. Load forecasts variance between the LRS and the TEPPC is also the result of using different load topologies. In order to protect confidential load data, the LRS studies allocate the load to 26 bubbles, and the results are then aggregated into 7 sub regional zones. This same treatment is not required for the TEPPC results because the TEPPC dataset uses publicly available sources, so data confidentially is not needed. The LRS group is currently considering adopting the 9 Dispatchable pumping loads – see footnote #1 above.
Page 14 of 26

Version R1 (Clean/8Sep08)
TEPPC topology which would eliminate the data allocation differences, however, the aggregation of results from LRS studies would still be required in order to protect confidential load data in the first three years of the ten-year data set. A common error is the comparison of peak load data without considering the peaking coincidence. For instance, care must be taken in using LRS non-coincidental peak load data (the sum of the peak demand in the 26 bubbles regardless of when they occurred) with TEPPC coincident peak (the greatest demand for the Western Interconnection in a single hour). As shown in Table 2 above, for the 2017 Peak Load Forecast,, the difference between the non-coincidental and coincidental demand forecast is substantial.
Page 15 of 26

Version R1 (Clean/8Sep08)
E. Generation Data Comparisons and Observations
The LRS generation data is a detailed listing of the unit level generation in WECC. Each year the WECC Balancing Authorities (and some Planning Authorities) provide updates to the data during the LRS data update process.
Because the TSS generation and load figures serve a different purpose, i.e., produce a given system stress condition, the output levels in TSS base cases cannot be compared on a one-for-one basis with LRS or TEPPC generator output data. In addition, TSS generation data is mostly at the individual unit level with the exception of the aggregation of smaller generation units that have a negligible effect on the outcome of power flow and stability studies. Historically dataset size constraints were also a factor in TSS generator modeling. Many utilities still find that some unit level data is not needed for accurate representation. At present there are no links between the LRS generators and the TSS generators other than those created in creating the TEPPC dataset. This poses something of a problem for TEPPC. TEPPC generation location data is derived from a TSS power flow case, since every generator must to be assigned to a bus in the power flow data. Many of the smaller generators in WECC have been entered in the TSS data as an aggregated unit and can not be tied directly to the LRS or TEPPC data. Quite often the unit names in the LRS data and the TSS data are not the same. It is also not unusual for the names and sometimes bus number of the resources to change from year to year. Many times when the generating units are aggregated, the aggregations are not documented. If a unique, permanent identifier were assigned to each generator, it would be much easier to sort out this confusion. Because names and bus numbers change over time, the best identifier for each generator would be its GIS coordinates. Using latitude and longitude, the data for generators could be more easily compared for consistency, inclusion, etc. Geographic proximity can be used to understand and rationalize aggregations. Names may change, but the physical location will not change making it much easier to control verification of year-to-year changes. There will undoubtedly be concerns among WECC members regarding the use of GIS coordinates and system security concerns. The collection of the data by GIS coordinate, need not mean release of the coordinates in TEPPC, LRS or TSS datasets. Their availability to the staff will make a significant savings the effort required for reconciling generator data among the three planning datasets. The TEPPC data also has unique generator data not used by LRS or TSS. These elements include, but are not limited to: heat rates, fuel costs, generator emissions, forced outage rates, ramp rates, O&M costs, startup costs, maintenance requirements, and minimum up and down times. Since only TEPPC’s analysis uses this data in Promod, there would be no particular advantage to including such data in a combined planning dataset. There are many ways to compare the generation data for the three planning functions. Because of subtle differences, it is easy to make incorrect comparisons. The improper accounting of de-rates, unavailable units, pumping loads (negative generators), and negative bus loads can produce confusing results. Furthermore as noted above, the naming conventions used in the multiple datasets are often so different that a unit by unit reconciliation is impossible. WECC
Page 16 of 26

Version R1 (Clean/8Sep08)
has developed an initial cross-reference table that includes approximately 60% of the generators and this cross-reference will continue to be maintained although use of GIS coordinates in the data would greatly simplify the effort required.
For the purposes of this paper, it is necessary to compare the LRS and TEPPC generator data. Table 4 is a comparison of the 2007 LRS generation to the 2007 TEPPC generation.
Table 4. Generation Data Comparison
Data Description LRS Summer (MW)
TEPPC Maxcap (MW)
Variance from LRS
Variance (%)
Existing Generation 209,83010 208,81511 1,015 0.5 Class 1 & 2 additions 16,778 17,097 (319) (1.9)Subtotal (eg+c1+c2) 226,608 225,912 696 0.3 Class 3 additions 45,523 29,816 15,707 35.0Total (all classes) 272,131 255,728 16,403 6.0
The variance is less than one percent for the existing generation and less than two percent for the class 1&2 incremental generation. Considering the capacity definitions described in Appendix C, a variance should not be unexpected, even for the same generation footprint.
As noted above, the aggregation of small generating units in the TEPPC dataset makes it difficult, if not impossible, to reconcile to the generating units in the LRS dataset. Furthermore these differences will continue to exist, due to the differences in the nature of the analytic studies these datasets support. The class 3 additions are not equivalent data items. The TEPPC class 3 generation is a collection of proposed and hypothetical “gap” generators taken from SSG-WI, LRS, and the TAS Studies Work Group. This includes a portfolio of renewable generation developed by SWG to meet the State RPS requirements. The class 3 generation units identified in the LRS data are planned additions that were reported to WECC through the LRS data collection process. The TEPPC process requires bus location identifications, while specific information regarding location and even generation type is not available for some of the LRS generation.
10 Excludes de-rates of -16,970 MW. 11 Excludes negative bus loads of 549 MW and pumping loads of 2,302 MW for a total of 2,851 MW.
Page 17 of 26

Version R1 (Clean/8Sep08)
F. Conclusions and Recommendations
Understanding the reasons for the differences in the data collected and used by the three planning groups should help reduce concern about the existence of three planning data sets and the differences that exist between them. The required load, generation and transmission data used by the different planning groups is unique to their studies and, although similar terminology is used in describing the data, the differences that exist are specific to the type of study being conducted and the time-frame of the events analyzed. Table 5 summarizes the load and generator data usage of the three WECC planning groups. Table 6 highlights the difference in the content of the three datasets.
Table 5. Comparison of Data Use by Planning Groups
Load Element LRS TSS TEPPC Probability 1-in-2 Case dependent 1-in-2 Monthly Peak Non-coincident Coincident Coincident Granularity Bubble Bus Bubble and Bus Period Monthly peak Single hour Hourly for 1 year
Table 6. Comparison of Dataset Contents
Generator Parameter LRS TSS TEPPC Name and physical location • • Maximum Capacity • • • In-service date • • Bus Location • • Minimum Capacity • Heat Rate of Thermal units • Operational Limits • Forced Outage Rates •
As TEPPC develops procedures for updating the TEPPC datasets they will continue to take advantage of the LRS and TSS data processes wherever appropriate. There are already some procedures in place for importing the TSS power flow case transmission networks and updating the load and generation data from the LRS data. However, it appears there are additional modifications to the data collection process that could eliminate data misalignment, notably the use of GIS coordinates for the identification of generating units. In addition, LRS and TEPPC could use the same regional bubble topology for load forecasts during the annual LRS data collection process. These two steps would minimize allocation differences and simplify the data collection process. The data comparisons in the body of this paper show, that although the multiple datasets are reasonably comparable when appropriate reconciliation adjustments are made, there are still reasons for these differences to continue to exist. Differences in the time focus of studies and the software tools used for analysis demand different types of information not common among the
Page 18 of 26

Version R1 (Clean/8Sep08)
three groups. The greatest overlap is between TEPPC and LRS load and generation data which is discussed in some detail above. However TEPPC must collect a substantial amount of generator information not used by LRS. For the present, the most practical approach appears to be continuing with three separate LRS, TSS and TEPPC datasets with better coordination of the data and unique generation identities. While separate data sets are manageable for the present, there has been an ongoing interest in developing a unified database for WECC. Therefore, it is recommended that TEPPC, LRS and PCC investigate the value of future adoption of a common planning database structure.
1. The investigation should consider both the form and the content of a unified database. a. The form could be a relational database that minimizes storage and allows the
used of data queries to extract needed data from the database. b. The content might follow the CIM (Common Information Model) being
developed by the industry for data sharing.12 2. In this database investigation, particular consideration should be given to:
a. The importance of tracking data changes across time, b. The need to provide a user-friendly member interface for gathering and reviewing
data, c. The practical utility to the study groups of a unified database and d. The benefits and costs of developing and using a unified database structure.
12 EPRI is applying the CIM approach to power flow data and is considering its application to dynamics data.
Page 19 of 26

Version R1 (Clean/8Sep08)
Appendix A Frequently Asked Questions
1. Why are the TEPPC peak loads different than the LRS peak loads?
The LRS peak loads assume that all of the individual peak loads occur at the same time (non-coincidental) while TEPPC runs an hourly dispatch using coincidental peak loads. For July 2017 this accounts for 12,033 MW of the 15,436 MW variance. The modeling of several California pump loads as negative generators reduces the TEPPC load by an additional 2,302 MW.
2. Why are the TSS loads different than the LRS loads?
The TSS power flow cases are developed on a different cycle and serve a different purpose than the LRS data. There are also eleven power flow cases developed each year and only one LRS dataset. There is no correlation between the TSS Data and the LRS Data, nor should there be.
3. What is the relationship between the LRS generator “nameplate” and the TSS “Pmax” values?
The nameplate is associated with the design capability while the Pmax is associated with the operational capability. Sometimes they match and sometimes they do not. Pmax is changed when a generator is re-rated to match the maximum gross output available in a given study, with generator station service being explicitly modeled. The LRS nameplate is based on the original machine design.
4. Why don’t the maximum generator capacities from the three datasets line up more closely?
• It is very difficult to match up the generators in the datasets. The naming conventions are different and several generators don’t seem to have matches. Differences in unit aggregation aggravates the problem of matching units.
5. Has the generator data been reconciled previously?
The WECC staff has reconciled the generator data several times over the last ten years. This includes comparisons between the LRS data and the TSS data, and comparisons between the LRS data and other published sources such as the EIA data, state agencies, and IRPs. Last year the TEPPC data was reconciled against the LRS data and was also distributed to the WECC members for their review. Generator reconciliation is an on-going process.
6. Is LRS generator data used directly in the TEPPC dataset?
No, because the LRS data doesn’t include the generator bus assignments. The LRS seasonal capacities are also not representative of the generator’s maximum capacity. The decision by RMATS and SSG-WI to base the generation data on the TSS power flow is consistent with the use of a power flow model in production cost simulation. Most of the TEPPC maximum capacities are equal to the Pmax minus station service. This paper recommends that consideration to given to all three planning groups using GIS coordinates for all generation data. This would provide a unique location for all generators that could be linked to bus numbers and reduce staff time used in verifying completeness of data supplied.
Page 20 of 26

Version R1 (Clean/8Sep08)
Page 21 of 26
GroupBubble
AreaName
L&R Energ
Appendix B
y7 Year
EscalationTEPPC Energy Variance
AESO 92,678 92,677 (1)BCTC 71,676 71,675 (1)APS 42,261 42,260 (1)SRP 40,047 40,047 (0)TEP 15,425 15,426 1
WALC 13,116 13,114 (2)IID 5,030 5,032 2
LDWP 32,300 32,302 2PG&E_BAY 52,884PG&E_VLY 60,505
SDGE 24,267SCE 118,614
SMUD 22,079 23,552 1,473TIDC 3,105 3,261 156PSC 50,397 50,398 1
WACM 28,099 28,098 (1)FAR EAST 2,732MAGIC VLY 4,983TREAS VLY 11,531
GOSH 2,028 0Mexico CFE 19,780 19,779 (1)
NWMT 11,518 11,176 (342)WAUW 586 588 2NEVP 32,927 32,926 (1)SPP 13,471 13,470 (1)EPE 10,553 10,552 (1)PNM 18,026 18,026 (0)AVA 17,357 16,839 (518)BPA 48,969 52,393 3,424
CHPD 4,743 4,609 (134)DOPD 1,947 1,889 (58)GCPD 5,556 5,387 (169)PACW 23,203 21,308 (1,895)PGN 25,951 25,170 (781)PSE 28,065 27,236 (829)SCL 10,853 10,533 (320)
TPWR 5,882 5,707 (175)UT N 33,064UT S 3,771
BIG HORN 2,103CENTL WYO 2,425
SW WYO 6,955Total 1,050,786 1,021,292 (29,494)
(All volumes in GWh)
Canada
Arizona
California
Colorado
Utah
Wyoming
19,906Idaho
Montana
Nevada
New Mexico
2017 Energy Load Comparison
277,668
57,613
(21,398)
(660)
(7,267)
Northwest
Version R1 (Clean/8Sep08)
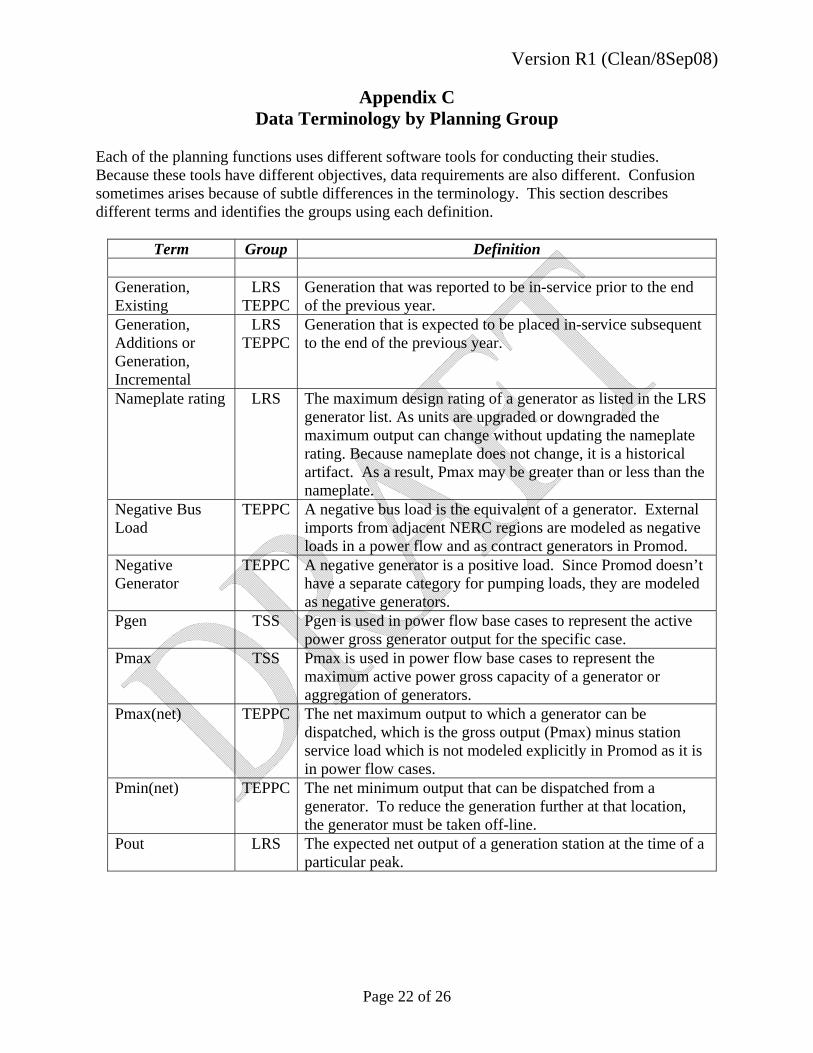
Appendix C Data Terminology by Planning Group
Each of the planning functions uses different software tools for conducting their studies. Because these tools have different objectives, data requirements are also different. Confusion sometimes arises because of subtle differences in the terminology. This section describes different terms and identifies the groups using each definition.
Term Group Definition Generation, Existing
LRS TEPPC
Generation that was reported to be in-service prior to the end of the previous year.
Generation, Additions or Generation, Incremental
LRS TEPPC
Generation that is expected to be placed in-service subsequent to the end of the previous year.
Nameplate rating LRS The maximum design rating of a generator as listed in the LRS generator list. As units are upgraded or downgraded the maximum output can change without updating the nameplate rating. Because nameplate does not change, it is a historical artifact. As a result, Pmax may be greater than or less than the nameplate.
Negative Bus Load
TEPPC A negative bus load is the equivalent of a generator. External imports from adjacent NERC regions are modeled as negative loads in a power flow and as contract generators in Promod.
Negative Generator
TEPPC A negative generator is a positive load. Since Promod doesn’t have a separate category for pumping loads, they are modeled as negative generators.
Pgen TSS Pgen is used in power flow base cases to represent the active power gross generator output for the specific case.
Pmax TSS Pmax is used in power flow base cases to represent the maximum active power gross capacity of a generator or aggregation of generators.
Pmax(net) TEPPC The net maximum output to which a generator can be dispatched, which is the gross output (Pmax) minus station service load which is not modeled explicitly in Promod as it is in power flow cases.
Pmin(net) TEPPC The net minimum output that can be dispatched from a generator. To reduce the generation further at that location, the generator must be taken off-line.
Pout LRS The expected net output of a generation station at the time of a particular peak.
Page 22 of 26

Version R1 (Clean/8Sep08)
Appendix D Data Collection Cycle by Data Types
Each of the planning functions operates on a time scale that is driven by either an annual reporting requirement or by obligations to WECC members. The current data collection cycles are shown in the following table.
Data Type Due Date Notes LRS Existing Generation 11-16 This was the date for the 2007 LRS collect process. The date for the
2008 process will be determined by the LRS. LRS Generation Additions 11-16 LRS Actual Year Resources 11-16 LRS Peak – Future 11-16 LRS Energy Load – Future 11-16 LRS Peak – Actual 2-8 This was the date for the 2007 LRS collect process. The date for the
2008 process will be determined by the LRS. LRS Energy Load – Actual 2-8 LRS Summer Update 3-4 This data is used for the NERC seasonal assessments LRS Winter Update 9-12 This data is used for the NERC seasonal assessments LRS LTRA Update 3-25 This data is used for the NERC Long Term Reliability Assessment PSA GenAdd Criteria 2-29 This was the date for the 2008 PSA collect process. The date for the
2009 process will be determined by the PSATF. PSA Path Limits 2-29 SRWG Power Flow data On going 11 data requests spread throughout the year Hourly Demand Data 2-14 TEPPC Fuel Costs 6-1 This was the date for the 2007 TEPPC process. TEPPC Bubble Loads 6-1 This was the date for the 2007 TEPPC process. TEPPC Study Requests 1-31 This was the date for the 2007 TEPPC process.
Page 23 of 26

Version R1 (Clean/8Sep08)
Appendix E Data Types by Planning Function
The following tables provide a comparison of the modeling data used by each planning function. In order to insure that the correct data is used for individual studies, it is advised that a member of WECC staff, who is familiar with the individual data elements, be contacted before beginning any study using WECC data. This contact information can be located at the WECC website: www.wecc.biz.
Loads Group Description
LRS Bubble level. The LRS monthly peak loads and energy loads are used directly in the reports listed under item A-1 above. The annual LRS data collection cycle begins in October and ends in February. The hourly demands are not used except to verify the other historic load data.
TSS Bus level. The power flow data contains loads for each load bus and represent the assumed loads for the specific power flow cases. Pumping loads are typically represented as negative generators.
TEPPC Bubble level and Bus level. The production cost models require an hourly load shape for each bubble. Monthly peak and energy values are used to scale the hourly shapes across each month to determine hourly loads for each bubble. Load distribution factors must be used to put an appropriate amount of the total bubble load at transmission system buses. The default source of the monthly peak and energy values is the LRS data; however, entities are allowed to override these with their own values. In 2007 California, Idaho, PacifiCorp, and the Northwest NWPCC footprint elected to submit overrides to the LRS load forecasts. Refer to section E for more information about the overrides.
Existing Generation Capacity – Thermal Units
Group Description LRS The data submittal instructions specify that the generation capacity be reported as
“those net kW ratings for individual generating units which the owner is willing to use for regular day-to-day operation. An owner may include units which are not operated on a day-to-day basis but which are maintained in operable condition. Ratings would be based on the capability expected by the operator at the time of the monthly or seasonal peak load. Such ratings will be based on condensing water temperatures and ambient temperatures which influence capability at the time of peak load.” Capabilities for a peak winter and a peak summer condition are requested. The reported capabilities tend to be less than the nameplate capacities by an average of 3%. In a few instances other de-rates are inserted into the data to account for operational limitations and the CAISO market process.
TSS The power flow data has a Pgen capacity that represents the unit generation at the time of the snapshot and a Pmax capacity that represents the maximum gross generation. The Pmax values may or may not match the nameplate values in the LRS data. Station service is represented as a separate load.
Page 24 of 26

Version R1 (Clean/8Sep08)
TEPPC Historically the generation data for transmission expansion/congestion studies has used a net capacity value defined as the power flow Pmax minus station service. In the general table of generators in Promod IV this field is called “max capacity”. The value needs to be something close to the maximum annual net capability of the generator. The monthly de-rate factors are entered in other tables.
Existing Generation Capacity – Hydro Units
Group Description LRS The summer and winter capabilities for hydro generation are closely tied to the
nameplate ratings. To decrease these to the desired peak-time capacities for a “median hydro” condition separate de-rates are included for each hydro generator or group of hydro generators. These de-rates can be quite substantial.
TSS The power flow data has a Pgen capacity that represents the unit generation at the time of the snapshot and a Pmax capacity that represents the maximum gross generation. The Pmax values may or may not match the nameplate values in the LRS data. Typically the capacity for hydro units are more aggregated than are thermal units.
TEPPC The hydro generation in the TEPPC dataset was originally derived from a power flow case. This helps to explain the aggregation and relationship to the Pmax values. The “max cap” values need to be something close to the maximum annual net capability of the generator. The seasonal, monthly, and hourly de-rates are entered in other tables. Many of the hydro units have a fixed hourly shape that drives their output.
Existing Generation Capacity – Wind Units
Group Description LRS The summer and winter capabilities for wind generation are more closely tied to the
nameplate ratings. To decrease these to reasonable expectations separate de-rates are included for each wind generator or group of wind generators. These de-rates can be quite substantial.
TSS The power flow data has a Pgen capacity that represents the unit generation at the time of the snapshot and a Pmax capacity that represents the maximum gross generation. The Pmax values may or may not match the nameplate values in the LRS data.
TEPPC The wind generation in the TEPPC dataset was originally derived from a power flow case. The “max cap” value is the installed capacity of the generator. All of the wind units have a fixed hourly shape based on meso-scale wind power output models which determines the energy output for each hour.
Generation Additions / Incremental Generation
Group Description LRS The submitted LRS data includes planned generation projects that were not in-
service at the beginning of the year but are projected to come on-line during the ten year reporting window. These units are assigned to status groups as documented in the LRS documentation.
TSS Future generation is based on each data submitter’s individual assumptions for each specific base case for the system conditions the case is designed to represent. Due to the number of base cases prepared each year there is an ongoing effort to refresh the incremental generation for each case. Generic gap generation is added as needed to meet the load assumptions.
Page 25 of 26

Version R1 (Clean/8Sep08)
Page 26 of 26
TEPPC Based on instructions from the studies work group the incremental generation is used to create different possible future generation portfolios. The data used for the TEPPC dataset is derived directly from the LRS generation additions. If additional generation is necessary for a specific case study, it will be added based on the direction of TEPPC’ the Studies Work Group. As updated information becomes available the data is refreshed to support the periodic data releases.
Transmission
Group Description LRS Bubble to bubble interconnection configuration only with no electrical detail. TSS The transmission network in a base case is compiled from the data submittals and
represents the detailed bus level network for the western interconnection. Additions are currently documented as the difference between the new case and the case from which it was developed.
TEPPC The network data (buses, lines and transformers) are drawn from a specific transmission case only a line’s net series reactance. TEPPC also needs to identify the additions in the case from the existing system.