wednesday 10 may 2017 geode workshop brussels and spring... · wednesday 10th may 2017 geode...
TRANSCRIPT
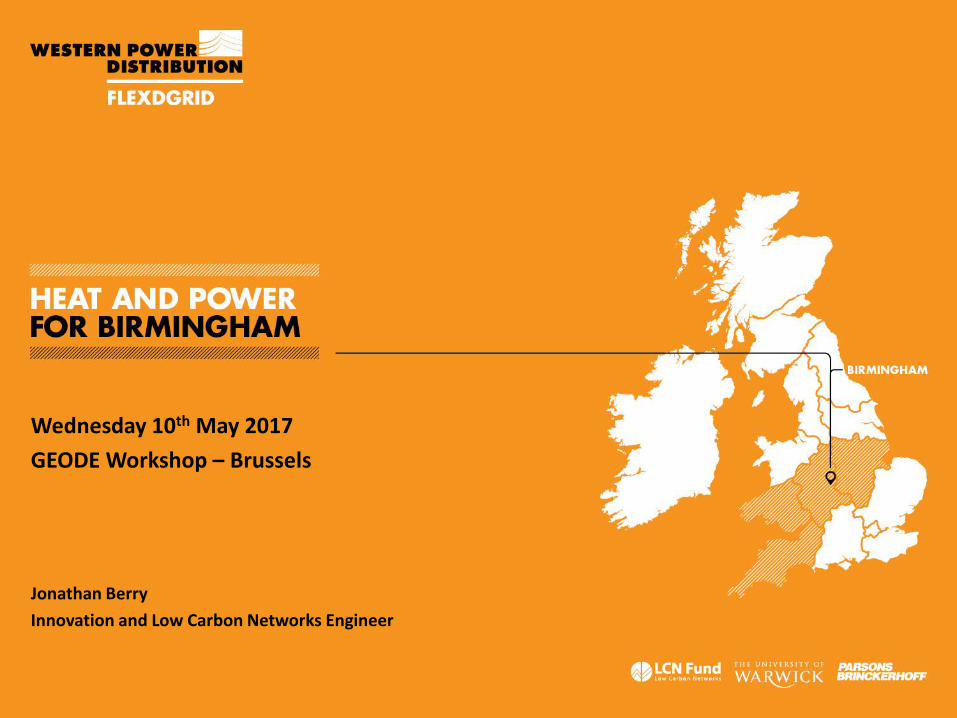
Wednesday 10th May 2017
GEODE Workshop – Brussels
Jonathan Berry
Innovation and Low Carbon Networks Engineer
Agenda
• WPD Introduction
• Project Overview
• Method Descriptions
• Outputs and Benefits

Who Are We?
•7.8 Million customers over a 55,300 sq kms service area
•Our network consists of 220,000 kms of overhead lines and underground cables, and 185,000 substations •4 out of 14 UK Distribution Licences
•LV to 132kV Network ownership
OPEN LV
Customers
• New connections • Upgrades • Information • Self Serve • Products/Service • Tariffs • Communities
Operations
• Reliability • Forecasting • DSO • DSR • GBSO Interface • Efficiency • SHE and Security
Assets
• Telemetry • Decision support • Improved assets • New assets • Flexibility • Automation • Incident response
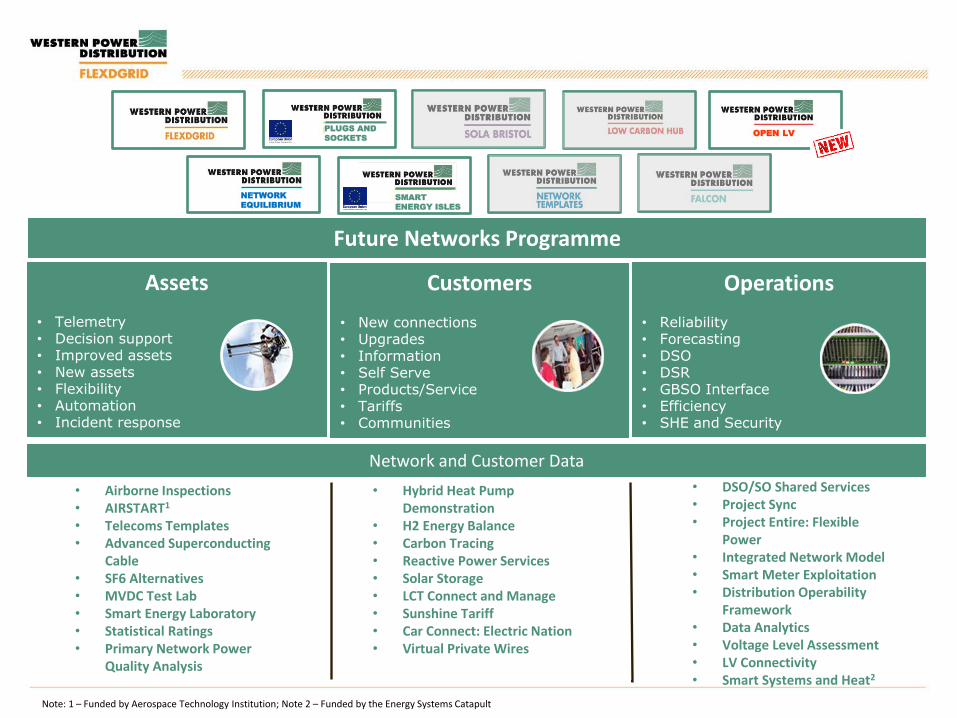
Future Networks Programme
Network and Customer Data
Note: 1 – Funded by Aerospace Technology Institution; Note 2 – Funded by the Energy Systems Catapult
PLUGS AND
SOCKETS
SMART
ENERGY ISLES
NETWORK
EQUILIBRIUM
• Airborne Inspections • AIRSTART1
• Telecoms Templates • Advanced Superconducting
Cable • SF6 Alternatives • MVDC Test Lab • Smart Energy Laboratory • Statistical Ratings • Primary Network Power
Quality Analysis
• Hybrid Heat Pump Demonstration
• H2 Energy Balance • Carbon Tracing • Reactive Power Services • Solar Storage • LCT Connect and Manage • Sunshine Tariff • Car Connect: Electric Nation • Virtual Private Wires
• DSO/SO Shared Services • Project Sync • Project Entire: Flexible
Power • Integrated Network Model • Smart Meter Exploitation • Distribution Operability
Framework • Data Analytics • Voltage Level Assessment • LV Connectivity • Smart Systems and Heat2

FlexDGrid – What and Why
What are we doing? Understanding, Managing and Reducing the Fault Level on an electricity network
Why are we doing it? Facilitating the early and cost effective integration of Low Carbon generation
Why are we doing it now? Supporting the Carbon Plan – Connection of generation to the grid and development of heat networks – reducing carbon emissions

What is Fault Level?
Technical Definition
A short circuit (fault level) is an electrical circuit that allows a current to travel along an unintended path with no or very low electrical impedance.
Examples of unintentional conducting paths in a 3-phase system (faults)
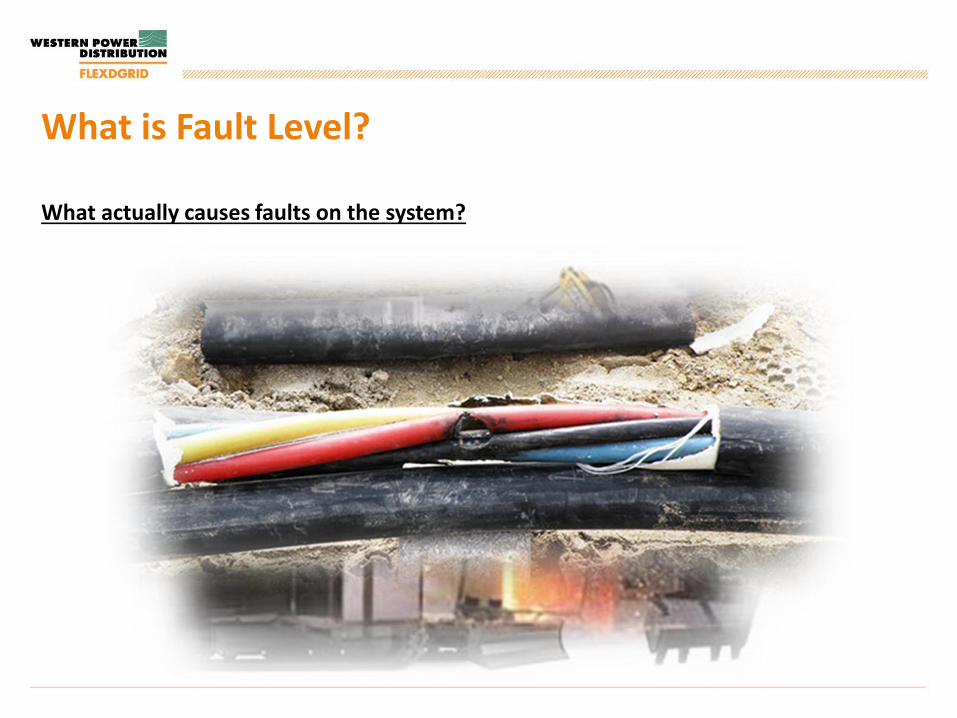
What is Fault Level?
What actually causes faults on the system?

FlexDGrid – Methods
Three integrated Methods leading to quicker and cost effective HV customer connections through a timely step change in the enhanced understanding, management and mitigation of distribution network fault level
Enhanced Assessment
• Enhanced network models
• Detailed understanding of network Fault Level
Management • Monitoring Fault Level (Steady-state)
• Measuring Fault Level (Faulted-state)
• Verify/Update network models
Mitigation • Reduction of system Fault Level
• Utilised from output of Management
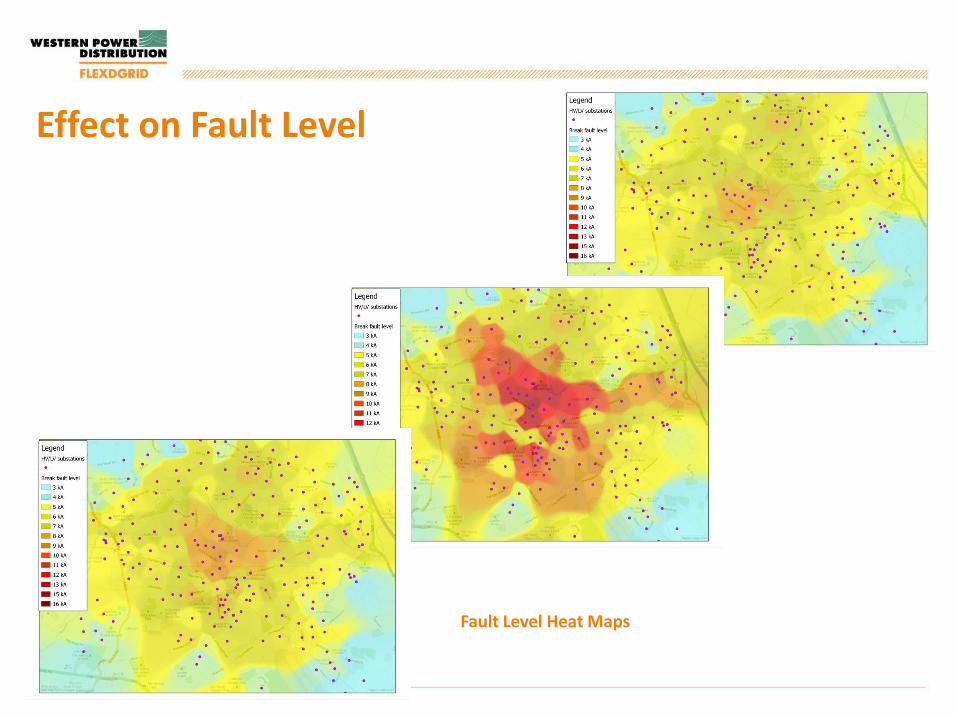
Effect on Fault Level
Fault Level Heat Maps
Project Team
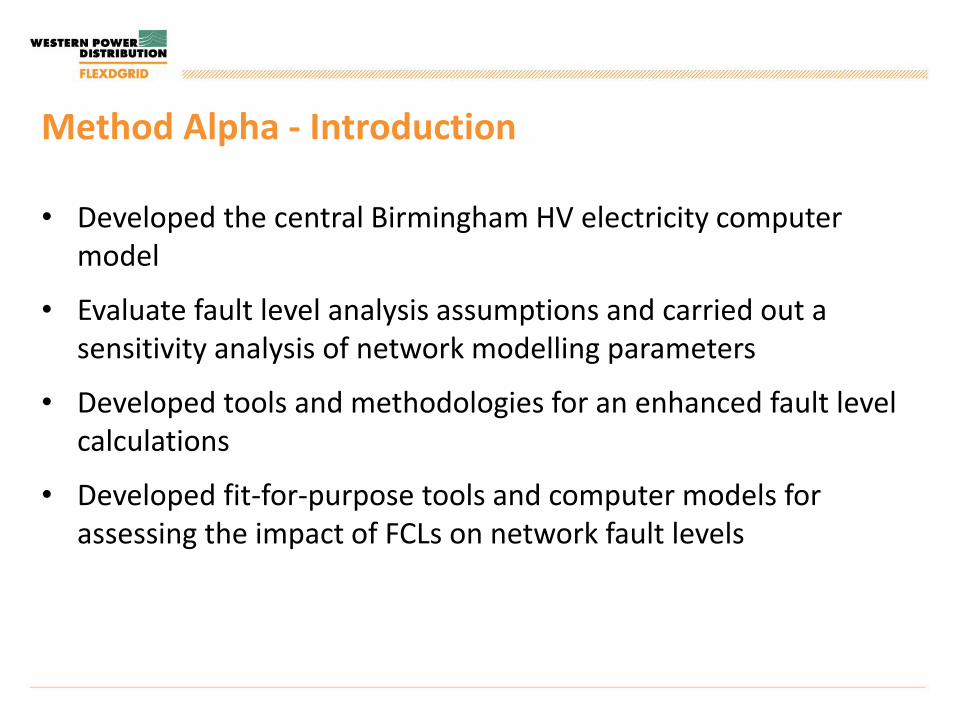
Method Alpha - Introduction
• Developed the central Birmingham HV electricity computer model
• Evaluate fault level analysis assumptions and carried out a sensitivity analysis of network modelling parameters
• Developed tools and methodologies for an enhanced fault level calculations
• Developed fit-for-purpose tools and computer models for assessing the impact of FCLs on network fault levels
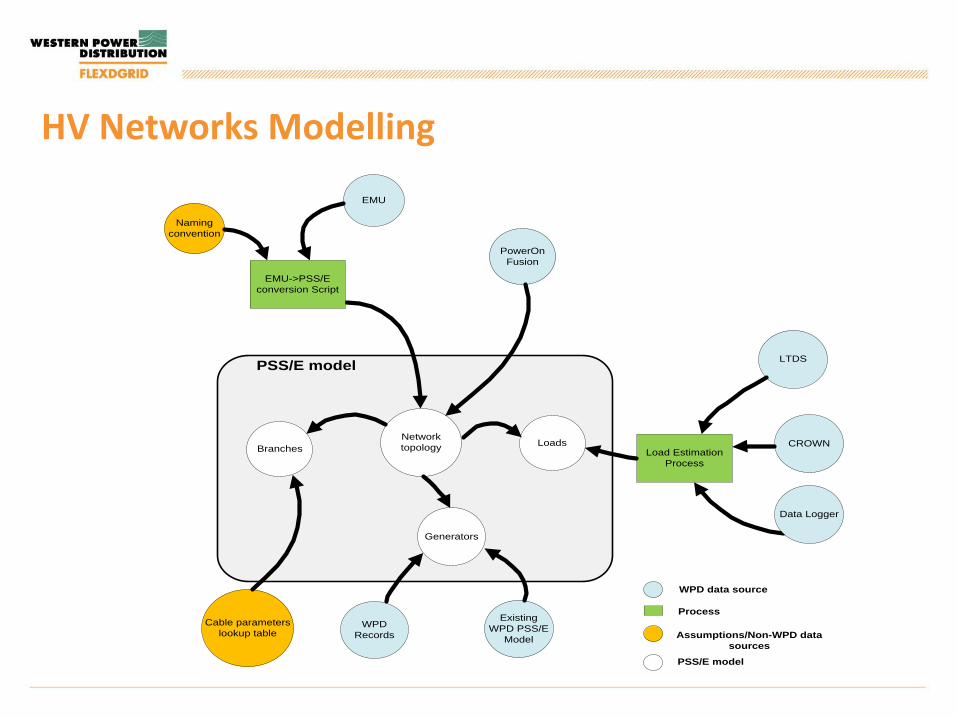
HV Networks Modelling
PSS/E model
EMU
BranchesLoads
Network
topology CROWN
Data Logger
Cable parameters
lookup table
Generators
Existing
WPD PSS/E
Model
WPD
Records
LTDS
Naming
convention
PowerOn
Fusion
EMU->PSS/E
conversion Script
Load Estimation
Process
WPD data source
Process
Assumptions/Non-WPD data
sources
PSS/E model

Fault level Sensitivity Analysis
0%
1%
2%
3%
4%
5%
6%
7%
8%
9%
Generation PF Primary tap position
Demand General load (MVA per MVA)
Cable length
Va
ria
tio
n in
3p
h f
au
lt c
urr
en
t
Making fault current Breaking fault current
Tools for Fault level analysis
Fault Level Guidance Tool
• Provide a fault level assessment platform for WPD planning engineers who may not have access to power system analysis software for connection studies as part of the G59 generation application process
• Reduce the time and effort that is spent on data gathering and network modelling for connection studies
• Method Beta: Fault Level Measurement Technology
• Build on knowledge learned through previous Projects
• Install an FLM technology in 10 separate WPD substations
• Use results from trials to inform changes to modeling policy
(Method Alpha)
• Customer control based on Fault Level Contribution
FlexDGrid – Method Beta Overview

FLM Technology
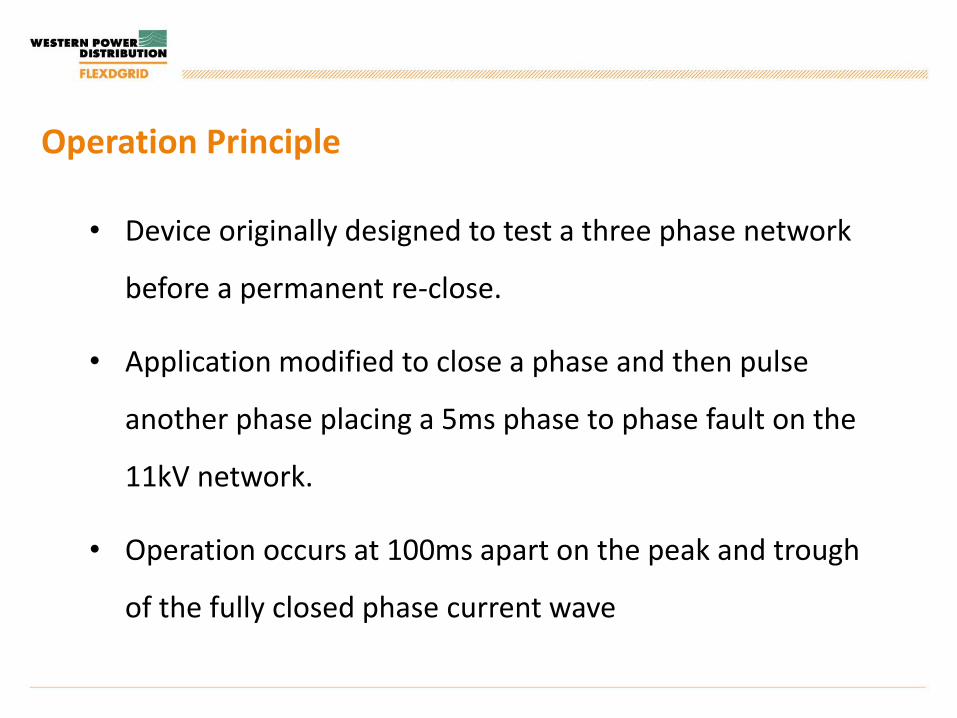
• Device originally designed to test a three phase network
before a permanent re-close.
• Application modified to close a phase and then pulse
another phase placing a 5ms phase to phase fault on the
11kV network.
• Operation occurs at 100ms apart on the peak and trough
of the fully closed phase current wave
Operation Principle

Single Line Diagram of the FLM
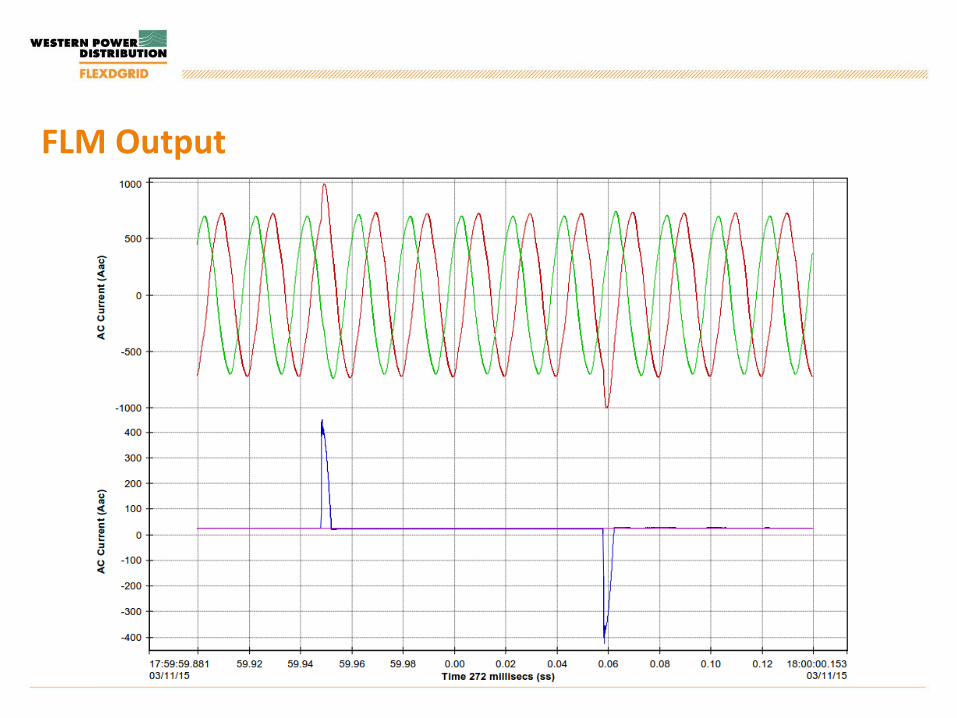
FLM Output
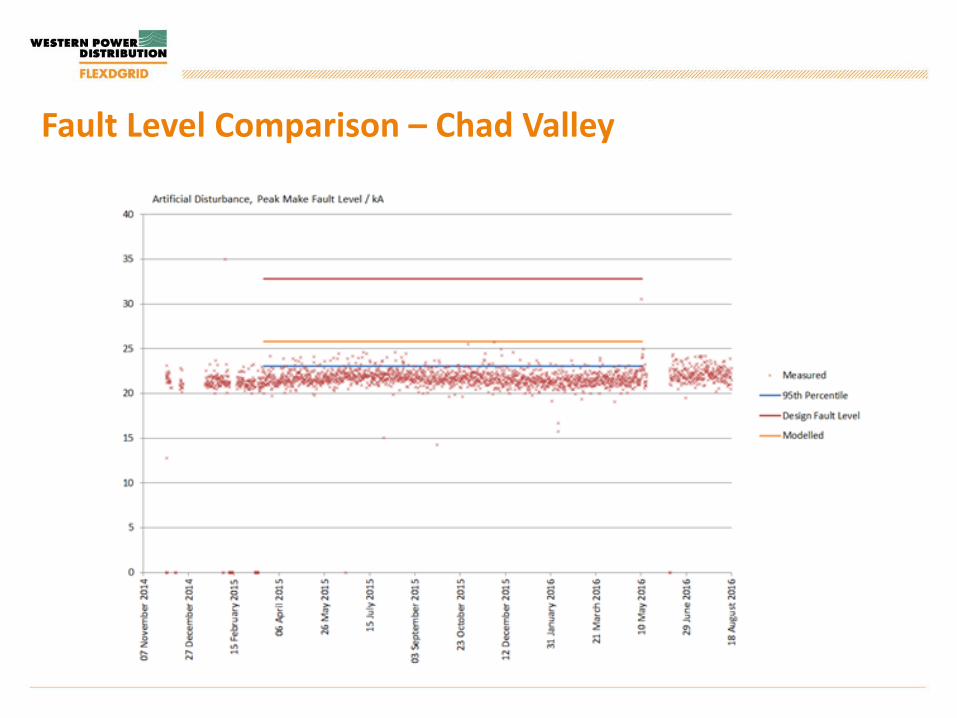
Fault Level Comparison – Chad Valley

• Method Gamma: Fault Level Mitigation Technologies
• Build on knowledge learned through IFI, ETI and LCNF
Projects
• Install 5 FL mitigation technologies in 5 separate WPD
substations
• Test & trial emerging technologies to quantify
performance and network benefits
FlexDGrid – Method Gamma Overview

FCL Modelling - Transient behaviour

FCL Technologies

Project Outputs
• Characterising load more accurately
• Provision of Alternative Connections
• Increasing DG connection capacity
• Policies and Procedures
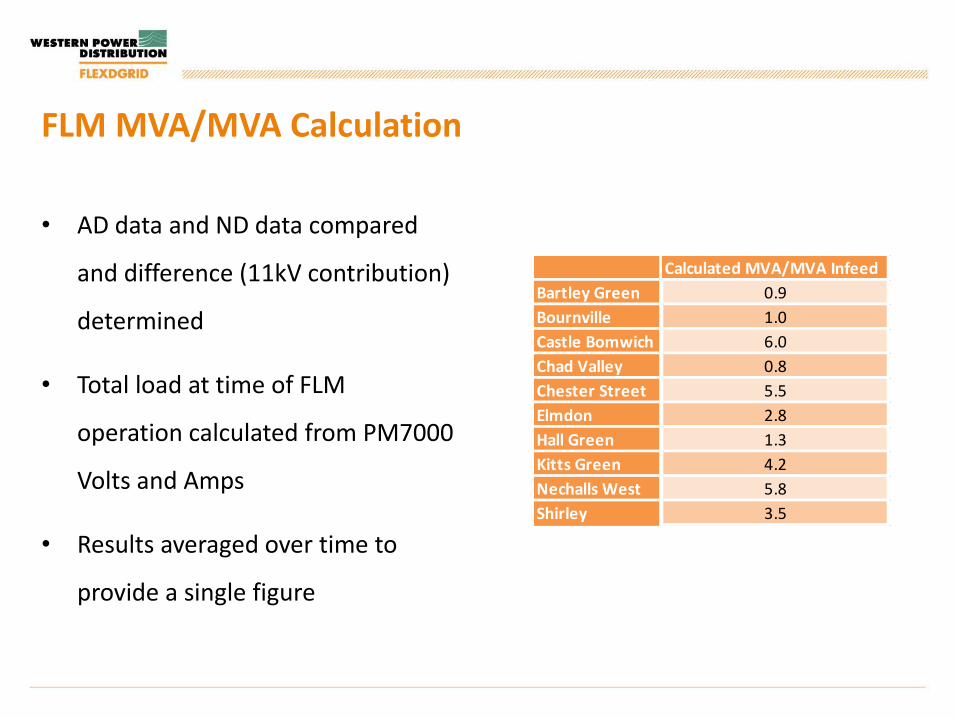
• AD data and ND data compared
and difference (11kV contribution)
determined
• Total load at time of FLM
operation calculated from PM7000
Volts and Amps
• Results averaged over time to
provide a single figure
FLM MVA/MVA Calculation
Calculated MVA/MVA Infeed
Bartley Green 0.9
Bournville 1.0
Castle Bomwich 6.0
Chad Valley 0.8
Chester Street 5.5
Elmdon 2.8
Hall Green 1.3
Kitts Green 4.2
Nechalls West 5.8
Shirley 3.5
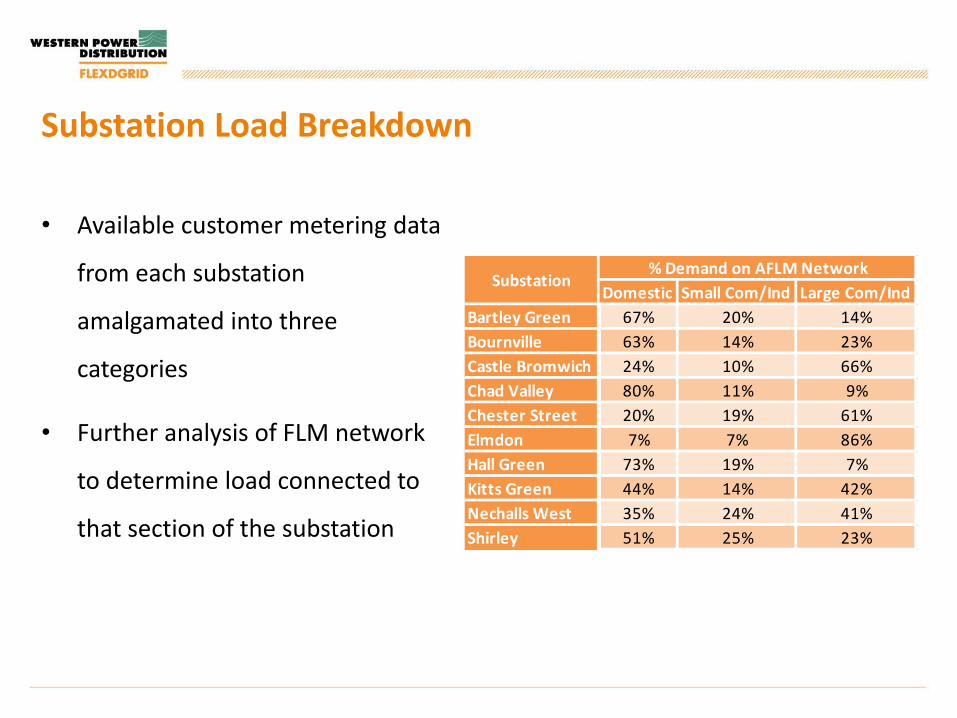
• Available customer metering data
from each substation
amalgamated into three
categories
• Further analysis of FLM network
to determine load connected to
that section of the substation
Substation Load Breakdown
Domestic Small Com/Ind Large Com/Ind
Bartley Green 67% 20% 14%
Bournville 63% 14% 23%
Castle Bromwich 24% 10% 66%
Chad Valley 80% 11% 9%
Chester Street 20% 19% 61%
Elmdon 7% 7% 86%
Hall Green 73% 19% 7%
Kitts Green 44% 14% 42%
Nechalls West 35% 24% 41%
Shirley 51% 25% 23%
Substation% Demand on AFLM Network
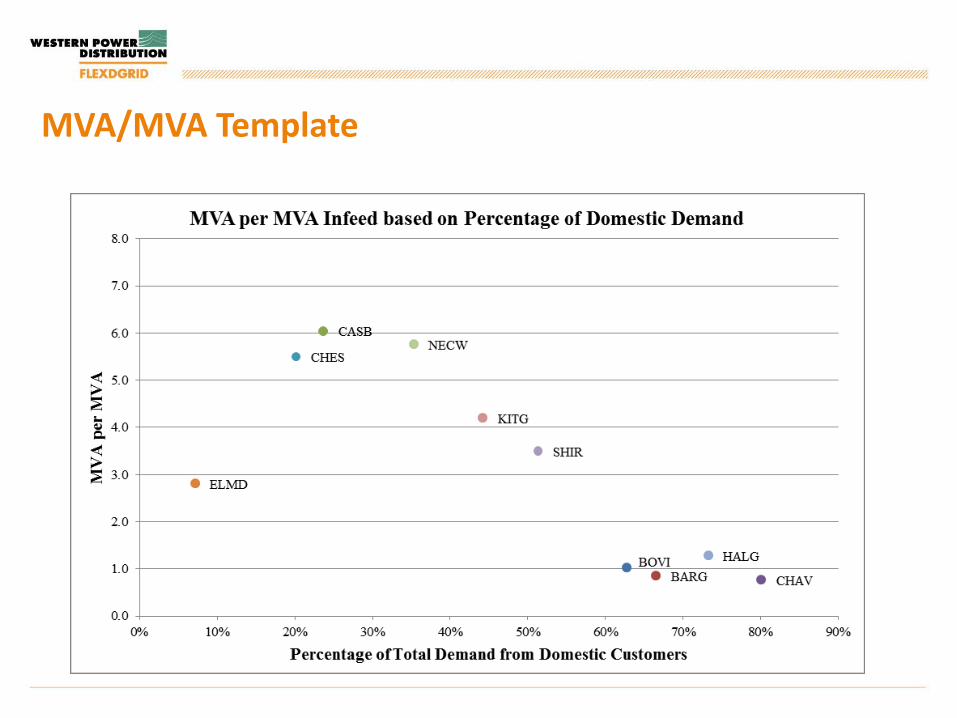
MVA/MVA Template

– Industrial substations showing values above 5.0 MVA/MVA. Decided to limit
contribution to 5.0 as per typical contribution from synchronous generation
– Domestic dominated substations remain around 1.0 MVA/MVA contribution
– Commercial and substations with 50/50 split recommended 3.0 MVA/MVA
Proposed MVA/MVA Infeed Values
Load G74 MVA per MVA Infeed
Majority Domestic 1.0
Split Domestic/Industrial 3.0
Majority Commercial 3.0
Majority Industrial 5.0

Alternative Connections
Developed as parts of the network became ‘full’
‘Full’ = Limitations from Thermal, Voltage, Protection or Fault Level
Customers must be willing to accept some level of curtailment in return
for a saving in reinforcement costs and timescales
Level of curtailment can be fixed or dynamic
WPD currently has four options of increasing technicality
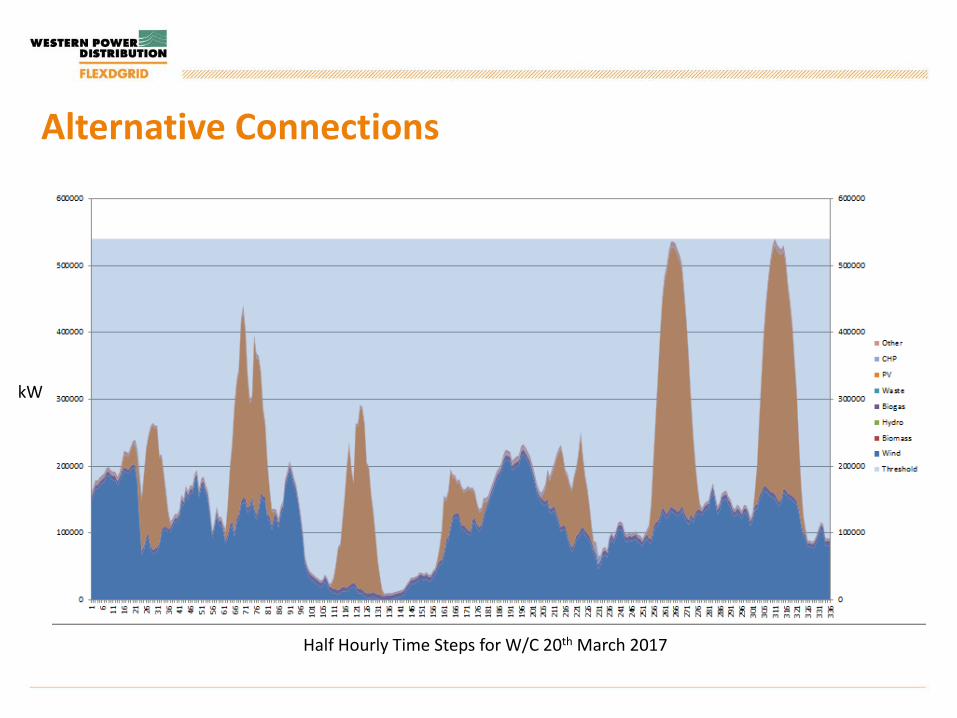
Alternative Connections
kW
Half Hourly Time Steps for W/C 20th March 2017
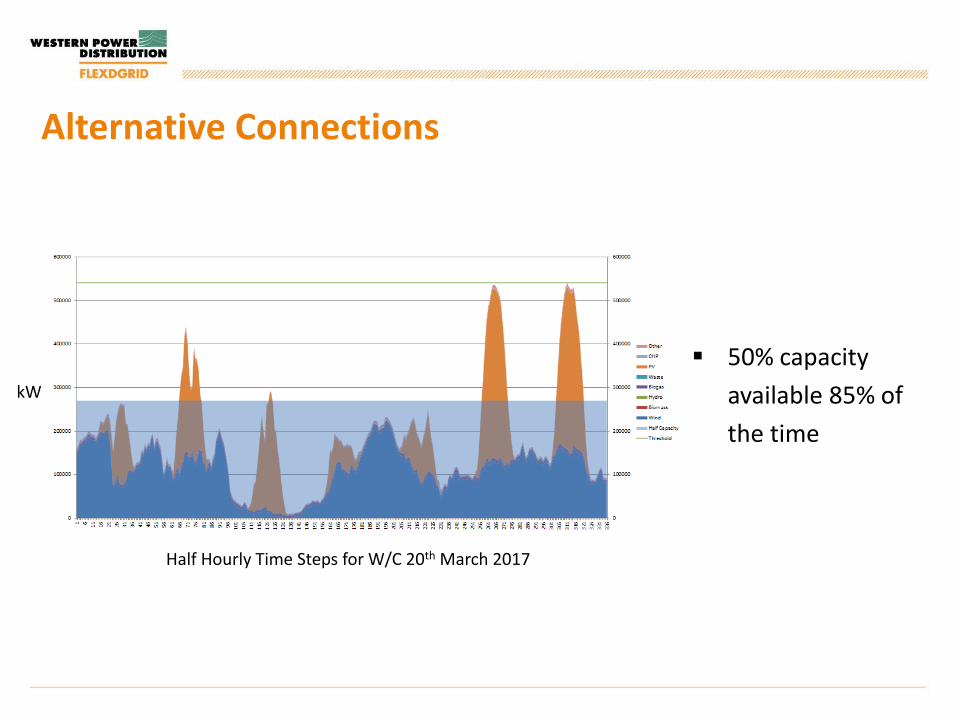
Alternative Connections
50% capacity
available 85% of
the time
kW
Half Hourly Time Steps for W/C 20th March 2017
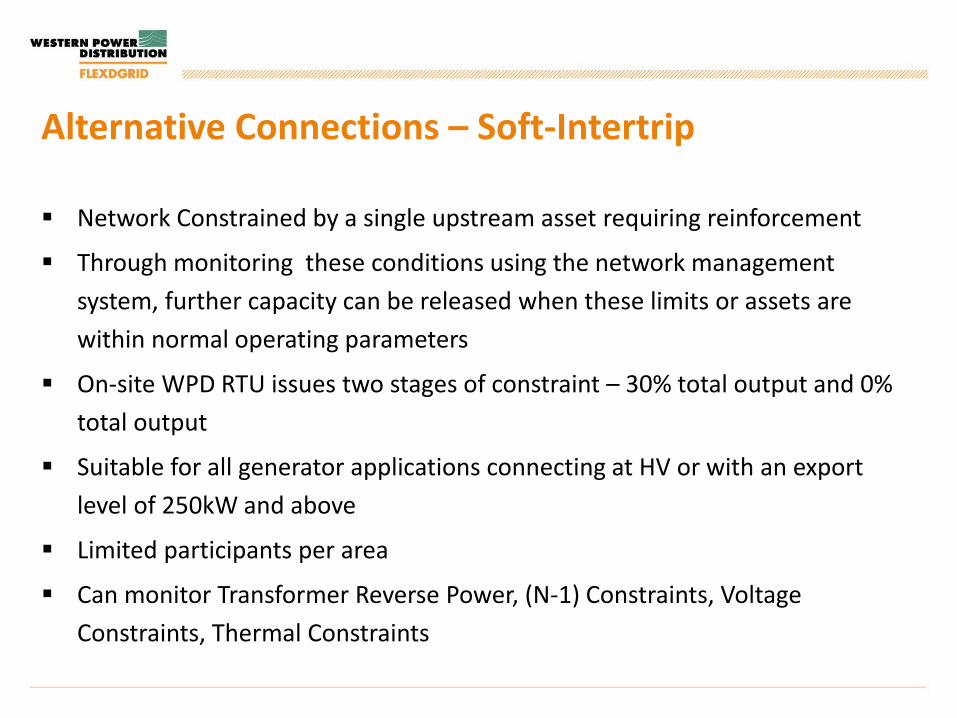
Alternative Connections – Soft-Intertrip
Network Constrained by a single upstream asset requiring reinforcement
Through monitoring these conditions using the network management
system, further capacity can be released when these limits or assets are
within normal operating parameters
On-site WPD RTU issues two stages of constraint – 30% total output and 0%
total output
Suitable for all generator applications connecting at HV or with an export
level of 250kW and above
Limited participants per area
Can monitor Transformer Reverse Power, (N-1) Constraints, Voltage
Constraints, Thermal Constraints
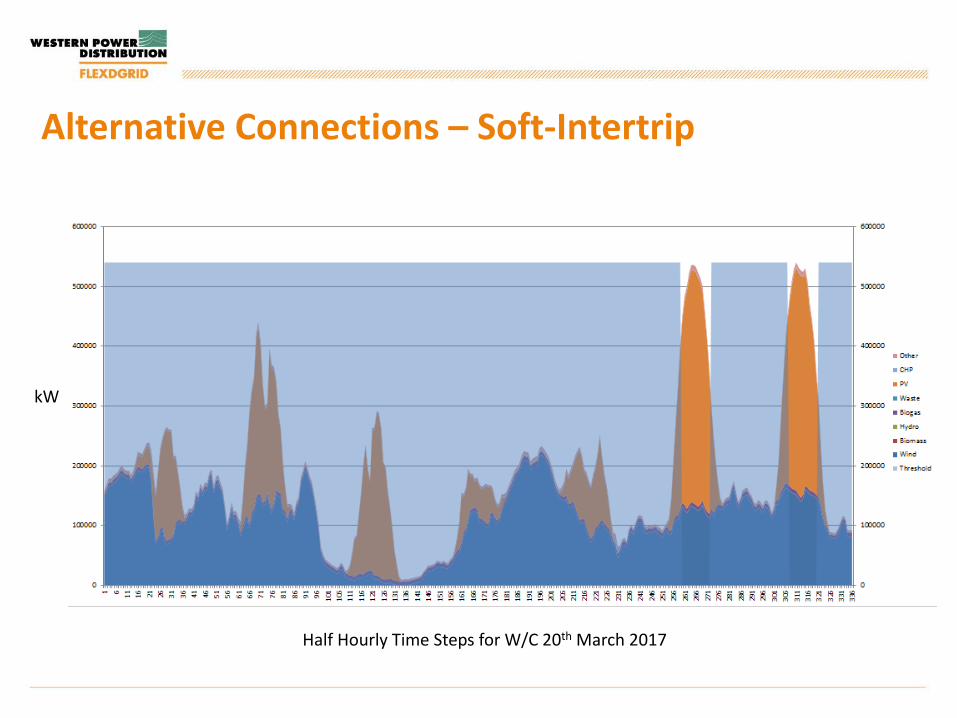
Alternative Connections – Soft-Intertrip
kW
Half Hourly Time Steps for W/C 20th March 2017
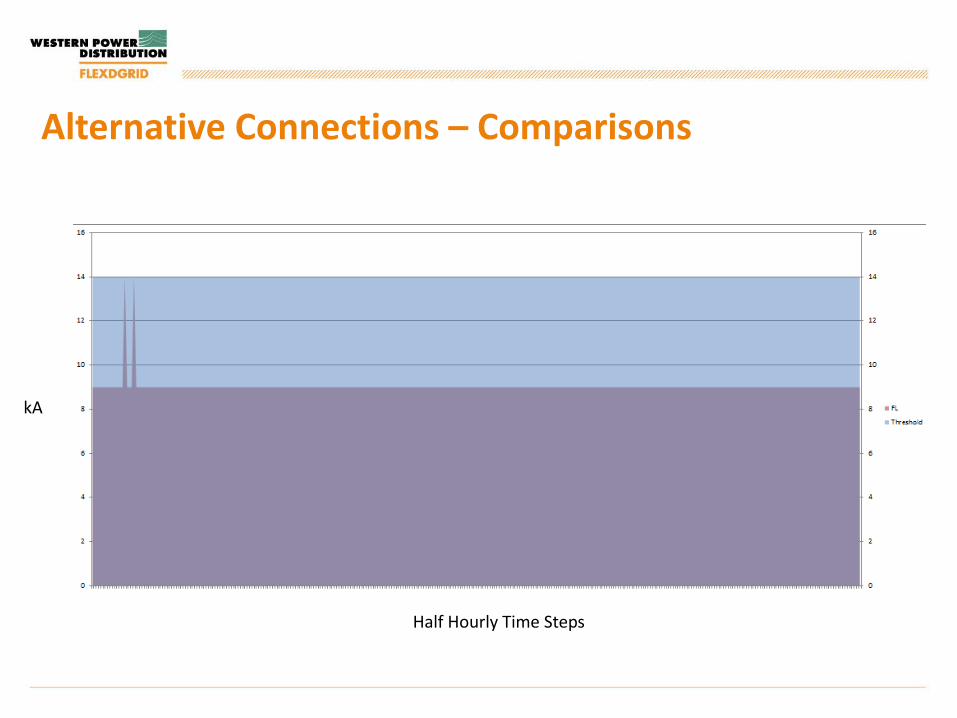
Alternative Connections – Comparisons
kA
Half Hourly Time Steps

Fault level Heat Maps
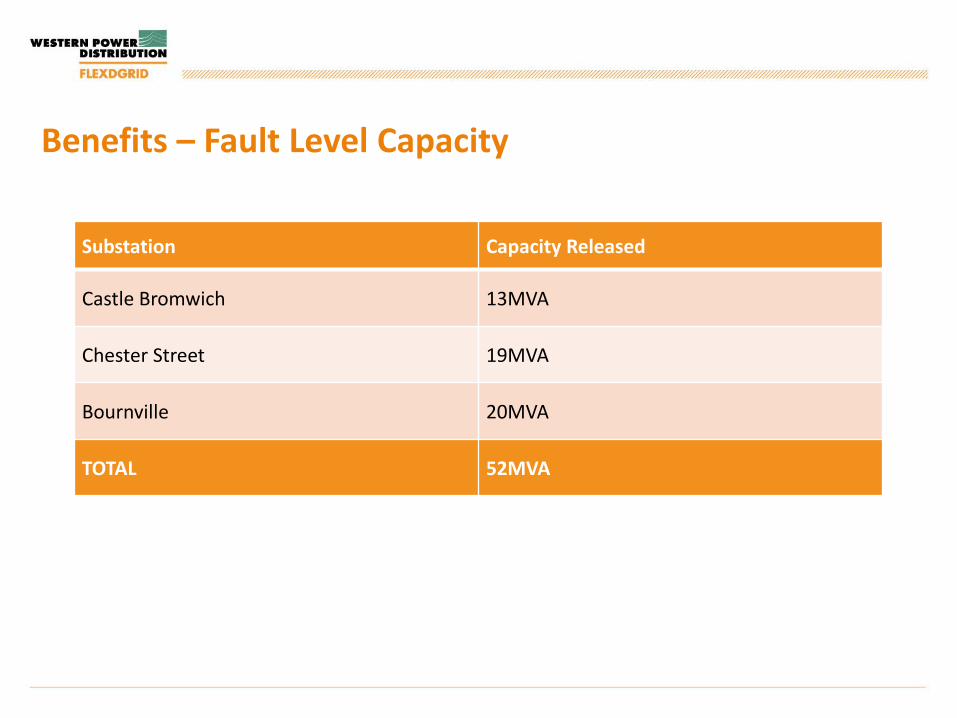
Benefits – Fault Level Capacity
Substation Capacity Released
Castle Bromwich 13MVA
Chester Street 19MVA
Bournville 20MVA
TOTAL 52MVA

Policy Documents
• Two documents for each technology:
• Operation and Control
• Inspection and Maintenance
• Contents derived from the design and installation process

Policy Documents Operation and Control:
• Safety considerations
• System description
• Network connection options
• Initialising Sequence
• Energising
• Isolation
• Earthing
• Alarms and trips
Inspection and Maintenance:
• Inspection procedure
• Maintenance guidance
• Maintenance Intervals
T H A N K S F O R L I S T E N I N G
Jonathan Berry Western Power Distribution 0121 6 239 459 / 07894 258 671 [email protected]
www.westernpowerinnovation.co.uk