weed science society of america teasdale, j. r. and c… · weed science society of america the...
TRANSCRIPT

Weed Science Society of America
The Quantitative Relationship between Weed Emergence and the Physical Properties ofMulchesAuthor(s): John R. Teasdale and Charles L. MohlerSource: Weed Science, Vol. 48, No. 3 (May - Jun., 2000), pp. 385-392Published by: Weed Science Society of America and Allen PressStable URL: http://www.jstor.org/stable/4046305 .Accessed: 04/03/2011 10:51
Your use of the JSTOR archive indicates your acceptance of JSTOR's Terms and Conditions of Use, available at .http://www.jstor.org/page/info/about/policies/terms.jsp. JSTOR's Terms and Conditions of Use provides, in part, that unlessyou have obtained prior permission, you may not download an entire issue of a journal or multiple copies of articles, and youmay use content in the JSTOR archive only for your personal, non-commercial use.
Please contact the publisher regarding any further use of this work. Publisher contact information may be obtained at .http://www.jstor.org/action/showPublisher?publisherCode=wssa. .
Each copy of any part of a JSTOR transmission must contain the same copyright notice that appears on the screen or printedpage of such transmission.
JSTOR is a not-for-profit service that helps scholars, researchers, and students discover, use, and build upon a wide range ofcontent in a trusted digital archive. We use information technology and tools to increase productivity and facilitate new formsof scholarship. For more information about JSTOR, please contact [email protected].
Weed Science Society of America and Allen Press are collaborating with JSTOR to digitize, preserve andextend access to Weed Science.
http://www.jstor.org

Weed Science, 48:385-392. 2000
The quantitative relationship between weed emergence and the physical properties of mulches
John R. Teasdale Corresponding author. USDA-ARS Weed Science Lab, Bldg. 001, Room 323, Beltsville, MD 20705; [email protected]
Charles L. Mohler Department of Ecology and Evolutionary Biology, Corson Hall, Cornell University, Ithaca, NY 14853
Mulches on the soil surface are known to suppress weed emergence, but the quan- titative relationships between emergence and mulch properties have not been dearly defined. A theoretical framework for describing the relationships among mulch mass, area index, height, cover, light extinction, and weed emergence is introduced. This theory is applied to data from experiments on emergence of four annual weed species through mulches of selected materials applied at six rates. Mulch materials, in order from lowest to highest surface-area-to-mass ratio, were bark chips, Zea mays stalks, Secale cereale, Trifolium incarnatum, Vicia villosa, Quercus leaves, and landscape fabric strips. The order of weed species' sensitivity to mulches was Amaranthus retroflexus > Chenopodium album > Setaria faberi > Abutilon theophrasti, regardless of mulch material. The success of emergence through mulches was related to the capacity of seedlings to grow around obstructing mulch elements under limiting light condi- tions. Mulch area index was a pivotal property for quantitatively defining mulch properties and understanding weed emergence through mulches. A two-parameter model of emergence as a function of mulch area index and fraction of mulch volume that was solid reasonably predicted emergence across the range of mulches investi- gated.
Nomendature: Abutilon theophrasti Medicus ABUTH, velvetleaf; Amaranthus retroflexus L. AMARE, redroot pigweed; Chenopodium album L. CHEAL, common lambsquarters; Setaria faberi Herrm. SETFA, giant foxtail; Quercus alba L., white oak; Quercus montana Willd., chestnut oak; Secale cereale L., rye; Trifolium incar- natum L., crimson clover; Vicia villosa Roth, hairy vetch; Zea mays L., corn.
Key words: Residue, litter, cover crop, light extinction, seedling, ABUTH, AMARE, CHEAL, SEFTA.
Weed management models that predict the biological and economic benefits of potential weed control interventions rely on accurate predictions of weed emergence (Lybecker et al. 1991; Swinton and King 1994). Several approaches have been taken to modeling weed emergence. Forcella (1998) has developed a model, WeedCast, that uses daily temperature and moisture data to predict the timing of cu- mulative emergence of several important weed species. Alm et al. (1993) proposed a model that separates germination and emergence processes; this approach requires seed depth as well as temperature and moisture data to predict weed emergence. Mohler (1993) developed a model that explains weed emergence based on the redistribution of seeds in the soil profile by tillage operations, the survival of seeds at dif- ferent depths, and the emergence potential of seedlings from specified depths.
Residue on the surface of soils can influence the emer- gence of most plant species. Facelli and Pickett (199la) re- viewed the influence of surface litter on plant emergence and community structure in natural systems. Crop residues remaining on the soil surface in minimum-tillage agricul- tural operations can reduce weed emergence (Buhler et al. 1996; Vidal and Bauman 1996). Cover crops can produce high levels of residue biomass that suppress weed emergence and contribute to integrated weed management systems (Mohler and Teasdale 1993; Teasdale 1998; Williams et al. 1998). Therefore, residue is an important factor that should be incorporated into weed emergence models.
Although there are many reports on weed suppression by plant residue and mulches, not many have assessed the quantitative relationship between residue and weed emer- gence (Teasdale 1998). Earlier research demonstrated the re- lationship between mass of Secale cereale or Vicia villosa res- idue, soil microclimate (Teasdale and Mohler 1993), and weed emergence (Mohler and Teasdale 1993). There is a need to define more precisely the physical properties of a wide range of mulch types and determine their relation to weed emergence. The purpose of our research was to deter- mine functional relationships between mulch physical prop- erties and weed emergence. Materials with a range of area- to-mass ratios were chosen to provide mulches with widely differing physical properties. Abutilon theophrasti, Setariafa- beri, Chenopodium album, and Amaranthus retroflexus were chosen as representative annual weed species that vary in seed size and are important in many areas of the world. This paper focuses on the relation between final emergence values and mulch physical properties; a subsequent paper will an- alyze the influence of mulches on soil temperature and emergence timing.
Materials and Methods
Experiments were conducted on a silt loam soil in 1996 and 1997 at Beltsville, MD. The field was plowed in the fall and disked and cultipacked in the spring just before establishment. One day was required to establish each rep-
Teasdale and Mohler: Mulch properties and weed emergence - 385
lication. Three replications per year were established on May 2, May 15, and June 4 of 1996 and on May 7, May 14, and June 11 of 1997. Each replication contained seven mulches (Zea mays stalks, S. cereale, Thifolium incarnatum, V villosa, Quercus leaves, bark chips, and landscape fabric strips) applied at six rates plus three to five unmulched con- trol plots. Plots were 1 by 2 m divided into two 1- by 1-m sections, one for assessment of weed emergence and one for mulch measurements. In the middle 0.25-M2 area of the weed emergence section, seeds of A. theophrasti, S. faberi, C. album, and A. retroflexus were planted in 50-cm-long rows at the rate of 150 seeds per species at a depth of 1 cm. This field had a low resident population of weeds; A. theophrasti and S. faberi were absent, and A. retroflexus and C. album emergence was less than 1 seedling m-2. Following planting, residue was added to the soil surface according to a com- pletely randomized design within each replication. Bird net- ting was secured over plots of lighter residue to prevent dis- persion by wind.
Mulch Properties T incarnatum, V villosa, and S. cereale residue were ob-
tained from local fields, transported to the experiment site, and spread to dry along the edge of the field in a layer approximately 15 to 30 cm deep within 1 wk of establishing plots. Z mays stalks that had overwintered from the previous season were obtained from a nearby field. Quercus leaves (primarily a mixture of Q a/ba and Q montana) were raked from the edge of a nearby forest. Bark mulch1 was purchased from a local nursery. Landscape fabric2 was cut into strips and mixed at a 2: 1 ratio (wt: wt) with 15-cm green plastic twist-ties.
The six rates of application were determined by weighing the amount of mulch material that provided 40% coverage of the soil and preparing lots with masses equal to 1, 2, 4, 8, 16, and 24 times that amount. This procedure gave a wide range of mulch rates with the 4x rate being approxi- mately equivalent to the natural residue levels produced by S. cereale, V. villosa, and T incarnatum in Maryland. Lots for all replications of Quercus leaves, bark, and fabric were prepared before initial experimental setup. Lots of Z mays, T incarnatum, V villosa, and S. cereale mulches were pre- pared on the same day that each replication was established. Three samples of all materials were collected at the time of lot preparation, weighed immediately to determine a fresh mass, and weighed after drying to determine a dry mass. All plot residue rates were converted to dry mass by multiplying the fresh mass of material added to plots by the dry-to-fresh- mass ratio determined from the samples.
The surface area (one side) of a sample of residue ele- ments was determined photometrically3 and then weighed to estimate the area-to-mass ratio (Am [M2 g-I]) for each mulch. The area-to-mass ratio was multiplied by the dry mass of mulch on each plot (M [g m-2]) to determine the mulch area index (MAI [M2 of mulch area per m2 of ground area]) for each plot:
MAI =Am *M. [1]
The structure of a mulch can be conceptualized as layers of randomly distributed elements. The height (H) of a mulch can then be computed as H = (number of layers)m (height of each layer). The number of layers can be ex-
pressed as Number of layers = MAI / (area index of one layer).
If all the elements in each layer were uniformly aligned, then the area index of each layer would approach 1 and the number of layers would approach the MAI. However, with randomly distributed elements, the area index of each layer will be less than 1 and the number of layers will exceed the MAI. The height of each layer can be described as: Height of each layer = he * (element irregularity factor) where he (mm) is the mean thickness of mulch elements. The element irregularity factor refers to any feature that could cause a greater separation between layers than the thickness of each element such as twisting or curling of Quercus leaves or brace roots on Z mays stalks. The irregularity factor ranges in value from 1 for elements with no irregularity to values increasingly greater than 1 for elements with increasingly greater irregularity. The height (H [mm]) of a mulch with element thickness (he) can then be expressed as H = MAI * he * (irregularity factor) / (area index per layer).
If Ah is defined as (area index per layer) / ([irregularity factor] he), then mulch area index can be related to height by an expression analogous to that relating mulch area index to mass:
MAI = Ah * H. [2]
When he is multiplied by Ah, the solid volume fraction (Vs) can be defined as:
Vs = Ah * he = MAI * (he / H) = (area index per layer) I (irregularity factor). [3]
The solid volume fraction is a measure of the fraction of mulch volume occupied by the mulch elements.
Mulch height was measured at four predetermined loca- tions in each plot. Based on Equation 2, the coefficient Ah was determined for each mulch material from the linear regression of MAI on H. The mean thickness of mulch elements (he) was determined from measurements on three samples of 10 randomly selected mulch elements. Based on Equation 3, Vs was calculated by multiplying the measured value of he by the coefficient Ah.
The extinction of light through a leaf canopy can be described by T = exp(-k . LAI) where T is the fraction of light transmitted, LAI is the leaf area index, and k is the light extinction coefficient (Hatfield 1998). An analogous expression can be described for the fraction of light trans- mitted through a mulch as a function of the mulch area index:
T = exp(-k . MAI). [4]
Light transmittance through the mulch of each plot was measured by inserting a line quantum sensor4 into a slot made in the soil surface under the mulch. A stake with dimensions similar to those of the sensor was installed in the soil surface just before plot setup and removed just be- fore light measurements to leave a slot for the sensor. Si- multaneous measurements were made with the line sensor and with a second unobstructed quantum sensor within an hour of solar noon approximately 2 wk after plot establish- ment. The fraction of light transmitted was computed from the ratio of these measurements adjusted for the measured difference in sensor readings when both sensors were un- obstructed. A light extinction coefficient (k) was computed for each mulch by regression of the transmittance values
386 * Weed Science 48, May-June 2000
from each plot against the corresponding MAI values ac- cording to Equation 4.
Weed Emergence Weeds emerging within 2.5 cm of the planted row were
counted approximately weekly for 10 to 12 wk and removed with a forceps without disturbing the mulch elements. Seed- lings were counted only if cotyledons of the broadleaved species or the first leaf of S. faberi were displayed and if the seedling had emerged above the locally surrounding mulch elements. Emergence occurred primarily in a 1- to 3-wk period during the first month after setup of each replication. Only weeds emerging during this initial flush were used for analysis since this allowed weed emergence and mulch prop- erties to be associated at a single point in time as described below.
To account for changes in mulch properties during the experiment, mulch mass from a 0.5-iM2 area and mulch height were measured at 5 to 6 wk and again at 10 to 12 wk after setup of each replication. Residue was washed free of soil and dried before measuring mass. The change in mulch mass and height over the short time period of this experiment was satisfactorily described by a linear function. Furthermore, this rate of change was proportional to the initial mulch mass or height value (i.e., the relation between rate of change and the initial value was linear). Therefore, mulch mass was determined at time t by the equation M, = Mj (1 - d * t) where Mi is the initial mass and d is a rate coefficient determined for each mulch (Wagner-Riddle et al. 1996). An analogous equation was used to determine mulch height at time t. From these data, the mulch mass and height at the time of 50% weed emergence in the un- mulched plots was determined. The mulch area index at 50% emergence was determined by multiplying the area-to- mass ratio by the mass at time t.
The number of weeds that emerged in each mulched plot was divided by the mean number that emerged in the un- mulched plots in the same replication to give the fraction of weeds that emerged (E). Two exponential models were used to explore the functional relationship between the frac- tion emergence and mulch mass at the time of 50% emer- gence of the unmulched control for each replication and year. One model was a simple exponential decay function:
E = exp(-bM * M) [5]
with a single parameter, bm. The other function,
E = (1 + aM M) - exp(-bM M), [6]
was a more general function with two parameters, aM and bM, that describes an initial increase in emergence at low mulch rates followed by an exponential decline. The need for Equation 6 was tested by determining whether aM was significantly different than zero. Since aM was not found to be different than zero for almost every species and mulch, Equation 5 was used in all subsequent analyses.
By combining Equations 1 and 5, an equation for emer- gence as a function of mulch area index was derived:
E = exp(-bM .MAI/ Am) = exp(-bA. *4MAI) [7]
where bA =bM / Am. Likewise, an equation for emergence as a function of mulch height was derived from Equations 2 and 7:
E = exp(-bA Ah * H) = exp(-bH. H) [8]
where bH = bA * Ah = bM * Ah / Am. The coefficients bM, bA, and bH were determined for each
replication and year. An analysis of variance was conducted on these coefficients to test for mulch, weed species, year, and replication effects. Data were pooled based on the out- come of these analyses.
Preliminary analysis of the relation between the emer- gence coefficient (bA) and the solid volume fraction (Vs) across all mulches demonstrated a significant fit to the mod- el bA = bv * Vscv suggesting that including Vs in the emer- gence model might produce a more general model. By sub- stituting this relation between bA and Vs into Equation 7, the following two-parameter model was derived:
E = exp(-bv MAI * V,cv). [9] Likewise, the emergence coefficient (bA) was significantly related to the light extinction coefficient (k) according to the model bA= bk* kck) leading to a similar two-parameter model:
E = exp(-bk MAI * kck) [10]
These models were tested by fitting them to the full data set with all mulches. Variance accounted for by the two- parameter model was compared with one-parameter models Equations 5, 7, and 8 and to a seven-parameter model that was Equations 5, 7, and 8 but with a separate coefficient for each of the seven mulches.
Results and Discussion
Analysis of variance showed no significant effects or in- teractions involving year or replication (with one exception discussed below), but there were significant interactions be- tween mulch and species. Weather was similar in the two years. Rainfall was sufficient to provide good emergence conditions in both years, averaging 29 and 19 mm wk-1 in 1996 and 1997, respectively, during the first 5 wk after setup. Soil temperature differed little between seasons. As a result, analyses were performed for each mulch by species data set pooled over years and replications. Mulch properties were similarly pooled except for mulch degradation that dif- fered between years.
Mulch Properties
The physical dimensions and structure of the mulches studied in these experiments varied considerably (Table 1). The area-to-mass ratio (Am) was low for bark chips and Z. mays stalks and high for Quercus leaves and fabric mulch. Our value of Am for Z mays was lower than that reported by Gregory (1982); however, our measurements were made primarily on stalk residue in the spring, whereas Gregory reported on residue including leaves and husks collected in fall. Our values for legume residue were similar to the range of values reported by Gregory (1982) for Glycine max (L.) Merr. (soybean). Our value for S. cereale is similar to values reported by Gregory (1982) for Triticum aestivum L. (wheat) and Wagner-Riddle et al. (1996) for S. cereale early in the season.
Mulch area index was linearly related to height over most of the range of values for all mulches (data not shown).
Teasdale and Mohler: Mulch properties and weed emergence - 387
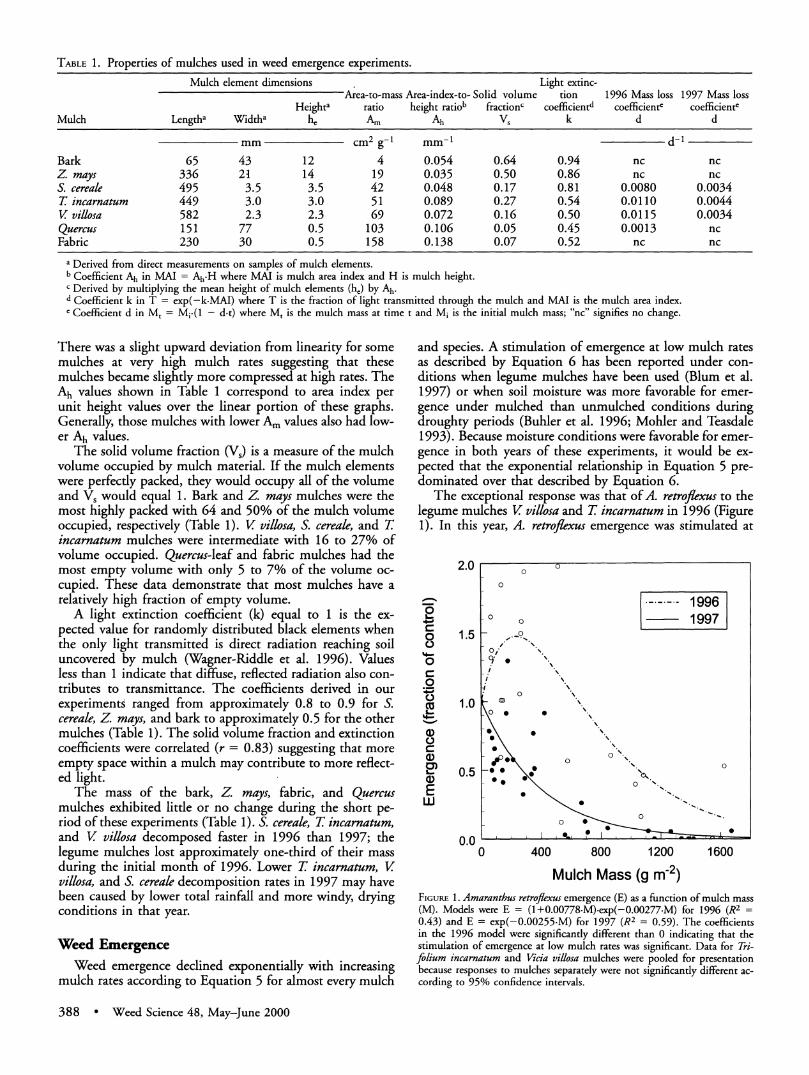
TABLE 1. Properties of mulches used in weed emergence experiments.
Mulch element dimensions Light extinc- Area-to-mass Area-index-to- Solid volume tion 1996 Mass loss 1997 Mass loss
Heighta ratio height ratiob fractionc coefficientd coefficiente coefficiente Mulch Lengtha Widtha he Am Ah Vs k d d
mm cm2 g-I mm-1 d-1 Bark 65 43 12 4 0.054 0.64 0.94 nc nc Z. mays 336 21 14 19 0.035 0.50 0.86 nc nc S. cereale 495 3.5 3.5 42 0.048 0.17 0.81 0.0080 0.0034 T incarnatum 449 3.0 3.0 51 0.089 0.27 0.54 0.0110 0.0044 V villosa 582 2.3 2.3 69 0.072 0.16 0.50 0.0115 0.0034 Quercus 151 77 0.5 103 0.106 0.05 0.45 0.0013 nc Fabric 230 30 0.5 158 0.138 0.07 0.52 nc nc
a Derived from direct measurements on samples of mulch elements. b Coefficient Ah in MAI = Ah-H where MAI is mulch area index and H is mulch height. c Derived by multiplying the mean height of mulch elements (he) by Ah. d Coefficient k in T - exp(-k-MAI) where T is the fraction of light transmitted through the mulch and MAI is the mulch area index. ' Coefficient d in Mt = Mi-(1 - d-t) where Mt is the mulch mass at time t and Mi is the initial mulch mass; "nc" signifies no change.
There was a slight upward deviation from linearity for some mulches at very high mulch rates suggesting that these mulches became slightly more compressed at high rates. The Ah values shown in Table 1 correspond to area index per unit height values over the linear portion of these graphs. Generally, those mulches with lower Am values also had low- er Ah values.
The solid volume fraction (Vs) is a measure of the mulch volume occupied by mulch material. If the mulch elements were perfectly packed, they would occupy all of the volume and Vs would equal 1. Bark and Z mays mulches were the most highly packed with 64 and 50% of the mulch volume occupied, respectively (Table 1). V villosa, S. cereale, and T incarnatum mulches were intermediate with 16 to 27% of volume occupied. Quercus-leaf and fabric mulches had the most empty volume with only 5 to 7% of the volume oc- cupied. These data demonstrate that most mulches have a relatively high fraction of empty volume.
A light extinction coefficient (k) equal to 1 is the ex- pected value for randomly distributed black elements when the only light transmitted is direct radiation reaching soil uncovered by mulch (Wagner-Riddle et al. 1996). Values less than 1 indicate that diffuse, reflected radiation also con- tributes to transmittance. The coefficients derived in our experiments ranged from approximately 0.8 to 0.9 for S. cereale, Z mays, and bark to approximately 0.5 for the other mulches (Table 1). The solid volume fraction and extinction coefficients were correlated (r = 0.83) suggesting that more empty space within a mulch may contribute to more reflect- ed light.
The mass of the bark, Z mays, fabric, and Quercus mulches exhibited little or no change during the short pe- riod of these experiments (Table 1). S. cereale, T incarnatum, and V villosa decomposed faster in 1996 than 1997; the legume mulches lost approximately one-third of their mass during the initial month of 1996. Lower T incarnatum, V villosa, and S. cereale decomposition rates in 1997 may have been caused by lower total rainfall and more windy, drying conditions in that year.
Weed Emergence Weed emergence declined exponentially with increasing
mulch rates according to Equation 5 for almost every mulch
and species. A stimulation of emergence at low mulch rates as described by Equation 6 has been reported under con- ditions when legume mulches have been used (Blum et al. 1997) or when soil moisture was more favorable for emer- gence under mulched than unmulched conditions during droughty periods (Buhler et al. 1996; Mohler and Teasdale 1993). Because moisture conditions were favorable for emer- gence in both years of these experiments, it would be ex- pected that the exponential relationship in Equation 5 pre- dominated over that described by Equation 6.
The exceptional response was that of A. retroflexus to the legume mulches V villosa and T. incarnatum in 1996 (Figure 1). In this year, A. retroflexus emergence was stimulated at
2.0 0 0
----- 1996 2. 0 1997
0~~~~~ o 1.5 o ,'K
C.)
* 0
1.0
E. 0. *\ '*
4-.
C.
0) ~~~.. 00 0.50 * .0 U)
.~0 0..
80
0.0 0 400 800 1200 1600
Mulch Mass (g m-2) FIGURE 1. Amaranthus retroflexus emergence (E) as a function of mulch mass (M). Models were E = (1 +0.00778-M).exp(-0.00277-M) for 1996 (R2 =
0.43) and E = exp(-0.00255-M) for 1997 (R2 = 0.59). The coefficients in the 1996 model were significantly different than 0 indicating that the stimulation of emergence at low mulch rates was significant. Data for Tri- folium incarnatum and Vicia villosa mulches were pooled for presentation because responses to mulches separately were not significantly different ac- cording to 95% confidence intervals.
388 * Weed Science 48, May-June 2000
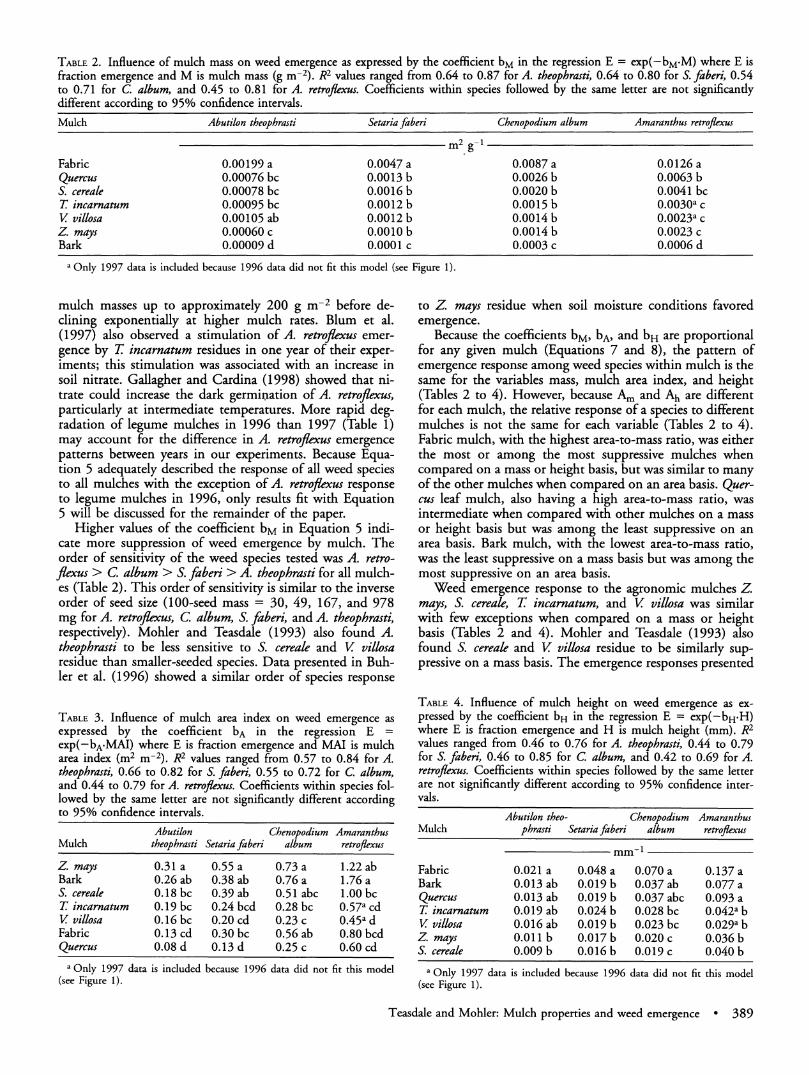
TABLE 2. Influence of mulch mass on weed emergence as expressed by the coefficient bM in the regression E = exp(-bM.M) where E is fraction emergence and M is mulch mass (g m-2). R2 values ranged from 0.64 to 0.87 for A. theophrasti, 0.64 to 0.80 for S. faberi, 0.54 to 0.71 for C. album, and 0.45 to 0.81 for A. retrojfexus. Coefficients within species followed by the same letter are not significantly different according to 95% confidence intervals.
Mulch Abutilon theophrasti Setaria faberi Chenopodium album Amaranthus retroflexus
m2 g1
Fabric 0.00199 a 0.0047 a 0.0087 a 0.0126 a Quercus 0.00076 bc 0.0013 b 0.0026 b 0.0063 b S. cereale 0.00078 bc 0.0016 b 0.0020 b 0.0041 bc T incarnatum 0.00095 bc 0.0012 b 0.0015 b 0.0030a c V villosa 0.00105 ab 0.0012 b 0.0014 b 0.0023a c Z. mays 0.00060c 0.OOlOb 0.0014b 0.0023c Bark 0.00009 d 0.0001 c 0.0003 c 0.0006 d
a Only 1997 data is included because 1996 data did not fit this model (see Figure 1).
mulch masses up to approximately 200 g m-2 before de- clining exponentially at higher mulch rates. Blum et al. (1997) also observed a stimulation of A. retroflexus emer- gence by T incarnatum residues in one year of their exper- iments; this stimulation was associated with an increase in soil nitrate. Gallagher and Cardina (1998) showed that ni- trate could increase the dark germination of A. retroflexus, particularly at intermediate temperatures. More rapid deg- radation of legume mulches in 1996 than 1997 (Table 1) may account for the difference in A. retroflexus emergence patterns between years in our experiments. Because Equa- tion 5 adequately described the response of all weed species to all mulches with the exception of A. retroflexus response to legume mulches in 1996, only results fit with Equation 5 will be discussed for the remainder of the paper.
Higher values of the coefficient bM in Equation 5 indi- cate more suppression of weed emergence by mulch. The order of sensitivity of the weed species tested was A. retro- flexus > C. album > S. faberi > A. theophrasti for all mulch- es (Table 2). This order of sensitivity is similar to the inverse order of seed size (100-seed mass = 30, 49, 167, and 978 mg for A. retroflexus, C. album, S. faberi, and A. theophrasti, respectively). Mohler and Teasdale (1993) also found A. theophrasti to be less sensitive to S. cereale and V villosa residue than smaller-seeded species. Data presented in Buh- ler et al. (1996) showed a similar order of species response
TABLE 3. Influence of mulch area index on weed emergence as expressed by the coefficient bA in the regression E = exp(-bA.MAI) where E is fraction emergence and MAI is mulch area index (M2 m-2). R2 values ranged from 0.57 to 0.84 for A. theophrasti, 0.66 to 0.82 for S. faberi, 0.55 to 0.72 for C. album, and 0.44 to 0.79 for A. retroflexus. Coefficients within species fol- lowed by the same letter are not significantly different according to 95% confidence intervals.
Abutilon Chenopodium Amaranthus Mulch theophrasti Setaria faberi album retroflexus
Z. mays 0.31 a 0.55 a 0.73a 1.22ab Bark 0.26 ab 0.38 ab 0.76 a 1.76 a S. cereale 0.18 bc 0.39 ab 0.51 abc 1.00 bc T incarnatum 0.19 bc 0.24 bcd 0.28 bc 0.57a cd V villosa 0.16 bc 0.20 cd 0.23 c 0.45a d Fabric 0.13 cd 0.30 bc 0.56 ab 0.80 bcd Quercus 0.08 d 0.13 d 0.25 c 0.60 cd
a Only 1997 data is included because 1996 data did not fit this model (see Figure 1).
to Z mays residue when soil moisture conditions favored emergence.
Because the coefficients bM, bA, and bH are proportional for any given mulch (Equations 7 and 8), the pattern of emergence response among weed species within mulch is the same for the variables mass, mulch area index, and height (Tables 2 to 4). However, because Am and Ah are different for each mulch, the relative response of a species to different mulches is not the same for each variable (Tables 2 to 4). Fabric mulch, with the highest area-to-mass ratio, was either the most or among the most suppressive mulches when compared on a mass or height basis, but was similar to many of the other mulches when compared on an area basis. Quer- cus leaf mulch, also having a high area-to-mass ratio, was intermediate when compared with other mulches on a mass or height basis but was among the least suppressive on an area basis. Bark mulch, with the lowest area-to-mass ratio, was the least suppressive on a mass basis but was among the most suppressive on an area basis.
Weed emergence response to the agronomic mulches Z mays, S. cereale, T incarnatum, and V villosa was similar with few exceptions when compared on a mass or height basis (Tables 2 and 4). Mohler and Teasdale (1993) also found S. cereale and V villosa residue to be similarly sup- pressive on a mass basis. The emergence responses presented
TABLE 4. Influence of mulch height on weed emergence as ex- pressed by the coefficient bH in the regression E = exp(-bH.H) where E is fraction emergence and H is mulch height (mm). R2 values ranged from 0.46 to 0.76 for A. theophrasti, 0.44 to 0.79 for S. faberi, 0.46 to 0.85 for C. album, and 0.42 to 0.69 for A. retroflexus. Coefficients within species followed by the same letter are not significantly different according to 95% confidence inter- vals.
Abutilon theo- Chenopodium Amaranthus Mulch phrasti Setaria faberi album retroflexus
mm1
Fabric 0.021 a 0.048 a 0.070 a 0.137 a Bark 0.013 ab 0.019 b 0.037 ab 0.077 a Quercus 0.013 ab 0.019 b 0.037 abc 0.093 a T incarnatum 0.019 ab 0.024 b 0.028 bc 0.042a b V villosa 0.016 ab 0.019 b 0.023 bc 0.029a b Z. mays 0.011 b 0.017b 0.020c 0.036b S. cereale 0.009 b 0.016 b 0.019 c 0.040b
a Only 1997 data is included because 1996 data did not fit this model (see Figure 1).
Teasdale and Mohler: Mulch properties and weed emergence * 389
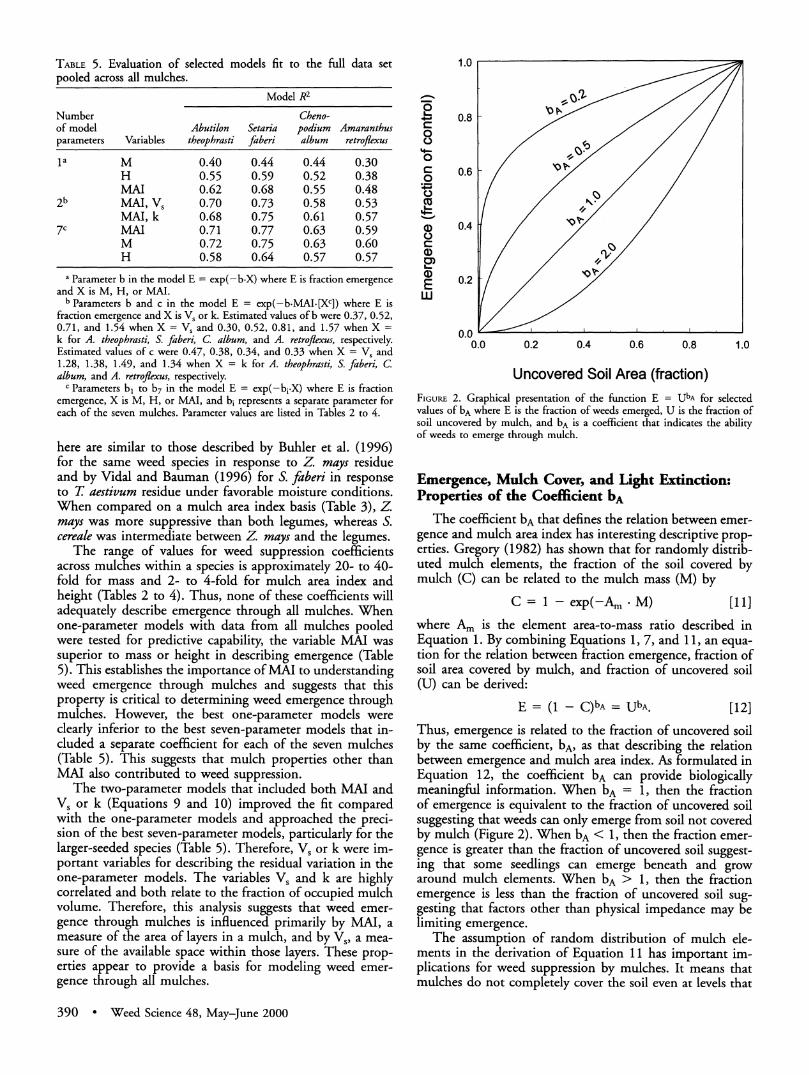
TABLE 5. Evaluation of selected models fit to the full data set pooled across all mulches.
Model R2
Number Cheno- of model Abutilon Setaria podium Amaranthus parameters Variables theophrasti faberi album retroflexus
la M 0.40 0.44 0.44 0.30 H 0.55 0.59 0.52 0.38 MAI 0.62 0.68 0.55 0.48
2b MAI, Vs 0.70 0.73 0.58 0.53 MAI, k 0.68 0.75 0.61 0.57
7c MAI 0.71 0.77 0.63 0.59 M 0.72 0.75 0.63 0.60 H 0.58 0.64 0.57 0.57
a Parameter b in the model E = exp(-b.X) where E is fraction emergence and X is M, H, or MAI.
b Parameters b and c in the model E = exp(-b-MAI-[Xc]) where E is fraction emergence and X is V, or k. Estimated values of b were 0.37, 0.52, 0.71, and 1.54 when X = Vs and 0.30, 0.52, 0.81, and 1.57 when X = k for A. theophrasti, S. faberi, C album, and A. retroflexus, respectively. Estimated values of c were 0.47, 0.38, 0.34, and 0.33 when X = Vs and 1.28, 1.38, 1.49, and 1.34 when X = k for A. theophrasti, S. faberi, C. album, and A. retroflexus, respectively.
c Parameters b, to b7 in the model E = exp(-bi.X) where E is fraction emergence, X is M, H, or MAI, and bi represents a separate parameter for each of the seven mulches. Parameter values are listed in Tables 2 to 4.
here are similar to those described by Buhler et al. (1996) for the same weed species in response to Z mays residue and by Vidal and Bauman (1996) for S. faberi in response to T aestivum residue under favorable moisture conditions. When compared on a mulch area index basis (Table 3), Z mays was more suppressive than both legumes, whereas S. cereale was intermediate between Z mays and the legumes.
The range of values for weed suppression coefficients across mulches within a species is approximately 20- to 40- fold for mass and 2- to 4-fold for mulch area index and height (Tables 2 to 4). Thus, none of these coefficients will adequately describe emergence through all mulches. When one-parameter models with data from all mulches pooled were tested for predictive capability, the variable MAI was superior to mass or height in describing emergence (Table 5). This establishes the importance of MAI to understanding weed emergence through mulches and suggests that this property is critical to determining weed emergence through mulches. However, the best one-parameter models were clearly inferior to the best seven-parameter models that in- cluded a separate coefficient for each of the seven mulches (Table 5). This suggests that mulch properties other than MAI also contributed to weed suppression.
The two-parameter models that included both MAI and Vs or k (Equations 9 and 10) improved the fit compared with the one-parameter models and approached the preci- sion of the best seven-parameter models, particularly for the larger-seeded species (Table 5). Therefore, Vs or k were im- portant variables for describing the residual variation in the one-parameter models. The variables V, and k are highly correlated and both relate to the fraction of occupied mulch volume. Therefore, this analysis suggests that weed emer- gence through mulches is influenced primarily by MAI, a measure of the area of layers in a mulch, and by V5, a mea- sure of the available space within those layers. These prop- erties appear to provide a basis for modeling weed emer- gence through all mulches.
1.0
2~ 0.8 0
0 C.) l
'4- 0 C 0.6 0
044
(D 0.4
E 0. w
0.0 0.0 0.2 0.4 0.6 0.8 1.0
Uncovered Soil Area (fraction) FIGUFRE 2. Graphical presentation of the function E = UbA for selected values of bA where E is the fraction of weeds emerged, U is the fraction of soil uncovered by mulch, and bA is a coefficient that indicates the ability of weeds to emerge through mulch.
Emergence, Mulch Cover, and Light Extinction: Properties of the Coefficient bA
The coefficient bA that defines the relation between emer- gence and mulch area index has interesting descriptive prop- erties. Gregory (1982) has shown that for randomly distrib- uted mulch elements, the fraction of the soil covered by mulch (C) can be related to the mulch mass (M) by
C = 1 - exp(-Am M) [11]
where Am is the element area-to-mass ratio described in Equation 1. By combining Equations 1, 7, and 11, an equa- tion for the relation between fraction emergence, fraction of soil area covered by mulch, and fraction of uncovered soil (U) can be derived:
E = (1 - C)bA= UbA. [12]
Thus, emergence is related to the fraction of uncovered soil by the same coefficient, bA, as that describing the relation between emergence and mulch area index. As formulated in Equation 12, the coefficient bA can provide biologically meaningful information. When bA = 1, then the fraction of emergence is equivalent to the fraction of uncovered soil suggesting that weeds can only emerge from soil not covered by mulch (Figure 2). When bA < 1, then the fraction emer- gence is greater than the fraction of uncovered soil suggest- ing that some seedlings can emerge beneath and grow around mulch elements. When bA > 1, then the fraction emergence is less than the fraction of uncovered soil sug- gesting that factors other than physical impedance may be lmiting emergence.
The assumption of random distribution of mulch ele- ments in the derivation of Equation 11 has important im- plications for weed suppression by mulches. It means that mulches do not completely cover the soil even at levels that
390 * Weed Science 48, May-June 2000
1.0
2~ 0.8 C 0
4-
c 0.6 0
0
oD 0.4
0.
0.0 0.2 0.4 0.6 0.8 1.0
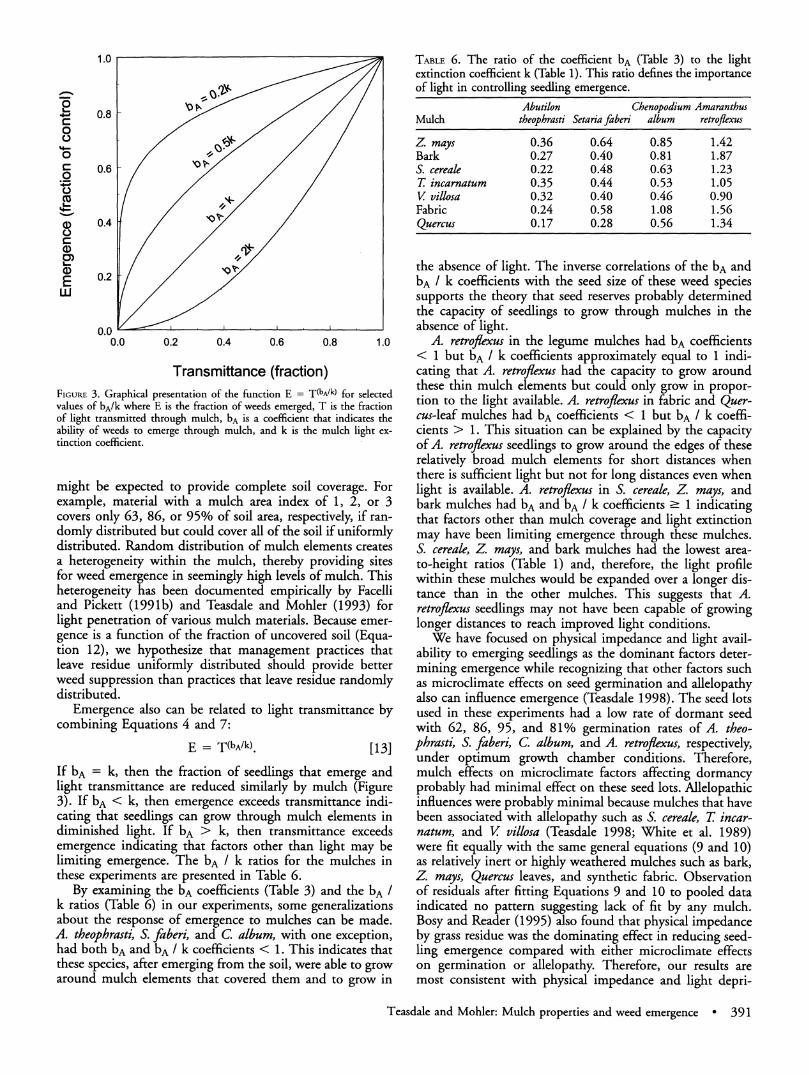
Transmittance (fraction) FIGURE 3. Graphical presentation of the function E = T(bA/k) for selected values of bA/k where E is the fraction of weeds emerged, T is the fraction of light transmitted through mulch, bA is a coefficient that indicates the ability of weeds -to emerge through mulch, and k is the mulch light ex- tinction coefficient.
might be expected to provide complete soil coverage. For example, material with a mulch area index of 1, 2, or 3 covers only 63, 86, or 95% of soil area, respectively, if ran- domly distributed but could cover all of the soil if uniformly distributed. Random distribution of mulch elements creates a heterogeneity within the mulch, thereby providing sites for weed emergence in seemingly high levels of mulch. This heterogeneity has been documented empirically by Facelli and Pickett (1991b) and Teasdale and Mohler (1993) for light penetration of various mulch materials. Because emer- gence is a function of the fraction of uncovered soil (Equa- tion 12), we hypothesize that management practices that leave residue uniformly distributed should provide better weed suppression than practices that leave residue randomly distributed.
Emergence also can be related to light transmittance by combining Equations 4 and 7:
E = T(bA/k). [13]
If bA = k, then the fraction of seedlings that emerge and light transmittance are reduced similarly by mulch (Figure 3). If bA < k, then emergence exceeds transmittance indi- cating that seedlings can grow through mulch elements in diminished light. If bA > k, then transmittance exceeds emergence indicating that factors other than light may be limiting emergence. The bA / k ratios for the mulches in these experiments are presented in Table 6.
By examining the bA coefficients (Table 3) and the bA / k ratios (Table 6) in our experiments, some generalizations about the response of emergence to mulches can be made. A. theophrasti, S. faberi, and C. album, with one exception, had both bA and bA / k coefficients < 1. This indicates that these species, after emerging from the soil, were able to grow around mulch elements that covered them and to grow in
TABLE 6. The ratio of the coefficient bA (Table 3) to the light extinction coefficient k (Table 1). This ratio defines the importance of light in controlling seedling emergence.
Abutilon Chenopodium Amaranthus Mulch theophrasti Setaria faberi album retroflexus
Z. mays 0.36 0.64 0.85 1.42 Bark 0.27 0.40 0.81 1.87 S. cereale 0.22 0.48 0.63 1.23 T incarnatum 0.35 0.44 0.53 1.05 V villosa 0.32 0.40 0.46 0.90 Fabric 0.24 0.58 1.08 1.56 Quercus 0.17 0.28 0.56 1.34
the absence of light. The inverse correlations of the bA and bA / k coefficients with the seed size of these weed species supports the theory that seed reserves probably determined the capacity of seedlings to grow through mulches in the absence of light.
A. retroflexus in the legume mulches had bA coefficients < 1 but bA / k coefficients approximately equal to 1 indi- cating that A. retroflexus had the capacity to grow around these thin mulch elements but could only grow in propor- tion to the light available. A. retroflexus in fabric and Quer- cus-leaf mulches had bA coefficients < 1 but bA / k coeffi- cients > 1. This situation can be explained by the capacity of A. retroflexus seedlings to grow around the edges of these relatively broad mulch elements for short distances when there is sufficient light but not for long distances even when light is available. A. retroflexus in S. cereale, Z mays, and bark mulches had bA and bA / k coefficients - 1 indicating that factors other than mulch coverage and light extinction may have been limiting emergence through these mulches. S. cereale, Z. mays, and bark mulches had the lowest area- to-height ratios (Table 1) and, therefore, the light profile within these mulches would be expanded over a longer dis- tance than in the other mulches. This suggests that A. retroflexus seedlings may not have been capable of growing longer distances to reach improved light conditions.
We have focused on physical impedance and light avail- ability to emerging seedlings as the dominant factors deter- mining emergence while recognizing that other factors such as microclimate effects on seed germination and allelopathy also can influence emergence (Teasdale 1998). The seed lots used in these experiments had a low rate of dormant seed with 62, 86, 95, and 81% germination rates of A. theo- phrasti, S. faberi, C. album, and A. retroflexus, respectively, under optimum growth chamber conditions. Therefore, mulch effects on microclimate factors affecting dormancy probably had minimal effect on these seed lots. Allelopathic influences were probably minimal because mulches that have been associated with allelopathy such as S. cereale, T incar- natum, and V villosa (Teasdale 1998; White et al. 1989) were fit equally with the same general equations (9 and 10) as relatively inert or highly weathered mulches such as bark, Z mays, Quercus leaves, and synthetic fabric. Observation of residuals after fitting Equations 9 and 10 to pooled data indicated no pattern suggesting lack of fit by any mulch. Bosy and Reader (1995) also found that physical impedance by grass residue was the dominating effect in reducing seed- ling emergence compared with either microclimate effects on germination or allelopathy. Therefore, our results are most consistent with physical impedance and light depri-
Teasdale and Mohler: Mulch properties and weed emergence * 391

vation as the principle mechanisms controlling emergence rates through these mulches.
An artificial seedbank was created for this experiment that was uniform but not necessarily similar to natural seed- banks. Seeds were mostly nondormant and were placed at an optimum 1-cm depth for emergence. Therefore, the models and coefficients presented in this paper represent the response to mulches of a weed seedbank that has optimum germination and emergence potential. Model adaptation may be needed to account for the influence of mulches on factors influencing dormancy status of weed seeds. Also, models may need adaptation to account for responses to mulches when weeds emerge from less optimum depths (deeper or shallower). For example, preliminary information suggests that Equation 6 may be more appropriate for seeds emerging from the soil surface (Mohler, unpublished re- sults). Future research needs to investigate the interactions between mulches, seed dormancy, and seed depth to clarify the best modeling approach for describing emergence through mulches of weeds from natural seedbanks.
Source of Materials 1 Bark mulch, Pine Bark Nuggets, Kamlar Corp., 444 Kamlar
Dr., Rocky Mount, NC 27804. 2 Landscape fabric, Yard-Tech Brown Landscape Fabric, Agway,
213 S. Fulton St., Ithaca, NY 14850. 3 Leaf Area Meter, Model LI-3100, LI-COR, Inc., 4421 Supe-
rior St., Lincoln, NE 68504. 4 Quantum sensor, Model LI-191, LI-COR, Inc., 4421 Supe-
rior St., Lincoln, NE 68504.
Acknowledgments This project was funded in part by USDA NRICGP grant #95-
37315-2018. The authors thank Fred Magruder, Joyce Lombardi, Matt Skidmore, Sara Moussavi, Paul Gerber, Michele Evancho, and Amy Ellis for their careful technical assistance on this project.
Literature Cited Alm, D. M., E. W. Stoller, and L. M. Wax. 1993. An index model for
predicting seed germination and emergence rates. Weed Technol. 7: 560-569.
Blum, U., L. D. King, T. M. Gerig, M. E. Lehman, and A. D. Worsham.
1997. Effects of clover and small grain cover crops and tillage tech- niques on seedling emergence of some dicotyledonous weed species. Amer. J. Alternative Agric. 12:146-161.
Bosy, J. L. and R. J. Reader. 1995. Mechanisms underlying the suppression of forb seedling emergence by grass litter. Functional Ecol. 9:635-639.
Buhler, D. D., T. C. Mester, and K. A. Kohler. 1996. The effect of maize residues and tillage on emergence of Setariafaberi, Abutilon theophrasti, Amarathus retroflexus and Chenopodium album. Weed Res. 36:153- 165.
Facelli, J. M. and S.T.A. Pickett. 199 la. Plant litter: Its dynamics and effects on plant community structure. Bot. Rev. 57:1-32.
Facelli, J. M. and S.T.A. Pickett. 1991b. Plant litter: Light interception and effects on an old-field plant community. Ecol. 72:1024-1031.
Forcella, F. 1998. Real-time assessment of seed dormancy and seedling growth for weed management. Seed Sci. Res. 8:201-209.
Gallagher, R. S. and J. Cardina. 1998. Phytochrome-mediated Amaranthus germination II: development of very low fluence sensitivity. Weed Sci. 46:53-58.
Gregory, J. M. 1982. Soil cover prediction with various amounts and types of crop residue. Trans. Amer. Soc. Agric. Eng. 1333-1337.
Hatfield, J. L. 1998. Application of micrometeorology to weed biology and modeling. Pages 271-292 in J. L. Hatfield, D. D. Buhler, and B. A. Stewart, eds. Integrated Weed and Soil Management. Chelsea, MI: Ann Arbor Press.
Lybecker, D. W, E. E. Schweizer, and R. P. King. 1991. Weed management decisions in corn based on bioeconomic modeling. Weed Sci. 39:124- 129.
Mohler, C. L. 1993. A model of the effects of tillage on emergence of weed seedlings. Ecol. Applic. 3:53-73.
Mohler, C. L. and J. R. Teasdale. 1993. Response of weed emergence to rate of Vicia villosa Roth and Secale cereale L. residue. Weed Res. 33: 487-499.
Swinton, S. M. and R. P. King. 1994. A bioeconomic model for weed management in corn and soybean. Agric. Syst. 44:313-335.
Teasdale, J. R. 1998. Cover crops, smother plants, and weed management. Pages 247-270 in J. L. Hatfield, D. D. Buhler, and B. A. Stewart, eds. Integrated Weed and Soil Management. Chelsea, MI: Ann Arbor Press.
Teasdale, J. R. and C. L. Mohler. 1993. Light transmittance, soil temper- ature, and soil moisture under residue of hairy vetch and rye. Agron. J. 85:673-680.
Vidal, R. A. and T. T. Bauman. 1996. Surface wheat residues, giant foxtail and soybean yield. Weed Sci. 44:939-943.
Wagner-Riddle, C., T. J. Gillespie, and C. J. Swanton. 1996. Rye mulch characterization for the purpose of microclimate modelling. Agric. For- est Meteorol. 78:67-8 1.
White, R. H., A. D. Worsham, and U. Blum. 1989. Allelopathic potential of legume debris and aqueous extracts. Weed Sci. 37:674-679.
Williams II, M. M., D. A. Mortensen, and J. W. Doran. 1998. Assessment of weed and crop fitness in cover crop residues for integrated weed management. Weed Sci. 46:595-603.
Received April 20, 1999, and approved February 29, 2000.
392 * Weed Science 48, May-June 2000