week 3 poverty
TRANSCRIPT

Structural Inequality & the Need for Social Programs
HMNS 10100
1

Poverty in Ontario (Toronto Star, 2011)
• 13.3% in 2009• 17% growth in poverty since 2007 (highest in
Canada)• 1.7 million Ontarians living in poverty
including almost 400,000 children
2

Poverty in Canada (Huffingtonpost, 2012)
Almost 1 in 10 Canadians is considered poor 9.6% (2009) About 3.2 million people now live in low
income, including 634,000 children
3

International Comparisons
“Between the mid-1980s and the mid-1990s, Canada was one of the few developed countries that saw the gap between the rich and the poor get smaller, as measured by income inequality (NCW, 2010)”
“Between the mid-1990s and the mid-2000s, however, Canada had the second largest increase in income inequality among similarly developed countries (NCW, 2010)”
4

5
Measuring Poverty (Statistics Canada, 2012)
• Canada has no official Poverty Line• A generally accepted measure is known as
LICO or Low Income Cut Off (Stats Canada 2012)
• Several different measures of poverty abound –Low Income Measure, Market Basket Measure, Absolute of Basic Needs Approach
• Poverty lines are contested territory in Canada
6

Low Income Cut Off (LICO)
“a family is considered to have a low income when it falls behind the LICO for its family size and community population. LICOs are set by taking what the average household spends of food, clothing, and shelter and adding 20%. The process is carried out for seven family sizes and five community sizes. In addition, Statistics Canada produces cut-offs for before –tax and after =-tax incomes. (Hick, 2010, p.25-26)
7

How much poverty?
• Poverty Headcount – Numbers and proportions of persons in
poverty
• Poverty Gap – How much additional income to reach above
the LICO
• Poverty Duration– How long people experience poverty

LICO After Tax (Statistics Canada , 2011)
2010 500,000 inhabitants or more
1 Person 18,759
2 Persons 22,831
3 Persons 28,430
4 Persons 35,469
5 Persons 40,388
6 Persons 44,791
7 Persons 49,1959
4 Categories of Programs (Hick, 2010, p.17)
Social Insurance
“shared risk assumed, only by those who contribute can receive the benefit (Hick, 2010, p.17)”
10

Demogrants“minimum, flat-rate income based on a demographic
(Hick, 2010, p.18)”
11
Minimum Income
“provide an income to meet basic needs (Hick, 2010, p.17)”
12
Income Supplementation
“a top-up to a primary income (Hick, 2010, p.18)”
13

Social Assistance Canada
Belongs to the minimum income category of the public income security programs
Transfers income to those who have little or no income from employment and provides a minimum for survival.
Conditional based on a - needs assessment (difference between what they have and what they need to survive – the test considers assets that can be sold to provide an income.)
Constitutionally social assistance is the jurisdiction of the provinces
(Hick, 2007, p.258-260)
14
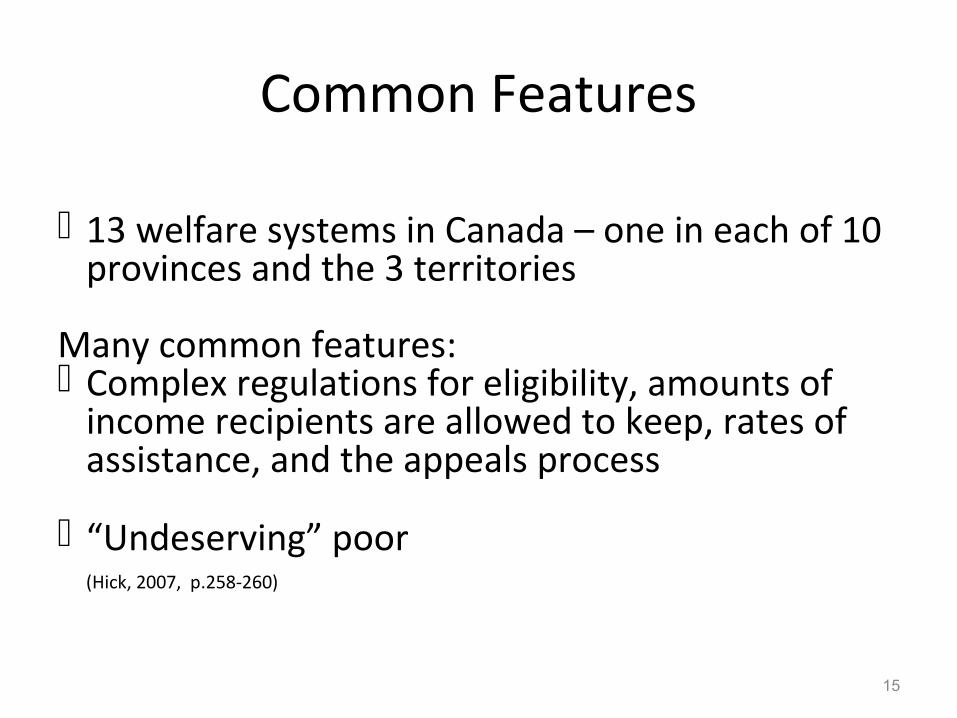
Common Features
13 welfare systems in Canada – one in each of 10 provinces and the 3 territories
Many common features: Complex regulations for eligibility, amounts of
income recipients are allowed to keep, rates of assistance, and the appeals process
“Undeserving” poor (Hick, 2007, p.258-260)
15

Rules & Regulations
• Based on administrative rules that vary throughout the country
• Applicants must be a certain age usually between 18 and 65
• Full-time students in Post- sec. institutions may or may not qualify for assistance
(Hick, 2007, p.258-260)
16
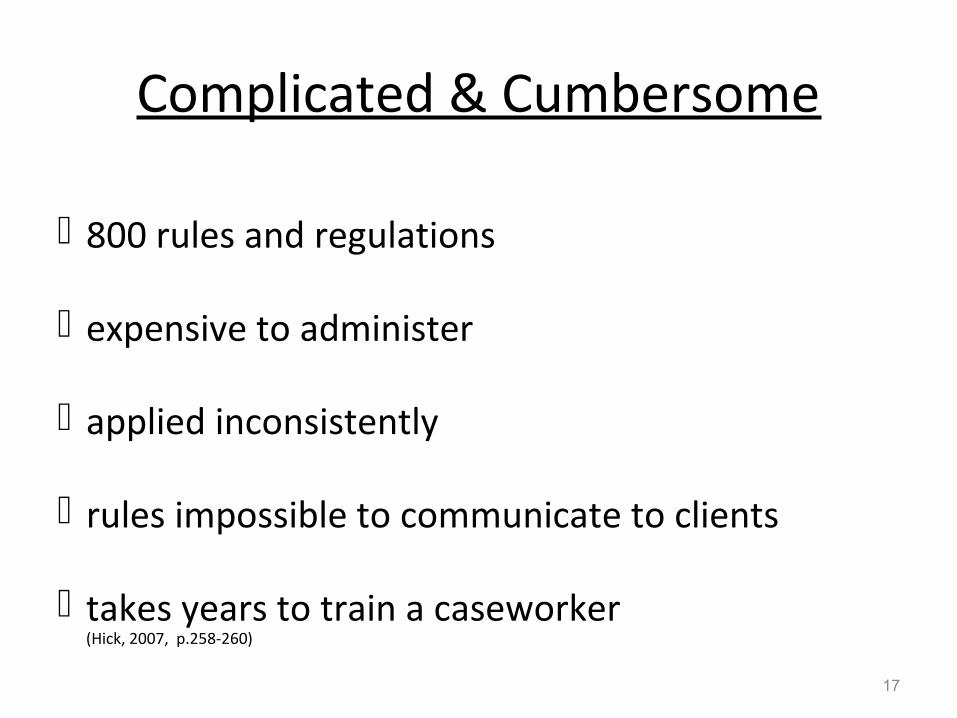
Complicated & Cumbersome
800 rules and regulations
expensive to administer
applied inconsistently
rules impossible to communicate to clients
takes years to train a caseworker (Hick, 2007, p.258-260)
17

Ontario Works 1997
18

3 Types of Eligibility for Social Assistance
Financial Eligibility a household must show financial need a needs test compares the households assets
with its needs when the needs exceed the assets then the
household may receive social assistance (Hick, 2007, p.266)
19
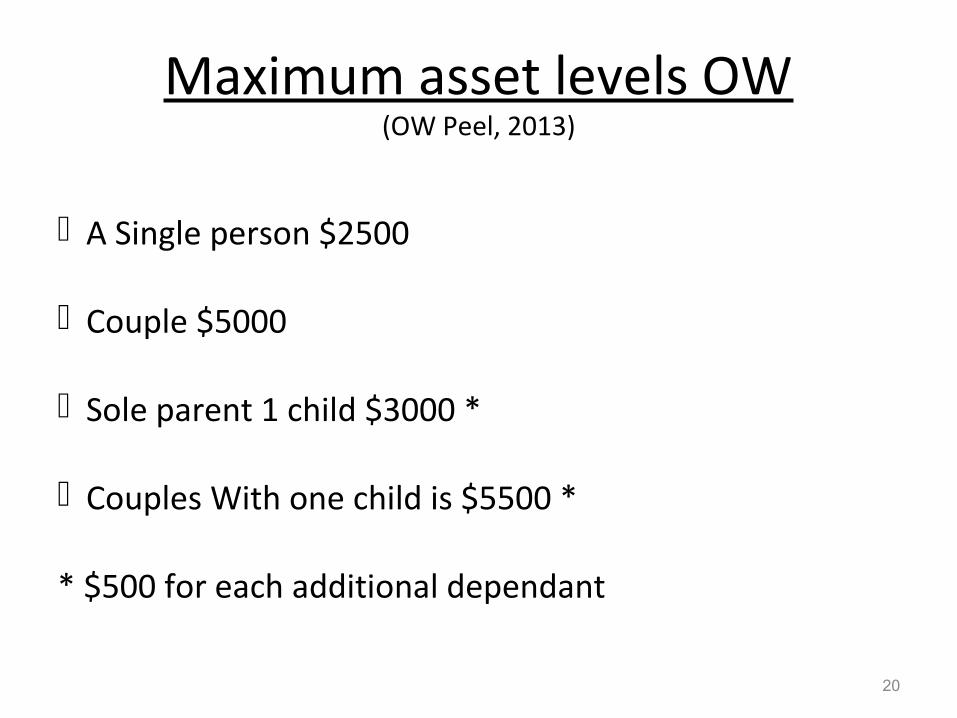
Maximum asset levels OW(OW Peel, 2013)
A Single person $2500
Couple $5000
Sole parent 1 child $3000 *
Couples With one child is $5500 *
* $500 for each additional dependant
20
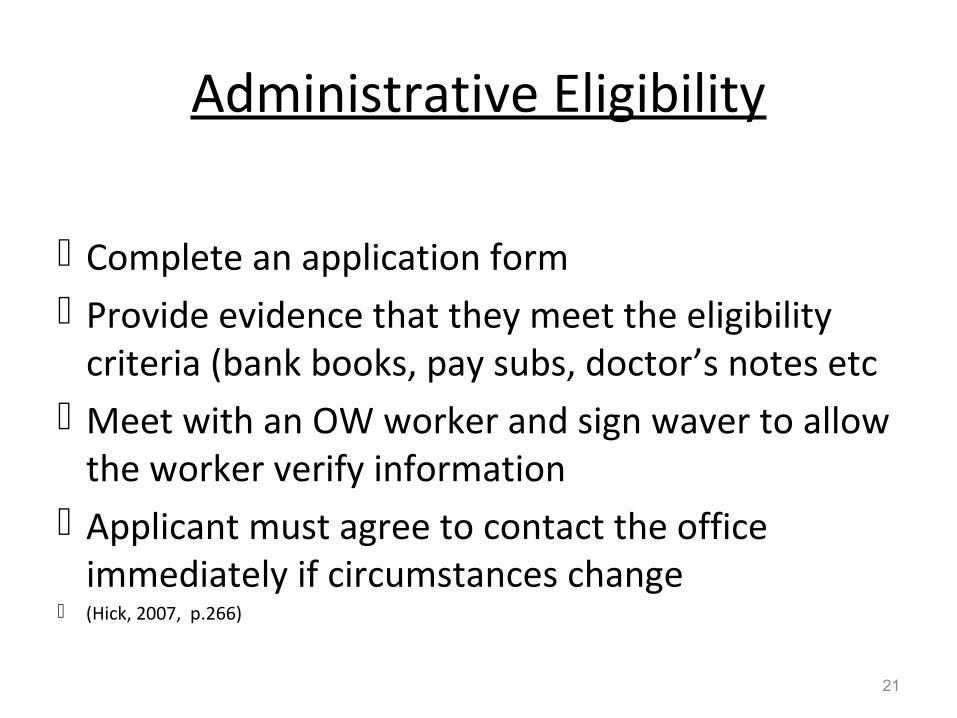
Administrative Eligibility
Complete an application form Provide evidence that they meet the eligibility
criteria (bank books, pay subs, doctor’s notes etc Meet with an OW worker and sign waver to allow
the worker verify information Applicant must agree to contact the office
immediately if circumstances change (Hick, 2007, p.266)
21

Categorical Eligibility
This refers to the different types of reasons people apply for assistance
(i.e.) resident of Ontario, 18 years of age there are some categories that are generally
ineligible for OW these include sponsored immigrants, people in jail, welfare fraud conviction, students and elderly (Hick, 2007, p.266-7)
22
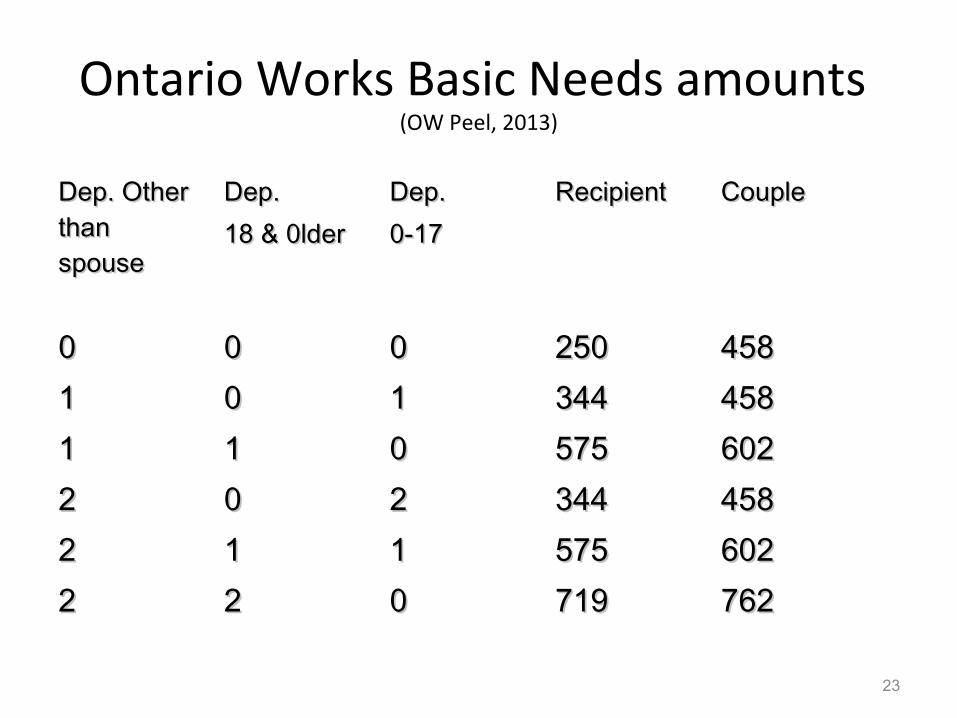
Ontario Works Basic Needs amounts (OW Peel, 2013)
Dep. Other Dep. Other than than spousespouse
Dep. Dep. 18 & 0lder18 & 0lder
Dep. Dep. 0-170-17
RecipientRecipient CoupleCouple
00 00 00 250250 45845811 00 11 344344 45845811 11 00 575575 60260222 00 22 344344 45845822 11 11 575575 60260222 22 00 719719 762762
23
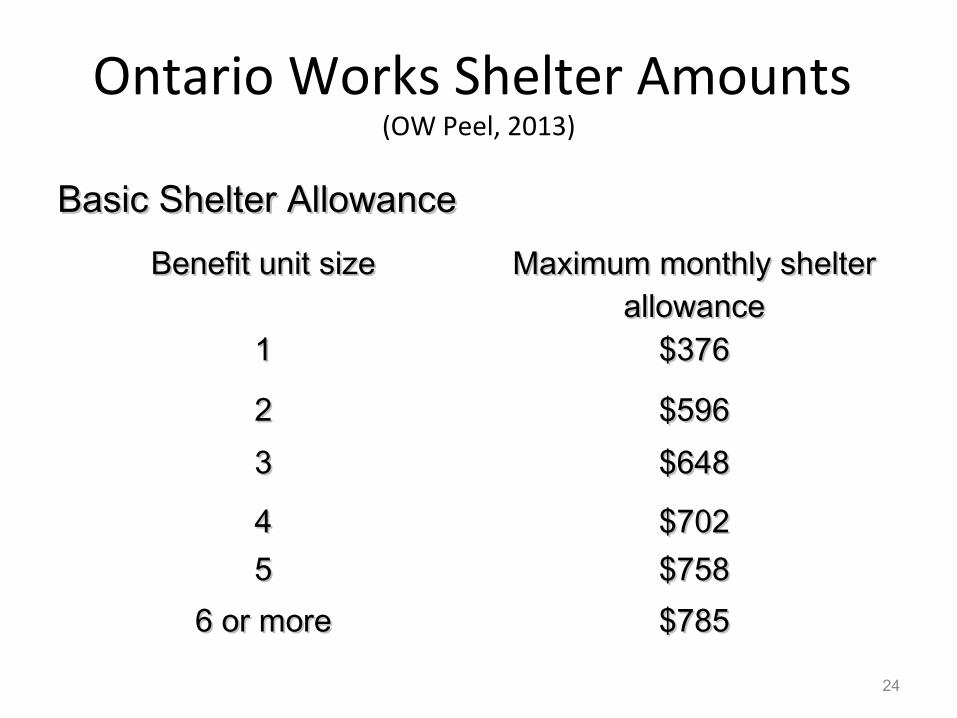
Ontario Works Shelter Amounts (OW Peel, 2013)
Basic Shelter AllowanceBasic Shelter Allowance
Benefit unit sizeBenefit unit size Maximum monthly shelter Maximum monthly shelter allowanceallowance
11 $376$376
22 $596$596
33 $648$648
44 $702$70255 $758$758
6 or more6 or more $785$785
24

Mandatory & Discretionary Benefits (OW Peel, 2013)
Mandatory benefits must be provided to those recipients that meet the criterion.
Discretionary benefits are provided at the discretion of the case worker.
25

Examples of Maximum Benefits Ontario Works
HouseholdHouseholdExamplesExamples
OWOWBasic Basic NeedsNeeds
OWOWMax. Max.
ShelterShelter
Total OW Total OW per Monthper Month
1 person1 person $250$250 $376$376 $626$626
CoupleCouple $458$458 $596$596 $1,054$1,054
*1 adult*1 adult1 child under 181 child under 18
$344$344 $596$596 $940$940
*This household will also receive approximately $482.07 *This household will also receive approximately $482.07 Canada Child Tax Benefit, National Child Benefit Supplement Ontario Child Benefit, UCCB (+GST Rebate not included 45-55)
26

Adequacy of WelfarePeak Welfare Rates & 2013 Rates for Ontario
PeaPeak k
YearYear
Peak Peak Amt.Amt.
20132013Amt.Amt.
$ Change $ Change from from Peak to Peak to 20132013
% Change % Change from Peak from Peak to 2013to 2013
Single Single EmployablEmployablee
19921992 $10,200$10,200 $7,512$7,512 -$2,688-$2,688 -36%-36%
27

Welfare Incomes by household type for Ontario (NCW, 2011)
28
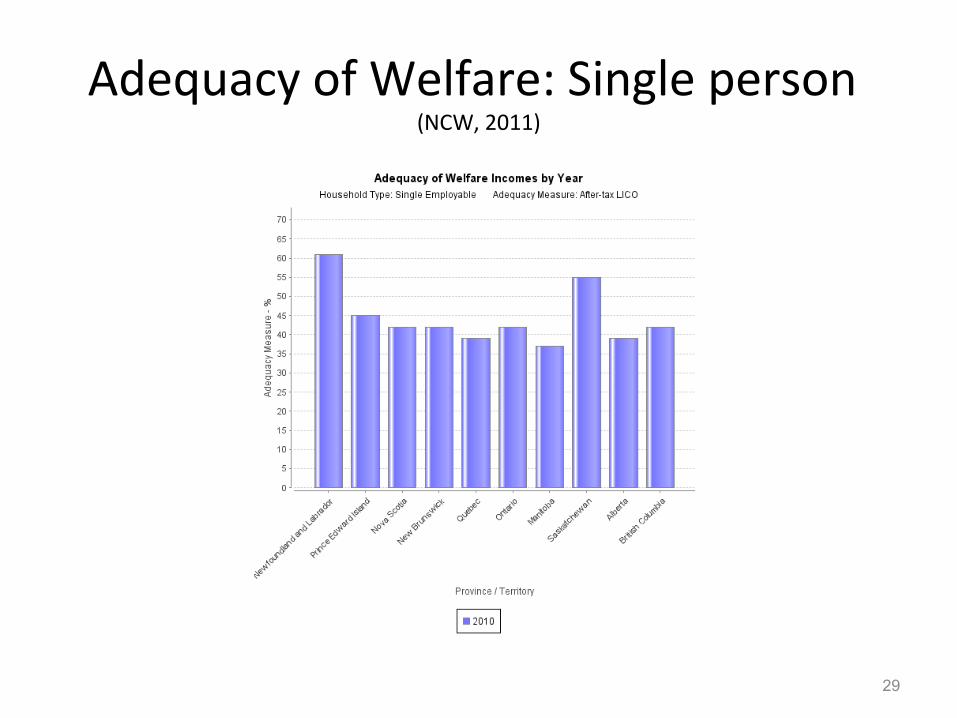
Adequacy of Welfare: Single person (NCW, 2011)
29

Adequacy of Welfare: One Parent, one child (NCW, 2011)
30

Adequacy of Welfare: person with a disability (NCW, 2011)
31

Adequacy of Welfare: Couple Two Children (NCW, 2011)
32
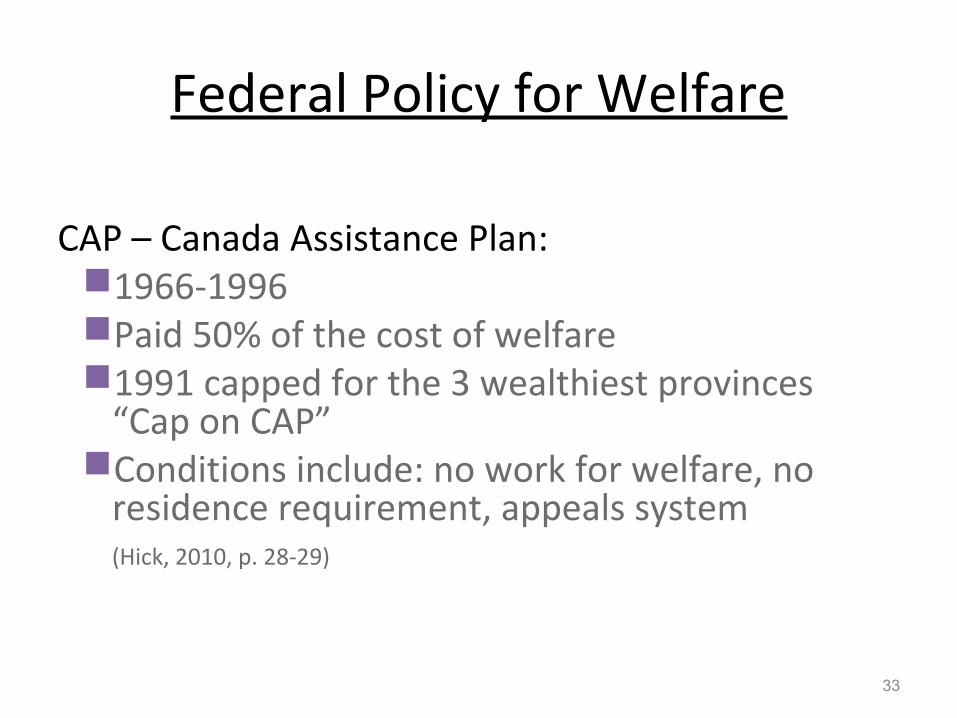
Federal Policy for Welfare
CAP – Canada Assistance Plan:1966-1996Paid 50% of the cost of welfare1991 capped for the 3 wealthiest provinces
“Cap on CAP”Conditions include: no work for welfare, no
residence requirement, appeals system(Hick, 2010, p. 28-29)
33

Canada Health and Social Transfer (CHST, 1996)
National standards diminished CHST included education, health & social
services “workfare” allowed in the new agreement
(Hick, 2010, p. 28-29)
34

ReferencesHuffington Post (September 12, 201 2). Poor In Canada: Statistics Canada Reports One In 10 Canadians Are
Living In Poverty. Retrieved September 7, 2012. http://www.huffingtonpost.ca/2011/06/15/poor-canada-poverty-statistics-canada_n_877311.html?view=screen
Hick, S. (2004). And (2007). Social Welfare In Canada: Understanding Income Security. Toronto, ON: Thompson.
Hick, S. (2010). Social work in Canada an introduction. Toronto, ON., Canada: Thompson Educational Publishing.
National Council of Welfare. (2010). Retrieved from http://www.ncw.gc.ca/[email protected]
OECD. (2011). Society at a Glance. Retrieved from http://www.oecd.org/home/0,2987,en_2649_201185_1_1_1_1_1,00.html
Stats Canada. (2012). Low Income Lines. Retrieved September 11, 1012
Sarlo, C. (2001). New study says poverty in Canada overstated. Fraser Institute. Retrieved September 12, 2012. http://www.fraserinstitute.org/publicationdisplay.aspx?id=12569&terms=poverty+line
http://www.simcoe.ca/dpt/ss/ow/index.htm
http://www.cleo.on.ca/english/index.htm
http://www.campaign2000.ca/quiz2/a1.html
35