week 4 - interactive news editing and producing
TRANSCRIPT
Interactive News Editing and Production Thursday, Jan. 29
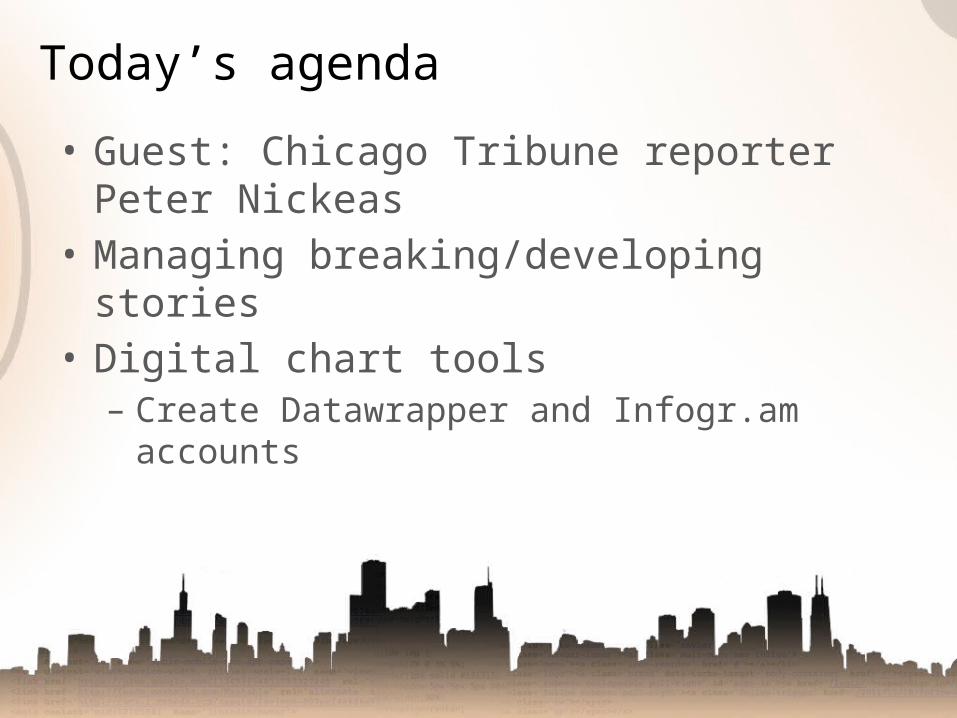
• Guest: Chicago Tribune reporter Peter Nickeas
• Managing breaking/developing stories• Digital chart tools– Create Datawrapper and Infogr.am
accounts
Today’s agenda
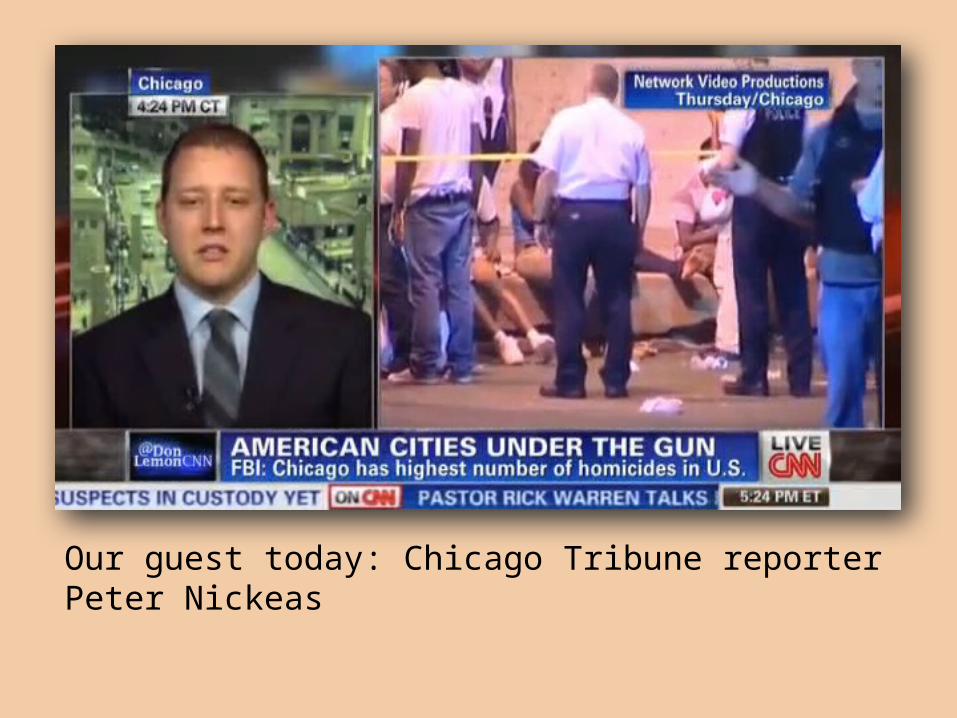
Our guest today: Chicago Tribune reporter Peter Nickeas
• Have a plan/know who is watching• There’s no substitute for preparation• Don’t talk yourself out of story; start and
then see how you should play it• Communicate internally … a lot• Be urgent but not reckless. Being second
and right is better than first and wrong
Tip on developing news
• Think how does this story need to be told• Don’t overwrite it; let the facts speak• Police scanner traffic is garbage• Weigh eyewitness accounts accordingly• There’s often no substitute for being there;
respond accordingly• What’s your headline? That’s probably
your lede
Tip on developing news
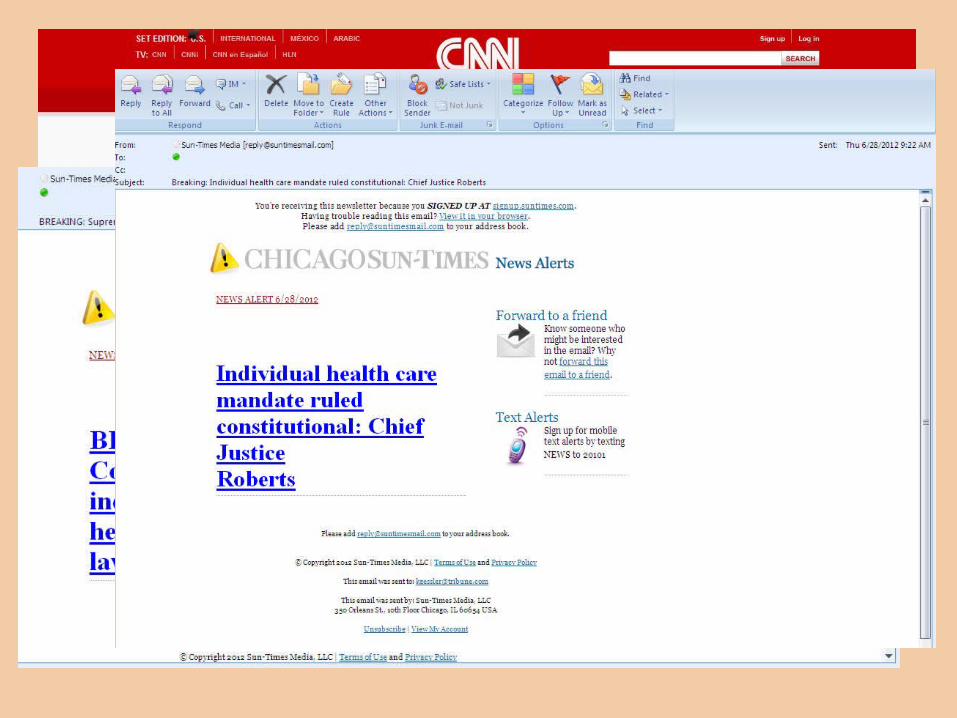
• Never forget we’re covering people, not statistics
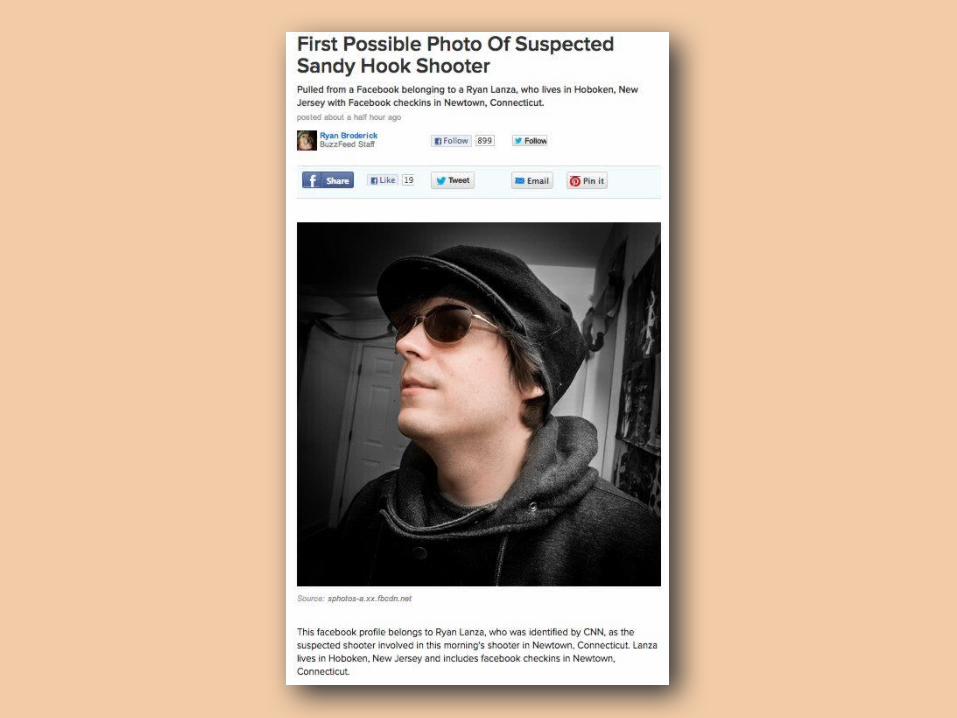
• As tempting as it may be, don’t crib developing news from other media outlets.– When NPR reported that Giffords had died,
other organizations followed suit.– ShipYourEnemiesGlitter.com– Sandy Hook shooting and Ryan Lanza
Tip on developing news
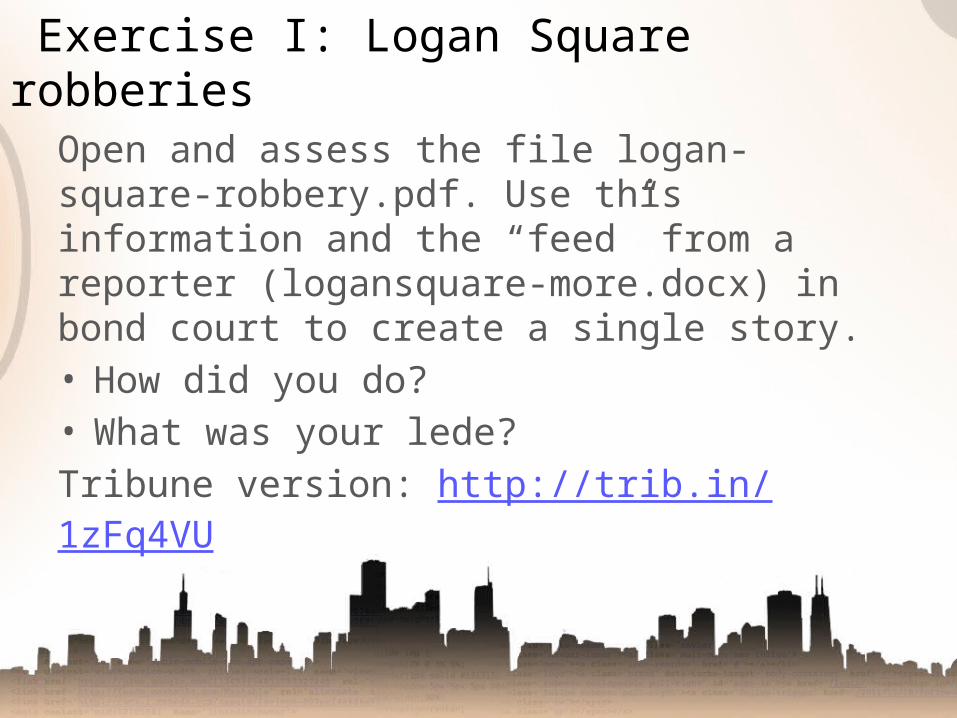
Open and assess the file logan-square-robbery.pdf. Use this information and the “feed” from a reporter (logansquare-more.docx) in bond court to create a single story.• How did you do?• What was your lede?Tribune version: http://trib.in/1zFq4VU
Exercise I: Logan Square robberies
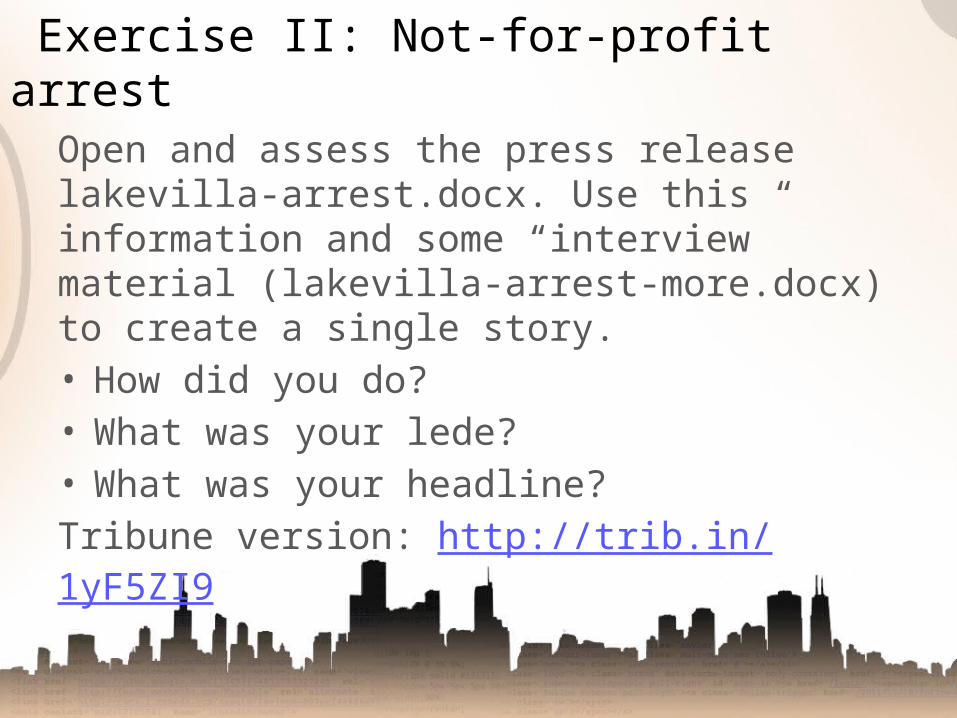
Open and assess the press release lakevilla-arrest.docx. Use this information and some “interview” material (lakevilla-arrest-more.docx) to create a single story.• How did you do?• What was your lede?• What was your headline?Tribune version: http://trib.in/1yF5ZI9
Exercise II: Not-for-profit arrest
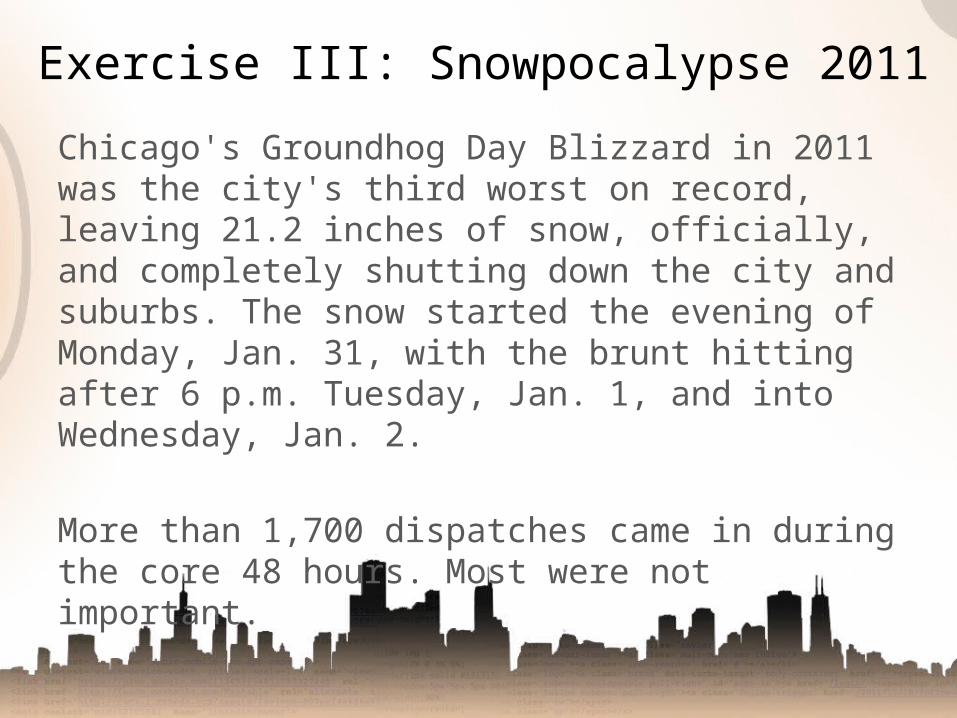
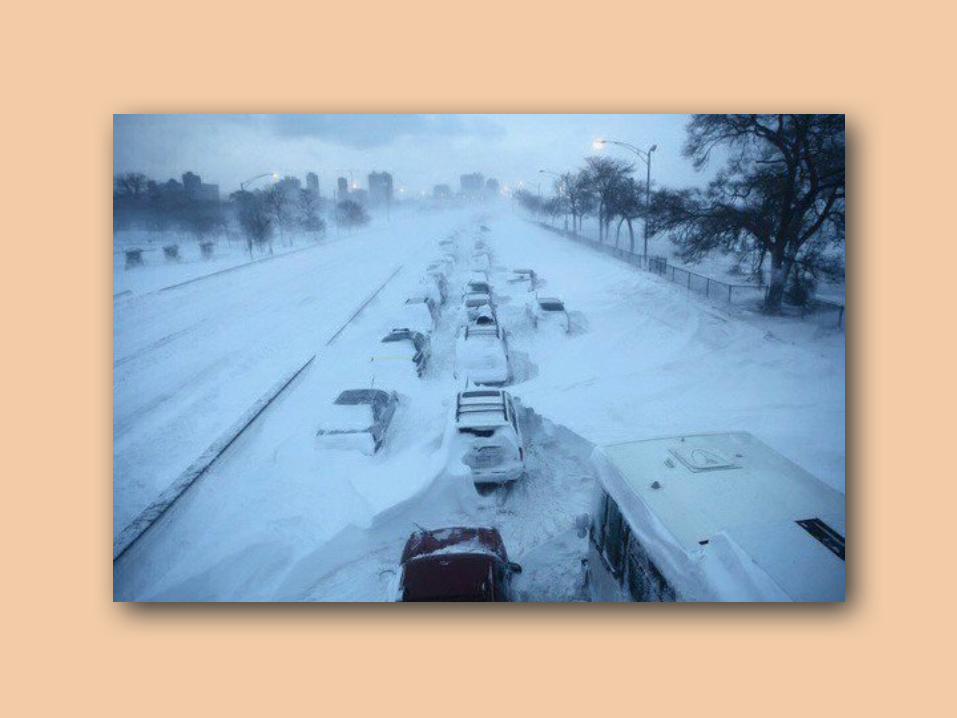
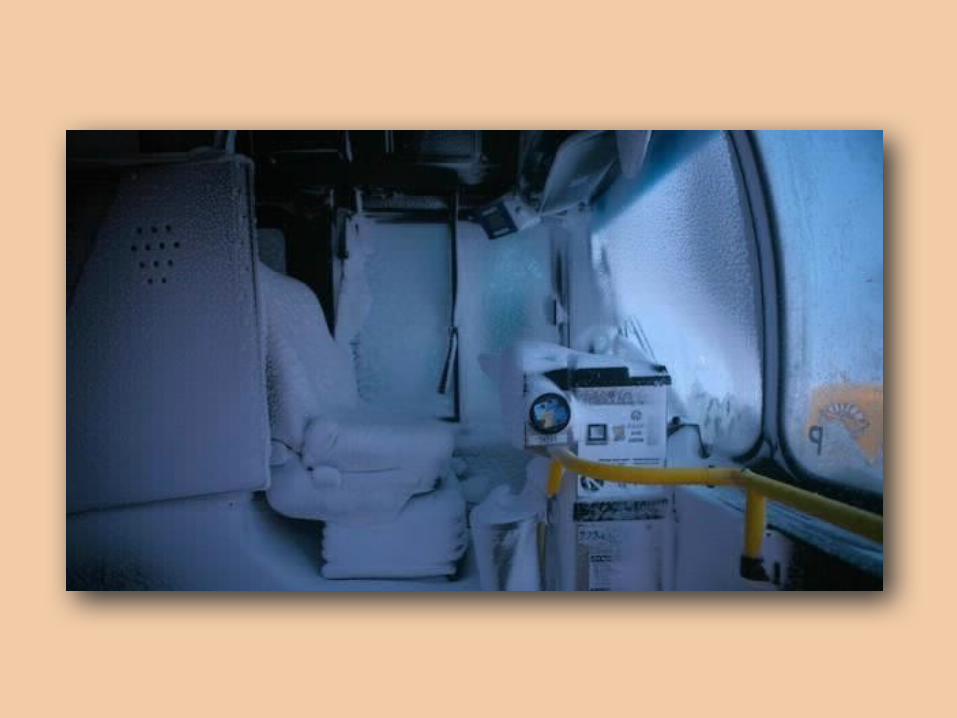
Chicago's Groundhog Day Blizzard in 2011 was the city's third worst on record, leaving 21.2 inches of snow, officially, and completely shutting down the city and suburbs. The snow started the evening of Monday, Jan. 31, with the brunt hitting after 6 p.m. Tuesday, Jan. 1, and into Wednesday, Jan. 2.
More than 1,700 dispatches came in during the core 48 hours. Most were not important.
Exercise III: Snowpocalypse 2011
• I will post (or email) five packages of dispatches from the event.
• It’s your job to identify the pertinent facts and pull them to the top of the story.
• With each new dispatch, you’ll have to fully reassess your article.
• Email me first version and the last version.
Exercise III: Snowpocalypse
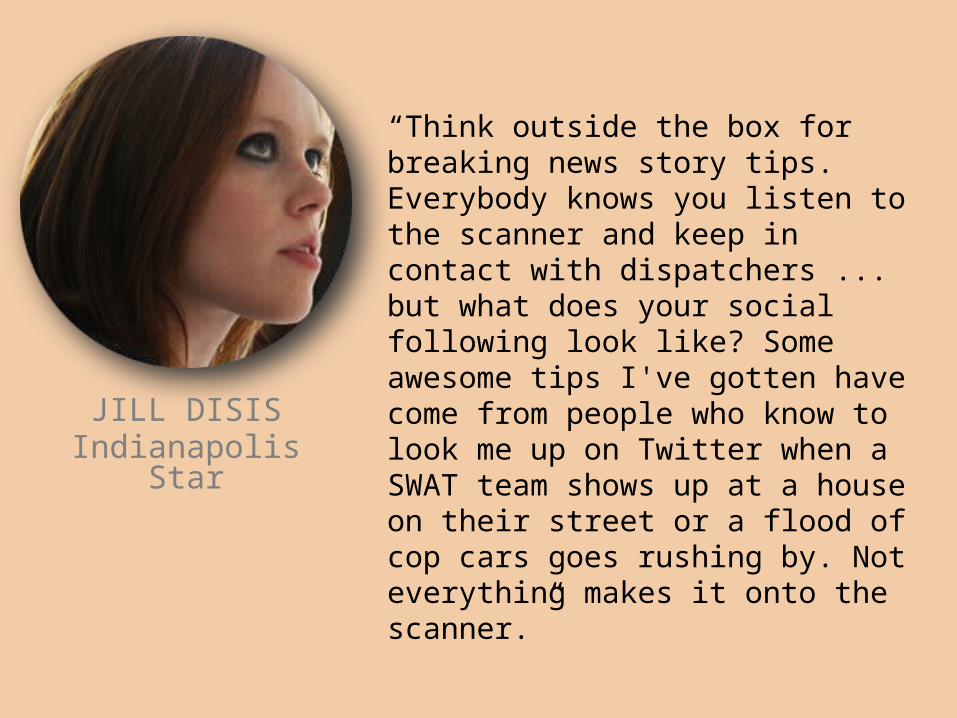
“Think outside the box for breaking news story tips. Everybody knows you listen to the scanner and keep in contact with dispatchers ... but what does your social following look like? Some awesome tips I've gotten have come from people who know to look me up on Twitter when a SWAT team shows up at a house on their street or a flood of cop cars goes rushing by. Not everything makes it onto the scanner.”
JILL DISISIndianapolis Star
“Be there. Actually be on the scene as much as possible, and always get cell numbers from people. Keep all these numbers.”
LIAM FORDChicago Tribune
“Be friendly with the important police/fire officials in every town you cover. Get to know them. Talk about their families, their kids, their dogs. Whatever. It may not pay off right away, but that one day when a 14-year-old stabs an 11-year-old to death at 3 a.m., you'll be the first reporter to get a text.”
LEE FILASDaily Herald
“If you cover breaking news for crime, reporters have to be persistent with the police. Crime reporters just starting out in this city are at a disadvantage because of the inherent disdain that cops have toward the media. But constantly calling the police stations, showing your face at crime scenes and press conferences, etc., will make cops feel more at ease with you. And the more they see you, the more they'll think you care.”
JEREMY GORNERChicago Tribune
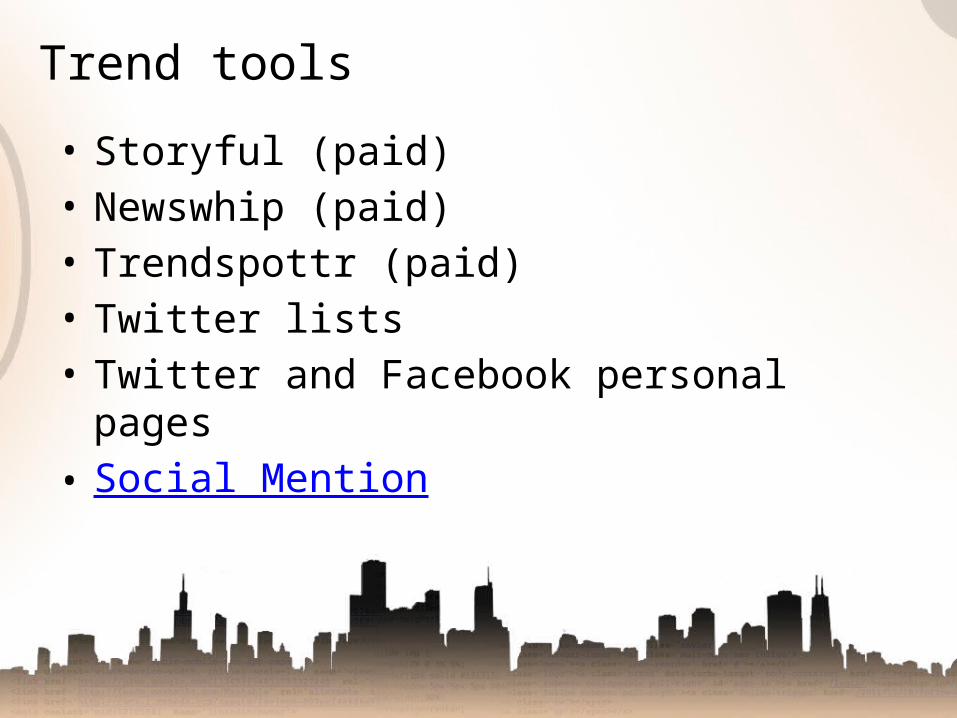
• Storyful (paid)• Newswhip (paid)• Trendspottr (paid)• Twitter lists• Twitter and Facebook personal pages• Social Mention
Trend tools
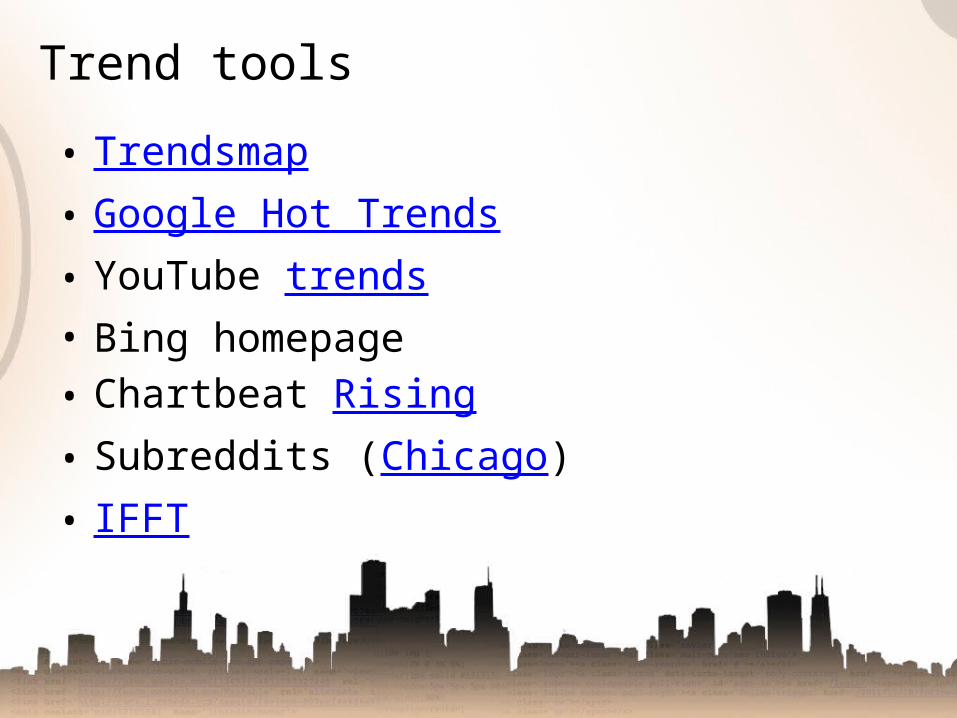
• Trendsmap• Google Hot Trends• YouTube trends• Bing homepage• Chartbeat Rising• Subreddits (Chicago)• IFFT
Trend tools
Digital chart tools
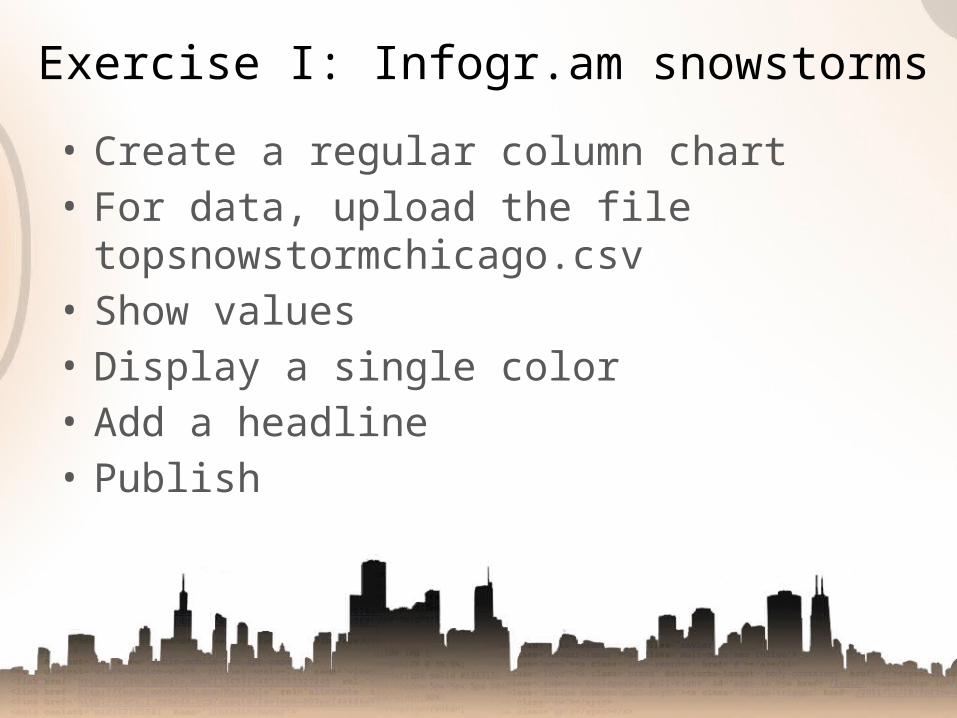
• Create a regular column chart• For data, upload the file
topsnowstormchicago.csv• Show values• Display a single color• Add a headline• Publish
Exercise I: Infogr.am snowstorms
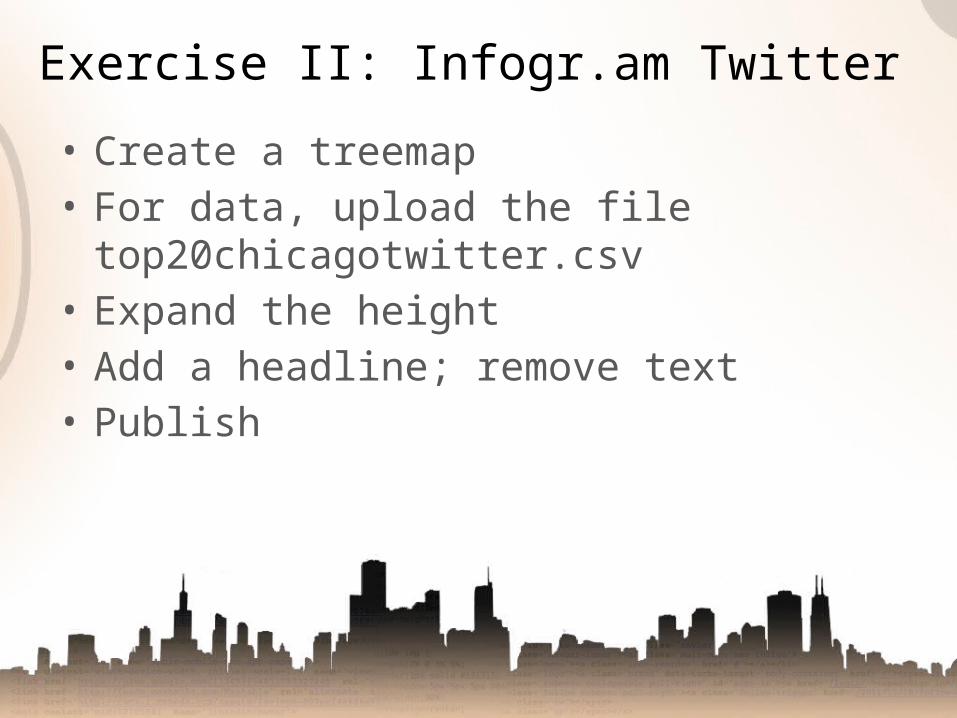
• Create a treemap• For data, upload the file
top20chicagotwitter.csv• Expand the height• Add a headline; remove text• Publish
Exercise II: Infogr.am Twitter
• Create a new chart from the file chicagowintersnowfall.csv
• Data source: National Weather Service• Visualize as a line chart• Change the color, select fill area below line
and use a curved line model• Add headline: “Winter in Chicago”• Add description: “Annual snowfall total, in
inches:• Publish
Exercise III: Datawrapper annual snowfall
• Many Eyes• Visually• Piktochart• Easelly• Quartz chart
builder
More chart tools
• Chart Blocks• Tableau• Google Charts• D3• Highcharts
• None!• Verification Handbook PDF• Fun read: Value of original: http://bit.ly/1zirC4M• Fun read: Explainers: http://bit.ly/1yFCqWI• Fun read: Twitter on breaking: http://bit.ly/
1Hm4ZDk
Homework
• CSS I• Fair Use• Aggregation and curation
Next up