weekly market guide raymond james & associates portfolio …
TRANSCRIPT

PORTFOLIO STRATEGY | PUBLISHED BYRAYMOND JAMES & ASSOCIATES
Michael Gibbs, Director of Equity Portfolio & Technical Strategy | (901) 579-4346 | [email protected] Madere, CFA | (901) 529-5331 | [email protected] Sewell, CFA | (901) 524-4194 | [email protected] Clayton, CMT, Senior Technical Analyst | (901) 579-4812 | [email protected]
MARCH 18, 2021 | 4:52 PM EDT
Weekly Market Guide
Covid trends continue to move in the right direction with hospitalizations down over 70% from the peak in earlyJanuary, new daily hospitalizations down 90%, and new cases down 78%. Vaccinations are also ramping up with65% of all 65+ year old Americans and 28% of all 18+ year-olds having received at least one dose. This is allowingstates to relax stay-at-home measures. And as the economy appears set for a reopening, the Treasury is sendingout stimulus payments from the $1.9T bill passed by Congress recently. Meanwhile, the Fed kept rates unchangedat its FOMC meeting this week, not wavering from its dovish stance and the majority of Fed officials expectingto maintain a 0-0.25% fed funds rate through 2023. All of this contributes to our positive view on the economicrecovery set to transpire this year. In fact, the Fed increased its GDP growth estimate for 2021 to 6.5% (from 4.2%)and for 2022 to 3.3% (up from 3.2%).
The improving macro backdrop- vaccinations indicating a reopening of the economy as 2021 transpires, boostedby unprecedented levels of fiscal and monetary stimulus- continues to result in an upward trend to analystearnings estimates. We have an above consensus $190 S&P 500 earnings estimate for 2021 which reflects 37%earnings growth y/y. The best earnings growth is expected from the hardest-hit areas in 2020, and the bestestimate revision trends continue to come from Energy, Materials, Financials, Tech, and Comm. Services.
As earnings recover, valuation should normalize from elevated levels. The surge higher in interest rates is resultingin a quicker re-rating for some of the higher relative valuation areas (i.e. tech-oriented), however credit spreadsremain low- indicating a lack of pressure on corporations from higher rates beneath the surface. We continueto believe that rates are rising for the right reasons- better economic growth expectations- rather than tightermonetary conditions. In fact, the Fed reiterated its dovish stance yesterday and committed to maintain assetpurchases of $120B/month. For these reasons, we believe that valuation normalization will not outweigh rapidearnings growth in the year ahead. We use a 22x base case P/E assumption (from 27.2x now) to achieve our 4180S&P 500 price target.
Technically, the S&P 500 was able to rebound from its ~4.5% pullback to reach new highs this week. As has been thecase in recent months, the advance was broad and driven by the most cyclical areas. The strong market breadth(in tandem with the rise in rates) not only supports intermediate term technical momentum, but also our viewthat rates are rising for the right reasons. In the short term, the market may need to consolidate its 5.5% two-weekadvance, but we continue to recommend using weakness in favored sectors and stocks as buying opportunities.
.
INTERNATIONAL HEADQUARTERS: THE RAYMOND JAMES FINANCIAL CENTER | 880 CARILLON PARKWAY | ST. PETERSBURG FLORIDA 33716

MACRO: US
Covid trends continue to move in the right direction with hospitalizations down over 70% from the peak in early January, new daily hospitalizations down 90%, and new cases down 78%. Vaccinations are also ramping up with 65% of all 65+ year old Americans and 28% of all 18+ year-olds having received at least one dose. This is allowing states to relax stay-at-home measures. And as the economy appears set for a reopening, the Treasury is sending out stimulus payments from the $1.9T passed bill by Congress recently. Meanwhile, the Fed kept rates unchanged at its FOMC meeting this week, not wavering from its dovish stance and the majority of Fed officials expecting to maintain a 0-0.25% fed funds rate through 2023. All of this contributes to our positive view on the economic recovery set to transpire this year. February retail sales disappointed (as did industrial production), but some of this was weather-related. There was also a big upward adjustment to January retail sales (to 7.6% m/m from 5.3%). Core sales in the first two months of the year are up 7.0% y/y, ahead of this month’s stimulus checks. In fact, the Fed increased its GDP growth estimate for 2021 to 6.5% (from 4.2%) and for 2022 to 3.3% (up from 3.2%).
Source: FactSet, Raymond James Equity Portfolio & Technical Strategy
Event Period Actual Consensus Prior
PPI ex-Food & Energy SA M/M FEB 0.20% 0.30% 1.2%
PPI ex-Food & Energy NSA Y/Y FEB 2.5% 2.7% 2.0%
PPI SA M/M FEB 0.50% 0.45% 1.3%
PPI NSA Y/Y FEB 2.8% 2.8% 1.7%
Retail sales Ex AutoFuel M/M FEB -3.3% -0.50% 8.5%
Retail Sales ex-Auto SA M/M FEB -2.7% -0.50% 8.3%
Retail Sales SA M/M FEB -3.0% -0.50% 7.6%
Capacity Utilization NSA FEB 73.8% 75.5% 75.5%
Industrial Production SA M/M FEB -2.2% 0.40% 1.1%
NAHB Housing Market Index SA MAR 82.0 83.0 84.0
Building Permits SAAR (Preliminary) FEB 1,682K 1,750K 1,886K
Housing Starts SAAR FEB 1,421K 1,570K 1,584K
Housing Starts M/M FEB -10.3% 0.60% -5.1%
Initial Claims SA 03/13 770.0K 701.0K 725.0K
Leading Indicators SA M/M FEB 0.20% 0.40% 0.50%
February sales disappointed, but January retail sales revised up to 7.6% m/m- third highest on record and ahead of March
stimulus checks
Feb industrial production disappointed, but some weather-related. Does
not alter our positive view on the manufacturing
recovery ahead
PAGE 2 OF 12
PORTFOLIO STRATEGY

Source: FactSet, Raymond James Equity Portfolio & Technical Strategy
FUNDAMENTALS
The improving macro backdrop- vaccinations indicating a reopening of the economy as 2021 transpires, boosted by unprecedented levels of fiscal and monetary stimulus- continues to result in an upward trend to analyst earnings estimates. We have an above consensus $190 S&P 500 earnings estimate for 2021 which reflects 37% earnings growth y/y. The best earnings growth is expected from the hardest-hit areas in 2020, and the best estimate revision trends are coming from Energy, Materials, Financials, Tech, and Comm. Services.
As earnings recover, valuation should normalize from elevated levels. The surge higher in interest rates is resulting in a quicker re-rating for some of the higher relative valuation areas (i.e. tech-oriented), however credit spreads remain low- indicating a lack of pressure on corporations from higher rates beneath the surface. We continue to believe that rates are rising for the right reasons- better economic growth expectations- rather than tighter monetary conditions. In fact, the Fed reiterated its dovish stance yesterday and committed to maintain asset purchases of $120B/month. For these reasons, we believe that valuation normalization will not outweigh rapid earnings growth in the year ahead. We use a 22x base case P/E assumption (from 27.2x now) to achieve our 4180 S&P 500 price target.
2020 -13.6%
2021 25.2%
2022 15.3%
2023 9.9%
EPS Growth
Estimates
173.63
200.13
219.86
138.68
120
140
160
180
200
220
240
Ma
r-20
Ap
r-2
0
Ma
y-2
0
Jun
-20
Jul-
20
Au
g-2
0
Sep
-20
Oct
-20
No
v-2
0
De
c-20
Jan
-21
Feb
-21
Ma
r-21
S&P 500 Consensus Earnings Estimates over Past Year
2020 2021 2022 2023 Credit spreads remain low, despite rise in rates (to pre-pandemic levels)
S&P 500 P/E
S&P 500
PAGE 3 OF 12
PORTFOLIO STRATEGY
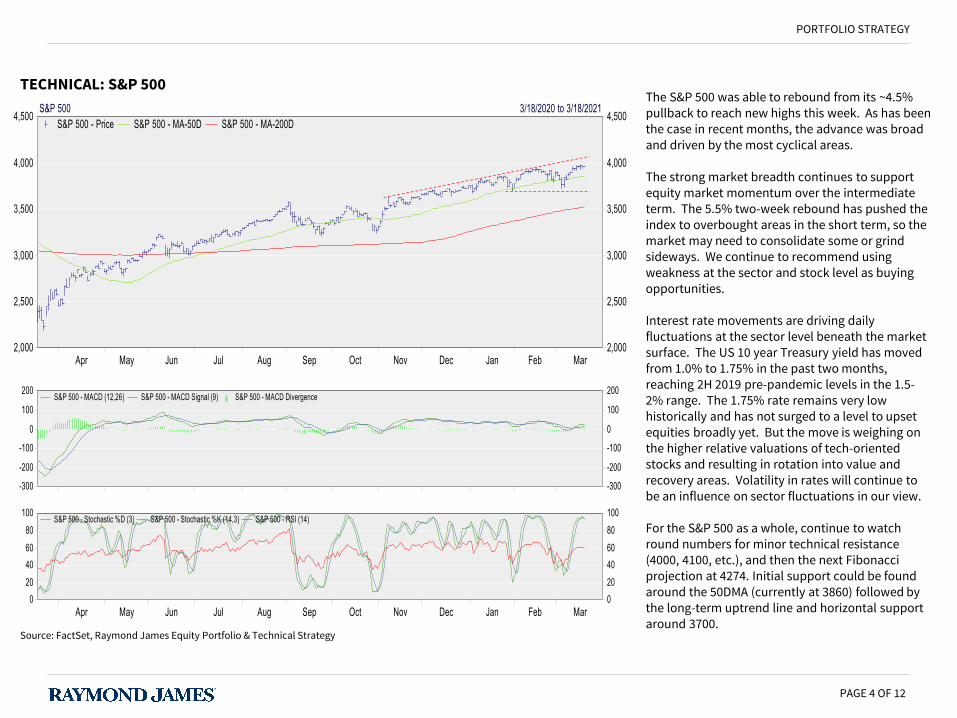
TECHNICAL: S&P 500 The S&P 500 was able to rebound from its ~4.5% pullback to reach new highs this week. As has been the case in recent months, the advance was broad and driven by the most cyclical areas. The strong market breadth continues to support equity market momentum over the intermediate term. The 5.5% two-week rebound has pushed the index to overbought areas in the short term, so the market may need to consolidate some or grind sideways. We continue to recommend using weakness at the sector and stock level as buying opportunities. Interest rate movements are driving daily fluctuations at the sector level beneath the market surface. The US 10 year Treasury yield has moved from 1.0% to 1.75% in the past two months, reaching 2H 2019 pre-pandemic levels in the 1.5-2% range. The 1.75% rate remains very low historically and has not surged to a level to upset equities broadly yet. But the move is weighing on the higher relative valuations of tech-oriented stocks and resulting in rotation into value and recovery areas. Volatility in rates will continue to be an influence on sector fluctuations in our view. For the S&P 500 as a whole, continue to watch round numbers for minor technical resistance (4000, 4100, etc.), and then the next Fibonacci projection at 4274. Initial support could be found around the 50DMA (currently at 3860) followed by the long-term uptrend line and horizontal support around 3700.
Source: FactSet, Raymond James Equity Portfolio & Technical Strategy
PAGE 4 OF 12
PORTFOLIO STRATEGY

Source: FactSet, Raymond James Equity Portfolio & Technical Strategy
STRONG MARKET BREADTH
There has been a strong correlation over the past year between relative performance of the equal-weight S&P 500 and the US 10 year Treasury yield. This is also the case for the small caps, and these trends have continued recently. This supports our view that interest rates are rising for the right reasons, as these more economically-sensitive areas have continued to drive market upside with the increase in bond yields. The small caps have “stair-stepped” higher this year with breakouts to new highs being followed by brief consolidation periods. This may prove to be the case again- with a basing period potentially following the past two-week advance to new highs. We continue to favor the small caps, and would accumulate on weakness.
S&P 500 Equal-Weighted Index
Small Caps
Outperformance continues to track with the rise in the US 10 year Treasury yield
… same for Small Caps. Supporting our view that rates are rising for the right reasons
PAGE 5 OF 12
PORTFOLIO STRATEGY

Source: FactSet, Raymond James Equity Portfolio & Technical Strategy
GROWTH VS VALUE
The surge higher in interest rates is weighing on Growth. Many of these stocks operated very well during the pandemic last year and valuation reached lofty levels on the belief that interest rates would remain lower for longer. Interest rates still remain historically low, but the pace of the move higher is causing a re-rating in some of these stocks with higher relative valuations. The group is being used as a source of capital for Value and “recovery” areas perceived to have the most leverage to the economic recovery. We continue to favor Value with new purchases; and for those looking to trim back an overweight position in Growth, now is an opportunity with the index bouncing to technical resistance at the 50 DMA.
S&P 500 Growth S&P 500 Value
PAGE 6 OF 12
PORTFOLIO STRATEGY

Source: FactSet, Raymond James Equity Portfolio & Technical Strategy
INDUSTRIALS
After generally grinding sideways through a lot of the market strength from late November to February, the Industrials were able to break out to new price highs in late February, and are now doing so on a relative basis. This strength is also fairly broad with many of its subsectors exhibiting some technical momentum. In fact, the average Industrials stock is trading at new price and relative strength highs vs the S&P 500. This technical momentum bodes well for performance trends, and supports our overweight recommendation on the sector.
Industrials (Cap-Weighted) Industrials (Equally-Weighted)
Breaking out to relative strength highs
PAGE 7 OF 12
PORTFOLIO STRATEGY

Source: FactSet, Raymond James Equity Portfolio & Technical Strategy
ENERGY
WTI crude oil prices are down -8% today with headlines suggesting struggles on Covid progress in Europe as the catalyst. Crude oil closed below the lower end of its trend channel in place since October, and the energy sector is consequently pulling in today. We do note that WTI crude oil’s 50 DMA is nearby at $58.22; but after the commodity’s near 90% climb since October, we could see further consolidation in the short term. We recommend monitoring WTI crude oil to see where it can stabilize, as well as favored Energy stocks as they approach support levels for an opportunity to accumulate.
Energy consolidating from resistance, monitor for
buying opportunity
WTI crude oil breaking below trend channel in
place since October
PAGE 8 OF 12
PORTFOLIO STRATEGY

Source: FactSet, Raymond James Equity Portfolio & Technical Strategy
APPROACHING 1 YEAR ANNIVERSARY OF 3/23 MARKET LOWS
Next Tuesday, March 23rd will mark the one year anniversary since last year’s market lows. One year ago, the economy was being shut down, market fear indicators (i.e. VIX and Put/Call ratio) were near all-time highs, and the S&P 500 had dropped -34% in about one month. The chart below shows the unbelievable recovery that has taken place since then, led by the most economically-sensitive areas (which were hit harder during the collapse). We remain positive on equities in the next year, due to our expectation for a robust economic and fundamental recovery supported by record amounts of stimulus. However, we would not be surprised for the path to be bumpier along the way. We remind you that volatility is normal and bound to happen, but we would use those periods as buying opportunities.
M21-3499540
PAGE 9 OF 12
PORTFOLIO STRATEGY

IMPORTANT INVESTOR DISCLOSURESThis material is being provided for informational purposes only. Expressions of opinion are provided as of the date above and subject to change. Any information should notbe deemed a recommendation to buy, hold or sell any security. Certain information has been obtained from third-party sources we consider reliable, but we do not guaranteethat such information is accurate or complete. This report is not a complete description of the securities, markets, or developments referred to in this material and does notinclude all available data necessary for making an investment decision. Prior to making an investment decision, please consult with your financial advisor about your individualsituation. Investing involves risk and you may incur a profit or loss regardless of strategy selected. There is no guarantee that the statements, opinions or forecasts providedherein will prove to be correct.
Sector investments are companies engaged in business related to a specific sector. They are subject to fierce competition and their products and services may be subject torapid obsolescence. There are additional risks associated with investing in an individual sector, including limited diversification.
Commodities and currencies investing are generally considered speculative because of the significant potential for investment loss. Their markets are likely to be volatile andthere may be sharp price fluctuations even during periods when prices overall are rising.
Links to third-party websites are being provided for informational purposes only. Raymond James is not affiliated with and does not endorse, authorize, or sponsor any ofthe listed websites or their respective sponsors. Raymond James is not responsible for the content of any third-party website or the collection or use of information regardingany websites users and/or members.
This report is provided to clients of Raymond James only for your personal, noncommercial use. Except as expressly authorized by Raymond James, you may not copy,reproduce, transmit, sell, display, distribute, publish, broadcast, circulate, modify, disseminate, or commercially exploit the information contained in this report, in printed,electronic, or any other form, in any manner, without the prior express written consent of Raymond James. You also agree not to use the information provided in this report forany unlawful purpose. This report and its contents are the property of Raymond James and are protected by applicable copyright, trade secret, or other intellectual propertylaws (of the United States and other countries). United States law, 17 U.S.C. Sec. 501 et seq, provides for civil and criminal penalties for copyright infringement. No copyrightclaimed in incorporated U.S. government works.
Index Definitions
The S&P 500 is an unmanaged index of 500 widely held stocks that is generally considered representative of the U.S. stock market.
The Dow Jones Industrial Average (DJIA) is a price-weighted average of 30 significant stocks traded on the New York Stock Exchange (NYSE) and the NASDAQ.
The NASDAQ Composite is a stock market index of the common stocks and similar securities listed on the NASDAQ stock market.
The MSCI World All Cap Index captures large, mid, small and micro-cap representation across 23 Developed Markets (DM) countries. With 11,732 constituents, the index iscomprehensive, covering approximately 99% of the free float-adjusted market capitalization in each country.
The MSCI EAFE (Europe, Australasia, and Far East) is a free float-adjusted market capitalization index that is designed to measure developed market equity performance,excluding the United States & Canada. The EAFE consists of the country indices of 21 developed nations.
The MSCI Emerging Markets Index is designed to measure equity market performance in 23 emerging market countries. The index's three largest industries are materials,energy, and banks.
The Russell 2000 index is an index measuring the performance of approximately 2,000 smallest-cap American companies in the Russell 3000 Index, which is made up of 3,000of the largest U.S. stocks.
The NYSE Alerian MLP is the leading gauge of energy infrastructure Master Limited Partnerships (MLPs). The capped, float-adjusted, capitalization-weighted index, whoseconstituents earn the majority of their cash flow from midstream activities involving energy commodities, is disseminated real-time on a price-return basis (AMZ) and on atotal-return basis (AMZX).
PAGE 10 OF 12
PORTFOLIO STRATEGY

The Barclays Intermediate Government/Credit Bond index measures the performance of U.S. Dollar denominated U.S. Treasuries, government-related and investment gradeU.S. corporate securities that have a remaining maturity of greater than one year and less than ten years.
The Euro Stoxx 50 Index is a market capitalization weighted stock index of 50 large, blue-chip European companies operating within Eurozone nations. Components areselected from the Euro STOXX Index which includes large-, mid- and small-cap stocks in the Eurozone.
The China CSI 300 is a capitalization-weighted stock market index designed to replicate the performance of top 300 stocks traded in the Shanghai and Shenzhen stockexchanges. It had a sub-indexes CSI 100 Index and CSI 200 Index.
The S&P 500 Futures is a capitalization-weighted index of 500 stocks. The index is designed to measure performance of the broad domestic economy through changes in theaggregate market value of 500 stocks representing all major industries.
The DJIA Futures is a stock market index futures contract traded on the Chicago Mercantile Exchange`s Globex electronic trading platform. Dow Futures is based off the Dow30 stock index.
The Nasdaq 100 Futures is a modified capitalization-weighted index of the 100 largest and most active non-financial domestic and international companies listed on theNASDAQ.
Europe: DAX (Deutscher Aktienindex (German stock index)) is a blue chip stock market index consisting of the 30 major German companies trading on the Frankfurt StockExchange.
Asia: Nikkei is short for Japan's Nikkei 225 Stock Average, the leading and most-respected index of Japanese stocks. It is a price-weighted index composed of Japan's top 225blue-chip companies traded on the Tokyo Stock Exchange.
Keep in mind that individuals cannot invest directly in any index, and index performance does not include transaction costs or other fees, which will affect actual investmentperformance. Individual investor's results will vary. Past performance does not guarantee future results. Future investment performance cannot be guaranteed, investmentyields will fluctuate with market conditions.
International Disclosures
For�clients�in�the�United�Kingdom:
For clients of Raymond James Financial International Limited (RJFI): This document and any investment to which this document relates is intended for the sole use ofthe persons to whom it is addressed, being persons who are Eligible Counterparties or Professional Clients as described in the FCA rules or persons described in Articles 19(5)(Investment professionals) or 49(2) (high net worth companies, unincorporated associations, etc.) of the Financial Services and Markets Act 2000 (Financial Promotion) Order2005 (as amended)or any other person to whom this promotion may lawfully be directed. It is not intended to be distributed or passed on, directly or indirectly, to any otherclass of persons and may not be relied upon by such persons and is, therefore, not intended for private individuals or those who would be classified as Retail Clients.
For clients of Raymond James Investment Services, Ltd.: This document is for the use of professional investment advisers and managers and is not intended for use byclients.
For�clients�in�France:
This document and any investment to which this document relates is intended for the sole use of the persons to whom it is addressed, being persons who are EligibleCounterparties or Professional Clients as described in "Code Monetaire et Financier" and Reglement General de l'Autorite des marches Financiers. It is not intended to bedistributed or passed on, directly or indirectly, to any other class of persons and may not be relied upon by such persons and is, therefore, not intended for private individualsor those who would be classified as Retail Clients.
For clients of Raymond James Euro Equities: Raymond James Euro Equities is authorised and regulated by the Autorite de Controle Prudentiel et de Resolution and theAutorite des Marches Financiers.
PAGE 11 OF 12
PORTFOLIO STRATEGY

For�institutional�clients�in�the�European�Economic�rea�(EE�)�outside�of�the�United�Kingdom:
This document (and any attachments or exhibits hereto) is intended only for EEA institutional clients or others to whom it may lawfully be submitted.
For�Canadian�clients:
This document is not prepared subject to Canadian disclosure requirements, unless a Canadian has contributed to the content of the document. In the case where there isCanadian contribution, the document meets all applicable IIROC disclosure requirements.
Broker Dealer Disclosures
Securities are: NOT Deposits • NOT Insured by FDIC or any other government agency • NOT GUARANTEED by the bank • Subject to risk and may lose value
Raymond James & Associates, Inc., member New York Stock Exchange/SIPC. Raymond James Financial Services, Inc., member FINRA/SIPC. Raymond James® is aregistered trademark of Raymond James Financial, Inc.
PAGE 12 OF 12
PORTFOLIO STRATEGY