weekly report drought monitor / snowpack update
TRANSCRIPT

Natural Resources Conservation Service P.O. Box 2890 Washington, D.C. 20013
____________________________________________________________________________________________________
The Natural Resources Conservation Service provides leadership in a partnership effort to help people conserve maintain and improve our natural resources and environment
An Equal Opportunity Employer
Weekly Snowpack / Drought Monitor Update 18 July 2013
Temperature ........................................................................ 1 Precipitation ......................................................................... 3 Weather and Drought Summary .......................................... 5 Soil Moisture ........................................................................ 8 Soil Climate Analysis Network (SCAN) ................................ 8 U.S. Historical Streamflow ................................................... 9
Complete National Drought Summary ............................... 10 State Activities .................................................................. 11 For More Information ......................................................... 12 Drought Outlook (Forecast through October) ..................... 12 Supplemental Data ............................................................ 13 Latest Seasonal Outlook from the NOAA CPC .................. 15
Temperature
SNOTEL and ACIS 7-day temperature anomaly ending this morning reveals temperatures within ±5°F. Check out a new SNOTEL webcam (updated every 10 minutes).

Weekly Snowpack and Drought Monitor Update Report
07/18/2013 Page 2 of 16
ACIS 7-day average temperature anomalies, ending Wednesday morning, show the greatest positive temperature departures concentrated over the Interior West and into the northern High Plains (>+6°F). Cooler than average conditions prevailed over the perimeter of the Western States with the greatest negative departures occurring over northeastern New Mexico (<-8°F). This map currently does not use SNOTEL data, but is expected to later this summer.
For more figures, see the Western Water Assessment’s Intermountain West Climate Dashboard. See the Westwide Drought Tracker for more maps.
This preliminary PRISM temperature map, updated daily, will be available to the public by early fall. The map contains all available network data, including SNOTEL data, and will be updated periodically as additional data become available and are quality controlled.
In this preliminary map, the first half of July has been warmer than normal across the western third of the country, the northeast High Plains, and New England. The southern plains, mid-Mississippi River Valley, and Southeast have been cooler than normal. This pattern remains unchanged from the previous weekly report.

Weekly Snowpack and Drought Monitor Update Report
07/18/2013 Page 3 of 16
Precipitation SNOTEL month to date precipitation percent of normal pattern shows the typically dry Pacific Northwest and wetter southern tier states due to the development of the Southwest Monsoon. In Albuquerque (ABQ), the monsoon officially started on July 1 (see below).
Click images for enlarged version
The high percentages over Nevada reflect total precipitation under one inch, and over Utah two inches at most. See last page for actual amounts across the lower 48 states.
See a recent time lapse cloud sequence of the Southwest Monsoon near Santa Fe. Provided by J. Curtis.
For July, the precipitation pattern has been one that has favored parts of the Interior West, Southwest (due to the seasonal monsoon), northern Rockies, and especially the eastern third of the nation. Drier conditions have dominated the southern through northeastern plains (with the exception of east-central Texas), with extreme lack of moisture over much of the west coast states. This preliminary PRISM precipitation map will be available to the public by early fall. It contains all available network data, including SNOTEL data, and will be updated periodically as additional data become available and are quality controlled.
Summer Monsoon from ABQ
Summer Monsoon from Tucson

Weekly Snowpack and Drought Monitor Update Report
07/18/2013 Page 4 of 16
ACIS 7-day average precipitation amounts for the period ending July 17 show an active monsoon over eastern Arizona, parts of New Mexico, and southern Colorado. Elsewhere, rainfall was negligible. This map currently does not use SNOTEL data, but is expected to later this summer.
In this map, the impact of the Southwest Monsoon is apparent over much of the Four Corner States and southern Nevada. An unusual moving low pressure system that originated in Ohio moved quickly over New Mexico during the past few days. This map currently does not use SNOTEL data, but is expected to later this summer.

Weekly Snowpack and Drought Monitor Update Report
07/18/2013 Page 5 of 16
For the 2013 Water Year that began on 1 October 2012, the pattern continues to resemble La Niña (i.e., wetter northern tier). Southeastern Oregon, southern Idaho, and northern Nevada have bucked this tendency over the northern tier states with less precipitation. Southwestern Utah, southwestern Colorado, along with all of New Mexico are experiencing deficits. For the remainder of this water year, values should not change significantly from this depiction. For additional information, daily reports by SNOTEL site are available here.
Click image for larger version
Weather and Drought Summary
Western Drought Summary – July 16, 2013
The following Weather and Drought Summary is provided by this week’s NDMC Author: Richard Heim, National Climatic Data Center, NOAA.
Weather Summary: “A broad upper-level ridge extended across the contiguous United States during this U.S. Drought Monitor week. A cold front moving through the ridge brought showers to parts of the northern Plains and Midwest while a closed low retrograded beneath the ridge late in the week, dropping locally heavy rains as it trekked from the Mid-Atlantic to Southern Plains. Moisture from the low enhanced monsoon showers over the Southwest, while the rest of the West was dry. Temperatures were above normal except where depressed by frontal showers or the retrograding low.”
The West: “Southeastern sections of the West saw improved conditions while northern and western parts had deterioration. Monsoon showers, enhanced by moisture from the upper low over the southern Plains, dropped several inches of rain over some parts of Colorado, New Mexico, and Arizona. D3 (extreme drought) was trimmed in extreme southeast Arizona where heavy rains this week gave Douglas an all-time monthly precipitation record for any month of 7.85 inches of rain so far this July. Improvements were made in New Mexico and Colorado by keeping a balance between above-normal rain in the short term (last 7-30 days) and extreme dryness in the long-term (6-24 months). D3-D4 was contracted in southwest New

Weekly Snowpack and Drought Monitor Update Report
07/18/2013 Page 6 of 16
Mexico, D3-D4 was trimmed in parts of Colorado and adjacent north central New Mexico, D3 cut in adjoining southwest Nebraska, and D1 pulled back in north central Colorado. USDA top soil reports showed improvement for New Mexico, which went from 96 percent of the top soil in the state poor to very poor last week to 88 percent July 14, and Colorado (86 percent to 80 percent). But conditions deteriorated in the Northwest, with Idaho’s percentage rising from 39 to 45 percent top soil short to very short and Oregon going from 54 percent to 66 percent.”
“Growing precipitation deficits and worsening soil moisture and pasture and rangeland conditions resulted in the addition of D0 along the east slopes of the Cascades in Washington, expansion of D0 in western Montana and D1 in eastern Oregon, north central Idaho, and western Montana, and D2 in central to eastern Idaho and in the Lake Tahoe region and northward along the California-Nevada state line. Short-term agricultural impacts were growing, adding to the long-term hydrological impacts of the drought, from the Plains to West, resulting in a relabeling of the impacts indicators (to mostly SL).”
A comprehensive narrative describing drought conditions for the nation can be found toward the end of this document. For drought impacts definitions for the figures below, click here.
Late breaking news: Water quality, supply of Colorado River examined in Senate subcommittee
Current Drought Monitor weekly summary. The exceptional D4 levels of drought are scattered across the western Corn Belt of the Plains into southeastern Colorado and eastern New Mexico. For more drought news, see Drought Impact Reporter. The latest drought indicator blend and component percentiles spreadsheet is a great resource for climate division drought statistics. This link is for the latest Drought Outlook (forecast). See climatological rankings. Corn Bets Turn Bearish as Rain Revives U.S. Crops: Commodities - July 11, U.S.

Weekly Snowpack and Drought Monitor Update Report
07/18/2013 Page 7 of 16
See:
Drought Monitor for the Western States Drought Impact Reporter for New Mexico California Data Exchange Center & Flood
Management
News Stories: • Economist talks water worries – 10 July, UT • Drought Is Affecting Produce At Farmers'
Markets - July 9, SW Montana • Drought, hay prices putting pressure on horse
owners - July 7, Colorado • Forecast falls for winter wheat harvest -July 12,
Colorado • Poor grass production hurts California cattle
ranchers - July 9, California • Experts: Expect bigger, fiercer wildfires in West
- July 5, Western U.S. • State issues fire restrictions - July 6, Utah • Key wildlife refuge hit hard in Klamath Basin's
water wars - July 7, S. Oregon, N. California
Note that there was a slight improvement in drought conditions this past week due to the onset of the SW Monsoon.
NIDIS Upper Colorado River Regional Drought Earlier Warning System
Some further deterioration occurred during this past week.
Region with D-4 Exceptional Drought See Kansas Drought Update.
• Dry spell causes concern for farmers - July 11, Eastern Kansas
A
Region with D-4 Exceptional Drought
Check out the Texas Drought Website. See Texas Reservoirs.
• Plains Grains Calls Oklahoma Wheat Harvest 97% Done -July 12, Oklahoma
• Study: Texas Lost Enough Water in the 2011 Drought to Fill Lake Mead Nearly Twice Over – 11 July, Texas
Note additional deterioration during this past week in the lower D-categories.

Weekly Snowpack and Drought Monitor Update Report
07/18/2013 Page 8 of 16
Soil Moisture
Soil moisture ranking in percentile as of July 16 shows considerable dryness over the western Great Basin, eastern California, eastern Arizona, Wyoming Rockies, and the central plains. Excess moisture is noted over northern Montana and much of the eastern seaboard; especially over the Southeastern States. Useful Hydrological Links: Crop Moisture Index; Palmer Drought Severity Index; Standardized Precipitation Index; Surface Water Supply Index; Weekly supplemental maps, Minnesota Climate Working Group; Experimental High Resolution Drought Trigger Tool.
Soil Climate Analysis Network (SCAN)
This NRCS resource shows a site south of the Great Salt Lake in Utah. Note deeper soils are well saturated, but nearer top soils are considerably drier.
Useful Agriculture Links: Vegetation Drought Response Index; Evaporative Stress Index; Vegetation Health Index; NDVI Greenness Map; GRACE-Based Surface Soil Moisture; North American Soil Moisture Network. Monthly Wild Fire Forecast Report.

Weekly Snowpack and Drought Monitor Update Report
07/18/2013 Page 9 of 16
U.S. Historical Streamflow Flooding has decreased significantly this week over northern Ohio but persists along the southeast coastal regions (e.g., NC, SC, GA, and n. FL). Some areas in the Panhandle of Florida have received over 15 inches of rain this month. See the USGS National Water Information System Mapper.
Severe conditions exist over southeastern Nebraska, northeast Kansas, and southeast Texas. The eastern half of the nation has normal or above normal flows.

Weekly Snowpack and Drought Monitor Update Report
07/18/2013 Page 10 of 16
Complete National Drought Summary
The following complete Weather and Drought Summary is provided by this week’s NDMC Author: Richard Heim, National Climatic Data Center, NOAA
National Drought Summary -- July 16, 2013 The discussion in the Looking Ahead section is simply a description of what the official national guidance from the National Weather Service (NWS) National Centers for Environmental Prediction is depicting for current areas of dryness and drought. The NWS forecast products utilized include the HPC 5-day QPF and 5-day Mean Temperature progs, the 6-10 Day Outlooks of Temperature and Precipitation Probability, and the 8-14 Day Outlooks of Temperature and Precipitation Probability, valid as of late Wednesday afternoon of the USDM release week. The NWS forecast web page used for this section is: http://www.cpc.ncep.noaa.gov/products/forecasts/.
Weather Summary: “A broad upper-level ridge extended across the contiguous United States during this U.S. Drought Monitor week. A cold front moving through the ridge brought showers to parts of the northern Plains and Midwest while a closed low retrograded beneath the ridge late in the week, dropping locally heavy rains as it trekked from the Mid-Atlantic to Southern Plains. Moisture from the low enhanced monsoon showers over the Southwest, while the rest of the West was dry. Temperatures were above normal except where depressed by frontal showers or the retrograding low.
The Northeast to Mid-Atlantic: Above-normal temperatures and below-normal precipitation this week allowed the Northeast to dry out from the rains of recent weeks. The Mid-Atlantic had widespread rainfall totals of an inch with locally 2+ inches. One to 2+ inches of rain fell over the D0 (abnormally dry) spot in southwest Pennsylvania-West Virginia, reducing rainfall deficits enough to warrant its removal. With the removal of the D0 spot, the Northeast to Mid-Atlantic is now free of any drought or abnormal dryness on the USDM map.
Southeast: The retrograding upper-level low spread half an inch or more of rain across most of the Southeast, with locally 2 inches or more in parts of the Carolinas and Alabama. With rainfall deficits eased, streams at normal levels or above, and the absence of any drought impacts, the remaining spots of D0 in Alabama were removed, thus freeing the Southeast of any drought or abnormal dryness on the USDM map.
The Plains, Midwest, and Lower Mississippi Valley: The upper low ended its retrograde motion over the Southern Plains where it dumped several inches of rain over central Oklahoma to north central Texas. Seven-day rainfall totals exceeded 2 inches at several Oklahoma stations with 4.54 inches being the heaviest report. Unfortunately, most of the rain fell over areas that were already drought-free, but enough overspread drought areas to cut back the D0-D2 (abnormally dry to severe drought) in the north central counties and D0-D1(abnormally dry to moderate drought) in the south central counties, and eliminate the D4 (exceptional drought) oval in southwestern Oklahoma. In neighboring Texas, 2-4 inches of rain was widespread in the central to north central counties, with 7+ inches reported in Callahan and Coleman counties and nearly 9 inches falling in Eastland County. A wider area of 1+ inches stretched to the east and south, with bands of 1+ inches of rain in the panhandle. As a result, D1-D4 was improved in many areas. But the beneficial rain did not fall everywhere.
Drought or abnormal dryness expanded in parts of southwest, south, northeast, and southeast Texas, as well as eastern Oklahoma where soil moisture continued to decline. Growing rainfall deficits over the last 30-90 days prompted expansion of D0 into Louisiana, Arkansas, and adjoining parts of Mississippi. Acute precipitation deficits and drying soils led to expansion of D1 and introduction of D2 in Arkansas. Further to the north, 30-day rainfall deficits, worsening soil moisture, and warming temperatures resulted in D0 expansion in Missouri and Iowa and eastern sections of Kansas and Nebraska, D1 expansion in northeast Kansas, and D2-D3 expansion in western Nebraska. According to U.S. Department of Agriculture (USDA) reports, the percent of topsoil short or very short in Arkansas grew from 62 percent statewide July 7 to 68 percent July 14, but the percentage increased rapidly in Missouri (from 23 to 53 percent) and Iowa (12 to 35 percent). Top soil conditions also worsened in Nebraska, going from 53 percent to 62 percent, and Kansas (68 to 74 percent). Rains contracted D2 in southwest South Dakota

Weekly Snowpack and Drought Monitor Update Report
07/18/2013 Page 11 of 16
but continued dry conditions expanded D0 and D1 in other sections of the state. Two to three inches of rain in northern Minnesota shaved the northern edge of the D0-D1 there.
The West: Southeastern sections of the West saw improved conditions while northern and western parts had deterioration. Monsoon showers, enhanced by moisture from the upper low over the southern Plains, dropped several inches of rain over some parts of Colorado, New Mexico, and Arizona. D3 (extreme drought) was trimmed in extreme southeast Arizona where heavy rains this week gave Douglas an all-time monthly precipitation record for any month of 7.85 inches of rain so far this July. Improvements were made in New Mexico and Colorado by keeping a balance between above-normal rain in the short term (last 7-30 days) and extreme dryness in the long-term (6-24 months). D3-D4 was contracted in southwest New Mexico, D3-D4 was trimmed in parts of Colorado and adjacent north central New Mexico, D3 cut in adjoining southwest Nebraska, and D1 pulled back in north central Colorado. USDA top soil reports showed improvement for New Mexico, which went from 96 percent of the top soil in the state poor to very poor last week to 88 percent July 14, and Colorado (86 percent to 80 percent). But conditions deteriorated in the Northwest, with Idaho’s percentage rising from 39 to 45 percent top soil short to very short and Oregon going from 54 percent to 66 percent.
Growing precipitation deficits and worsening soil moisture and pasture and rangeland conditions resulted in the addition of D0 along the east slopes of the Cascades in Washington, expansion of D0 in western Montana and D1 in eastern Oregon, north central Idaho, and western Montana, and D2 in central to eastern Idaho and in the Lake Tahoe region and northward along the California-Nevada state line. Short-term agricultural impacts were growing, adding to the long-term hydrological impacts of the drought, from the Plains to West, resulting in a relabeling of the impacts indicators (to mostly SL).
Hawaii, Alaska and Puerto Rico: Precipitation was below normal at most of the stations in Hawaii this week, prompting the expansion of D0 to cover the rest of Maui, Molokai, and Lanai. With sufficient rainfall and above-normal streamflow, Puerto Rico remained free of drought and abnormal dryness on the USDM map. Alaskan stations were generally drier than normal this week, but with decreased wildfire activity, no change was made to the depiction for Alaska this week.
Looking Ahead: During the next 6 days (July 17-22), a stationary front draped across the central Plains to Mid-Atlantic may bring up to an inch of rain from eastern Nebraska to the East Coast, Great Lakes, and Gulf of Mexico Coast, with over 2 inches possible along the Mid-Mississippi to Ohio and Tennessee valleys. Monsoon showers could bring an inch or more of rain to the Four Corners states. Less than a quarter of an inch of rain is forecast for Oklahoma and adjoining parts of Texas, with most of the West expected to be dry. Temperatures should be near to above normal, with the warmest anomalies (6-12 degrees above normal) expected in parts of the West.
The NWS 6-10 day and 8-14 day forecasts (for July 23-31) show the highest likelihood of above-normal precipitation for the Southwest and much of the country east of the Mississippi, with below-normal precipitation from the Northwest to the Central and Southern Plains. The Northeast may expect cooler-than-normal temperatures with the highest likelihood of above-normal temperatures from the West to Great Plains. The southern two-thirds of Alaska should be warmer and drier than normal with the north cooler and wetter than normal.”
State Activities State government drought activities can be tracked at the following URL: http://drought.unl.edu/mitigate/mitigate.htm. NRCS Snow Survey and Water Supply Forecasting (SSWSF) Program State Office personnel are participating in state drought committee meetings and providing the committees and media with appropriate SSWSF information - http://www.wcc.nrcs.usda.gov/cgibin/bor.pl. Additional information describing the products available from the Drought Monitor can be found at the following URLs: http://drought.unl.edu/dm/ and http://www.drought.gov.

Weekly Snowpack and Drought Monitor Update Report
07/18/2013 Page 12 of 16
For More Information The National Water and Climate Center (NWCC) Homepage provides the latest available snowpack and water supply information. Please visit us at http://www.wcc.nrcs.usda.gov. This document is available from the following location on the NWCC homepage -http://www.wcc.nrcs.usda.gov/water/drought/wdr.pl. Reports from 2007 are available online. Reports from 2001-2006 are available on request. This report uses data and products provided by the Interagency Drought Monitor Consortium members and the National Interagency Fire Center. /s/ Micheal L. Golden Deputy Chief, Soil Science and Resource Assessment Drought Outlook (Forecast through October)
Refer to USDA Drought Assistance website and National Sustainable Agriculture Information Service. Read about the new USDA Regional Climate Hubs.
U.S. Seasonal Drought Outlook as of today (18 July). Note projected improvements over parts of the Four Corner States and the Big Bend region of Texas by the end of October.

Weekly Snowpack and Drought Monitor Update Report
07/18/2013 Page 13 of 16
Supplemental Data The “Ag in Drought” file that had been previously posted each week by NDMC’s Brian Fuchs is now available at: http://www.usda.gov/oce/weather/Drought/AgInDrought.pdf This is a collection of drought-related news stories from the past seven days or so. Impact information from these articles is entered into the Drought Impact Reporter. A number of these articles will also be posted on the Drought Headlines page at the NDMC website. Noteworthy topics in the news this week: Agriculture
• Winter wheat yields in southeastern Colorado ranged from zero to 20 bushels per acre or zero to 1.3 tons per hectare, due to drought and freeze damage.
• The cotton crop in the Lower Rio Grande Valley of Texas is expected to be very small, due to fewer acres being planted, low supplies of irrigation water and pests.
• Hay in Colorado remains scarce with poor production again this year. Many horse owners are selling because they can no longer afford hay.
• Hay growers in Arkansas are seeing slow forage growth and need rain to get additional cuttings of hay.
Water
• The high level of nitrates in rivers supplying Des Moines, Iowa means that it takes longer to treat the water, leading to requests for water conservation.
• Irrigation on the Lower Rio Grande in New Mexico will end on July 14 for the shortest irrigation season ever for the Rio Grande Project.
Wildfires
• Continue to burn in the West and especially in Alaska, where there are at least 13 large wildfires burning.
A number of CoCoRaHS folks in Colorado and New Mexico have contributed lately, boosting the number of impacts for those states.
FFor more data on plant health: VegDRI, Evaporative Stress Index, Vegetation Health Indices NVDI Greenness Maps, NWS Precipitation Analysis, GRACE Groundwater and Soil Moisture.

Weekly Snowpack and Drought Monitor Update Report
07/18/2013 Page 14 of 16
Precipitation Seasonality Maps 1 month thru 2012 3 months thru 2012 6 months thru 2012 Quick Description If precipitation were distributed evenly throughout the year...any given location would receive 50% of its annual total in any 6-month period (50% of the year)...25% of the yearly total in a 3-month period...and 81/3% each month. Areas/times where the median climatological proportion of the annual total is significantly larger(smaller) than those numbers are shaded green(brown). There are 2 maps on each page: One for the full modern climate division climatology (1931-2012) and one for the most recent 15 years (1998-2012). The short-period maps were motivated by the OCN tool used in CPC's seasonal temperature and precipitation outlooks - the OCN derives from the most recent 15 years of precipitation, and has some skill (depending on season and location) identifying trends away from longer-term precipitation climatology. – Courtesy: Rich Tinker, NOAA
Weekly Snowpack and Drought Monitor Update Report
07/18/2013 Page 15 of 16
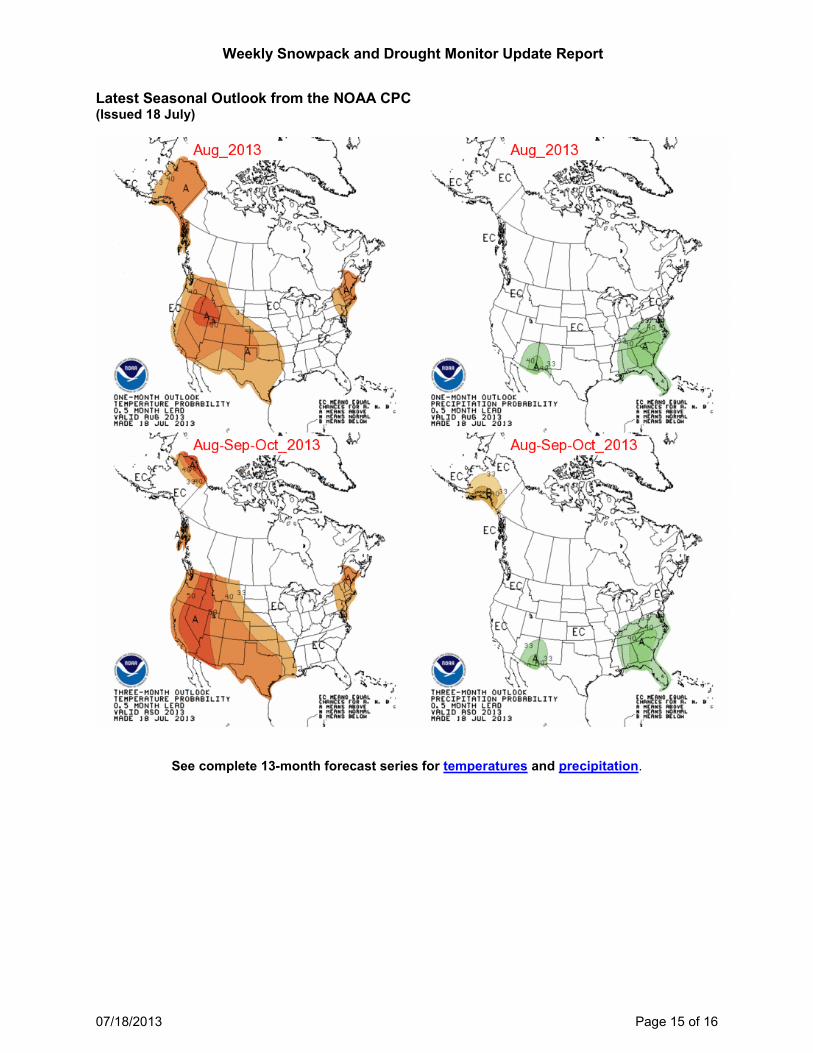
Latest Seasonal Outlook from the NOAA CPC (Issued 18 July)
See complete 13-month forecast series for temperatures and precipitation.

Weekly Snowpack and Drought Monitor Update Report
07/18/2013 Page 16 of 16
And finally, July’s total precipitation as determined by PRISM through July 17:
Total precipitation through the first 17 days of July show amounts exceeding 20 inches over parts of the Panhandle of Florida and the mountains over western North Carolina. The results from the Southwest Monsoon thus far for Arizona and New Mexico have been spotty. Totals range from under one inch to three to five inches.