weekly technical analysis 21st oct 2013
TRANSCRIPT

7/27/2019 Weekly Technical Analysis 21st Oct 2013
http://slidepdf.com/reader/full/weekly-technical-analysis-21st-oct-2013 1/30
Weekly Technical Analysis 21 Oct 2013
- By Vivek Patil, India's foremost expert in Elliot Wave Analysis
Sensex up 1.7%, testing '2008-2010 highs. CBI names Kumar Mangalam Birla in Coal Block allocation case. Supreme Court orders CBI to probe 6 cases of criminality in Radia Tape case. Former MD & CEO of NSEL arrested.
Top Stories of the Week
Sensex testing '2008-2010 highs, watch next 4 days as the rally is slower so far
ical readings carried forward from previous weeks are shown in italics. Readers can easily identify the new argumentsare written in regular font]
eek we discussed, “the recovery above 20050-100 (Nifty 5950-60) has now resulted in recent action turning into anse H&S” formation, with its Neckline near 20050 marked in Yellow … This only indicates Bulls having an upper-
… we may see selective, tricky, volatile, ranged or even +ve actions until we see faster retracement of a rallyingnt, something that can suck the last buyer into the market … Our contention that the current rally is c-leg of 2
nd
tive inside „x‟ could be challenged if Sep‟13 High of 20740 (Nifty 6143) is crossed in faster time … The bias istly +ve, and would remain so until the action closes below Friday‟s gap-up area … we may allow 1-2 day moreove above Sep-High of 20740 (Nifty 6143). Failure to achieve that, followed by weakness below Friday‟s gap-up
could be a -ve sign .. ”
uncated week (Wednesday was Id holiday) saw Sensex touching Sep‟13 high of 20740 on Tuesday. However, itd lower till Thursday, but only to bounce back from previous Friday‟s gap-up area on the last day. At the end of ek, the net close was higher by 354 pts or 1.7%.

7/27/2019 Weekly Technical Analysis 21st Oct 2013
http://slidepdf.com/reader/full/weekly-technical-analysis-21st-oct-2013 2/30
avyweight Metal/Oil&Gas Indexes outperformed with 3.4% gain each, but the broader Indices like BSE Small-nd Mid-Cap Indexes under-performed, gaining less than half a percent during the week.
oiding closing below preceding Friday‟s gap-up area, and by holding the Grey rising channel enclosing last 11ction, the Index maintained the +ve bias as argued.
te Bulls having an upper-hand, it took 9 days to retrace the preceding 8-day fall from 19th
Sep to 1st
Oct. We may,re, maintain the existing label for the rally as c-leg of the 2
nd Corrective inside “x”.
tion on Friday closed above the Sep-13 high of 20740, the level that had proved resistance on Tuesday. The actionBears to run for cover, and attracted last buyers, typical of “distribution” phase we argued for. While pivotals attractedsupport and short-cutting, the broader market under-performed, as compared to Sensex.
test segment of rally from 1st
Oct has now completed 11 days so far. Compared to the preceding „Aug -Seprom 28
th Aug‟13 to 19
th Sep‟13, however, the current rally appear “slower” , as was pointed out last week also.
eceding rally had measured 3291 pts from 17449 to 20740 in 15 days. As against this, the current rally, so far,res 1667 pts in 11 days. The current rally, thus, measures only 50% price in 75% time in comparison .
current rally cannot add 1624+ pts in the next 4 days, it would remain a “slower” rally. Indeed, this may open ability that the development post Aug‟13 is an “Extracting Triangle”.
xtracting Triangle” is a 5-legged pattern with rallies getting smaller and drops bigger. The current rally (fromt), being slower, could be c-leg inside this development, as per labels marked in White color on the Daily chart.

7/27/2019 Weekly Technical Analysis 21st Oct 2013
http://slidepdf.com/reader/full/weekly-technical-analysis-21st-oct-2013 3/30
ay, accordingly, trade with +ve bias, but watch if the rally gradually fizzles out in the next 4 days, and breaksey channel enclosure. The up-trend could have different connotation only otherwise.
eek, the Sensex formed the 3rd
Bull candle in a row on its Weekly chart, and closed near its previous highs of and „2010. That attracted tremendous attention from the players. The question to ask from here would be if theuyer has finally bought into.
enerally seen that after the last buyer gets sucked into, the market is more likely to correct by as much as 30%times even 55-60%). The following picture of the „1992-2003 phase is self-explanatory :
can be seen on the chart, Sensex moved higher than its „1992 highs during „1994 and „1997, but reacted by over 30%e times.
uring „2000, it broke 1992/1994/1997 highs, by as much as 1500 -1600, only to lose 58% later.
corrective phase from „2000 to „2003, Index broke „2000 high by 100 pts , but even then shaved off 30% before thelly could take place.
appened because the 11-year long „1992-2003 phase was a multi-year corrective phase correcting the preceding 11-lly from „1988 to „1992.
d argued that multi-fold rallies require multi-year consolidation phases to absorb the excesses during thefold rallies.

7/27/2019 Weekly Technical Analysis 21st Oct 2013
http://slidepdf.com/reader/full/weekly-technical-analysis-21st-oct-2013 4/30
the Sensex multiplied 7 times during „2003 to „2008, we argued it could require a multi-year consolidation,bly lasting 7 years from „2008, and such a consolidation would, accordingly, end only after „2015.
sic NEoWave requirement is that such a corrective phase should consume more time than the move it isting.
Wave Theory, a correctiv e phase sh apes up as 3-legged Flat/Zigzag, 5-legged Triangle or 7-legged Diam etric basically combines 2 Triangles).
rrent phase from „2008 onwards is correcting the 56 - month move from May‟2003 to Jan‟2008. It already hasued for 69 mon ths from Jan‟2008 till now, i.e. more time than the move it is correcting.
uestion n ow is w hether the corrective ph ase would end as a 5-legged Triangle (already into 5 th leg, i.e. E) OR
i t cont inue for 2 m ore legs and form as 7- legged Diametr ic .
asic level, a move above „2008 highs would be required to justify and modify the corrective phase from „2008ds from 7-legged Diametric to a 5-legged Triangle, where E ended at Aug‟13 lows.
rnative thought process, it was suspected that the development from Jan‟13 to Aug‟ 13 was a 7-legged Diametric
s shown on the chart below.
r VP‟s observational rules, all the legs, except “b”, of a 7 - legged Diametric tend tow ards time-sim i lar i ty ., by reverse logic, when legs begin to be similar in time, the structure is more likely to form as a Diametric.
s shown on the chart below, al l the up- down legs from Jan‟13 to Aug‟13, except “b”, consumed exactly 20 -25

7/27/2019 Weekly Technical Analysis 21st Oct 2013
http://slidepdf.com/reader/full/weekly-technical-analysis-21st-oct-2013 5/30
same logic, on one higher degree, we had observed all the legs, except “b”, each consumi ng about 13 s since the year „2008 .
s shown on the chart below, the fall from Jan‟08 to Mar‟09 was 13 months, and the same was labeled A of a large 7 -Diametric formation. The B leg from Mar‟09 to Nov‟10 consumed 20 months. As argued, B leg can different time-
leg (from Nov‟10 to Dec‟11) as well as D leg (from Dec‟11 to Jan‟13) maintained the time similarity, each consuming nths exactly. Under the circumstances, it was thought fit that the larger formation from „2008 onw ards to be a 7-legged tric formation.

7/27/2019 Weekly Technical Analysis 21st Oct 2013
http://slidepdf.com/reader/full/weekly-technical-analysis-21st-oct-2013 6/30
ng-term picture was published on 6 th Feb‟12.
iametr ic assum pt ion also com pared wel l wi th the 11- year formation previously seen during „1992 to „2003 .
estion, now, remains if we continue with the Diametric assumption or complete the post- „2008 development as a 5 -Triangle. As we have been explaining, we can op en possib i l i ty of ending the phase as Tr iangle only i f w e see
th above „2008 high of 21207 (Nifty 6357) .
tly, therefore, we are toy ing wi th the idea that the up - move from Aug‟13 lows is either “x” wave inside still - g Com plex Correctiv e inside E, OR its F leg of the Diametric (where E was the short est leg instead of us ual D) .
arket is b eing mov ed main ly on a/c o f FII buying heavyweights select ively , even as many stocks have beennear previous lows in the broader market.
ination of FII buying over the last five years since „2008 shows that the Sensex has not been able to cross its
high despi te addit io nal investment of 369901 crs by th e FIIs in this period.
spari ty between Sensex and broader market was shown on the comparative char t below :

7/27/2019 Weekly Technical Analysis 21st Oct 2013
http://slidepdf.com/reader/full/weekly-technical-analysis-21st-oct-2013 7/30
the Small-Cap Index broke below its Dec‟11 lows, and is now attempting to recover abov e the same, the Sensex itsel f
nd strugg l ing at the upper end of the channel shown on the fo l lowing chart :
7/27/2019 Weekly Technical Analysis 21st Oct 2013
http://slidepdf.com/reader/full/weekly-technical-analysis-21st-oct-2013 8/30
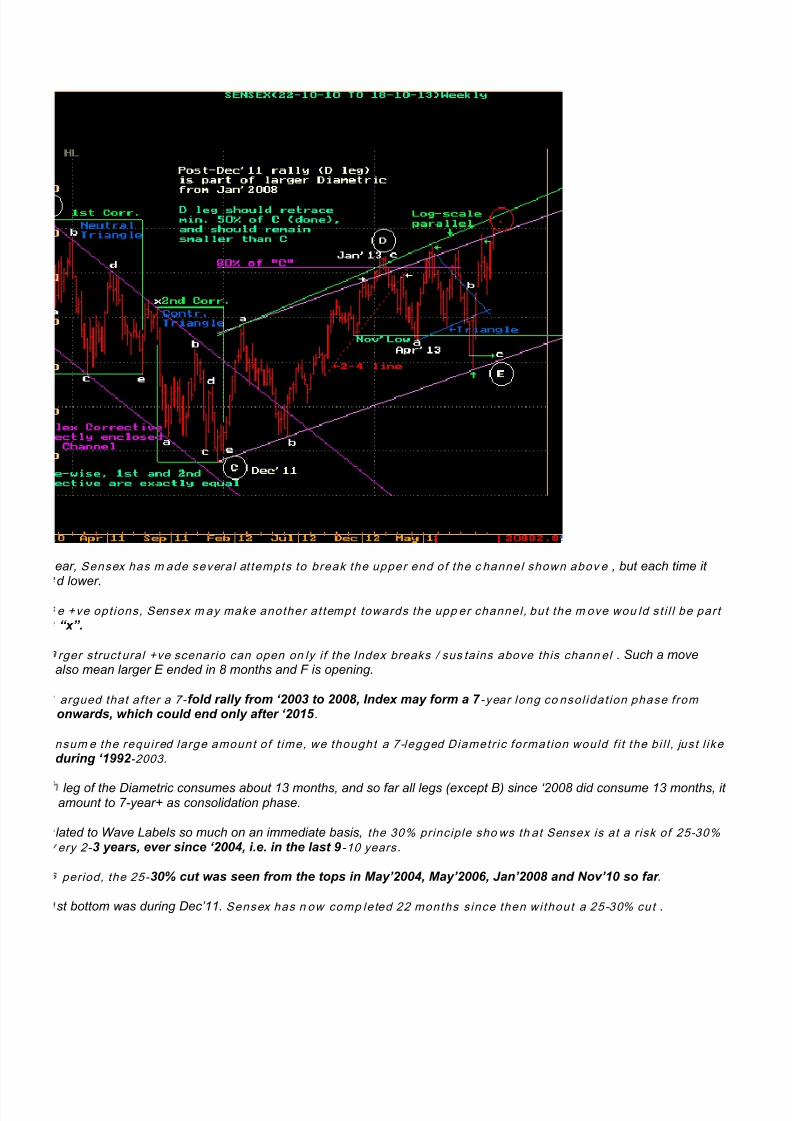
ear, Sensex has m ade severa l at tempts to break the upper end of the c hannel shown abov e , but each time it d lower.
e +ve opt ions, Sensex m ay make another at tempt towards the upp er channel , but the m ove wou ld st i l l be part
“x”.
rger struct ural +ve scenario can open on ly i f the Index breaks / sus tains above this chann el . Such a movealso mean larger E ended in 8 months and F is opening.
argued that after a 7- fold rally from „2003 to 2008, Index may form a 7 -year long co nsol idat ion phase from
onwards, which could end only after „2015 .
nsum e the requi red large amount of t ime, we thought a 7-legged Diametr ic format ion would f i t the bi l l , just l ike
during „1992 -2003 .
leg of the Diametric consumes about 13 months, and so far all legs (except B) since „2008 did consume 13 months, it amount to 7-year+ as consolidation phase.
lated to Wave Labels so much on an immediate basis, the 30% principle sho ws th at Sensex is at a risk of 25-30%
ery 2- 3 years, ever since „2004, i.e. in the last 9 -10 years .
period, the 25- 30% cut was seen from the tops in May‟2004, May‟2006, Jan‟2008 and Nov‟10 so far .
st bottom was during Dec‟11. Sensex has n ow comp leted 22 months since then wi thout a 25-30% cut .

7/27/2019 Weekly Technical Analysis 21st Oct 2013
http://slidepdf.com/reader/full/weekly-technical-analysis-21st-oct-2013 9/30
n case the Sensex opens +ve options in the short term as discussed, we should keep the 30% principle in the back
mind, and act as requi red when the t ime co mes .
ice- potential was based on the assumption that “x” would be part of a Double Three like pattern, wherein “x” can1
st corrective by 100%.
he help of different heavyweights, Sensex has been attempting to take out „2008 highs for the last five years,i led every tim e . Even during the current year, three such attempts were made, mainly with the help of ITC, but Index
e all that, the broader market has kept i tsel f sup pressed. Indeed, BSE Small-Cap and Mid-Cap Index both
d off over 30% during „2013. Further many investors‟ stocks touched „2008 lows or even lower levels. Some of thee stocks from PSU / Infrastructure virtually turned into penny stocks.
the ci rcum stances, the market does not appear runn ing away. The long-term 7-8 year consol idat ion sho uld ue in the broader market, i f not on Sensex itsel f .

7/27/2019 Weekly Technical Analysis 21st Oct 2013
http://slidepdf.com/reader/full/weekly-technical-analysis-21st-oct-2013 10/30
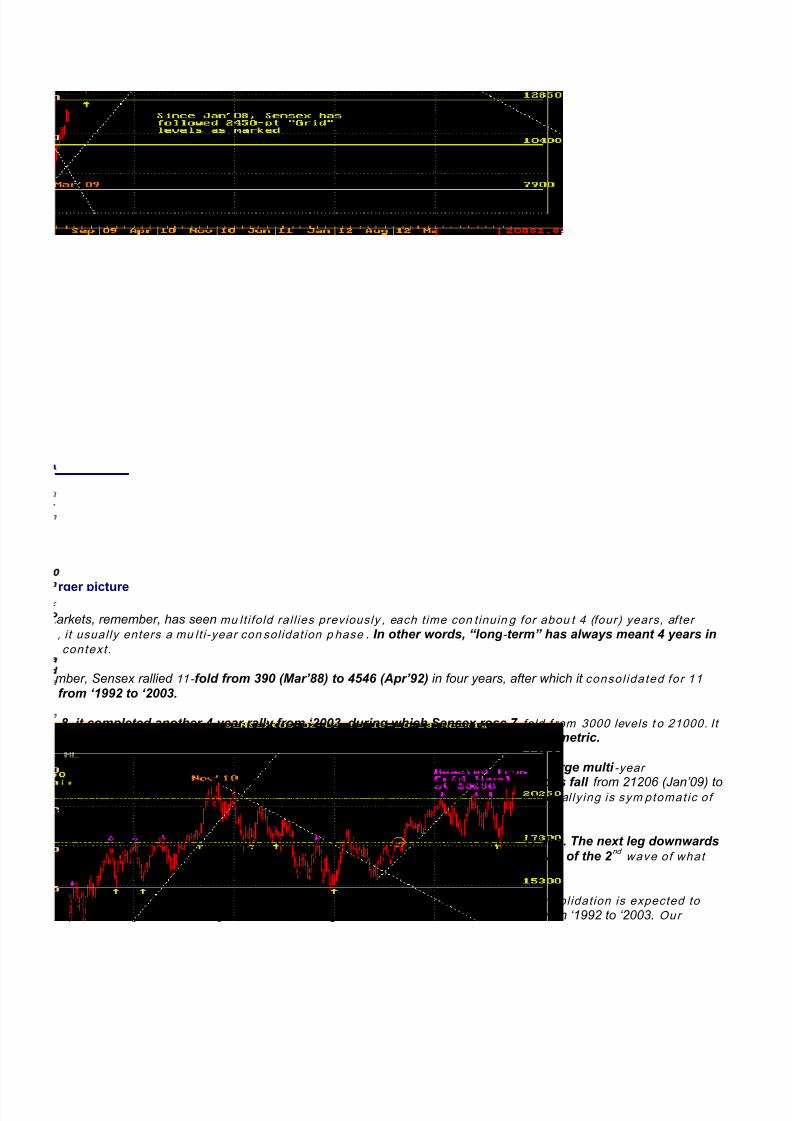
cent supportive effort was seen prot ecting th e Grid level near 17800 which was shown on the following chart. Th e e Grid is at about 20250.
Jan‟13, Sensex kept reacting lo wer from the Grid level at 20250, and later dropp ed to the lower Grid level at
. As we noted, VP‟s 2450 -po in t Gr id System, thus, cont inues to provide important turn ing po ints since the year
s suspected, the Dollar-Rupee equation keeps guiding th e movement of th e stock market. The recent high of
, at 69.23, achieved o ur pro jections made on 24 th Jun‟13.
7/27/2019 Weekly Technical Analysis 21st Oct 2013
http://slidepdf.com/reader/full/weekly-technical-analysis-21st-oct-2013 11/30
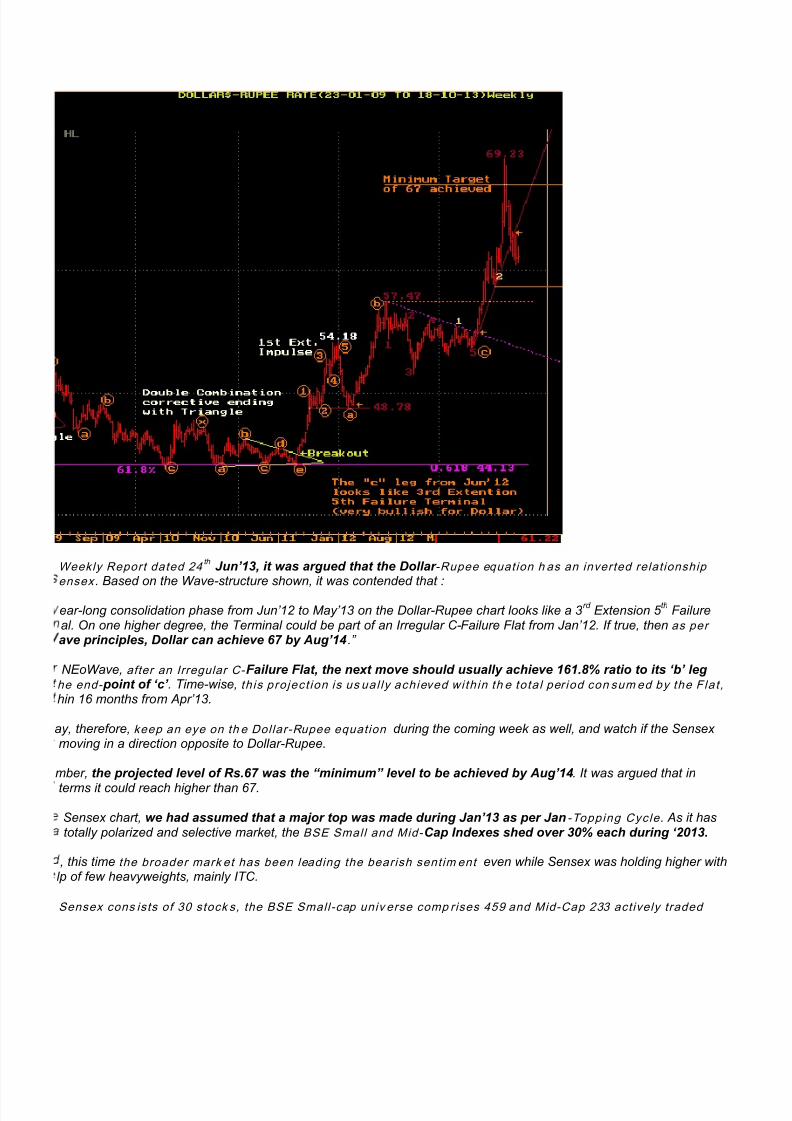
Weekly Report dated 24 th Jun‟13, it was argued that the Dollar -Rupee equation h as an inverted relationship
ensex . Based on the Wave-structure shown, it was contended that :
ear-long consolidation phase from Jun‟12 to May‟13 on the Dollar -Rupee chart looks like a 3rd
Extension 5 th
Failureal. On one higher degree, the Terminal could be part of an Irregular C-Failure Flat from Jan‟12. If true, then as per
ave principles, Dollar can achieve 67 by Aug‟14 .”
NEoWave, after an Irregular C- Failure Flat, the next move should usually achieve 161.8% ratio to its „b‟ leg he end- point of „c‟ . Time-wise, th is pro ject ion is us ual ly achieved wi th in th e tota l per iod con sum ed by the Flat , hin 16 months from Apr‟13.
ay, therefore, keep an eye on th e Dol lar-Rupee equation during the coming week as well, and watch if the Sensex moving in a direction opposite to Dollar-Rupee.
mber, the projected level of Rs.67 was the “minimum” level to be achieved by Aug‟14. It was argued that in
terms it could reach higher than 67.
Sensex chart, we had assumed that a major top was made during Jan‟13 as per Jan -Topping Cycle . As it hastotally polarized and selective market, the BSE Small and Mid- Cap Indexes shed over 30% each during „2013.
, this time the broader mark et has been leading the bearish sentim ent even while Sensex was holding higher withlp of few heavyweights, mainly ITC.
Sensex cons ists of 30 stock s, the BSE Small-cap univ erse comp rises 459 and Mid-Cap 233 actively traded

7/27/2019 Weekly Technical Analysis 21st Oct 2013
http://slidepdf.com/reader/full/weekly-technical-analysis-21st-oct-2013 12/30
s. Whi le Sensex universe m ost ly compr ise ins t i tu t iona l hold ings, broader universe affects the sm al l investor .
d already followed a cautious approach near the 6 year highs. Earli er during Jan‟13, based on the Jan-Topping (explained elsewhere in this report), we had warned of a major cycle top. Since Jan‟13, major damages weren the broader market as wel l as m any ind iv idual stocks and sectors .
Year long Diametric Formation
argued that all mul t i - fo ld ra ll ies would be fo l low ed by m ul t i -year long con sol idat ions . Sensex, remember, roseduring „1988 to „1992, but entered a 11-year consolidation thereafter.
during „2003 to „2008 it multiplied 7 times. Drawing similarity, it could a 7 -year consolidation starting „2008. Further,nsol id ation, may sh ape up l ike a 7-legged Diametric , similar to the consolidation seen from „1992 to „2003.
iametri c formation from „2008 is also suspected because each of i ts internal legs, except B, have cons umed about
nths so far. So, the E wave from Jan‟13 could also continue for about 13 months, and end somewhere around ar‟14.
ong-term picture was f is t publ ished on 6 th Feb‟2012 , with both D legs highlighted in Purple color rectangles. In the
us instance, the D leg during „1996 -97 had retraced as much as 97% of its preceding C leg. In the current instance, Dd 84% of C.
term corrective phase on Dow‟s chart from the year '2000 onwards also appears to b e a probable 7-legged

7/27/2019 Weekly Technical Analysis 21st Oct 2013
http://slidepdf.com/reader/full/weekly-technical-analysis-21st-oct-2013 13/30
t r ic . Instead of “Bow -Tie Diametric” on Sensex, Dow‟s Diametric is shaping up as “Diamond - Shaped Diametric”.
ar Topping Cycle
Dec‟12, it was pointed out that major tops occurred dur ing Jan-Mar per iod in th e last 13 years.
than half the times, the top also occurred during the month of „January . Based on this, it was argued that Sensex hit a major top during Jan‟13, and it did. Substanti al damage was, however, seen main ly i n the broader market.
ycle may be the result of NAV pop-up exercise in the last month of the Calendar Year. Jan‟13 was the 7 th such top
g in the month of „Jan.
mance of the Broader Market
roader market has, general ly, under- performed the main Index since the year „2008 , as can be checked on theelow.

7/27/2019 Weekly Technical Analysis 21st Oct 2013
http://slidepdf.com/reader/full/weekly-technical-analysis-21st-oct-2013 14/30
, the broader Mid-Cap and Small-Cap Indices have also broken 0-b lines (Red color lines) of the upward D leg. Thecap Index even broke its Jun‟12 levels, and gave a faster retracement to the “c” part of post -Dec‟11 rally.
, while the Sensex itsel f retraced 89% of i t preceding 13-mon th fall from Nov‟10 to Dec‟11, BSE Small -Cap retraced only 38.2%, and h as, in fact, reacted heavi ly from this retracem ent level.
ivergence between Sensex and broader market appears to be Index m anagement activi ty, as the Sensex is
y the Index heavy-weights, whi le the broader sho ws distr ibut ion. This who le th ing, however, made for a tr icky
ncom for tab le trad ing envi ronment.
ave Discussions
the D leg from Dec‟11 to Jan‟13, we had had assumed a 3 -legged a-b-c Flat. The “c” part was a 5 -legged Impulse,which, 5
th leg (beginning Nov‟12) was assumed to be a Terminal.
on NEoWave requirements, i t was argued that Sensex wou ld dr op below Nov‟12 lows in 50% time of the 48 -day
erminal. Index eventually did drop below Nov‟12, but took 48 day or 100% time (instead of 50%).
abundant precaution, therefore, fo l lowing al ternate wave-structure was suggested for the D leg from Dec‟11. D isompleting 161.8% time ratio to C.

7/27/2019 Weekly Technical Analysis 21st Oct 2013
http://slidepdf.com/reader/full/weekly-technical-analysis-21st-oct-2013 15/30
alternate scenario, “c” ended at Oct‟12 high, and it was equal to “a” leg. The “d” was the smallest segment, and e. post - Nov‟12 rally) was a “Double Combination” which ended in Jan‟13.
os t - Nov‟12 rally is retraced by 100% on Sensex, but more than 100% on broader indices. The larger picture of tric from „2008 onwards is, therefore, considered probable.
ould mean 13-month long D-leg has ended at Jan‟13 highs, and 13-month long E-leg started thereafter.
ave, remember, allows exceptions to rules at important market turning points or under “unusual” conditions, d of larger patterns or last wave, such as a Terminal.
Triangles and Terminals are exceptions to v irtual ly al l rules. Since Diametric pattern is made up of Triangles,
ave “Exception Rule” is also applicable to these patterns .
we were at an important turning point in Jan‟13, and dealing with Terminal and legs of Diametric, perhaps
n imp l ication ru les cou ld not be sat is f ied to the fu l l extent .
i t real ly matter whether the Sensex achieves the pattern impl ic ation accurately within th e time-price
eters, when the general direction of t he secular market has b een largely -ve as w e suspected since Dec‟12 ?
argued, the larger bear phase is already visible in the bro ader market . Since „Dec‟12 we turned cautious as thewere getting smaller (shaping into a Terminal), and also because of the „Jan-topping cycle (discussed separately).
nal we assumed from Nov‟12 to Jan‟13, is a special kind of Impulse which occurs in the last wave position, i.e.

7/27/2019 Weekly Technical Analysis 21st Oct 2013
http://slidepdf.com/reader/full/weekly-technical-analysis-21st-oct-2013 16/30
as “c” of Flat/Zigzag or 5 t
of an Impulse. Its internal structure is made up as 3-3-3-3-3, instead of usual 5-3-5-3-5.
r words, each leg of a Terminal would develop as a 3-legged o r 5- legged “corrective” structure, like a Flat,or Triangle . Also, 4
thof Terminal must enter the area covered by the 2
nd (Overlap Rule).
sim i lar to the 2-4 l ine on Sensex can also be drawn on th e broader indices, and the same has been broken (as
ssed s eparately).
x, cons umed 59 weeks to r etrace 84% of i ts p receding 13-mont h fal l , which also w as a 59-week affair , ason the chart below :
l ly, accord ingly, was cons idered slower, corrective struc ture as per NEoWave, and not as part of any fresh
annel enclosing the a-b-c Flat inside the larger D leg from Dec‟2011 onwards was shown on the chart below :

7/27/2019 Weekly Technical Analysis 21st Oct 2013
http://slidepdf.com/reader/full/weekly-technical-analysis-21st-oct-2013 17/30
0% retracement level was consid ered and m arked as a pattern impl ic ation for the 13-mo nth lon g Double
ination mo ve marked as C. Pattern impl ication s, however, cannot be str ict ly enforced for th e legs of Triangle
iametr ic, which are exceptions t o the general rules.
NEoWave, most channeled moves enclose a Complex Corrective structure involving “x” wave. Complex Correct ive
ing 2 correctives, joined by one “x” wave, is called a Double Combination, and carries a pattern implication of ore than about 80%.
hat the C leg of Sensex, from Nov‟10 to Dec‟11, was a Double Combination, with two equal -sized co rrectives eekly chart given abo ve), and therefore, carr ied a pattern imp l ication of 80% retracement by the D leg.
r, as depicted on the chart below, since Nov‟10, it has been generally useful to consider 61.8% to 80%ement area as crucial for terminating m oves .

7/27/2019 Weekly Technical Analysis 21st Oct 2013
http://slidepdf.com/reader/full/weekly-technical-analysis-21st-oct-2013 18/30
Wave Theory, Flat is a 3-legged corrective pattern marked as a-b-c, where “b” corrects more than 61.8% of “a”. It is3-3-5 pattern where “a” and “b” carry corrective label of :3, and “c” is an impulse label of :5.
d a Flat, we usually draw a line joining “0” and “b” (0 -b line), and take a parallel from the “a” point. The “c” leg should lly end near such parallel. The channel indic ates simi lar i ty of i ts 3 internal legs, reason w hy Flats are cal led
“c” of D (beginning Jun‟12) for Sensex, we were expecting a 5 - legged Impu lse, because Flat is a 3-3-5 re.
NEoWave “Extension rule”, one of the directional leg inside an Impulse should get “extended”, i.e. achieve 161.8%the next largest leg.
1st
and 3rd
were “normal”, we could have projected 5 th
wave Extension. However, such a move would project valuesabove the Nov‟10 highs, which would jeopardize the larger assumption of “Bow -Tie” shaped Diametric from „200 8
ds.
erefore, preferred 5 th of “c” not to achieve 161.8% ratio, but terminate below Nov‟10 highs, from where a
ward E would open. Since E begins the “expanding” phase of the Bow -Tie Diametric, it would break below Dec‟11
t and 3
rd inside “c” of D continued for about 4-5 weeks each. We expected 5
thto consume a similar time, and end
here in the month of Dec‟12 or near to it.
7/27/2019 Weekly Technical Analysis 21st Oct 2013
http://slidepdf.com/reader/full/weekly-technical-analysis-21st-oct-2013 19/30
beginn ing part of 5 th shows vio lence on upside, we suspected 5
th cou ld develop internal ly as a 1
st Extension
se or Terminal. Since a “Terminal” always occurs at major turning point, it would be able to generate the necessary ide power for the larger E leg.
7- legged “Bow - Tie” shaped Diametric from „2008, one can see a reduction i n magni tude from A leg to D leg.
leg is the sm al lest segment of the Bow -Tie shaped Diametr ic .
ther half of this Diametric, i .e. E-F-G legs, should sh ow expand ing m agnitud es , and therefore, E should become
than the D leg. This can h appen only when E breaks the bottom Dec‟2011.
reaking the 13-month long channeled C (from Nov‟10 to Dec‟11), we had suspected that development post Dec‟11otential only to be marked as D leg of a much larger Triangle or Diametric from „2008.
ption was preferable because C leg from Nov‟10 was not an Impulse. A Non-impulsive C leg could only be part of r Triangle or Diametric.
ollex-30 Index
hile, since the FII activity turned a prominent factor in the Indian stock market, we examined the development of BSE
-30 Index, which sh ow ed a Head & Shoulders formation around Oct‟12 on its Daily chart.
nsides later achieved the Head-to-Neckl ine projection on dow nside , as we expected. Since the projection level atched with i ts 200-day EMA, we sus pected som e pul l - back. It did pull back till Jan‟13.
dex achieved H& S protection and has now recovered above its 200-day EMA.

7/27/2019 Weekly Technical Analysis 21st Oct 2013
http://slidepdf.com/reader/full/weekly-technical-analysis-21st-oct-2013 20/30
lows
x has broken „2010 low of 15652, and now in „2012 is found holding the „2011 low of 15136.
past instances would sho w, once the year ly low gets brok en, a min imum of 20% cut from the low has been a
phenom enon, thoug h gradual ly. A 20% magnitu de reduced from 15652 wo uld calculate to abou t 12500 for
x .
evel has not b een touc hed so far , but should b e remembered as a crucia l leve l which m atches wi th the huge
p action (refer to the Weekly chart disc ussin g 32- week cycle) seen during the „2009.

7/27/2019 Weekly Technical Analysis 21st Oct 2013
http://slidepdf.com/reader/full/weekly-technical-analysis-21st-oct-2013 21/30
ek time cycle
evelopment since Mar‟09 has followed a 32 -week time cycle , as shown on the chart below.

7/27/2019 Weekly Technical Analysis 21st Oct 2013
http://slidepdf.com/reader/full/weekly-technical-analysis-21st-oct-2013 22/30
as used for ra is ing a possib i l i ty that an impo rtant low would be formed around 20 th Aug‟11. Sensex
nded by hi t t ing the bottom on 26 th Aug.
yc le had also ra ised the possib i l i ty of an upw ard/s ideways phase that could survive for 32 weeks from Aug‟11,nd ei ther on 4
th Feb‟12 or 31
st Mar‟12, developing as a ranged movement like the Left Shoulder. The upward
ended during Feb‟12 as per this cycle.
by the structural possibilities from this cycle, it was suspected that Sensex could be forming an “e” leg of able Extracting Triangle, which would remain smaller than the “c” leg. The “e” leg did remain smaller ascted.
already know, Extract ing Tr iangle is a pattern w hich sho ws smal ler ral l ies and bigg er drops. Thus in oneon, it shows e < c < a, and in the opposite direction, it shows d > b.
18000, Right Shoul der became bigger that the Left Should er, wh ich appeared rejecting the Head & sho ulders
tracting Triangle” argument. However, the 32 -week time cycle may remain val id as a cycle even from here.
ensex was seen testing the “Neckline” shown on the chart, which did prove crucial, as Sensex bounced al times from t he Neckl ine.
er idea wo uld be to m ark the entire developm ent as a Diametric, instead of Extracting Triangle, and the same
marked on the chart . These assumpt ions ind icate an incom plete B, but co nf i rms on ly on faster drop below
ckl ine, which is s ti l l awaited.
7/27/2019 Weekly Technical Analysis 21st Oct 2013
http://slidepdf.com/reader/full/weekly-technical-analysis-21st-oct-2013 23/30
t recovery happens to b e exactly at 32-week cycle turning po int.
rinciple
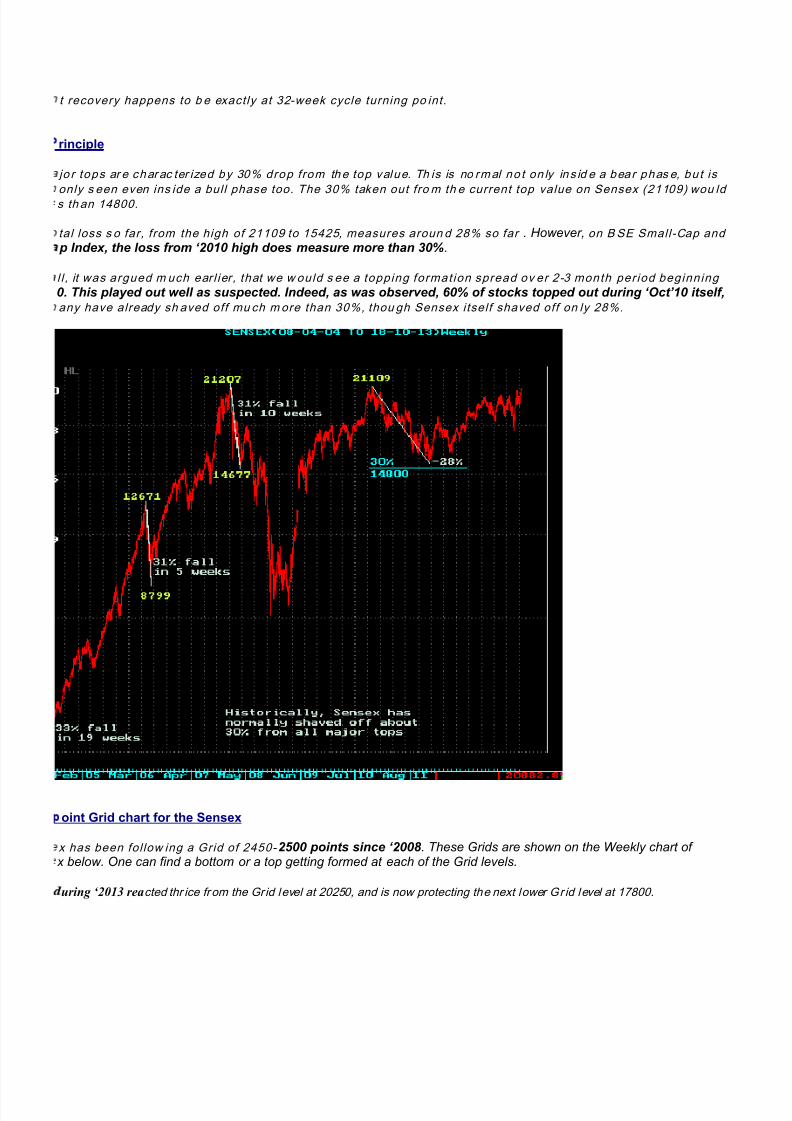
jo r tops ar e char ac ter ized by 30% drop from the top value. Th is is no rmal no t on ly ins id e a bear phas e, bu t is
only s een even ins ide a bul l phase too. The 30% taken out fro m th e current top value on Sensex (21109) wou ld
s th an 14800.
tal loss s o far, from the high of 21109 to 15425, measures aroun d 28% so far . However, on B SE Small-Cap and
p Index, the loss from „2010 high does measure more than 30%.
l l , it was argued m uch ear l ier , that we w ould s ee a topping format ion spread ov er 2-3 month per iod beginn ing
0. This played out well as suspected. Indeed, as was observed, 60% of stocks topped out during „Oct‟10 itself,any have already sh aved off mu ch more than 30%, thou gh Sensex itsel f shaved off on ly 28%.
oint Grid chart for the Sensex
x has been fol low ing a Grid of 2450- 2500 points since „2008 . These Grids are shown on the Weekly chart of x below. One can find a bottom or a top getting formed at each of the Grid levels.
uring ‘2013 reacted thr ice from the Grid level at 20250, and is now protecting the next lower Gr id level at 17800.
7/27/2019 Weekly Technical Analysis 21st Oct 2013
http://slidepdf.com/reader/full/weekly-technical-analysis-21st-oct-2013 24/30
rger picture
arkets, remember, has seen mu lti fo ld ral l ies previously , each time con tinuin g for abou t 4 (four) years, after
, i t usual ly enters a mu lt i -year con sol idation p hase . In other words, “long - term” has always meant 4 years incontext .
mber, Sensex rallied 11- fold from 390 (Mar‟88) to 4546 (Apr‟92) in four years, after which it consol idated for 11 from „1992 to „2003.
8, it completed another 4- year rally from „2003, during which Sensex rose 7 -fold f rom 3000 levels t o 21000. It
ow consolidate for 7 year, beginning „2008, preferably forming as a Triangle or Diametric.
plained that the 14-mo nth fall from Jan‟08 was a Triple Combination “A” leg of a large multi -year
lidation. The corrective phase beginning Mar‟09 retraced about 99% of the previous fall from 21206 (Jan‟09) toMar‟09), (which was labeled as a Triple Combination). The longer t ime requi red w hi le ral ly ing is sym ptomat ic of
rrective label of “B”.
lly from 8047 (actually beginning at 8867) was, therefore, considered as the “B” leg. The next leg downwardsbe labeled as “C”. Such a-b-c developm ent since Jan ‟08 would be considered part of the 2
nd wave of what
rs as a probable Terminal beginning „2003.
though we saw the market reaching levels above Jan‟08 highs, the multi -year cons ol idation is expected to up l ik e a large decade-long Diametric , looking similar to the consolidation we saw from „1992 to „2003. Our
7/27/2019 Weekly Technical Analysis 21st Oct 2013
http://slidepdf.com/reader/full/weekly-technical-analysis-21st-oct-2013 25/30
g/ investment stra teg ies should b e designed accord ing ly .
uspected corrective phase beginning Jan‟08 would be the 2 nd
wave with in the larger 5 th wave. This 5
thwave is
cted to be forming as a Terminal due to absence of impuls ive behavior in i ts in terna l 1 st wave . The “Terminal”
s when the Sensex drops below the 2-4 line of one higher degree.
ay see the Yearly chart in Appendix, which shows the 2-4 line and its values for the next three years. Remember,nal developm ent usu al ly violates the 2-4 l ine.
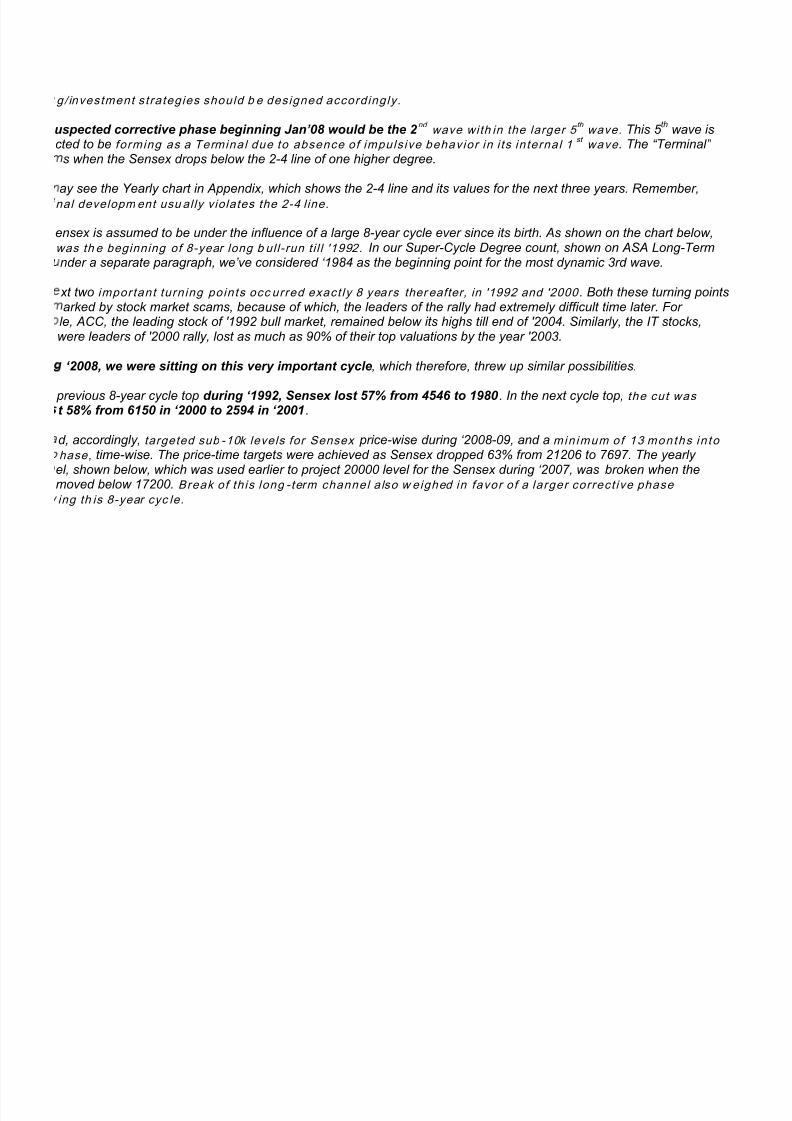
ensex is assumed to be under the influence of a large 8-year cycle ever since its birth. As shown on the chart below,was th e beginning of 8-year long b ul l -run ti l l '1992. In our Super-Cycle Degree count, shown on ASA Long-Termnder a separate paragraph, we‟ve considered „1984 as the beginning point for the most dynamic 3rd wave.
xt two important turn ing points occ urred exact ly 8 years ther eafter, in '1992 and '2000 . Both these turning pointsarked by stock market scams, because of which, the leaders of the rally had extremely difficult time later. For
le, ACC, the leading stock of '1992 bull market, remained below its highs till end of '2004. Similarly, the IT stocks,were leaders of '2000 rally, lost as much as 90% of their top valuations by the year '2003.
„2008, we were sitting on this very important cycle, which therefore, threw up similar possibilities.
previous 8-year cycle top during „1992, Sensex lost 57% from 4546 to 1980 . In the next cycle top, the cut was t 58% from 6150 in „2000 to 2594 in „2001 .
d, accordingly, targeted sub -10k levels for Sensex price-wise during „2008 -09, and a min imum of 13 months in to
hase, time-wise. The price-time targets were achieved as Sensex dropped 63% from 21206 to 7697. The yearly el, shown below, which was used earlier to project 20000 level for the Sensex during „2007, was broken when themoved below 17200. Break of th is long - term channel a lso w eighed in favor of a larger correct ive phase
ing th is 8-year cyc le.

7/27/2019 Weekly Technical Analysis 21st Oct 2013
http://slidepdf.com/reader/full/weekly-technical-analysis-21st-oct-2013 26/30
dix : Super-Cycle-degree Wave-scenarios f or Sensex
per-Cycle-Degree wave-scenario, consider following ASA Long-Term Index. This Index has been created by ning a very old Index compiled by a British advisor (from '1938 to '1945), with RBI Index ('1945 to '1969), F.E Index to '1980) and Sensex (thereafter till date).

7/27/2019 Weekly Technical Analysis 21st Oct 2013
http://slidepdf.com/reader/full/weekly-technical-analysis-21st-oct-2013 27/30
ave-count presented shows that the market is into the lower-degree 5th of the SC-degree 3rd
or 5 th
wave.
tailed wave-count from „1984 onwards can be seen on the Monthly chart given below. The 2 -4 line shown on the ASArm Chart above, and Monthly chart below, would determine if the post „1984 Impulse is a Super -cycle-degree 3
rd or

7/27/2019 Weekly Technical Analysis 21st Oct 2013
http://slidepdf.com/reader/full/weekly-technical-analysis-21st-oct-2013 28/30
-Cycle-Degree 3rd
(or 5 th ) began since Nov‟84. Its internal 3
rd was an “extended” leg, which achieved exactly 261.8%
the 1st
on log scale. The Sensex is now forming the 5 th Wave, and the same could develop as a ”Terminal”, because
er-degree 1st wave from May‟03 onwards developed as a Diametric (which is a “corrective” structure, rather than anse”). Within the non-directional legs, 2nd was exactly 61.8% of 1st value-wise, and 161.8% time-wise. The 4th wasof 3rd value-wise, and 261.8% time-wise.
the 4th
is shown as a 3-legged a-b-c Flat on the monthly chart above. Alternatively, the 4th
is shown as a 7-legged a-b-f-g Bow-Tie Diametric on the Monthly chart below. The chart below also shows 11-year parallel channel from Apr'1992 '2003. As shown, if one projects the width of this channel on upper side, such a projection gave 20000 as theum” target. This forecast was achieved.

7/27/2019 Weekly Technical Analysis 21st Oct 2013
http://slidepdf.com/reader/full/weekly-technical-analysis-21st-oct-2013 29/30
.
ntioned above, the lower-degree 1st from May‟2003 to Jan‟2008 appears to be a Bow -Tie Diametric, marked as a-b-c-
. It is called "Diametric" because it combines two Triangular patterns, one initially “Contracting” up to the "d" leg,d by an “Expanding” one. The contraction point is the "d" leg, and the legs on either sides of it tend to be Accordingly, "c" and "e" were equal in "log scale", both showing about 60% gains. Similarly, "g" was equal to "a", bothg about 115% gain.
iametric development from „2003 to „2008 is considered to be the 1st wave of the Impuse. Due to the co rrectivere in the 1
st leg, the higher-degree 5
th could be developing as a Terminal. Since „2008, we are into its 2nd wave, which
continue to develop over a period of 7-8 years beginning „2008.

7/27/2019 Weekly Technical Analysis 21st Oct 2013
http://slidepdf.com/reader/full/weekly-technical-analysis-21st-oct-2013 30/30
NEoWave, break of 2-4 line confirms a Terminal development, and If the 5 th
proves to be a Terminal, the Super-degree label of 3
rd will have to change to 5
th, because only a 5
thof a 3
rd cannot be a Terminal. Only a 5
thof the 5
thcan
erminal. The Super-Cycle-Degree marking for 1st and 2 nd as shown on ASA long-term chart, would then change to 3 rd h
respectively.